


-
Multicore fibres (MCFs) are promising next-generation communication carriers owing to their space division multiplexing (SDM) characteristics1–4; thus, they are widely used in high-capacity data communication5,6 and high-precision measurements7–9. These fibres comprise multiple cores arranged in a geometrically symmetrical pattern within a single cladding to minimize inter-core crosstalk10,11. The core distribution positioning during fibre processing, such as fibre splicing12,13, bundle fan-in/fan-out14,15, mode coupling16,17, writing grating18,19, and fibre drawing20,21, must be precise as it determines the working performance, including loss and response. In the case of fibre splicing, bundle fan-in/fan-out, and mode coupling, precise core alignment minimizes loss, thereby significantly improving the quality and capacity of the transmitted signal22. Further, fibre Bragg gratings (FBGs)19 require precise core location to improve the accuracy and repeatability in positioning the grating writing position. Fibre drawing requires effective online monitoring to minimise fibre twisting and stabilise product quality.
Recently, the end-view inspection method (End-View, EV)23,24 has been applied to commercial fusion splicers that require fibre cutting; hence, it cannot obtain internal information along the fibre extension direction without destroying it. Side-view methods, such as digital holographic25–27, optical tomography28, polarisation observation by lens-effect-tracing (POL)29, profile alignment system (PAS)30, and pattern of scattering31, perform measurements from the side of the fibre. Digital holographic and optical tomography systems are accurate but complex and time-consuming; hence, they are rarely used for real-time monitoring. POL and PAS are used in commercial fusion splicers for polarisation-maintaining fibres and are effective for some specific angles of MCFs32. However, the scalar light Gaussian beam is affected by light scattering, image contrast is lower, and achievable measurement accuracy is limited. Recently, Bessel beams33 have found application in various types of processing34–36 and imaging37,38. The self-healing and nondiffractive39,40 properties of Bessel beams are utilised to provide a longer focus depth while transmitting through a scattering medium41,42. Furthermore, Bessel beams exhibit a unique effect when propagating in a spatially varying refractive index medium at off-axis positions43. Thus, Bessel beam illumination can be utilised to improve the imaging contrast of the internal structures of optical fibres.
In this study, a high-precision and nondestructive measurement method based on Bessel beam illumination was proposed to obtain the internal core distribution of an MCF. Herein, theoretical and experimental Bessel beam transmission images were obtained, and the correlation coefficients were calculated to determine the precision, which was further improved using deep learning. The proposed Bessel-beam-based method can provide sufficient information for measuring the internal core distribution of a seven-core fibre with high precision, accuracy, and robustness. The proposed method can be applied to various tasks requiring fibre core distribution, and can potentially measure the more complex internal structures of MCFs and photonic crystal fibres (PCFs).
-
The experimental setup of this study is illustrated in Fig. 1a. In brief, a laser beam with a wavelength λ of 650 nm was emitted from the light source and expanded using a telescope comprising lenses L1 (f = 50 mm) and L2 (f = 75 mm). A conical lens, L3, with an inclination angle α of 5° was employed to transform the Gaussian beam into a Bessel beam. The 4f system comprised a lens L4 (f = 50 mm) and a 20× objective lens (NA = 0.4), and it was placed in a suitable position to focus the laser, thus providing a dense Bessel beam pattern, as shown in Fig. 1b. Next, the seven-core fibre was introduced into the optical path and placed slightly off-axis as the Bessel beam was transmitted through the fibre. The resultant transmission pattern, as shown in Fig. 1c, was captured using an objective lens (50×, NA = 0.42) and CMOS-1 camera. Note that the experimental pattern is similar to the simulated pattern shown in Fig. 1c. For the experiment, a commercial MCF (YOFC) with a core diameter of 8 μm, core spacing of 41.5 μm, and cladding diameter of 150 μm was employed. A self-designed, high-precision, electronically controlled optical fibre rotation apparatus was built; this apparatus enables the rotation of a fibre with a minimum rotation step of 0.075° while minimising the self-twisting of the fibre. White light was injected into the MCF at fibre end-face A, and a fibre core distribution pattern was obtained at fibre end-face B. The fibre core distribution image was captured using an objective lens (40×, NA = 0.6) camera (CMOS-2) to map the transmission pattern to the corresponding core distribution, as shown in Fig. 1d. The distance between the laser beam transmitted position and end-face of the fibre was restricted at 150 µm.
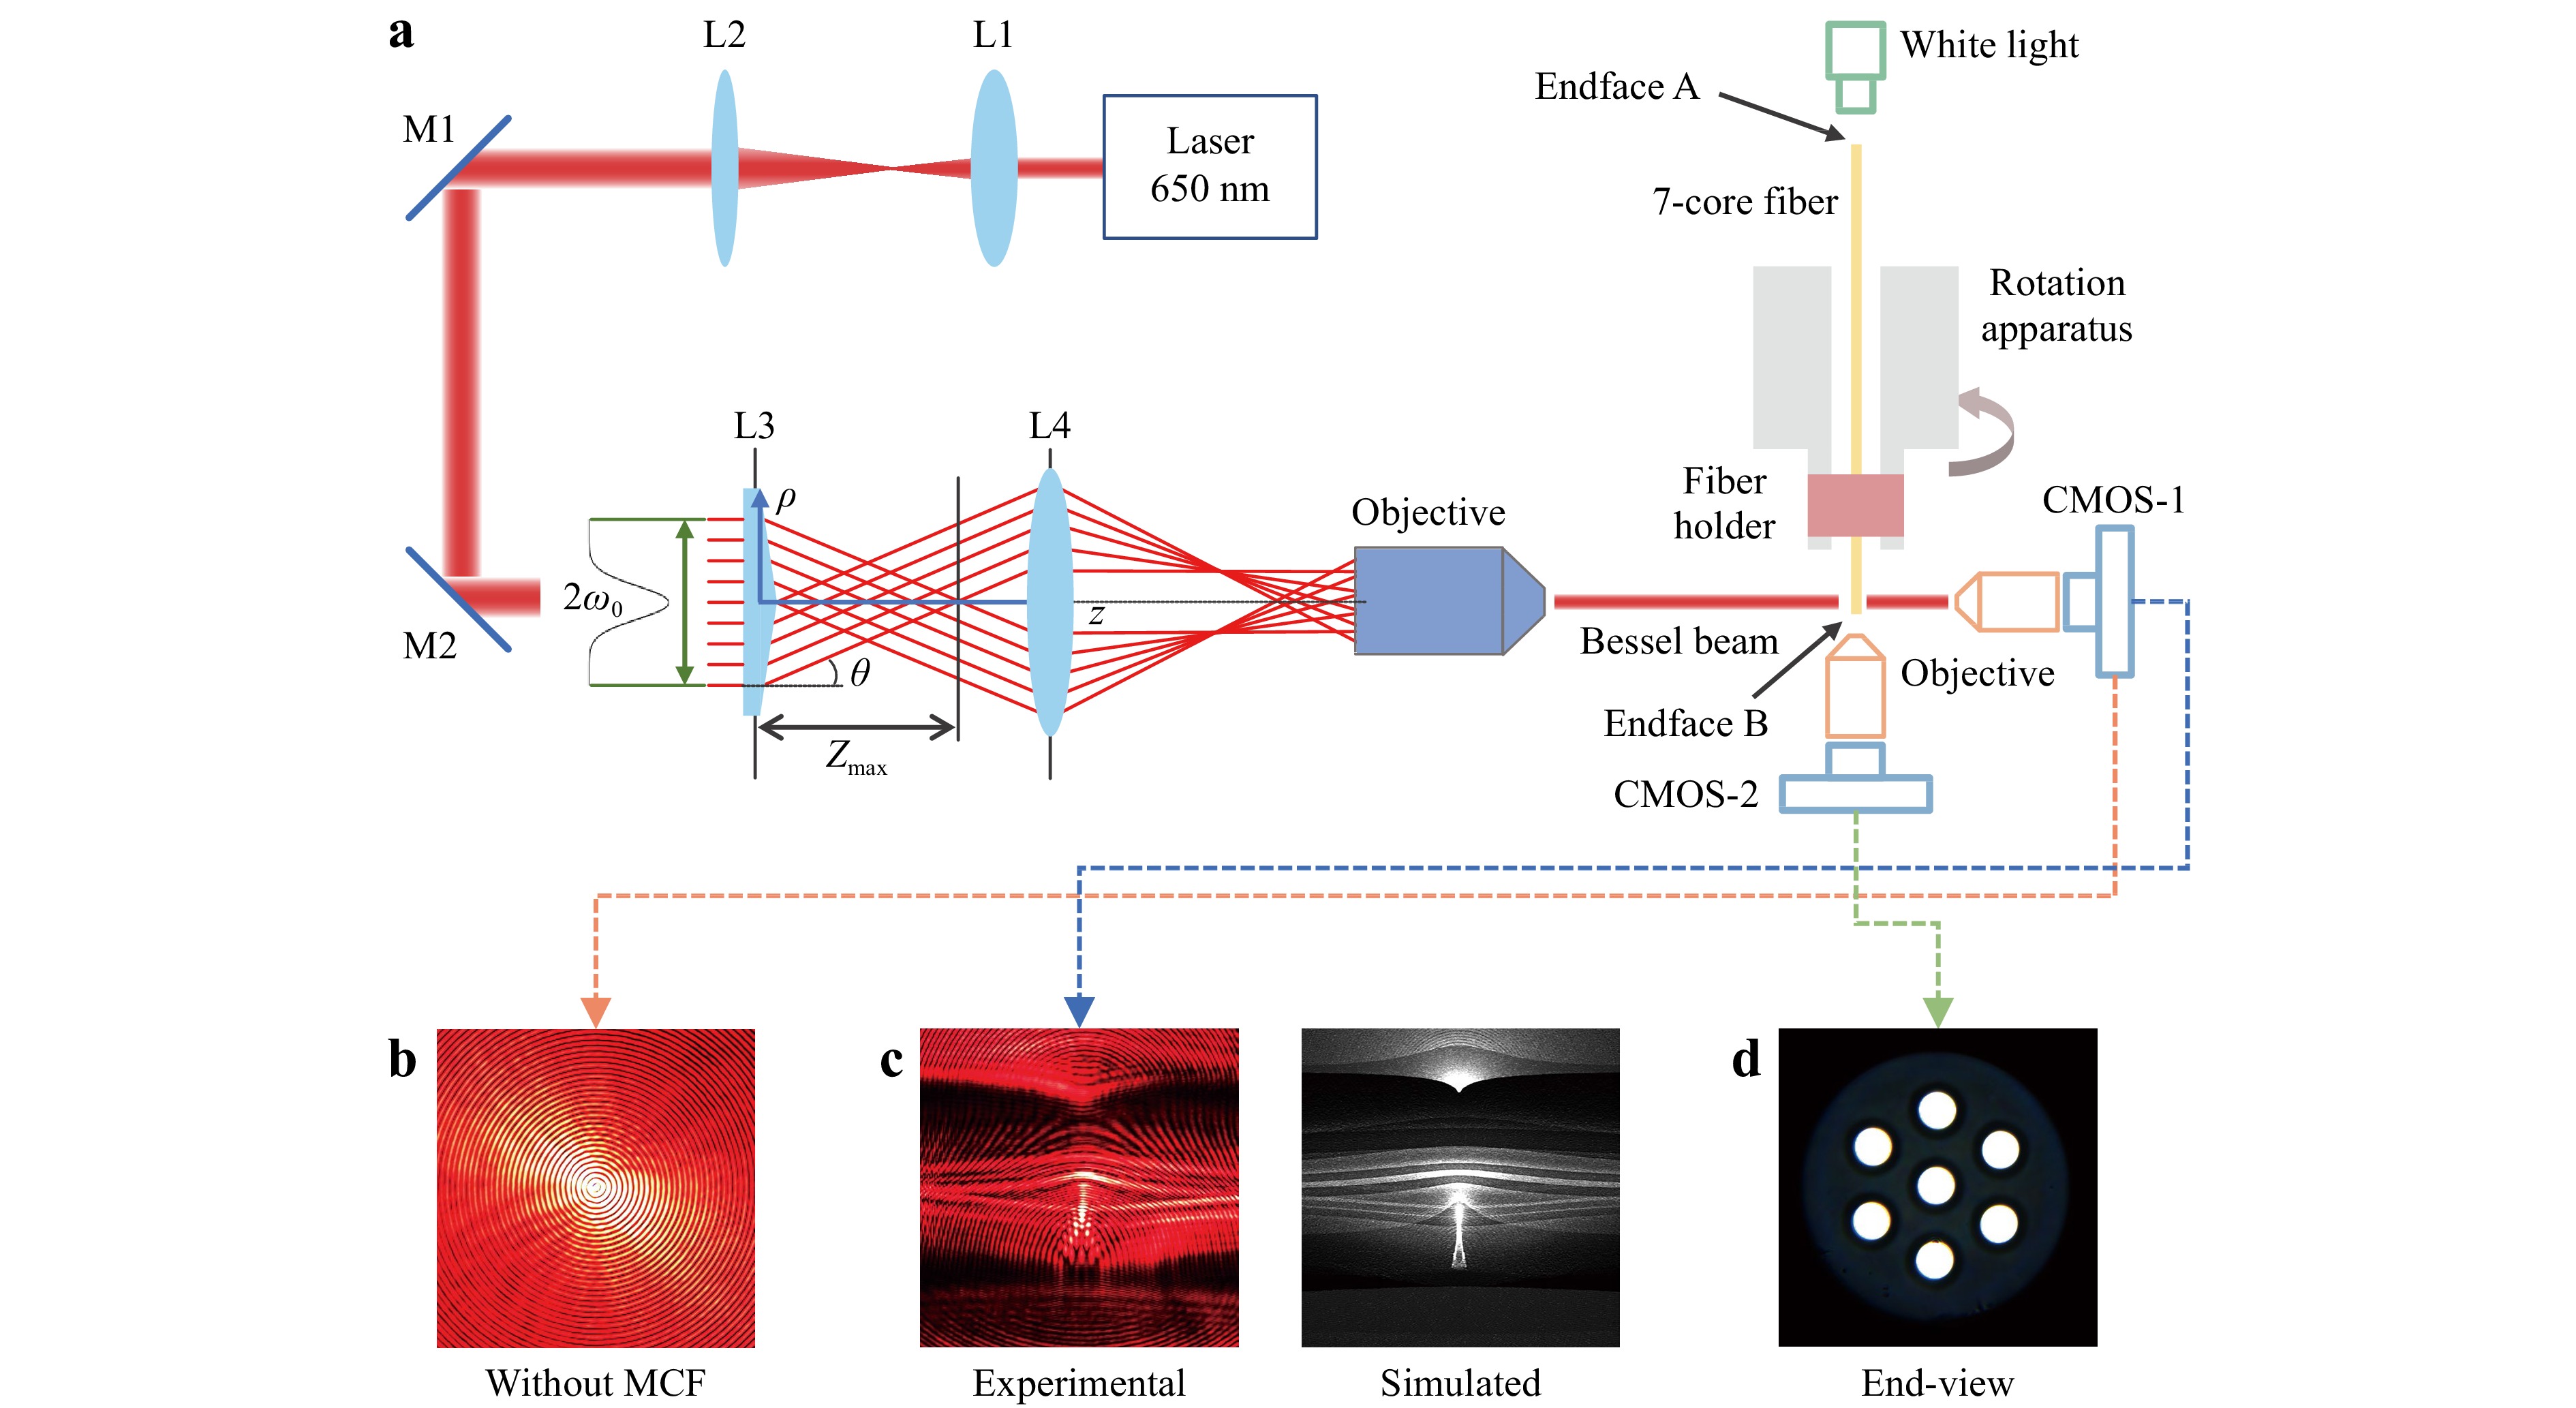
Fig. 1 Experimental setup. a Converting a Gaussian beam into Bessel beam using a cone lens and by focusing the laser using a 4f system. The high-precision optical fibre rotation apparatus and image capture devices are used to control fibre rotation and image acquisition. b Bessel beam pattern generated using a cone lens and captured by CMOS-1. c Experimental and simulated pattern of a Bessel beam transmitted through a seven-core fibre. d Seven-core fibre core distribution; here, a light-emitting diode point light source propagates white light at the fibre end-face A, and the core distribution image is captured at fibre end-face B.
The correlation that exists between the specific transmission pattern and corresponding fibre core distribution can be established using the Pearson correlation coefficient44,45, which evaluates the similarity between the reference and measured patterns. Herein, the calculation of the correlation coefficient was extended in two dimensions, as follows.
$${\rho }_{d}\left(X,{Y}_{d}\right)=\frac{1}{\left(M\times N-1\right)}\sum _{i=1}^{M}\sum _{j=1}^{N}\left(\frac{\left({X}_{i,j}-{\mu }_{X}\right)\left({Y}_{d,i,j}-{\mu }_{{Y}_{d}}\right)}{{\sigma }_{X}{\sigma }_{Yd}}\right) $$ (1) where X is the measured 2D pattern corresponding to a 2D data matrix, with values ranging from 0 to 255; $ {X}_{i,j} $ is the pixel point in row i and column j of the X pattern; $ {Y}_{d} $ represents the d-th reference pattern obtained from the reference dataset; and $ {Y}_{d,i,j} $ is the pixel point in row i and column j of the $ {Y}_{d} $ pattern. Note that the variables $ \,{\mu }_{X},\;{\mu }_{{Y}_{d}} $ and $ {\sigma }_{X},\;{\sigma }_{Yd} $ can be calculated using X and $ {Y}_{d} $, which represent the mean and standard deviations, respectively. A single pattern consists of M rows and N columns, and each measured X pattern returns a parameter $\, {\rho }_{d} $, which reflects the similarity to the d-th reference patterns. The most similar pattern returns the maximum $\, \rho $ value. Thus, a connection between the measured pattern and d-th fibre core distribution with the highest Pearson correlation coefficient can be established. Because the cores of a seven-core fibre are arranged based on the vertex and centre of a regular hexagon, the measured core distribution angle can be simplified to 0°–60°.
-
The simulation results in Fig. 2a–c show the transmission pattern of a slightly off-axis MFC using Bessel-beam illumination, which produces a pattern with higher contrast and greater information on the core distribution compared with a Gaussian beam. To explore the causes of light intensity variation in the transmission pattern of the seven-core fibre and the core distribution information contained in the pattern, the cores were placed at different locations within the fibre, and the corresponding transmission patterns were simulated, as shown in Fig. 2a, b. Among these four sets of transmission patterns, three had a core set rotating by 80°, 160°, and 240° clockwise, whereas the remaining was a fibre without a core, for comparison. Evidently, the transmission pattern of the core rotated by 160° was almost identical to that of the coreless fibre. Furthermore, the core was visible in the transmission patterns of the sets with 80° and 240° core rotations, thus indicating that the core could be imaged only when it was within a fraction of the rotation angle. In particular, the pattern of a Bessel beam transmitting a single core had two separate refractive paths, up and down, which were bent outward at the centre, and possessed position-dependent and asymmetric bending curvatures. Note that this effect occurs only when the fibre is placed slightly off axis. A potential advantage of this phenomenon is that when multiple cores are simultaneously present, the transmission pattern of each core can be effectively separated because the cores at different positions have two different refraction paths. The self-healing property of the Bessel beam increases the depth of focus while reducing the scattering blur caused by the core structure. This results in a higher-contrast transmission pattern when used as the illumination light, which provides a clearer pattern for the core distribution measurement. By contrast, when a Gaussian beam is transmitted through a fibre with multiple cores, light scattering from the core structure blurs the image. Additionally, the transmission patterns of the different cores overlap, thus producing a slightly unclear transition area between the cores and background, which results in a decrease in the overall contrast of the pattern, as shown in Fig. 2c. Thus, the transmission pattern of a Bessel beam contains more varying and clearer core distribution information compared with a Gaussian beam when an MCF is rotated because a Bessel beam has two core refractive paths that affect the transmission pattern, whereas a Gaussian beam has only one path. Furthermore, herein, various optical fibres were simulated to verify the stability of the method by varying the fibre diameter and core number of fibre (four-core fibre with a diameter of 125 µm, four-core fibre with a diameter of 150 µm, and 10-core fibre with a diameter of 150 µm). Evidently, the proposed method based on Bessel beam illumination still produced a higher-contrast transmission pattern compared with the Gaussian beam method, as detailed in Supplementary Information (section 1). Further, to test extreme situations of fibre with excessively large or small diameters, the fibre diameters were set to 100 and 450 µm to verify the stability of the method; evidently, both the cores in the fibres with diameters of 100 and 450 µm exhibited a high-contrast pattern similar to that of the fibre with a diameter of 150 µm (Supplementary Information, section 2).
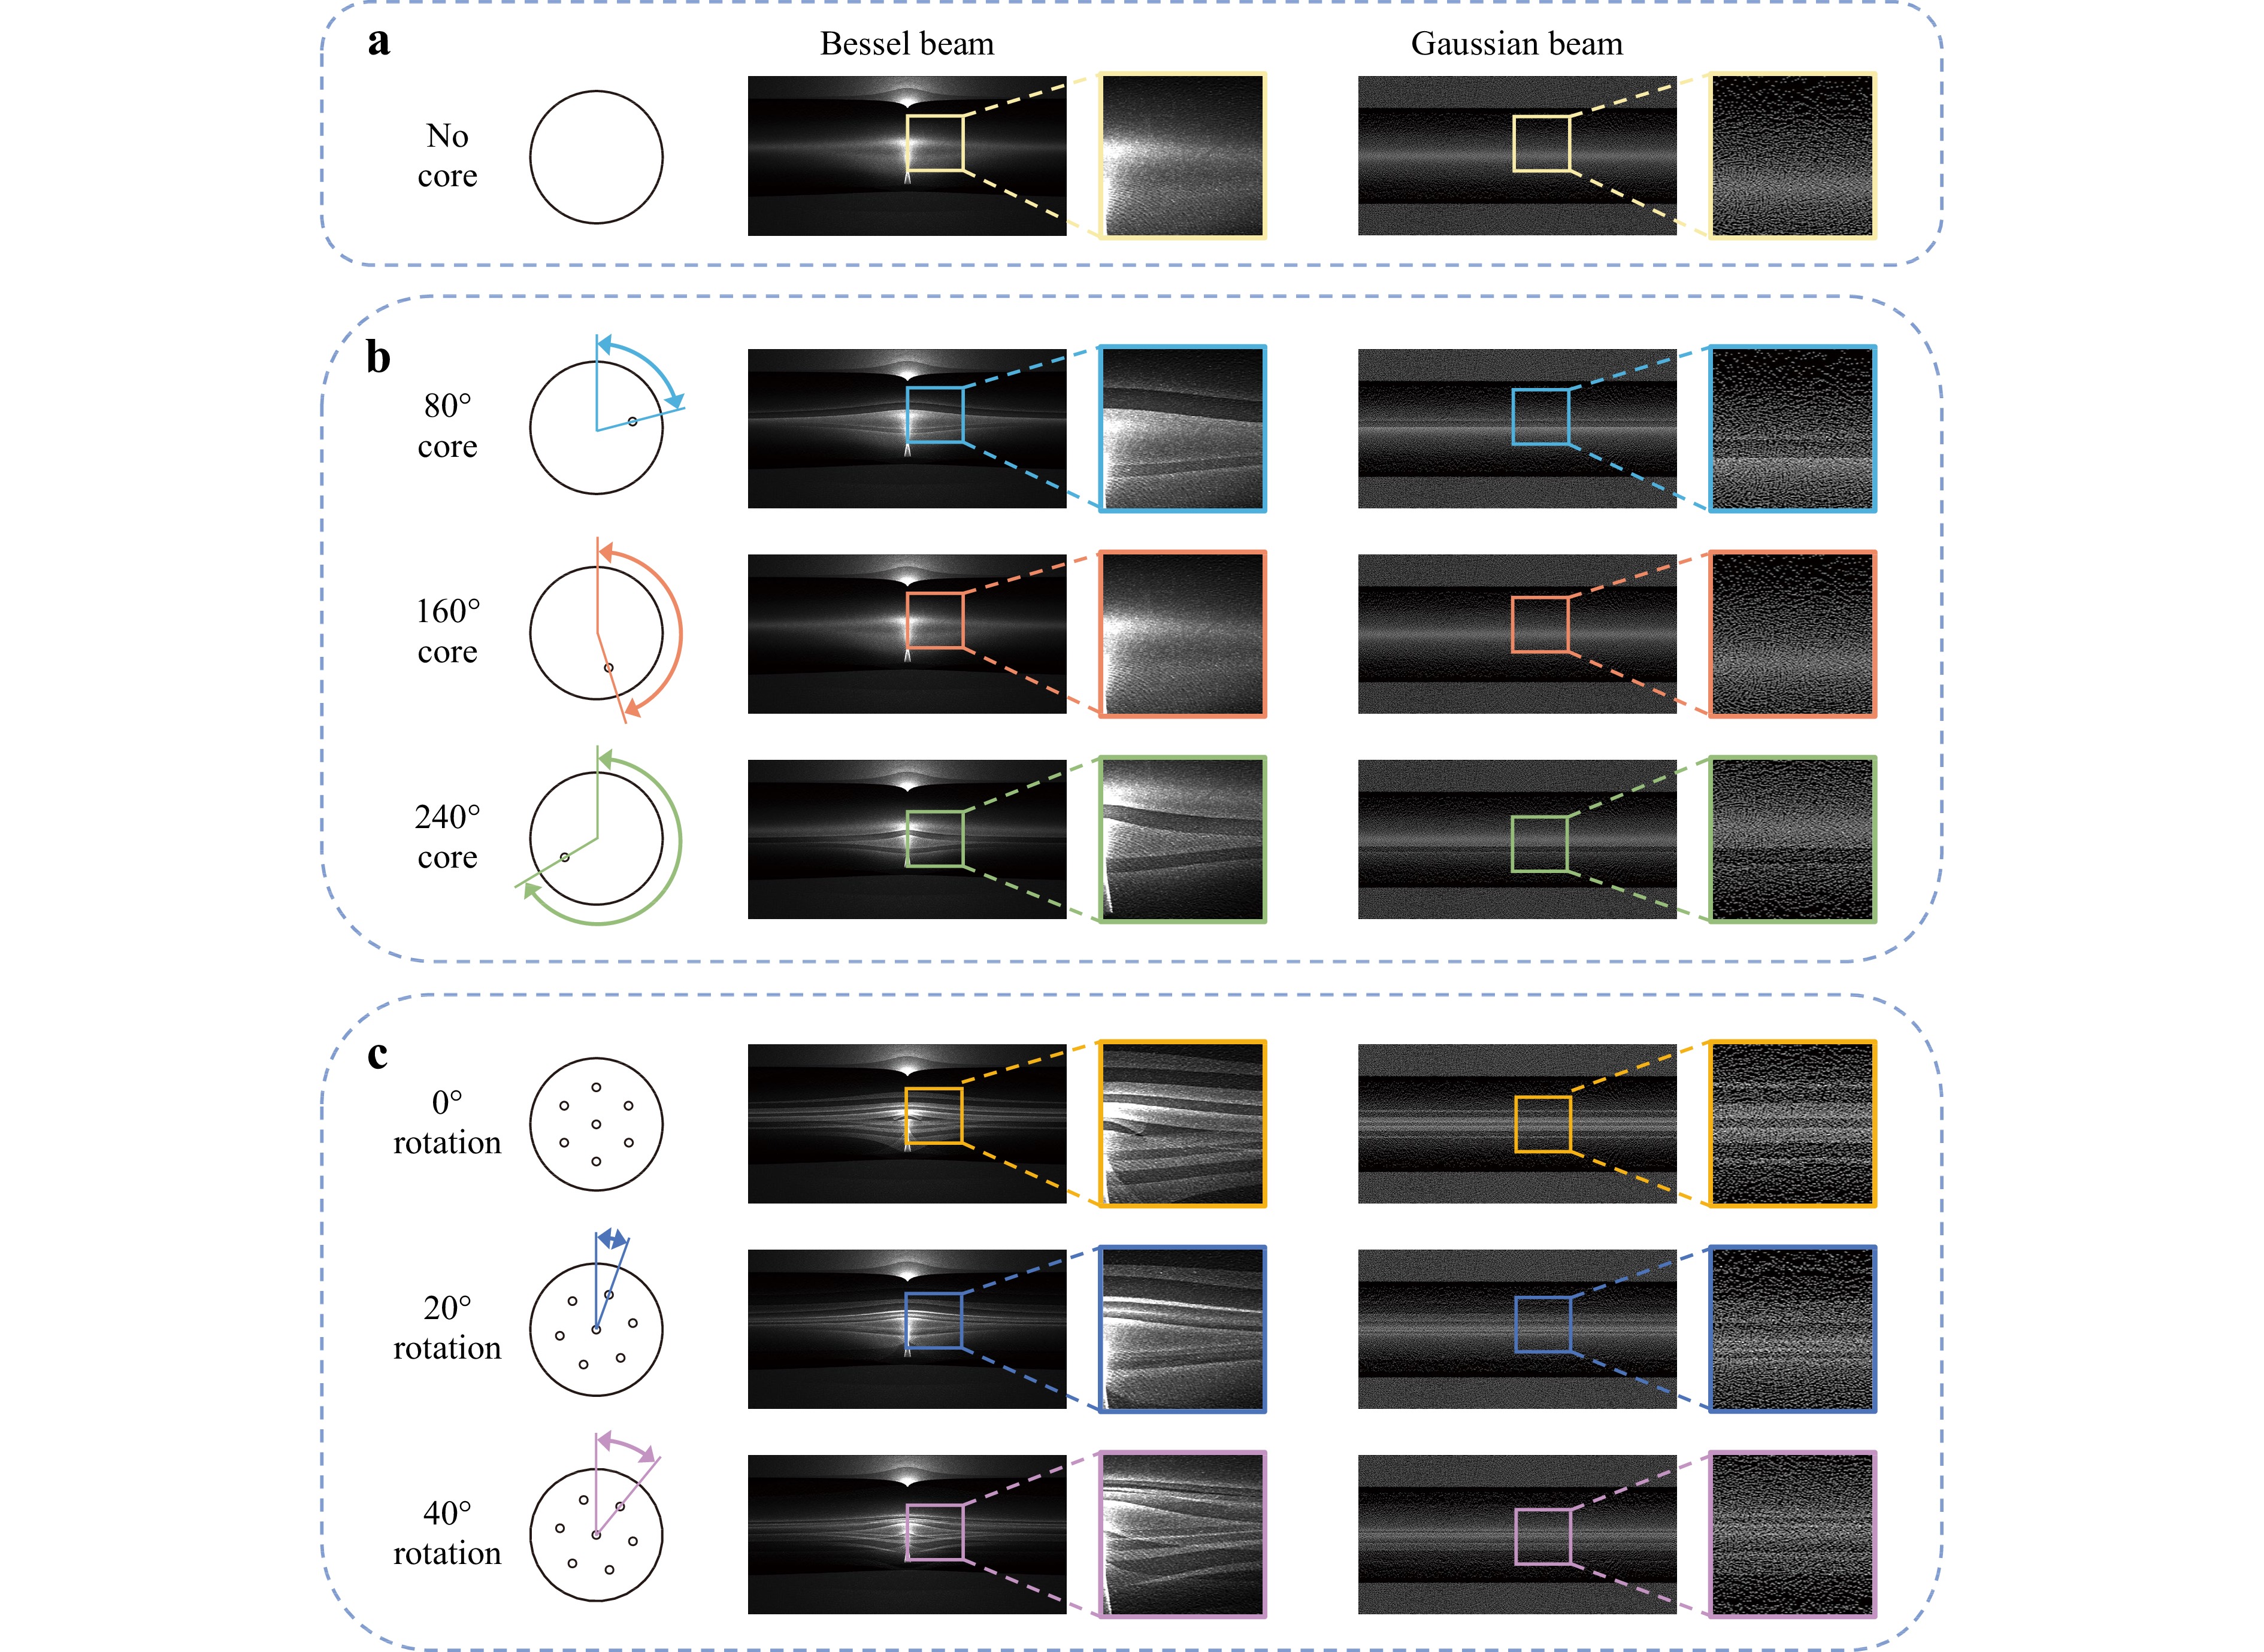
Fig. 2 Patterns of Bessel and Gaussian beam transmissions through fibres simulated using Ansys Zemax OpticStudio software. a–c Simulated transmission patterns of Bessel and Gaussian beams for coreless, single-core, and seven-core fibres, respectively, with different rotation angles. A partially enlarged picture is attached to the right of each picture.
-
The patterns of Bessel and Gaussian beams transmitting seven-core fibre with rotation angles of 0.2° and a total rotation of 120° were collected and considered as the reference pattern. Furthermore, the transmission patterns of the three core distribution rotation angles of 0°, 20°, and 40° were used as the measured patterns. Fig. 3a shows the 2D matrix data extraction locations in the image used to calculate the correlation coefficients. The region for correlation coefficient calculation is selected by considering whether it covers the area of the pattern that represents the fibre cores. Theoretically, from Eq. 1, a smaller correlation coefficient $\, \rho $ corresponds to a lower linear correlation between the measured and reference patterns, greater difference in features, and more significant variation in core information. As shown in Fig. 3b, the correlation coefficients of the Bessel beam exhibited a larger magnitude of change (peak-to-peak) and faster (slope) variation compared with those of the Gaussian beam, thus indicating that the transmission pattern of the Bessel beam provides more information regarding the fibre core variation. Additionally, the correlation coefficient peaked again at 60° intervals owing to the symmetry of the core distribution of the seven-core fibre. Evidently from the figure, the errors of the peak were within 0.6° and 1.5° for the Bessel and Gaussian beams, respectively, thus indicating that the accuracies of the digital correlation method were approximately 0.6° and 1.5°, respectively. Notably, as the pattern was captured from the same fibre, the accuracy of the correlation coefficient primarily depended on the symmetry and stability of the rotation apparatus. Here, the precision of the core distribution measurement is defined as the width of the core distribution when the correlation coefficient decreases to $ {-1dB}/{50} $ of the peak. Fig. 3b shows precisions of approximately 0.166° and 0.402° for the Bessel and Gaussian beams, respectively, essentially reflecting a significant improvement in the precision of the former compared with the latter. The precision calculation steps are detailed in Supplementary Information (section 3). Consequently, the peaks of the correlation coefficients of the Bessel beam were two times more identifiable compared with those of the Gaussian beam.
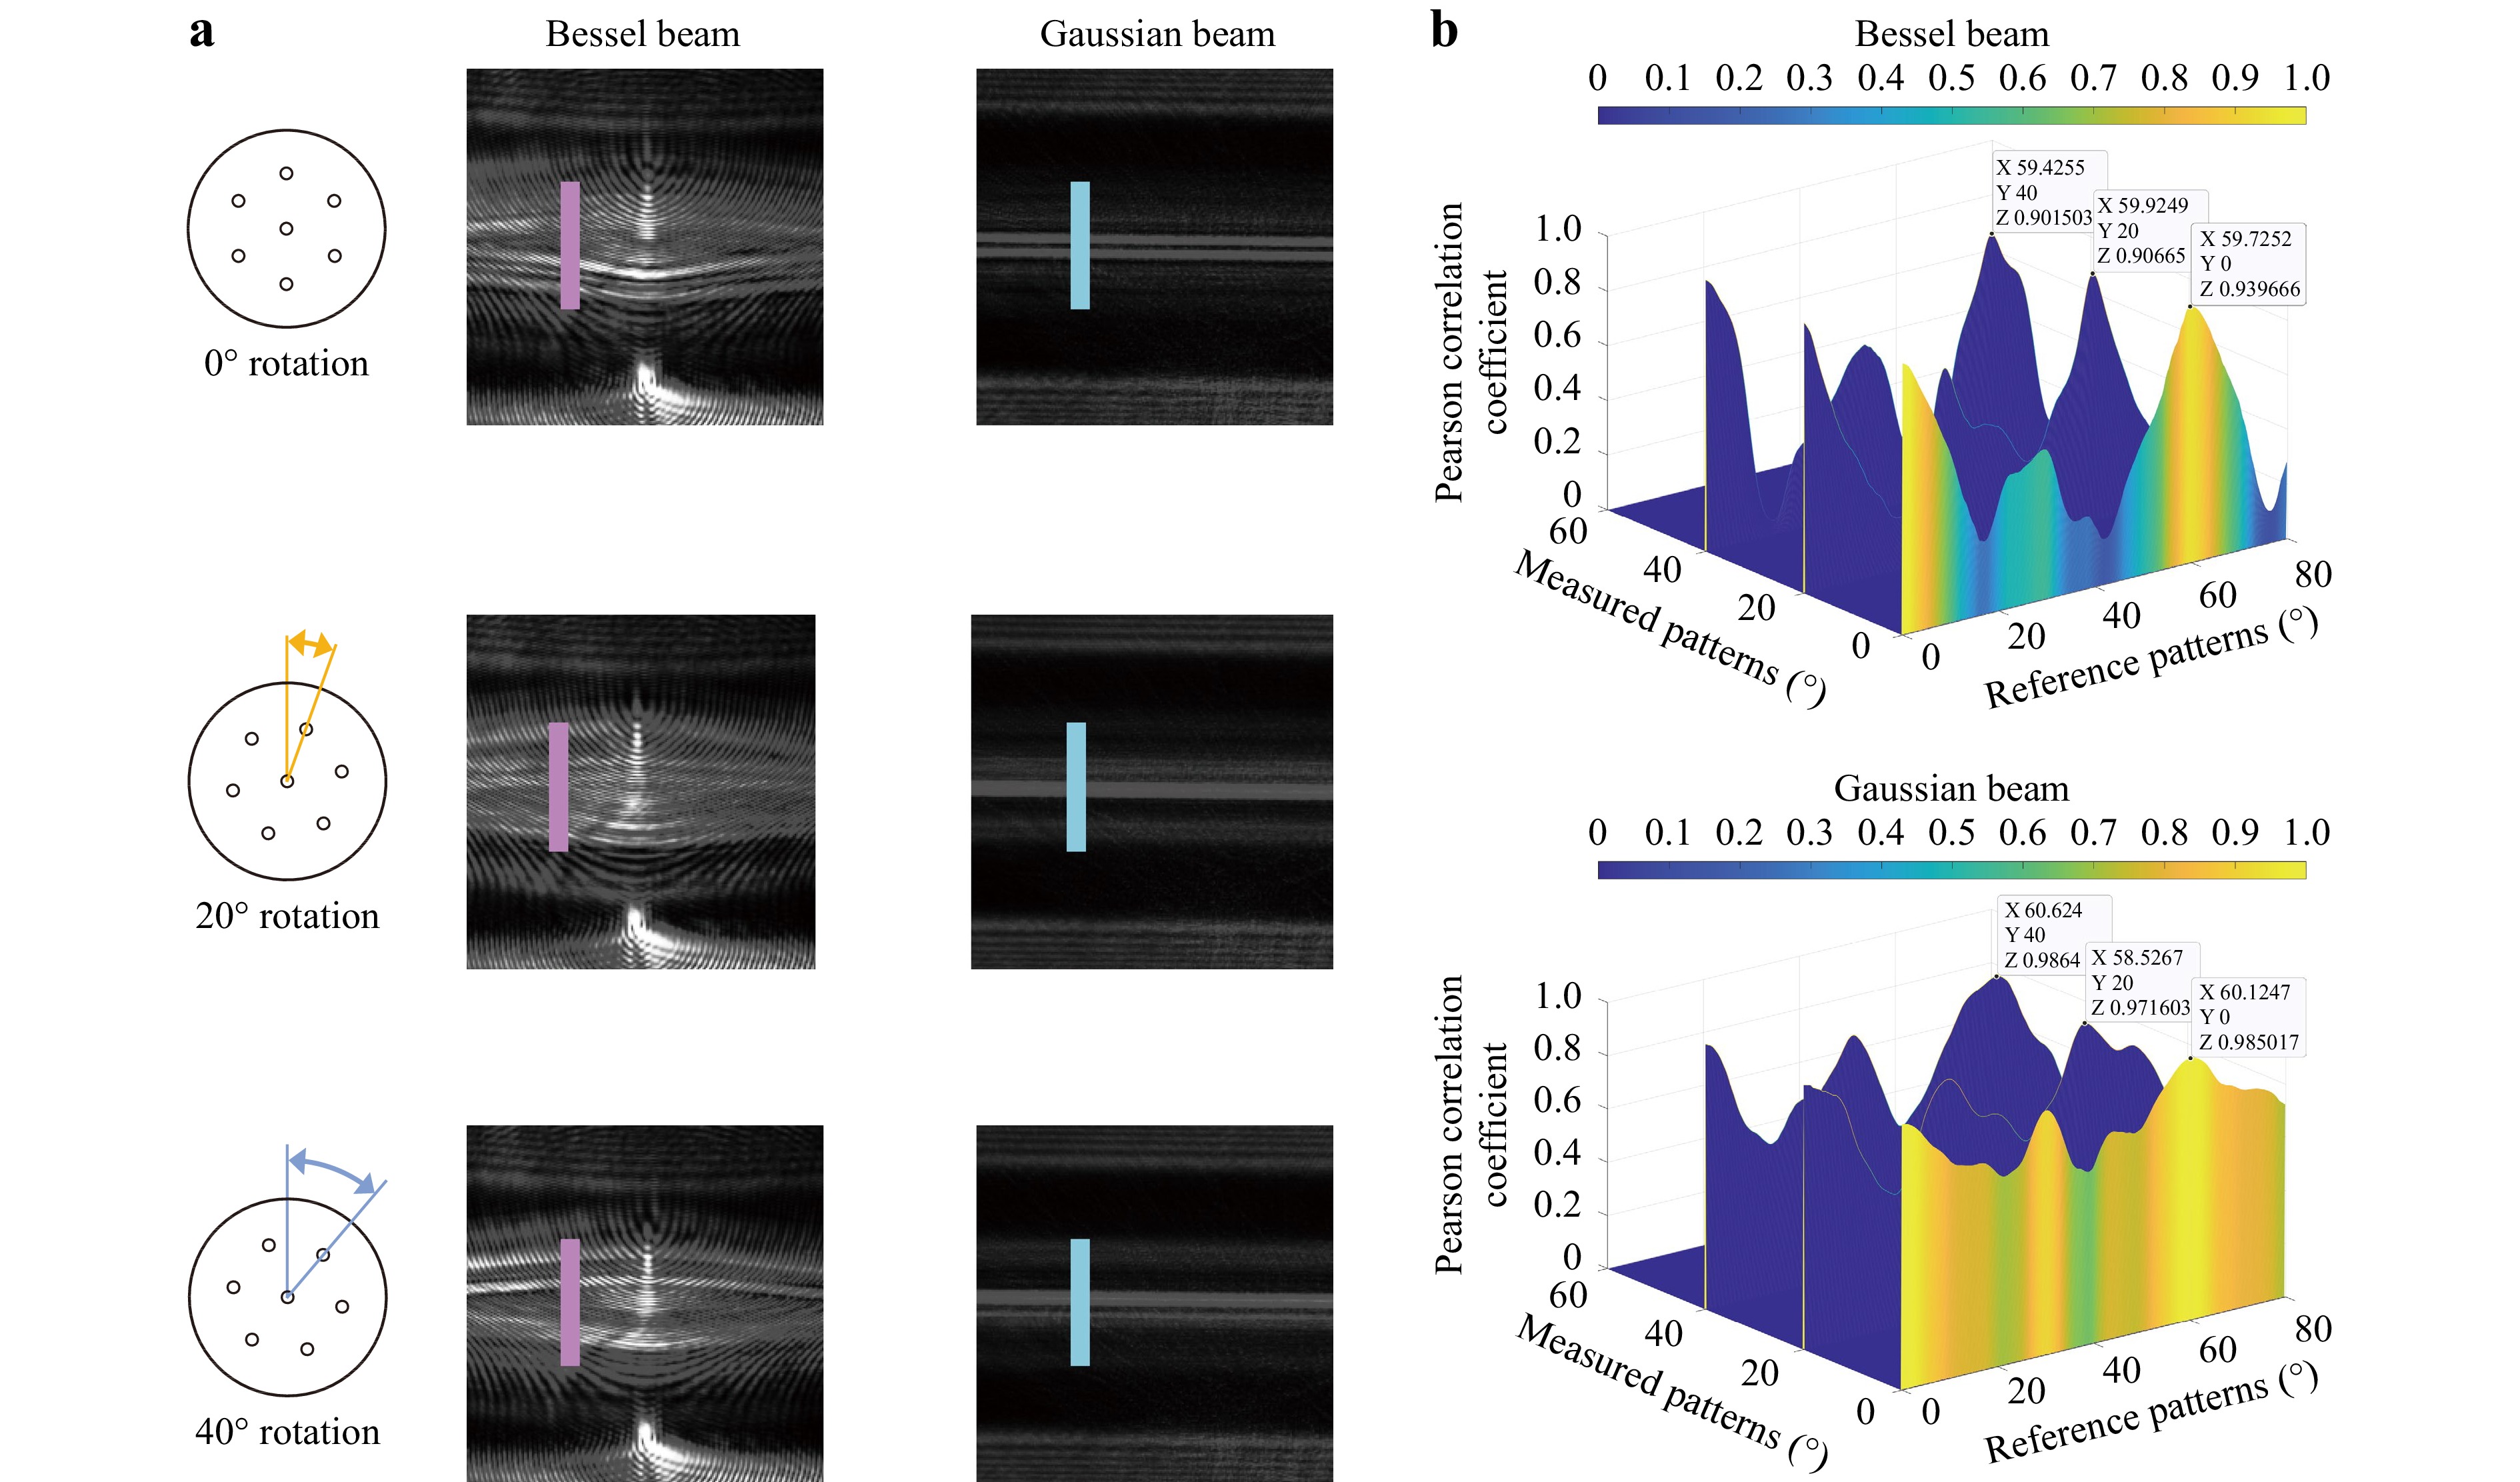
Fig. 3 Comparison of correlation coefficients of experimental captured patterns in Bessel and Gaussian beams. a Transmission patterns of Bessel and Gaussian beams derived experimentally; the purple and cyan rectangles correspond to the locations of the data extracts used to calculate the correlation coefficients. b Curves of correlation coefficients corresponding to Bessel and Gaussian beam transmission patterns of seven-core fibre. Here, patterns with core distribution rotation angles of 0°, 20°, and 40° are used as measured patterns.
-
As the images of Bessel beam transmission through MCFs provide sufficient information to distinguish between different core distributions, a convolutional neural network was used to further enhance the ability to extract core distribution information from the images and establish a mapping relationship between the transmission image and core distribution. Detailed data pre-process and neural network structure are presented in the Supplementary Information (sections 4 and 5). In brief, 15 different fibres were sequentially placed in the rotation apparatus to collect the transmission patterns in the training dataset, which were automatically labelled by the fibre end-face core distribution at a resolution of 0.2° using the graphical algorithm shown in Fig. 4a. Further, 20% of the images in the training dataset were randomly categorised into the validation dataset, and were not used for network training. The learning rate curves depicted in Fig. 4b exhibit a gradual increase in accuracy and decrease in loss to smoothness, thereby demonstrating the good convergence of the model. The prediction results of the validation dataset for the trained model are shown in Fig. 4c. Notably, prediction accuracy is defined as the fraction of the predicted core distribution within a certain error range of the real distribution. As shown in Fig. 4c, the core distribution predicted by the model exhibited an approximately linear fit to the real core distribution. The neural network approach achieved a minimum precision of 0.2° and accuracy of 96.8%, essentially corresponding to a nearly three-fold improvement over the digital correlation method. The achievable accuracy was less than 0.2°, which was limited by the acquisition resolution of the database. Next, five new fibres that were different from those used in the training dataset were further used to similarly capture and label the transmission patterns, and form a test dataset to verify the effectiveness of the proposed method in practical situations. Fig. 4d shows the prediction results, which indicate that the method provides a high prediction accuracy even when the fibres are different from the training dataset, with an accuracy of 88.2% at a prediction precision of 0.8°. Therefore, the Bessel-beam transmission pattern can provide stable and sufficient core distribution information to distinguish between different core distributions, and the neural network has a strong generalisation ability and provides good robustness in practical applications.
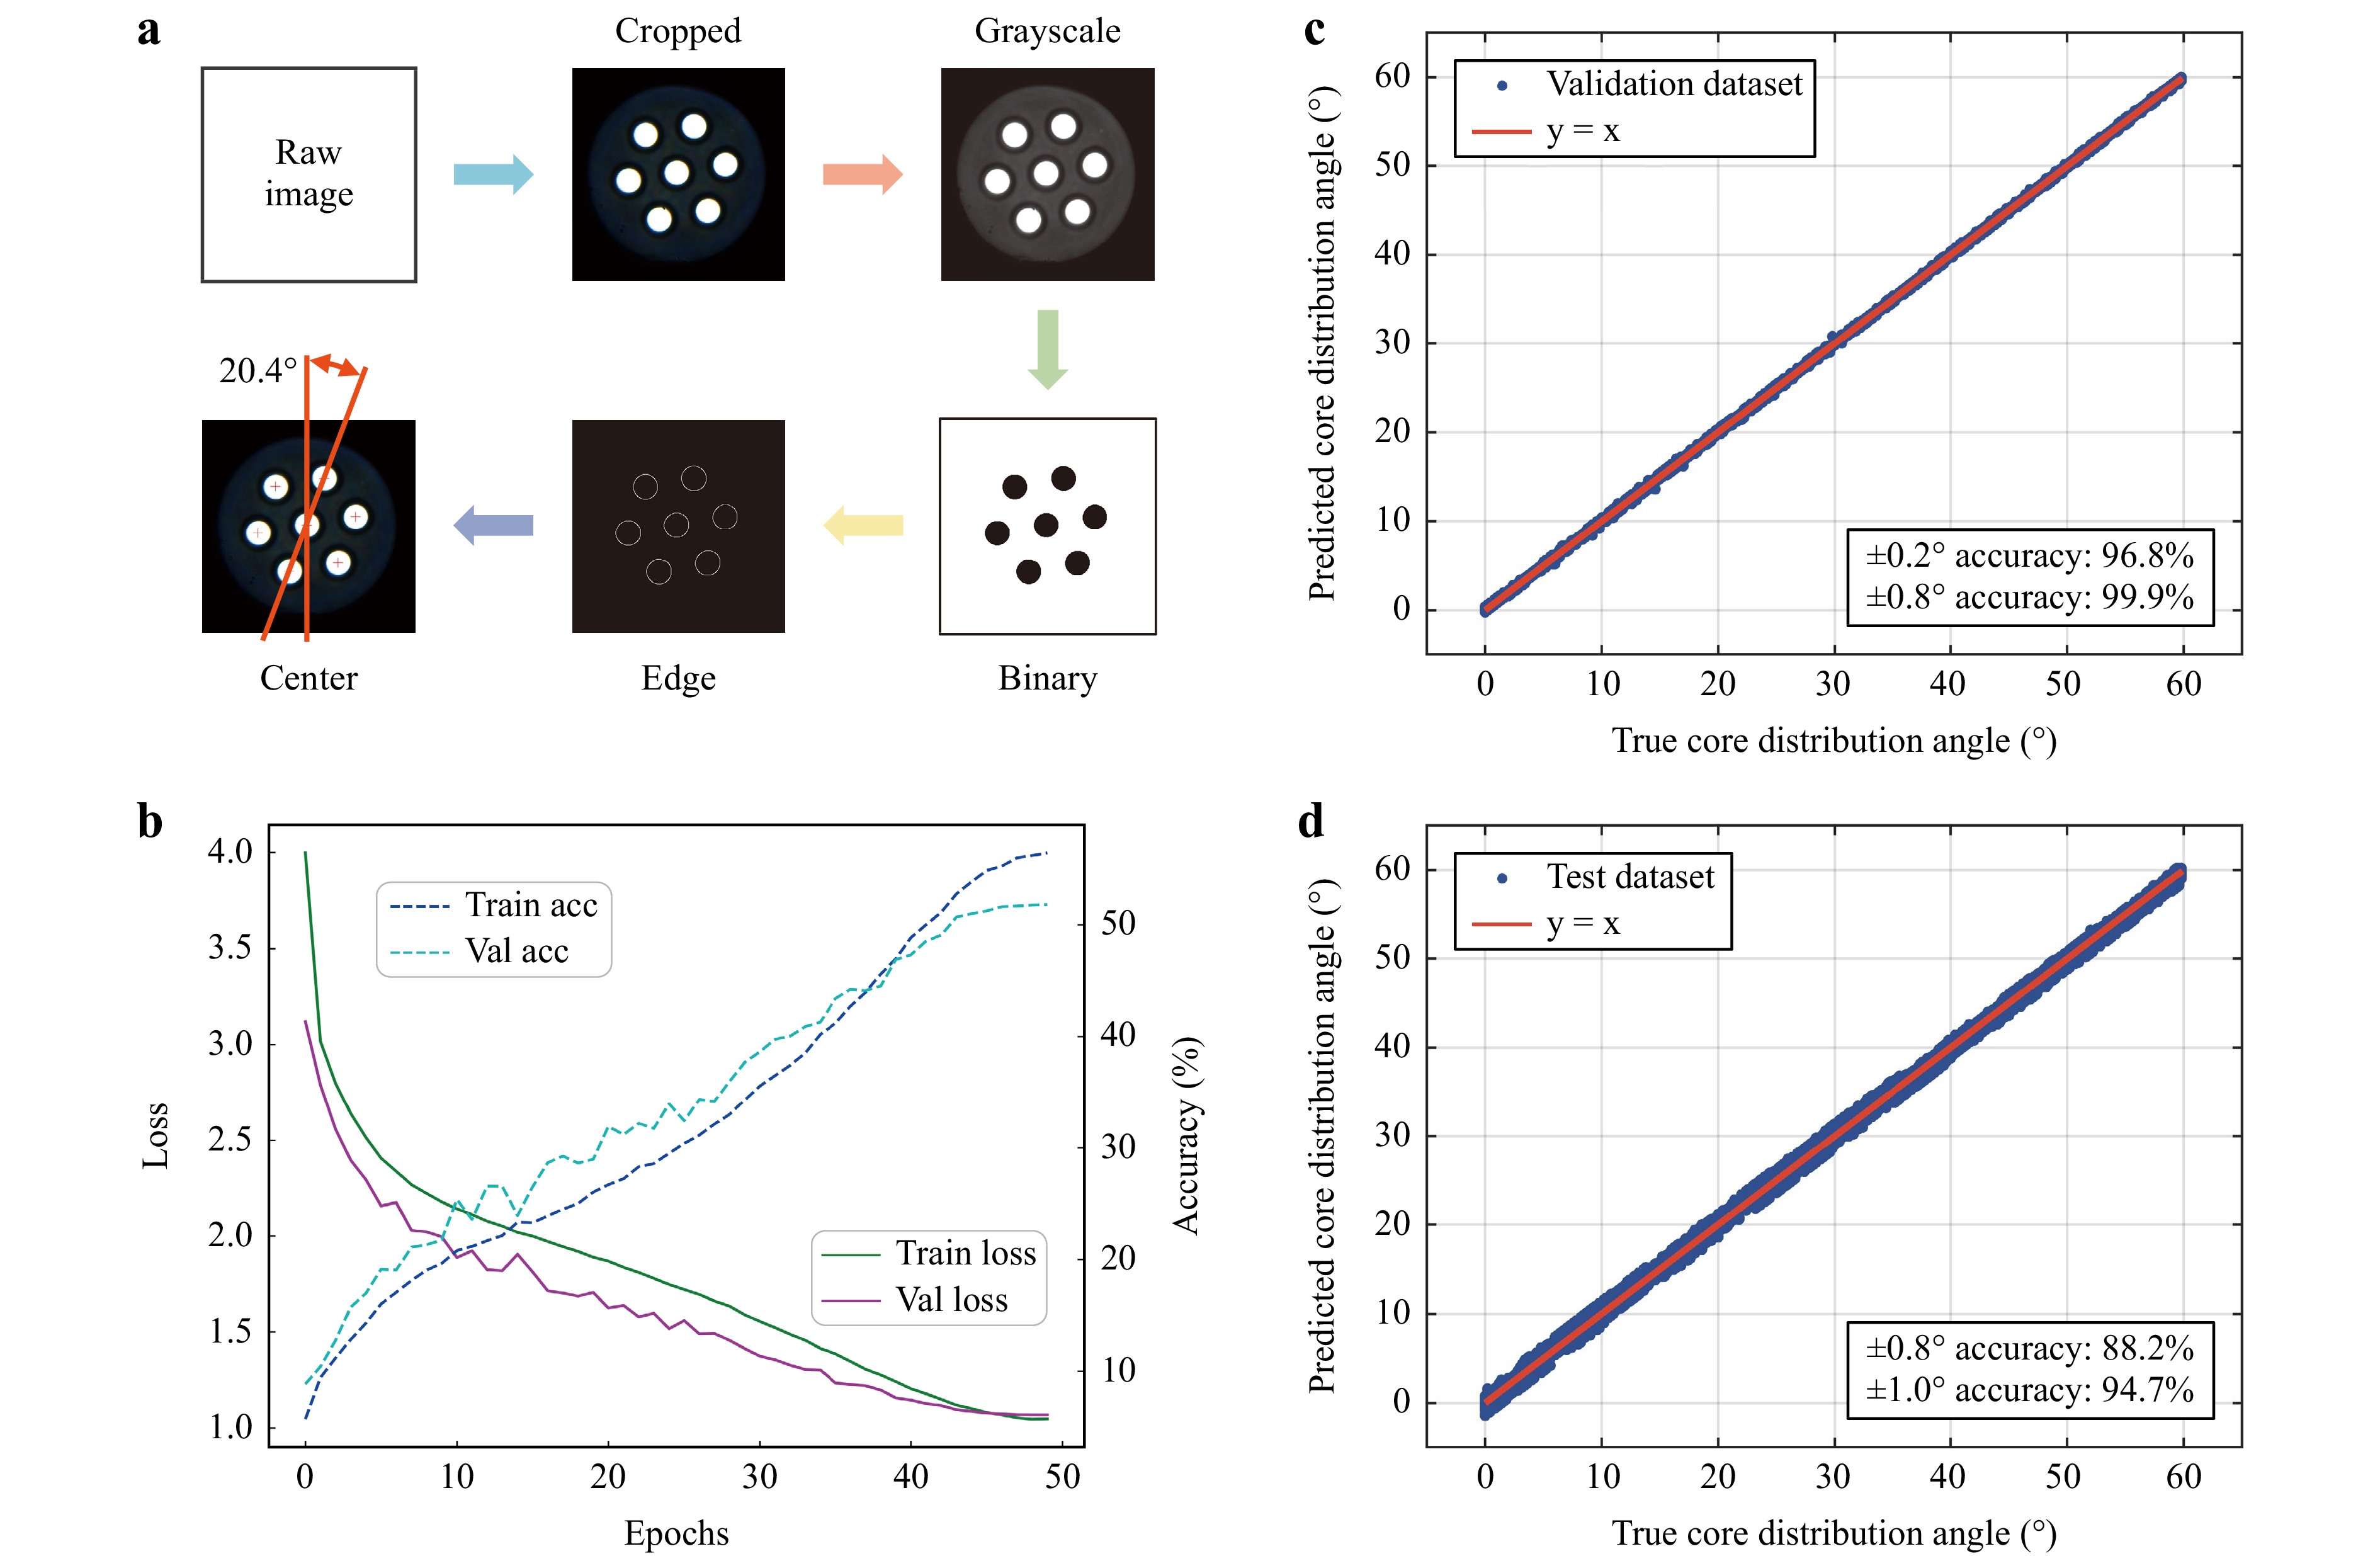
Fig. 4 Deep learning assisted fibre core distribution measurement. a Flowchart of the automated processing of seven-core fibre end-face images to obtain core distribution angles. The raw image is cropped to preserve its centre, and grey-scaled and binarized to obtain the edges of the cores. Thereafter, the fibre cores’ centre coordinates are obtained by circle fitting to calculate the core distribution angle. b Learning rate curves of the model during training. c Prediction results of the validation dataset on the trained model. d Prediction results of the test dataset on the trained model.
-
In this study, a high-precision and nondestructive method was reported for measuring the MCF core distribution based on an analysis of the transmission pattern of Bessel-beam illumination. Experiments and simulations were performed and revealed that the transmission pattern of the Bessel beam provides greater core distribution information compared with the Gaussian beam owing to a higher contrast of the pattern. This was further verified using the digital correlation method. Notably, the pattern of the Bessel beam transmitted through the MCF contains information regarding the core distribution to distinguish between MCF with different core distributions. Using deep learning, the measurement accuracy was further improved to 96.8%, with a precision of 0.2°. The results indicate the great potential of Bessel-beam-based methods for developing accurate and nondestructive applications for measuring the core distribution of MCFs and PCFs in practical scenarios.
-
This study was sponsored by the Key Research and Development Program of Jiangsu Province, China (Grant No. BE2020113), and the National Natural Science Foundation of China (61925502 and 62135007).
Bessel-beam-based side-view measurement of seven-core fibre internal core distribution
- Light: Advanced Manufacturing , Article number: (2024)
- Received: 04 June 2023
- Revised: 13 December 2023
- Accepted: 13 December 2023 Published online: 26 January 2024
doi: https://doi.org/10.37188/lam.2024.002
Abstract: Accurate knowledge of the internal core distribution of multicore fibres (MCFs) is essential, given their widespread application, including in fibre splicing, bundle fan-in/fan-out, mode coupling, writing gratings, and fibre drawing. However, the extensive use of MCFs is restricted by the limited methods available to precisely measure the fibre core distribution, as the measurement accuracy determines the performance of the product. In this study, a side-view and nondestructive scheme based on Bessel beam illumination was proposed for measuring the internal core distribution of a seven-core fibre. Bessel beams offer a large focal length in a scattering medium, and exhibit a unique pattern when propagating in an off-axis medium with a spatially varying refractive index. The results revealed that a long focal length and unique pattern influence the image contrast in the case of Bessel beams, which differs from a typical Gaussian beam. Further, high-precision measurement of a seven-core fibre core distribution based on a Bessel beam was demonstrated using a digital correlation method. A deep learning approach was used to improve the measurement precision to 0.2° with an accuracy of 96.8%. The proposed side-view Bessel-beam-based method has the potential to handle more complex MCFs and photonic crystal fibres.
Research Summary
Nondestructive measurement: non-diffraction structured light improves image contrast
An imaging method based on structured light illumination shows promise for nondestructive measurement of specialty optical fibre internal core distribution. Structured light, such as Bessel beams, have a long depth of focus because they are mathematically non-diffraction. Fei Xu from China's Nanjing University and colleagues now report development of structured light imaging, achieving high contrast imaging results using Bessel beams as an illumination source to image media with complex internal structures. Because of the long focus depth and non-diffraction of Bessel beams, imaging blurring caused by light scattering is reduced. The team demonstrated the application of nondestructive measurement in high precision measurement of seven-core fibre core distribution.
Rights and permissions
Open Access This article is licensed under a Creative Commons Attribution 4.0 International License, which permits use, sharing, adaptation, distribution and reproduction in any medium or format, as long as you give appropriate credit to the original author(s) and the source, provide a link to the Creative Commons license, and indicate if changes were made. The images or other third party material in this article are included in the article′s Creative Commons license, unless indicated otherwise in a credit line to the material. If material is not included in the article′s Creative Commons license and your intended use is not permitted by statutory regulation or exceeds the permitted use, you will need to obtain permission directly from the copyright holder. To view a copy of this license, visit http://creativecommons.org/licenses/by/4.0/.

 DownLoad: