


-
The on-chip fabrication of optical filters for use in spectral imaging has become prominent in the research on multi-spectral imaging. Filter arrays spatially modulate the allowed frequencies of light that can reach each pixel, similar to a Bayer filter for red, blue, and green in traditional colour cameras1. These multispectral filter arrays retain the integration advantages of Bayer filters while enabling targeted spectral resolution (or those of even more complex spectral structures2,3). Their applications include precision agriculture, environmental monitoring, and medical diagnostics, where rich spectral data can provide detailed chemical and structural information4−8.
Existing methods for patterned filter arrays, including multilayer dielectric stacks9, plasmonic filters10, and metasurfaces11, typically require complex, multistep photolithography with physical masks3 or slow direct-write methods, such as electron beam lithography9,12,13 occasionally combined with numerous material deposition stages. Fabry-Perot filters, specifically metal-insulator-metal structures14, are simpler to fabricate and design, which has facilitated their adoption in both industry and academia2,15,16. Although many different methodologies for producing or selecting these filters exist1,12,17,18, they still rely on multistep photolithography using masks14,19,20 or slower scanning-based approaches, such as electron beam lithography14, to pattern each of the many individual filters.
The most common methodology uses many separate photolithography stages, with multiple depositions and exposures to build the requisite stack14,19,20. Grayscale lithography, in which the intensity of light on the photoresist is nonbinary, can be used to fabricate these multispectral filter arrays; however, it suffers from several inherent challenges. Mask-based processes require intricate and expensive masks, whereas digital micromirror device (DMD)-based techniques are constrained to discrete intensity levels because of their binary nature. Furthermore, the pixel size and pitch of DMDs limit their achievable resolution and pattern complexity21 when predicting the precise alignment of DMD pixels to areas or features of interest.
Recently, computer-generated holography (CGH) has become increasingly common in applications related to novel display technologies, partly because of the availability of higher-quality spatial light modulators (SLMs). In typical systems that use a phase-modulating liquid crystal-on-silicon (LCOS) SLM, an iterative phase-retrieval algorithm computes an optimal phase-only hologram, a two-dimensional phase mask, for a given target intensity pattern. When this phase mask is displayed on the SLM, it spatially modulates the phase of the incident expanded coherent beam. A subsequent Fourier-transforming lens then reconstructs the target intensity pattern in its back focal plane, which is commonly referred to as the replay field. This Fourier relationship between the SLM and replay field is key; it dictates that the image resolution and feature shapes are not directly constrained by the SLM's pixel structure, thus sidestepping many of the disadvantages of a DMD based projection. In addition, the reconstructed intensity is inherently continuous, enabling true grayscale levels for arbitrary shapes. Holograms have previously been used in binary maskless lithography, with previous methods in this field enabling the exposure of binary patterns on photoresists22−24. A core advantage of holographic optics is its ability to concatenate desired optical effects within the hologram itself, including the potential for aberration correction and image shifting for alignment.
Herein, we present a holographic lithography apparatus using an LCOS-SLM that natively supports grayscale light projection on arbitrary substrates and demonstrate the single-step fabrication of Fabry-Perot filter arrays, as illustrated in Fig. 1. We show that these filters have definable cavity thicknesses within a projected image, and we introduce a novel tunability mechanism that harnesses speckle-like noise as a design parameter to control the filter linewidth. We also demonstrate that our methodology can achieve resolutions as low as 1−2.5 µm.
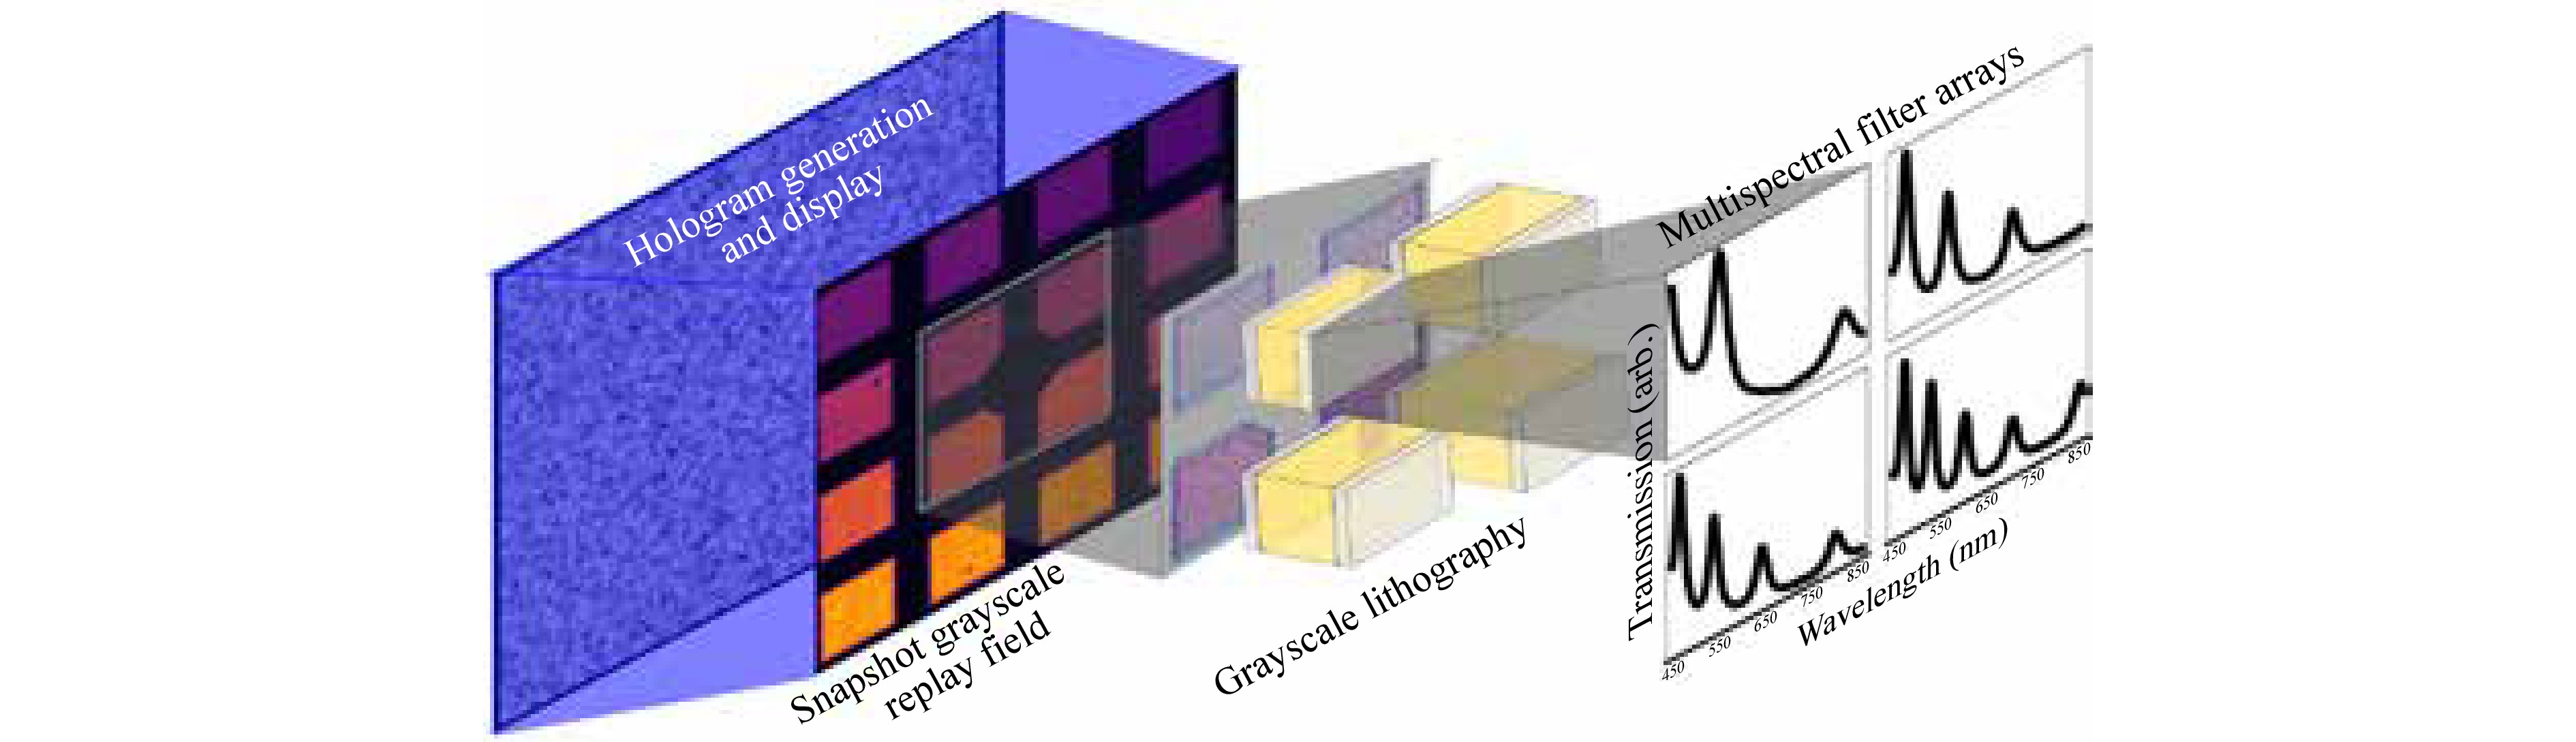
Fig. 1 Schematic illustration of the holographic grayscale lithographic patterning of a multispectral filter array, with an example of measured transmission spectra shown on the right-hand side.
-
Our holographic photolithography setup is shown in Fig. 2. The exposure source was a 405 nm diode laser (Coherent OBIS LX SF). Its intensity could be optimised according to the required exposure dose using a variable attenuator composed of a rotatable half-wave plate (HWP) and polarising beam splitter (PBS). The beam was then expanded and cleaned using a spatial filter consisting of a telescope ($ L_1 $, $ f $=25.4 mm; $ L_2 $, $ f $=400 mm) with a 20 µm pinhole (PH) placed in the focal plane. An iris ($ I $) was used to set the beam size to match the dimensions of the SLM's active area.
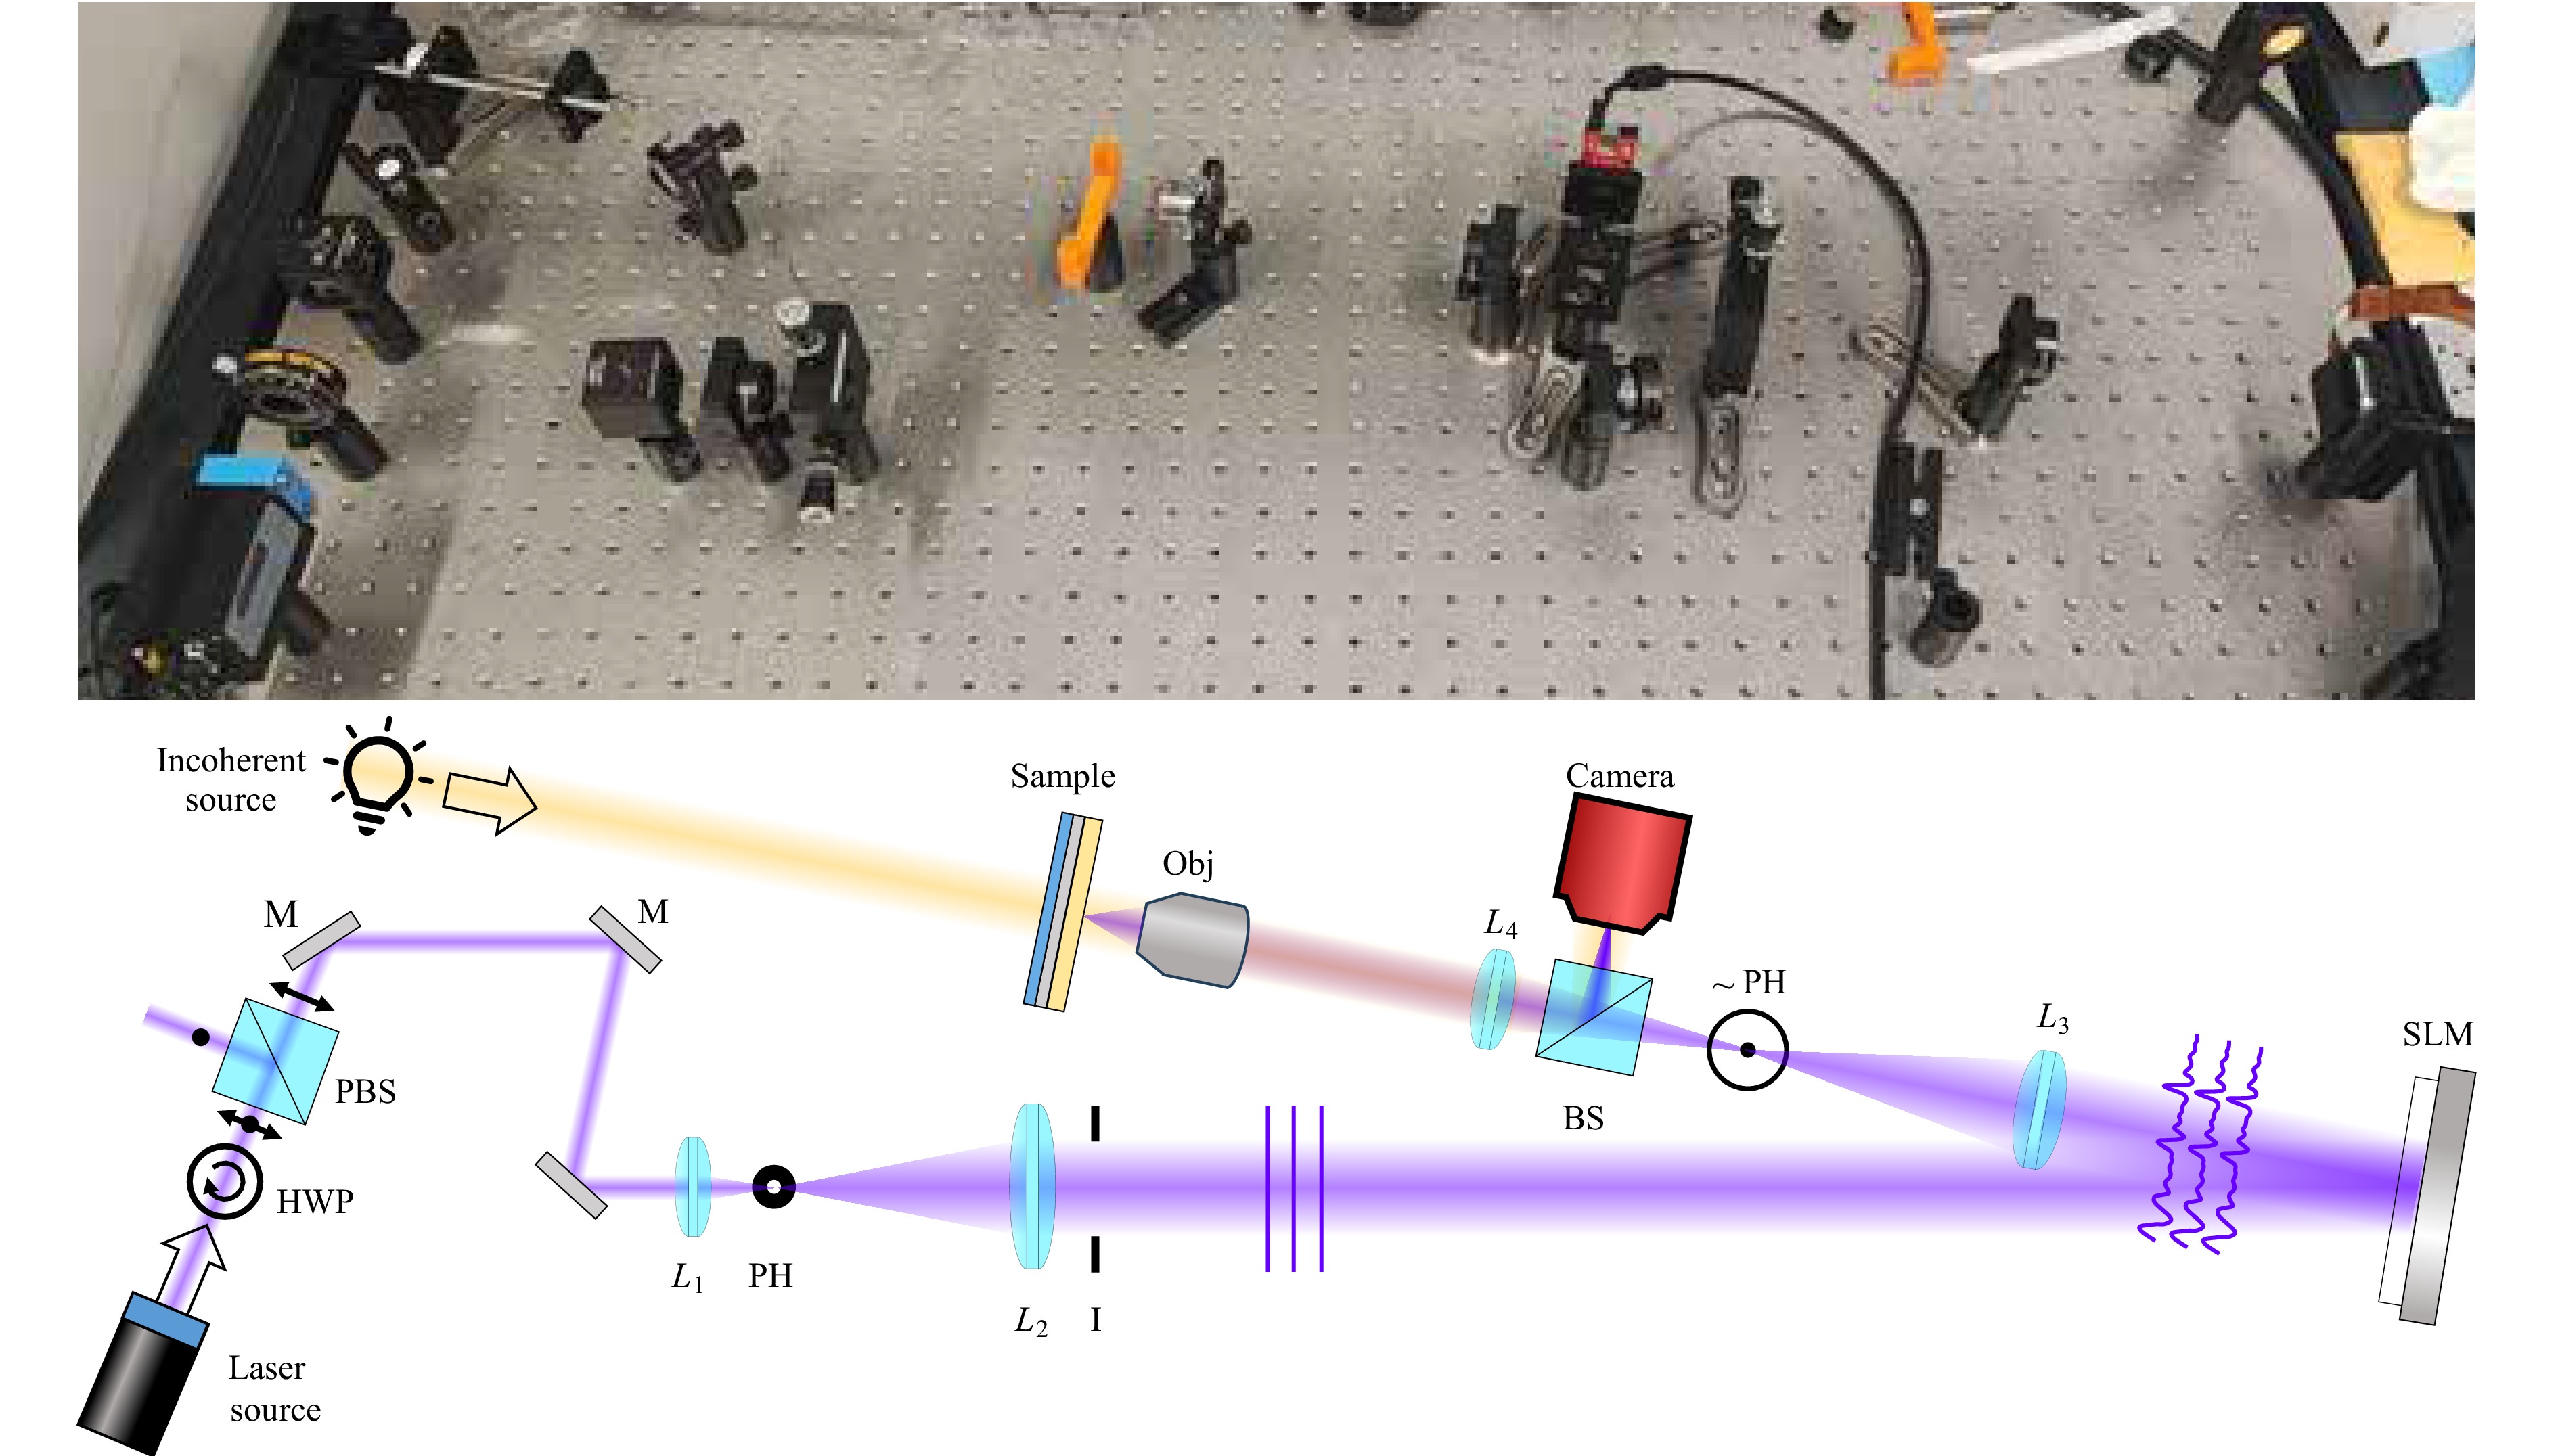
Fig. 2 Photograph and schematic explanation of the optical set-up used in this study. Briefly: the laser is appropriately polarized, aligned and spatially filtered before incidence on the SLM. The light is then taken through a 4f system to remove the 0th order before being passed through a microscope objective and focused onto the photoresist. A second incoherent light source is used to image and align the sample to the replay field.
The prepared beam illuminated a phase-only SLM (Santec SLM-250), which encodes a computer-generated hologram onto the wavefront. The modulated light then enters a 4f relay system ($ L_3 $, $ f $=150 mm; $ L_4 $, $ f $=125 mm), which serves two purposes: it provides an accessible Fourier plane for filtering the zeroth diffraction order with a 500 µm beam block (~PH) and relays the SLM plane, forming a demagnified image of the phase pattern on the back focal plane of the final objective. The microscope objective (OBJ: RMS4X, 0.10 NA) acted as a Fourier-transforming lens, reconstructing the desired grayscale intensity pattern in its focal plane where the photoresist-coated sample was placed.
An imaging path was integrated into the setup for precise sample positioning and inspection. A beamsplitter (BS) directed the light scattered by the sample through $ L_4 $ to a CMOS camera (Alvium 1800 U-040m), offering a magnified view ($ M = 2.78 $). This path could be used with either a 405 nm laser to precisely align the sample surface with the objective's focal plane, ensuring that it is in focus for holographic projection, or with white-light illumination for non-invasive in-situ observation of the fabricated structures.
-
The phase holograms displayed on the SLM were computed using a modified iterative algorithm based on the Gerchberg-Saxton (GS)25 method (Fig. 3). We implemented several variations, primarily from the study of Chen et al. 26, to optimise the uniformity and linearity of the intensity response. This ensured that the target grayscale values were reproduced in the replay field, which is a critical requirement for precise dose control in photolithography.
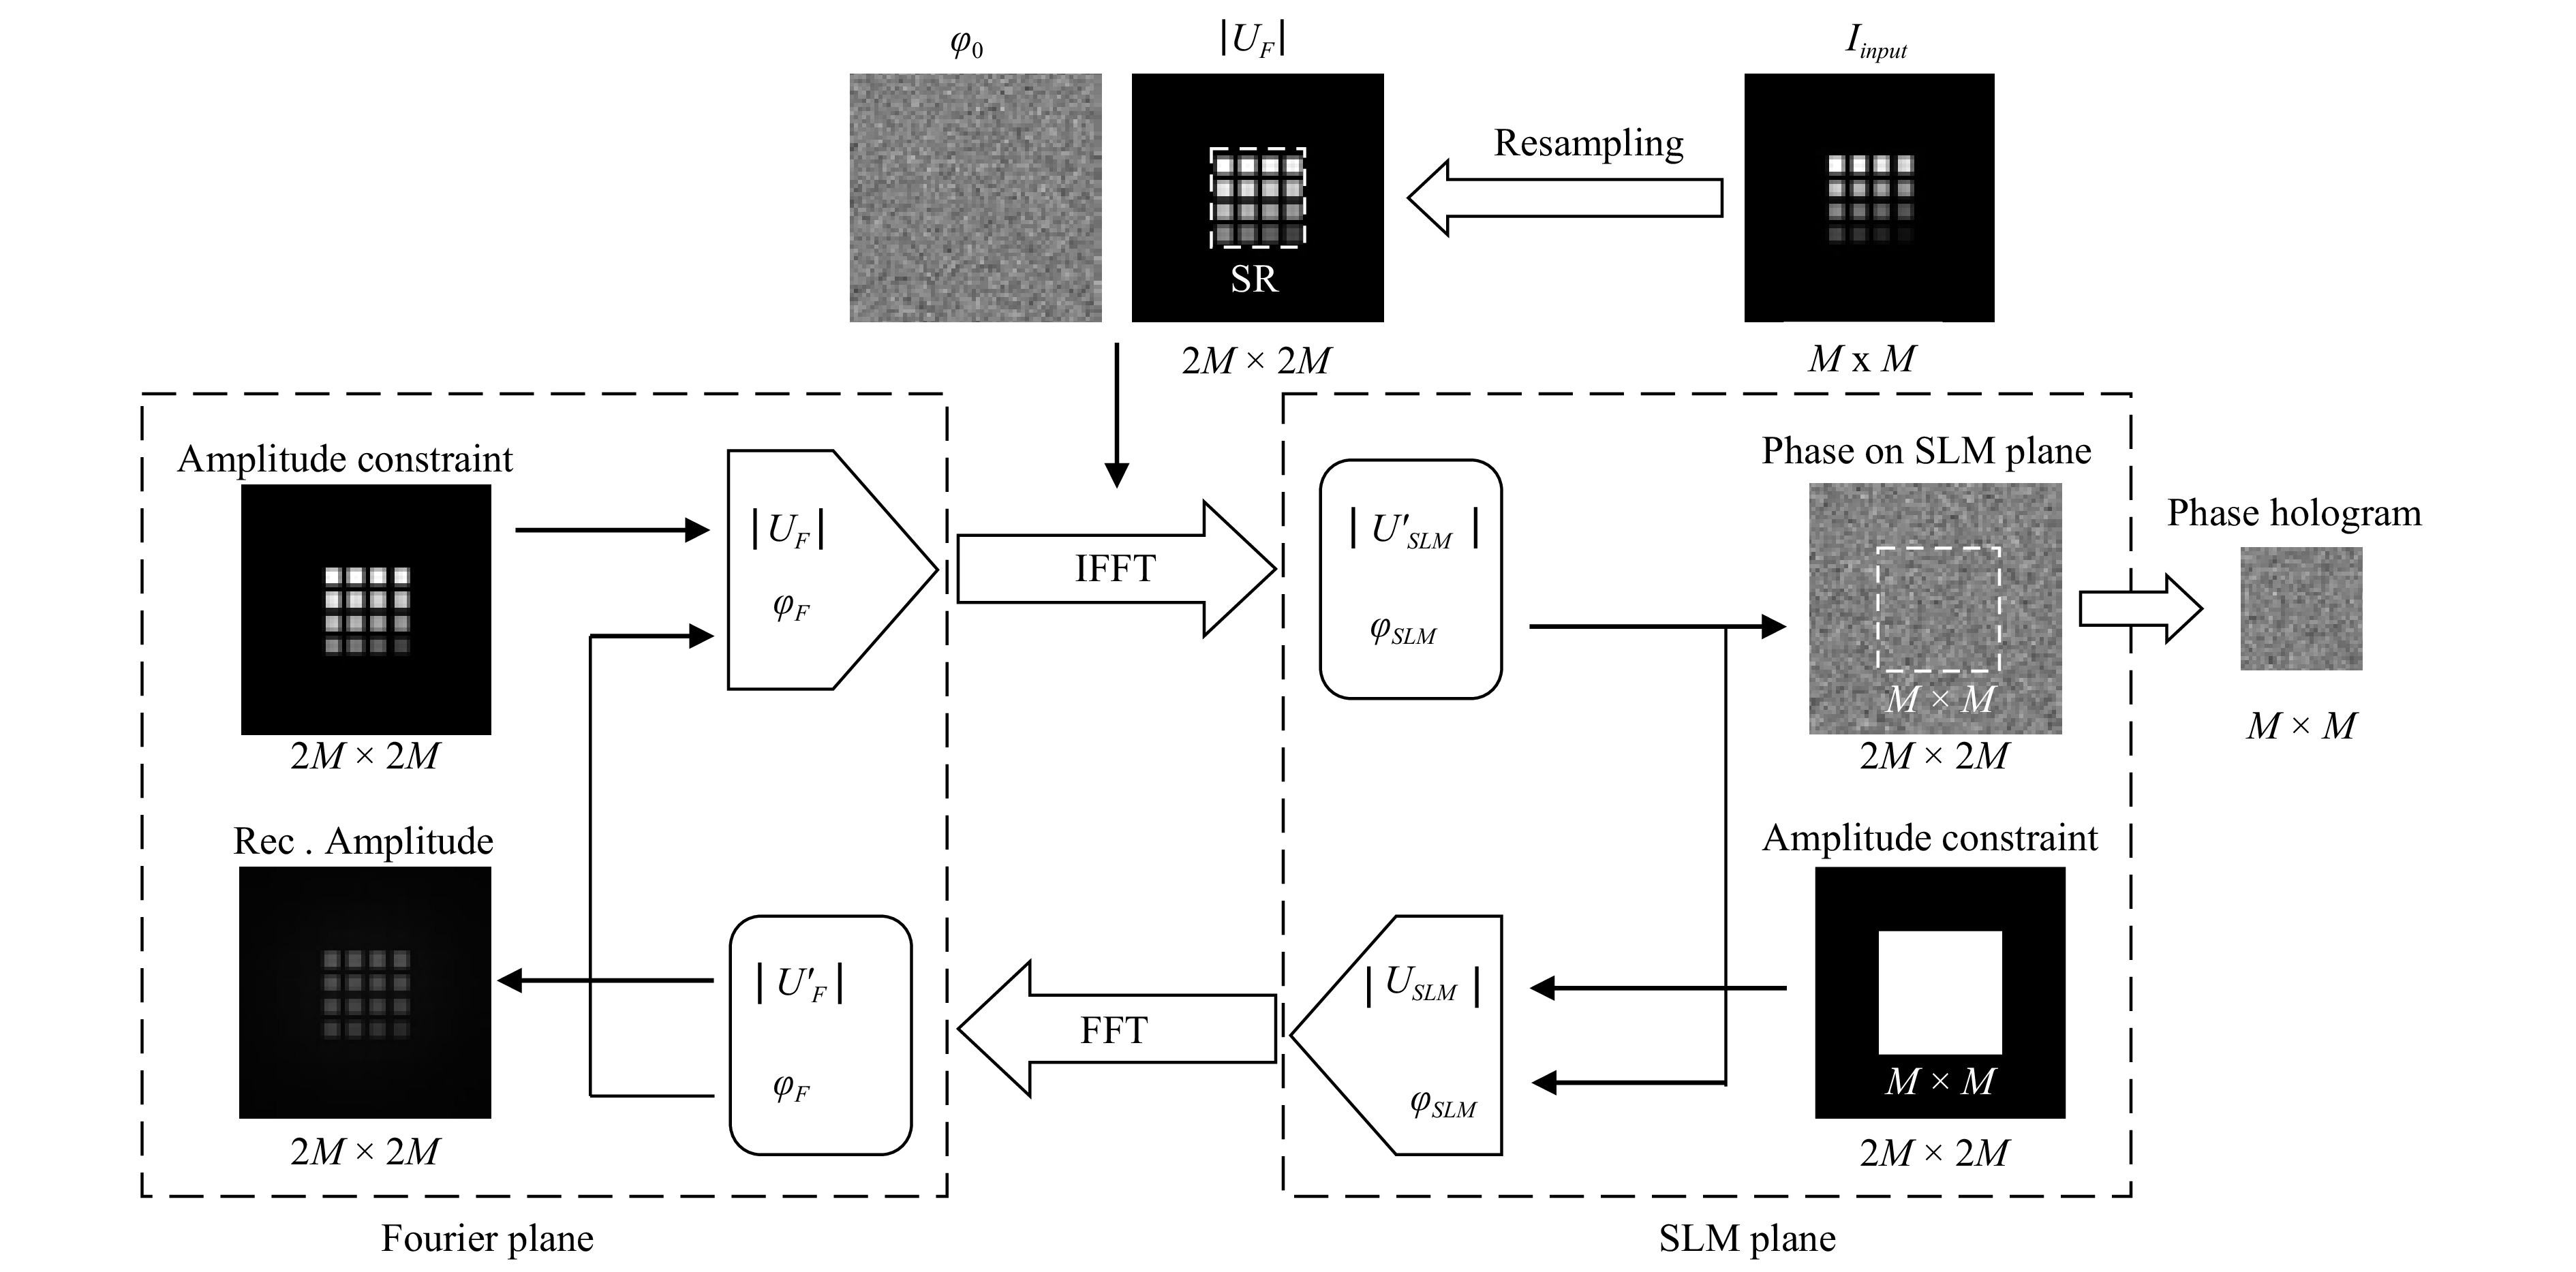
Fig. 3 Schematic of the CGH GS-based algorithm: The M by M target amplitude is resampled to 2M by 2M and initialized with a random phase. An iterative loop, consisting of an IFFT to the SLM plane (where amplitude is constrained to uniform in the central M by M region and zero outside), is then performed followed by an FFT back to the target plane (where amplitude is constrained to the target within the 'signal region' while being left unconstrained in the surrounding 'noise region'). The sequence is repeated until convergence, and the final CGH is the phase resulting in the central M by M SLM region.
The standard GS process begins with a target intensity pattern, $ I_{\rm{input}} $, initialising the Fourier plane field $ U_{\rm F} = \sqrt{I_{\rm{input}}} $ with a random phase $ \phi_0 $. An inverse Fourier transform yields the SLM-plane field, where the amplitude is constrained to match the input beam profile while the phase is retained. A forward transform then returns to the Fourier plane, where the amplitude is reset to the target while the new phase is saved. This loop is repeated for a set number of iterations.
The key variations we implemented from26 included three main features: a weighted constraint strategy, energy conservation, and target oversampling. The oversampling step, which is required to correctly sample the intensity fluctuations, involves resampling an $ M \times M $ target to a $ 2M \times 2M $ grid via sinc interpolation. The weighted constraint strategy then partitions this $ 2M \times 2M $ Fourier plane into a 'signal region' (SR) and 'noise region' ($ \notin S R $). The iterative amplitude constraint is applied asymmetrically: the amplitude in the SR is forced to match the target $ \sqrt{I_{\rm{input}}} $, whereas the amplitude in the noise region is allowed to float freely (i.e. it is not constrained to zero). This 'amplitude freedom', combined with the enforcement of energy conservation at each iteration, effectively suppresses artifacts and improves signal uniformity.
Finally, to counteract the intensity roll-off caused by the SLM's pixelated structure (i.e. the sinc envelope), we pre-correct the target amplitude by dividing it by $ \sin c^\alpha(x)\sin c^\alpha(y) $. Although the theoretical value is $ \alpha=2 $, we found that the empirical tuning of this parameter (typically near 2) yields the best corrective results.
-
We used holographic grayscale lithography to fabricate Fabry-Perot filters owing to their prominent development in spectral camera research9,15,16. The filter structure consisted of a photoresist cavity defined between two semi-reflective silver layers. The fabrication began with the electron-beam evaporation of a 26 nm Ag layer onto a quartz substrate, followed by a 2 nm protective SiO2 capping layer to reduce the propensity to tarnish during the remainder of the lithography procedure. A metal thickness of 26 nm was selected to balance the peak widths to ensure resolvability at broader distributions of polymer thicknesses while not significantly reducing transmission owing to absorption. An AZ5214E photoresist was spin-coated at 4,000 rpm to serve as the photoactive layer, yielding an initial thickness of approximately 1,500 nm. Each exposure produced a $ 4 \times 4 $ array of Fabry-Perot cavities (200 µm side length). Each hologram encoded 16 distinct grayscale levels designed to produce cavities with systematically varying thicknesses. To investigate the dose response and time multiplexing, we fabricated 14 separate $ 4 \times 4 $ arrays with exposure times between 20 and 150 s, corresponding to a varying number of hologram refreshes at a fixed frame rate of 5 Hz. We estimated that given the errors at a power calibration (from the Thorlabs PM16-120 power meter) of $ \approx 3\% $, the laser power stability of $ \approx 2\% $ (from the Coherent OBIS 405 nm specifications), and the timing uncertainty of the exposure sequence $\approx $ $ 0.33\% - 2.5\% $, the error in the dose is of the order of approximately $ \approx 4.4\% $ Following exposure, the samples were developed using an AZ 726 MIF developer for 60 s and coated with a second 26 nm silver layer to complete the Fabry-Perot stack (examples of scanning electron micrographs are shown in Fig. S5). These filters were constructed and measured without any final encapsulation layer. However, owing to the varying tarnishing mechanisms of silver, an inert capping layer to prevent exposure to the elements is recommended to preserve the filter function over time in commercial applications.
To model the transmission spectra, we used the transfer-matrix method (TMM), which is a widely established technique for stratified media27,28 combined with Monte Carlo sampling (see SI S2). In this approach, the photoresist thickness is treated as a Gaussian-distributed variable with a standard deviation of $ \sigma_p $ to represent spatial fluctuations and speckle-related variations. For each nominal thickness, 5,000 random samples were drawn, and the resulting transmission spectra were averaged to yield broadened peak profiles. Two illustrative cases are presented in Fig. 4, which compares $ \sigma_p = 0\;{\rm{nm}} $ and $ \sigma_p = 50\;{\rm{nm}} $ while highlighting the peak broadening due to thickness variations. Silver optical constants were obtained from the study of Johnson and Christy29, and the photoresist refractive index was modelled using a three-term Cauchy relationship fitted to the ellipsometry data of the photoresist shown in SI Fig. S2. Note that, in this paper, we consider only the transparent spectral range of the polymer used (450–850 nm), which had negligible extinction; for wavelengths outside this range, a sufficient model of the extinction coefficient would also be required.
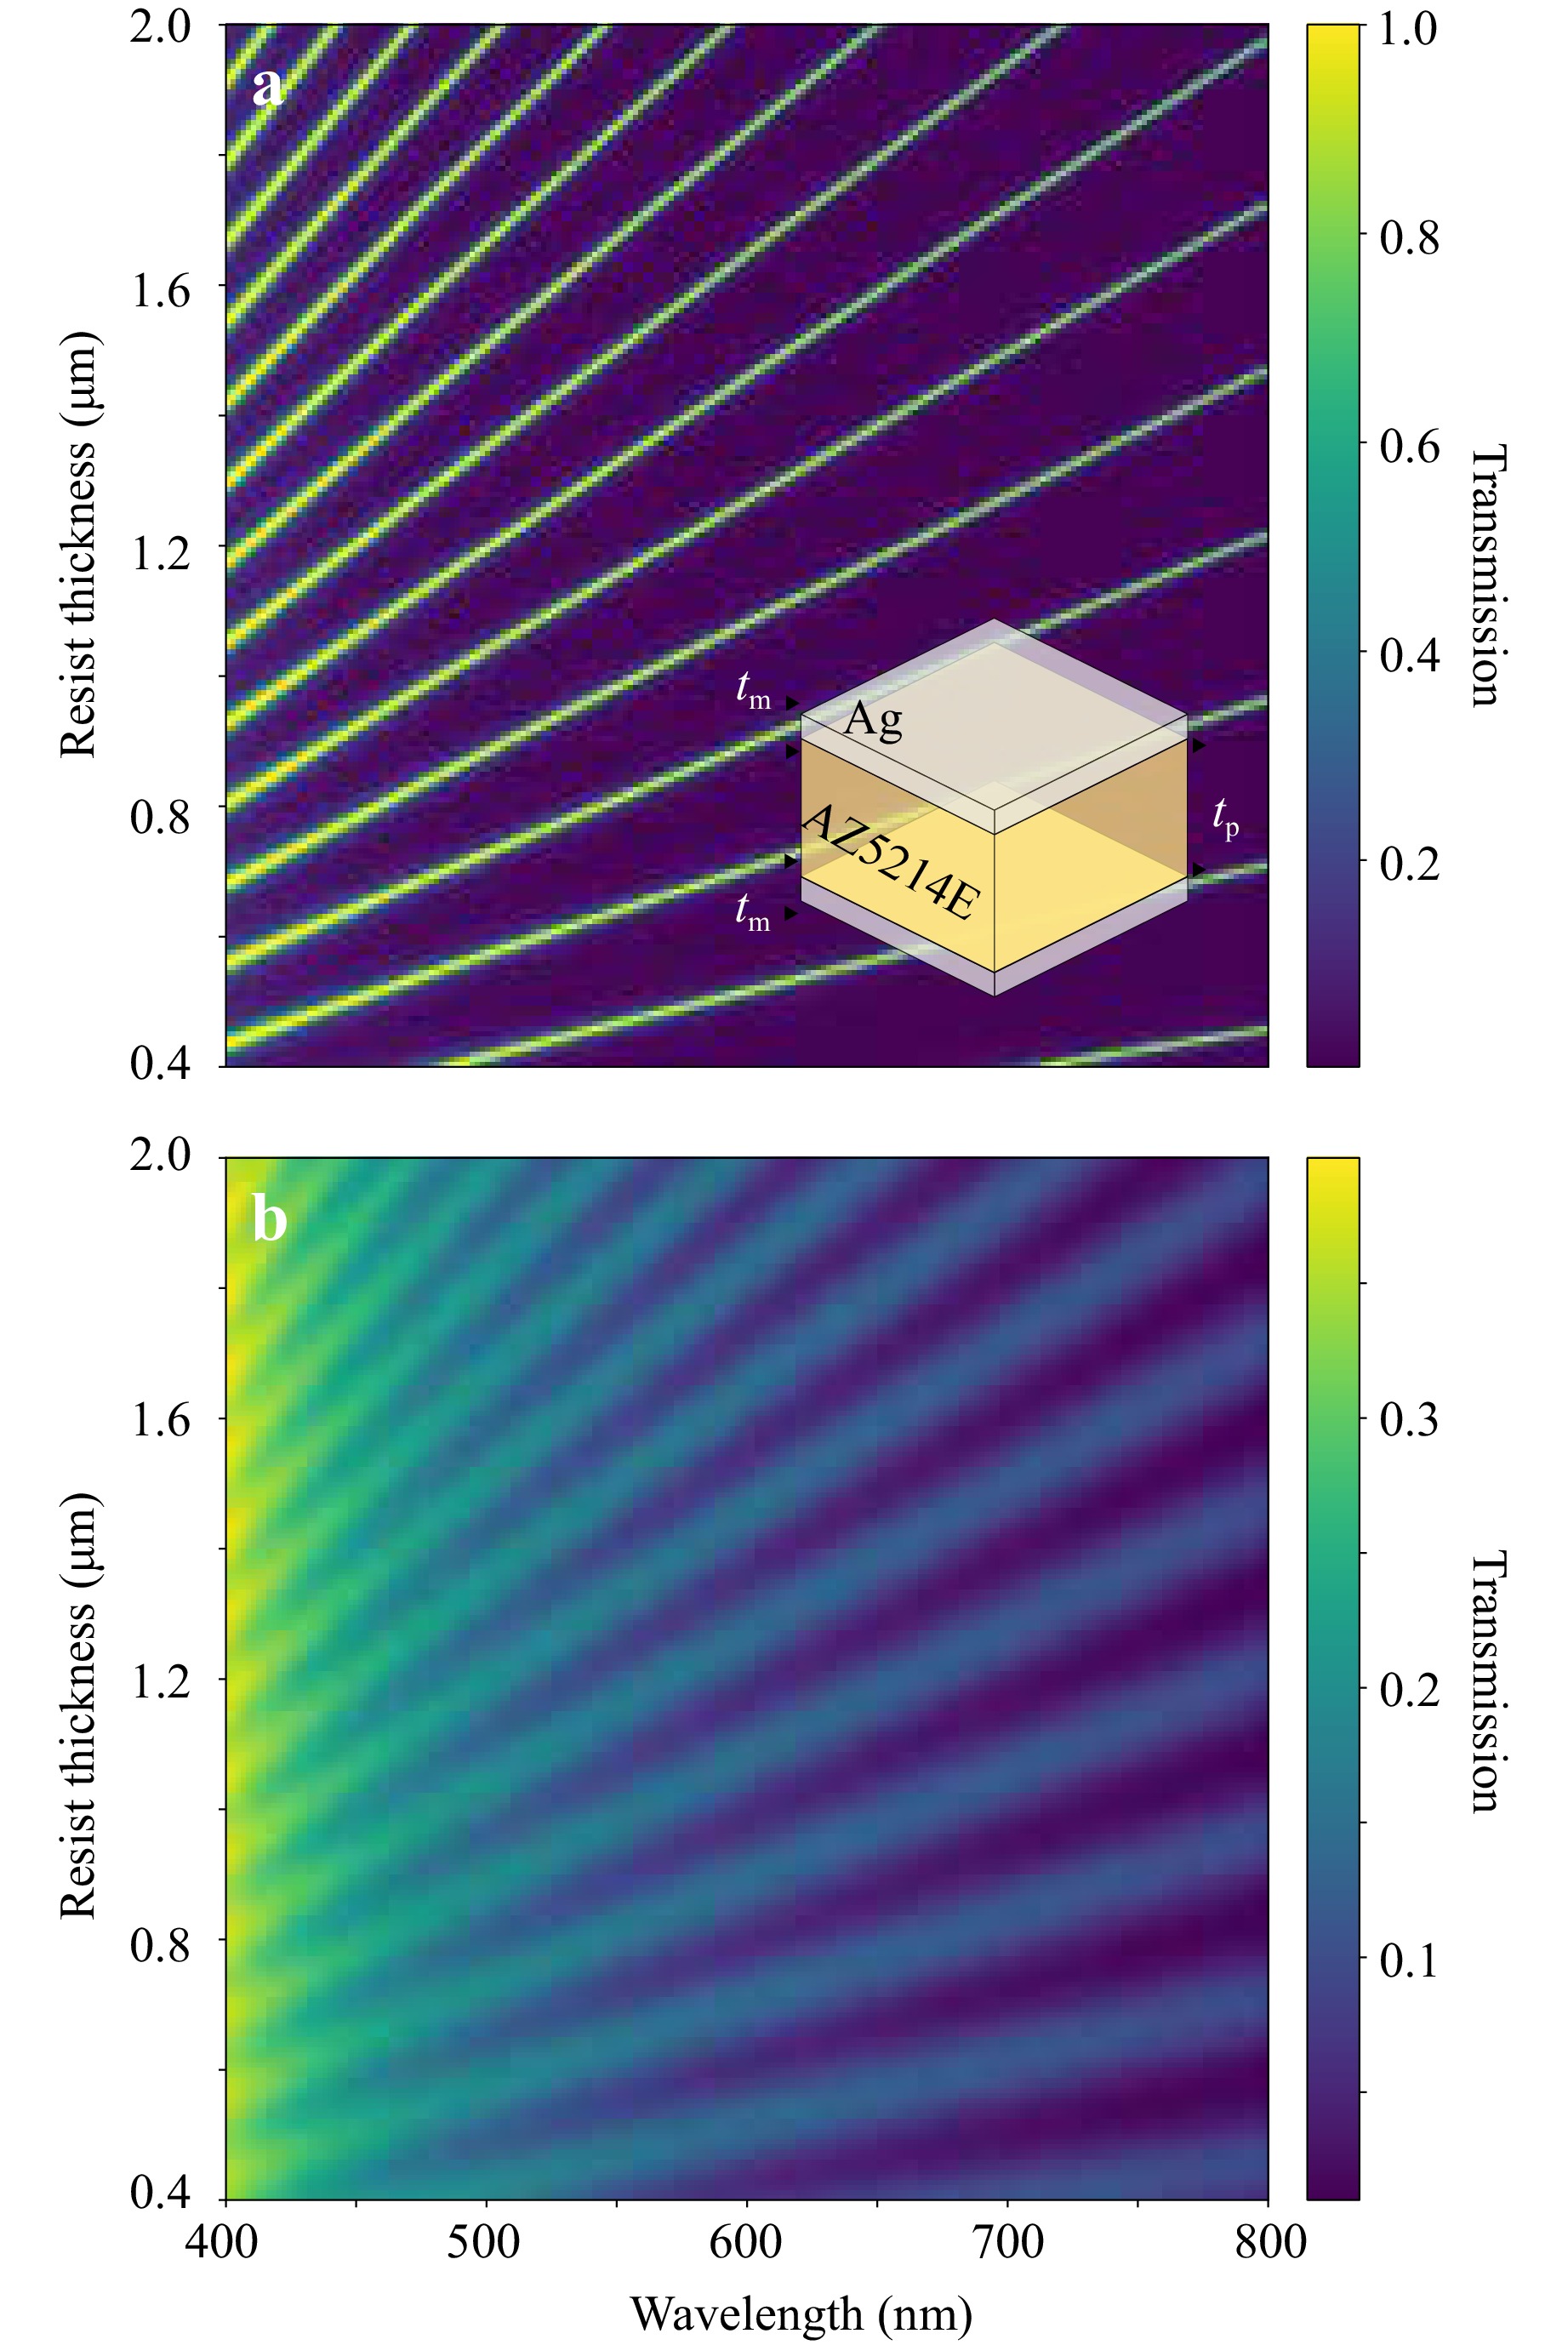
Fig. 4 Heat maps showing the results of multiple TMM Monte Carlo simulations of the Fabry-Perot filters for a range of mean thicknesses. The results for different Gaussian distributions are shown: (a) $ \sigma_p=0 $ and (b) $ \sigma_p=50 $ nm for a range of resist thicknesses.
We measured these experimental spectra using an OceanOptics SR4 visible spectrometer (spot diameter $ \approx $ 100 µm; see SI Fig. S5) with a ThorLabs tungsten-halogen light source (SLS201L). As the experimental spectra included broadening from local thickness variations, we used a Tikhonov-regularized inverse fitting scheme to extract the underlying thickness distribution30. The peaks in the measured spectra were identified through a prominence analysis, and the corresponding thicknesses were estimated using the Fabry-Perot resonance condition, $ 2Re\{n\}d = m\lambda+\phi $, where $ n $ is the refractive index, $ d $ is the cavity thickness, $ m $ is the mode order, $ \phi $ is the phase shift, and $ \lambda $ is the wavelength. A basis set of 200 simulated spectra was generated around this thickness estimate, spanning $ \pm 0.25 d $. Tikhonov regularization was used to provide an estimate of the underlying thickness distribution, which was approximately Gaussian. We then fit this thickness distribution with a Gaussian distribution to extract the mean thickness and standard deviation. This fitting procedure achieved a mean coefficient of determination of $ R^2 = 0.953\pm0.003 $, thus validating the approach.
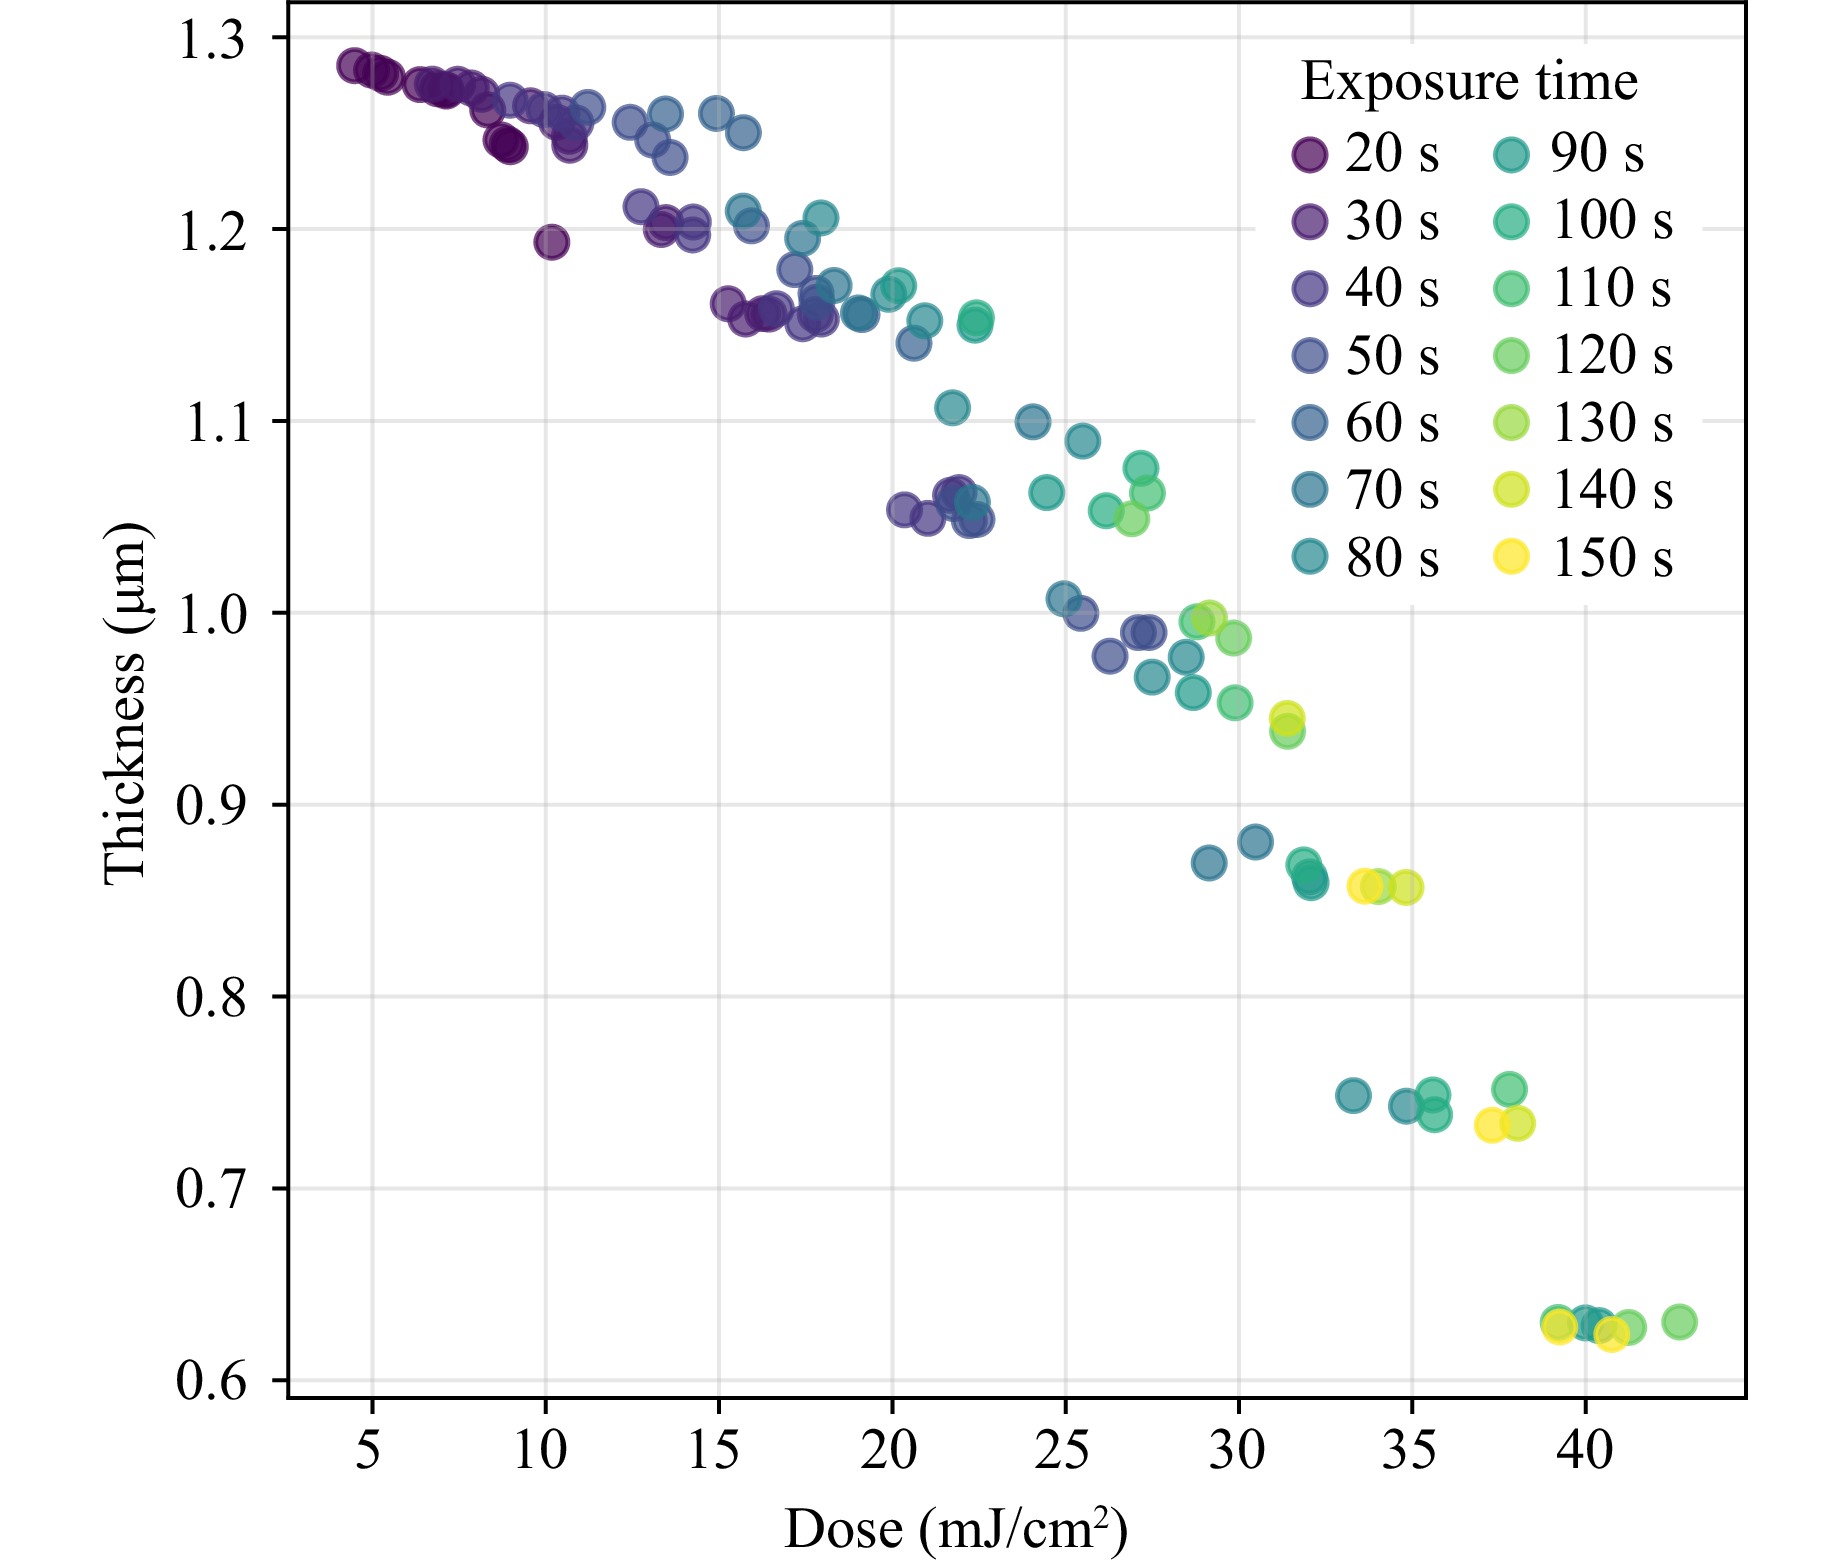
Fig. 5 Plot of the mean photoresist (i.e. cavity) thickness as a function the net dose received by the photoresist, with the point colour indicating exposure time.
-
Filters with cavity thicknesses starting from 600–1,300 nm were fabricated by varying the cumulative dose and multiplexing holograms. The dose was calculated by taking the total power of the replay field (as measured using a Thorlabs power meter; PM100) and distributing the fluence to each filter by imaging the replay field using a camera. From a pragmatic perspective, we note that this range of cavity thicknesses was a function of the resist thickness and dosage used in this study. Different cavity thickness ranges can be achieved by varying the dose and photoresist thickness or by using photoresists with varying relationships between exposure and development. Fig. 5 shows the strong correlation between dose and fitted mean thickness, showing that they broadly agreed with expected dose-development trends from the literature for other photoresists14,31. This demonstrated that although the total time of exposure varied significantly (by almost an order of magnitude) between the sets of 16 filters, the total dose was the largest contributing parameter that dictated the final thickness of the photoresist. Despite this strong relationship, a noticeable variation was observed in the doses for a given development or end thickness, with higher exposure times requiring a larger dose to achieve the same post-development thickness. This slight variation could be attributed to several potential effects, such as a slight nonlinear response of the CMOS image sensor used for dose allocation to the true light intensity or a dependence on exposure time as well as the dose for the photoresist development rate. This shows that careful calibration and understanding of these interplaying parameters are required for the precise control demanded by commercial realisation. Regardless, the wide tunability of photoresist exposure and development demonstrates that holographic grey-scale lithography can produce cavities spanning a thickness range of approximately 0.7 µm in a single exposure without recourse to multistep processes involving 16 different individual exposures and masks or mask realignments.
Fig. 6 shows a representative microscope image of a $ 4 \times 4 $ array, together with example spectra and fitted results. The transmission spectra show Fabry-Perot resonances whose peak wavelengths shifted predictably with the cavity thickness. Within a given $ 4 \times 4 $ array, the reproducibility was high, with filter elements of similar doses producing closely matched spectral features. Across the 14 stepped arrays, the systematic red shift with increased total dose demonstrated a controlled scaling of thickness by controlling the exposure time, laser power, and intensity determined by the target replay field.
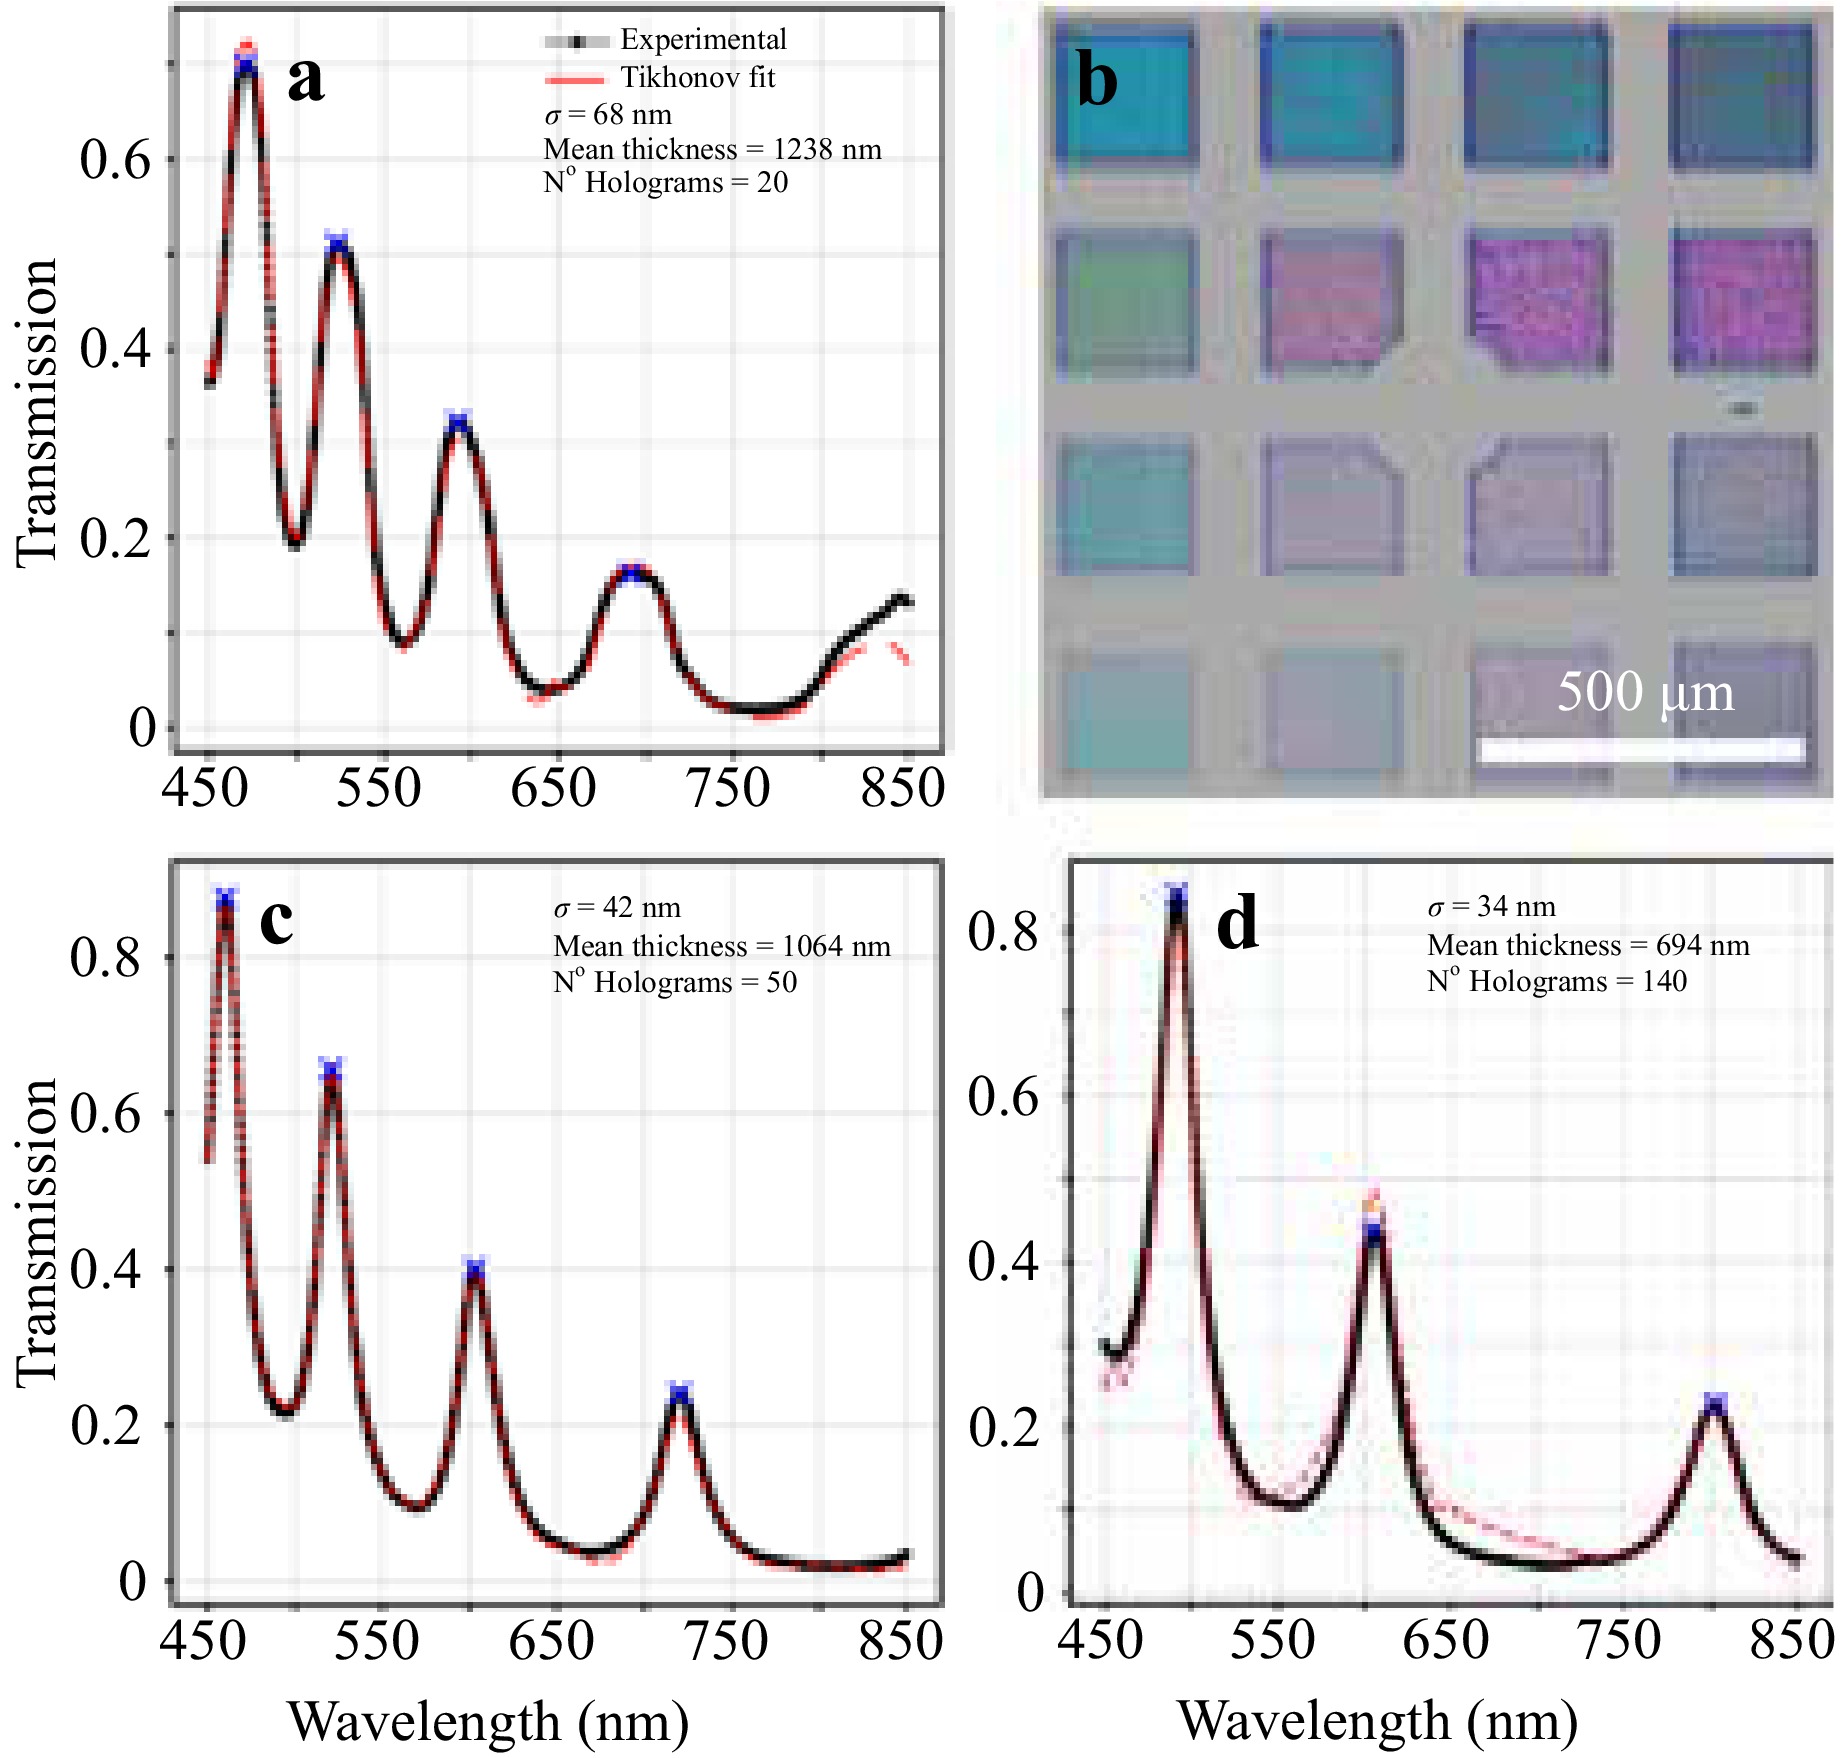
Fig. 6 a Optical image showing an example holographically patterned filter array, consisting of quartz, 26nm Ag, the developed photoresist, and 26 nm Ag. b-d Examples of measured transmission spectra showing the different spectral characteristics of filters with different thicknesses and the model fits, where $ \sigma $ corresponds to the fitted width of the Gaussian distribution of thicknesses, the mean thickness corresponds to the fitted mean thickness of the photoresist, and the $ N^o $ holograms correspond to the number of holograms used to create that specific filter.
Spectral linewidths in the samples described in this study were found to vary between approximately 10 and 30 nm, depending on wavelength and order, corresponding to fitted physical thickness spreads between 19 and 50 nm. These values were consistent with the TMM Monte Carlo simulations, which predicted a similar broadening of the Fabry-Perot peaks under (Gaussian) fluctuations in thickness. A typical $ R^2 \approx 0.95 $ indicated good agreement between the experiment and fitted simulation. A comparison between the simulated cases of $ \sigma_p = 0 $ and $ \sigma_p = 50\;{\rm{nm}} $ in Fig. 4 shows that varying the distributions of thicknesses present in a filter, modulated by speckle and/or speckle-like noise, can function as an intrinsic broadening mechanism for the transmission peaks.
A key advantage of holographic lithography is the ability to create multiple filter thicknesses during a single exposure. In contrast, conventional methods would require 16 separate exposures to fabricate a $ 4 \times 4 $ array of distinct Fabry-Perot cavities. Therefore, holographic grayscale lithography enables a significant reduction in process complexity. The presence of speckle-like noise, typically a limitation in display and projection applications, is repurposed as a design parameter: By adjusting the number of holograms and exposure time, we can tune the effective broadening of the transmission peaks. This represents a novel strategy for linewidth control without altering mirror reflectivity, which is the conventional approach in Fabry-Perot design32 and has yet to be demonstrably varied in multispectral filter arrays owing to the complexity of depositing distinct thicknesses of adjacent metals.
Interestingly, we note that the additional time multiplexing, defined by the total number of different holograms shown, used in this study can initially appear to increase the degree of roughness of the filters rather than decrease it. Fig. S3 shows the general trend in peak width for samples of different exposure times; while a broad increase in peak width was observed with exposure time, when the data were sectioned into regions of similar thickness (through k-means clustering) and plotted against the number of holograms, that trend was broadly reversed. Thus, given a dose leading to a particular thickness, increasing the number of holograms leads to a decrease in the roughness of the photoresist and narrows the transmission peak widths. A convenient method is to break down the trends into two competing effects: the first is the effect of prolonged exposure in the context of the nonlinear response of photoresists to cumulative doses31,33,34, where high-intensity and persistent speckles or speckle-like noise reaches saturation earlier than low-intensity regions, thereby amplifying local thickness variations with increasing exposure. Second, the opposing effect is the speckle averaging from time multiplexing, which is designed to reduce these nonuniformities. By displaying a large number of independently generated holograms, high-frequency spatial noise is averaged out, creating a smoother and more uniform exposure profile that decreases the final surface roughness.
No consistently visible persistent noise pattern was apparent in the different exposures, indicating that the noise due to the holograms was unlikely to be correlated, which is generally expected because of the randomisation of the phase during hologram generation. However, the increase in roughness with additional exposure time might indicate some noise independent of the randomisation of the initial phase of the holograms when generated, which may be a factor of the optical system beyond the LCOS-SLM used to modulate the phase. Alternatively, it could be a result of the development process, whereby the roughness distribution acts to increase as a ratio to the thickness (i.e. the thinner the developed polymer, the larger the rough features compared with the mean thickness). Consequently, prolonged exposure can enhance roughness despite time-multiplexing, which only serves to decrease roughness when the exposure dose is approximately the same. This highlights the importance of carefully balancing exposure time and multiplexing strategy for optimal filter quality. This trade-off effectively introduces an extra degree of freedom into the process. Our results show that the same total dose can be delivered with a low intensity over a long time or with a high intensity over a short time. This choice enables the tuneable control of the final surface roughness, which directly affects and controls the linewidths of the spectral peaks. The spatial scale of the noise (and, therefore, the resultant variations in thickness) is also a function of the focal length/magnification of the Fourier lens used to create the replay field. Thus, at higher magnifications, the noise has a higher spatial frequency, as it effectively 'shrinks' with the replay field. Thus, the magnification used for lithography also controls the characteristics of the peak-broadening effect described above.
The primary limitations of the current methodology are the exposure time and the presence of hologram-independent speckles (i.e. noise that persists across randomly generated holograms). However, this is primarily a technological constraint specific to the SLM used in this study. The development of higher-frame-rate SLMs is already leading to, and will, in the future, enable much shorter exposure times and, with additional optimisation of the optical system, include the implementation of commonly used speckle reduction techniques35,36.
By patterning Siemens stars using holographic lithography, we can approximate the resolution limit of the technique, as detailed in the Supplementary Information (see SI Fig. S4). This methodology, similar to an optical MTF10 measurement of an imaging system's resolution, reported lithographic feature sizes down to approximately 1 µm; however, this type of measurement effectively averages out roughness/perturbations to the resist due to speckle-like noise. Thus, by eye, we also measured the smallest feature present on all spokes to be approximately less than 2.5 µm, giving a more conservative estimate. This is comparable to the results reported for holographic projection lithography for binary (i.e. non-grayscale) patterns22−24, approaching the classical diffraction limit of a system of approximately 0.5 µm. Recent work on advanced CGH algorithms and intermediary optics has shown the possibility of surpassing the classical diffraction-limited resolution38, demonstrating that holographic lithography will likely become a rich area of research for nanofabrication and beyond.
In summary, holographic grayscale lithography has enabled the single-exposure fabrication of Fabry-Perot filter arrays with tuneable cavity thicknesses and peak widths, resulting in predictable or expected optical responses. We developed a distributive simulation and fitting process that enabled us to accurately model the linewidth variation with approximated Gaussian distributions in thickness. Thus, the method consolidates the previously required multiple exposures into a single step, leverages speckle-like noise for linewidth control, and achieves a strong agreement between the experiments and TMM-based simulations, while retaining the ability to pattern features as small as 1−2.5 µm. This study demonstrated both the feasibility and potential of holographic grayscale lithography within the classical approach for scalable multispectral filter array production. Generally, it is comparable to alternative lithographic approaches; thus, it has many applications in reducing the complexity of fabrication for various uses of traditional lithography. For future research, owing to the flexibility of holograms and their control over the field of light, we anticipate that this technique will be extended to three dimensional lithography.
-
We have presented a proof-of-concept for holographic grayscale lithography of Fabry-Perot filter arrays. By leveraging SLM-based computer-generated holography, we demonstrated the single-exposure fabrication of arrays spanning cavity thicknesses of 600–1,300 nm. the transmission spectra agreed strongly with transfer-matrix simulations. More importantly, we showed that speckle-like noise can be repurposed as a controllable parameter for linewidth tuning, providing a novel design strategy that surpasses conventional reflectivity-based approaches. Compared with traditional lithography, which requires multiple steps, our method demonstrates the fabrication of multiple distinct filters in a single step, significantly reducing the process complexity. The achieved resolution of 1−2.5 µm approaches the optical diffraction limit and represents a state-of-the-art technique in holographic grayscale lithography. With ongoing advances in high-frame-rate SLMs and speckle management, this approach is readily scalable to smaller pitches and enables direct integration with CMOS sensors. Our results establish holographic grayscale lithography as a promising platform for compact, reconfigurable, and mass-producible multispectral imaging devices.
-
O.J.B. acknowledges support from his Oppenheimer Early Career Research Fellowship. J.A.-W. acknowledges the support of his Royal Society Dorothy Hodgkin Research Fellowship. The authors also acknowledge support from the EPSRC (EP/V055003/1, EP/Z002583/1) and the ERC Proof of Concept Grant: BeyondHySpec.
Single-step holographic grayscale lithography of Fabry-Perot filter arrays
- Light: Advanced Manufacturing , Article number: 76 (2026)
- Received: 13 November 2025
- Revised: 22 April 2026
- Accepted: 24 April 2026 Published online: 09 June 2026
doi: https://doi.org/10.37188/lam.2026.076
Abstract: Multispectral filter arrays underpin compact spectral imaging but are typically fabricated through complex multistep photolithography. Herein, we demonstrate a single-step holographic grayscale lithography method that uses a spatial light modulator to directly write Fabry-Perot filter arrays. A phase-retrieval algorithm is used to compute holograms that project grayscale intensity patterns onto a photoresist, enabling cavity thicknesses ranging from 600 to 1,300 nm across a single exposure. In this study, transmission spectra were modelled using transfer-matrix simulations with Monte Carlo averaging to capture thickness variations, and experimental spectra were fitted via Tikhonov-regularized inversion. Good agreement was observed between the theory and experiment (R2 $\approx$ 0.95). We demonstrated that speckle-like noise, which is typically detrimental to projection systems, can be exploited as a design parameter to broaden Fabry-Perot resonances in a controllable manner. Additionally, the method can achieve lateral resolutions down to 1−2.5 µm depending on the resolution criteria, thus representing the highest resolution reported for holographic projection lithography and comparable to many commercial direct-write techniques. This approach consolidates multiple fabrication steps, offering a scalable and tuneable route toward integrated multispectral filter arrays compatible with CMOS imaging technology.
Research Summary
Single-Step Holographic Grayscale Lithography of Fabry-Perot Filter Arrays
Multispectral filter arrays for compact imaging are typically made through complex, multi-exposure photolithography — a new holographic approach achieves the same in a single step. Oliver J. Burton, Marco Astarita and colleagues at the University of Cambridge and collaborating institutions demonstrate a method using spatial light modulators to display holograms that project grayscale intensity patterns onto photoresist, fabricating Fabry-Perot filter arrays with cavity thicknesses spanning 600-1,300 nm in one exposure. Transfer-matrix simulations with Monte Carlo averaging accurately modelled the resulting transmission spectra (R² ≈ 0.95). Notably, speckle-like noise, ordinarily a drawback in projection systems, is repurposed as a tunable parameter for controlling spectral linewidths. In conventional lithography, independently varying the linewidth of adjacent filters without altering mirror reflectivity is extremely challenging; holographic grayscale lithography achieves this naturally, offering a scalable and reconfigurable route toward integrated multispectral imaging devices.
Rights and permissions
Open Access This article is licensed under a Creative Commons Attribution 4.0 International License, which permits use, sharing, adaptation, distribution and reproduction in any medium or format, as long as you give appropriate credit to the original author(s) and the source, provide a link to the Creative Commons license, and indicate if changes were made. The images or other third party material in this article are included in the article′s Creative Commons license, unless indicated otherwise in a credit line to the material. If material is not included in the article′s Creative Commons license and your intended use is not permitted by statutory regulation or exceeds the permitted use, you will need to obtain permission directly from the copyright holder. To view a copy of this license, visit http://creativecommons.org/licenses/by/4.0/.

 DownLoad: