


-
When I read the book by Sean Johnston, Holographic Visions1, I felt a strong sense of dissatisfaction. The laser hologram was a wonderful discovery, but what did it really accomplish? Johnston spent chapters discussing its role in art etc. and only nine pages on holographic interferometry, which is unquestionably the most profound application of the hologram. Holographic interferometry makes the fullest use of a hologram’s ability to reproduce the optical field reflected or transmitted by an object, and it utilizes two unforeseen capabilities of a hologram. First, a hologram can record fields that are incoherent and reconstruct them coherently so that they can interfere in its reconstructed field. Second, a hologram can reconstruct the optical field from an object with such fidelity that it can interfere with the original field from the object when the hologram is relocated in its original position.
In the section of Holographic Visions devoted to it2, Sean Johnston credits the discovery of holographic interferometry to Emmet Leith and Juris Upatnieks at the Willow Run Laboratories of the Institute of Science and Technology of the University of Michigan. He based that on email communications and cites Robert Powell and me as having rediscovered it. From December 24, 1962, when the first laser hologram was made (I was in the laboratory doing other work that day and remember it well) until the publication of 3D holograms in December of 19643, this laboratory had the field to itself. On 19 December 1963 they observed a black spot in a hologram reconstruction of a sheet of paper fastened to a plate with a bolt hole in it, and in March 1964 they observed fringes in an unsupported edge of a cardboard sheet cemented to an aluminum block. These are clearly the first observations of phenomena that would be called holographic interferometry once it was discovered and understood,
Johnston’s account of the “rediscovery” made by Robert Powell and me is based upon a letter dated 14 Oct. 1976 by Powell to P. Jackson at what was then the Museum of Holography in New York and is now at the MIT museum. Powell’s letter describes a hologram with vague fringes in it that was our first observation of an interference effect in a hologram reconstruction. Unfortunately, his memory was in error, and he ascribed the fringes to cooling beeswax, which we used as an adhesive. My memory of this is quite different. I had settled on using bee’s wax as an adhesive for our setups because I was concerned that any glue might have an unknown curing time during which it might change an object’s position during a recording. The wax formed a good bond with objects, and, once it cooled, it stayed put exactly. There was never any degradation of a hologram due to cooling bee’s wax. The hologram to which Powell referred to was made when we were searching for a holder for the holographic plates. I found a U-shaped frame slightly larger than our 4" × 5" plates, and wedged the hologram plate into it against a piece of rubber. This was unstable, and in the hologram reconstruction we saw an ill-defined set of diagonal bands that looked somewhat like interference fringes. I quickly abandoned that holder and we had a proper one made. That hologram was set aside without further consideration at the time. Of the two of us, I was the primary experimentalist and did the bulk of equipment manipulation.
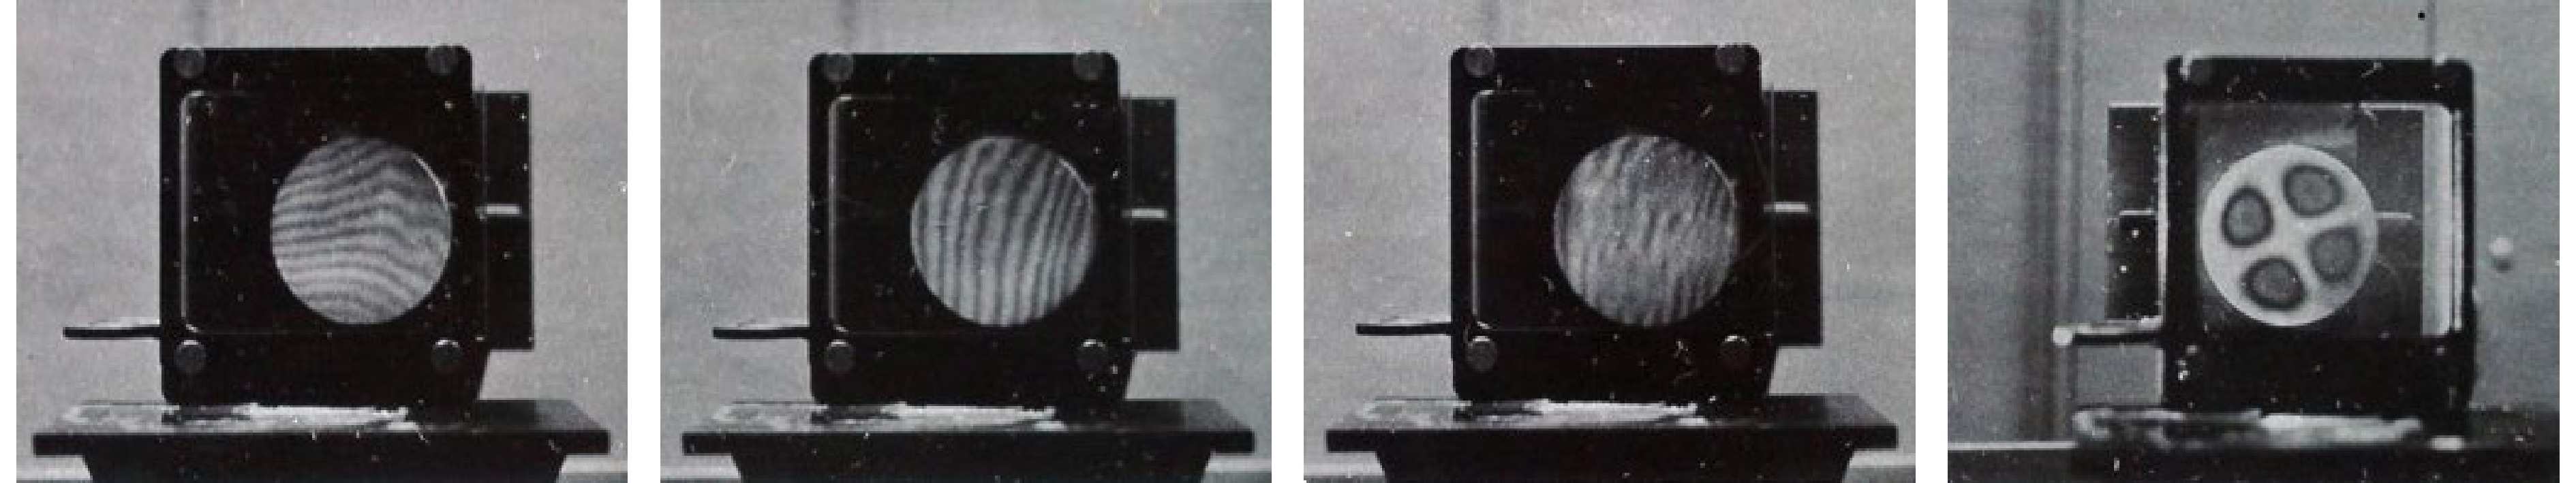
One day, I entered our laboratory and found a colleague, Fred Rotz, using a spectrometer to measure our laser’s coherence. He and others were speculating that the laser might not be as coherent as the manufacturers claimed. The Spectra-Physics representative had told me that these lasers emitted 3 longitudinal modes, and thus their longitudinal coherence would be periodic in twice the cavity length, which was 60 cm. I decided we should demonstrate that, and set up an experiment where the unexpanded object beam struck an object set between two parallel mirrors. We positioned our hologram plate so that we could look through it over one mirror into the other and see a sequence of images, each 10 cm further in path length. We recorded several holograms with zero-path length lying at different points in that sequence of dots, and all of these holograms exhibited a periodic variation in image brightness as a function of path length just as we expected. A photograph of one of these reconstructions is shown in Fig. 1.
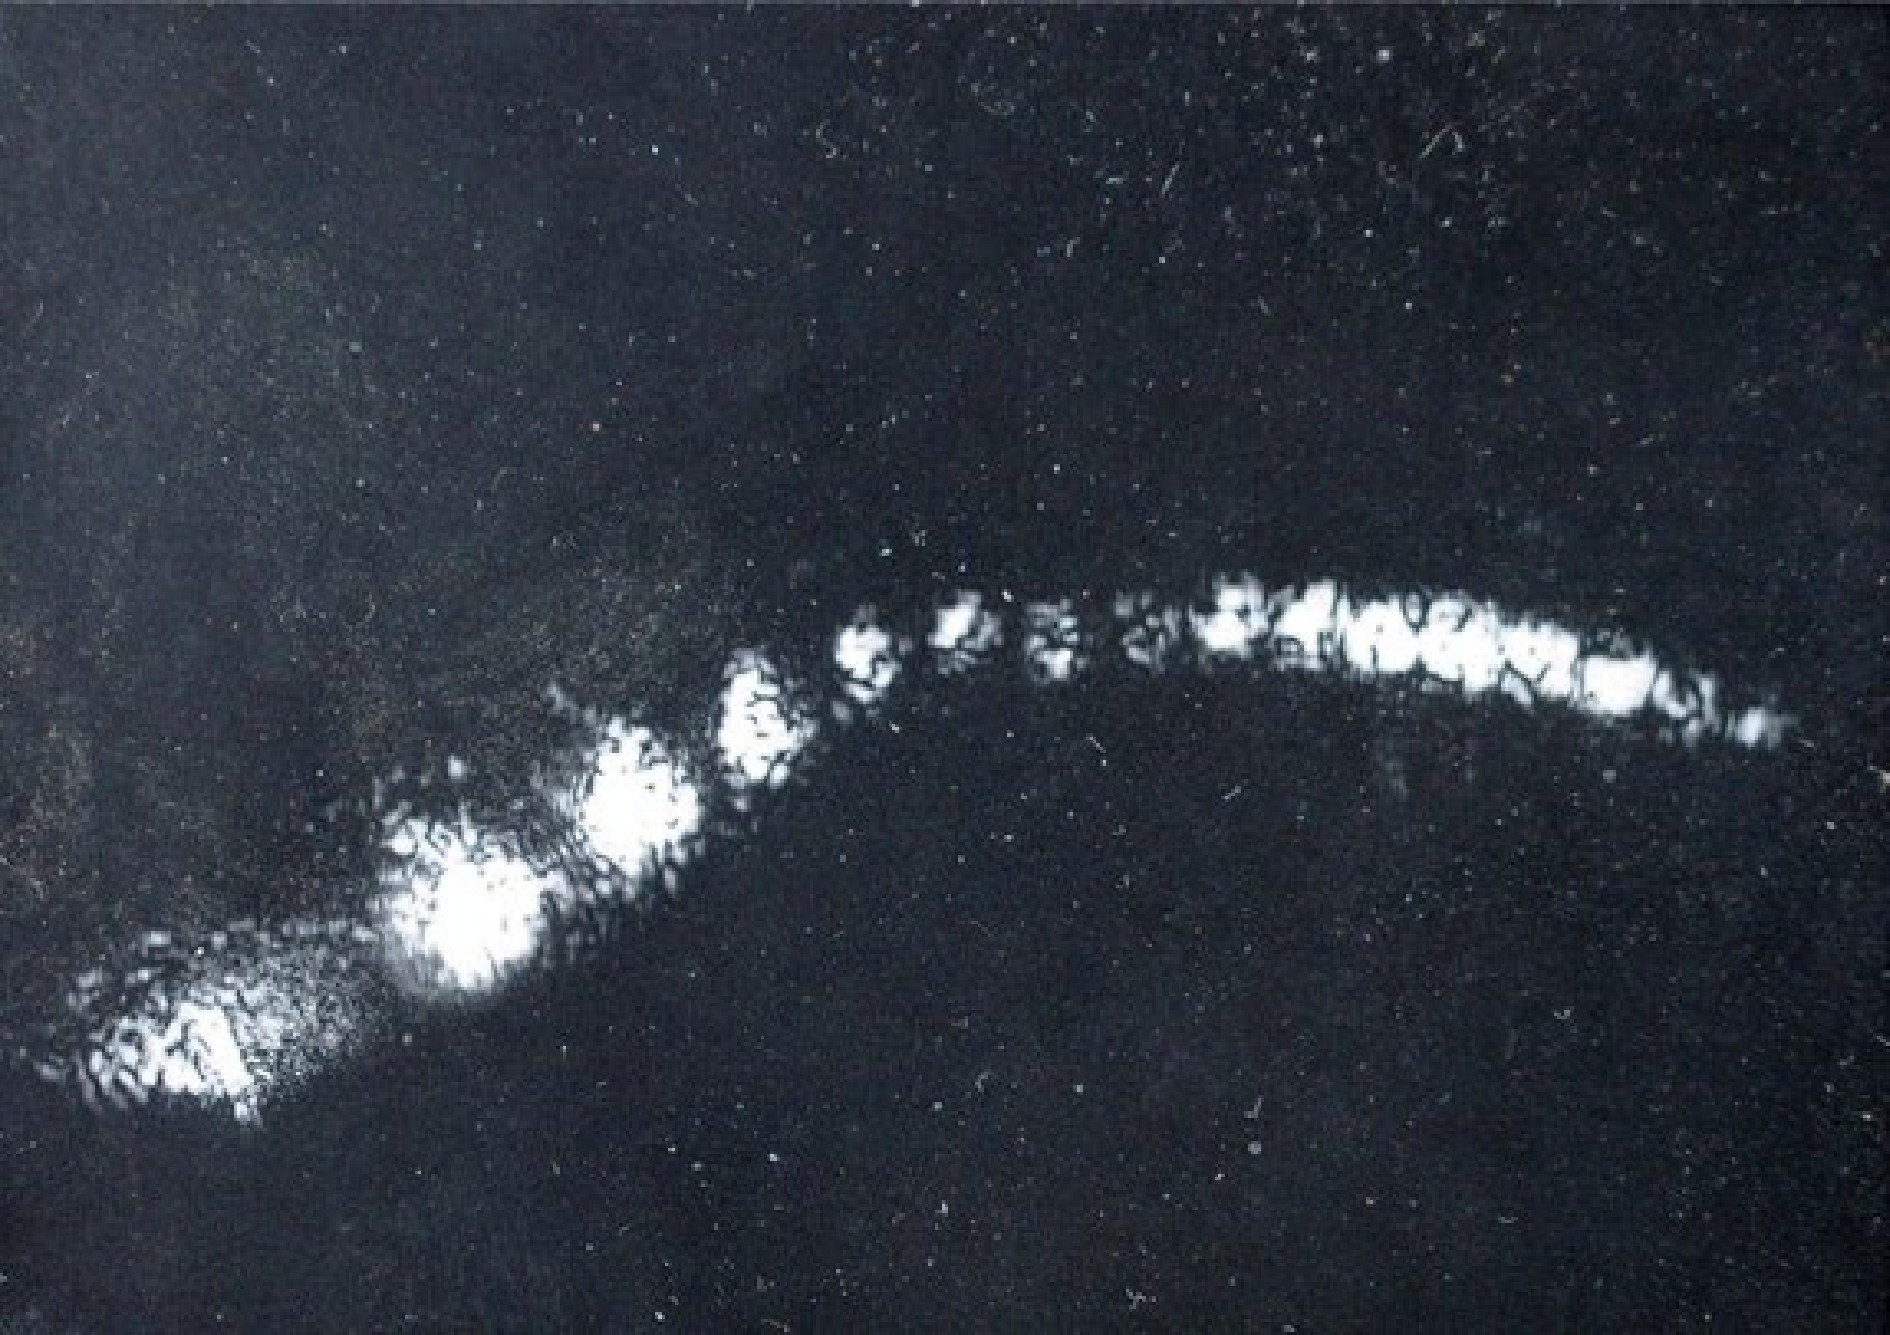
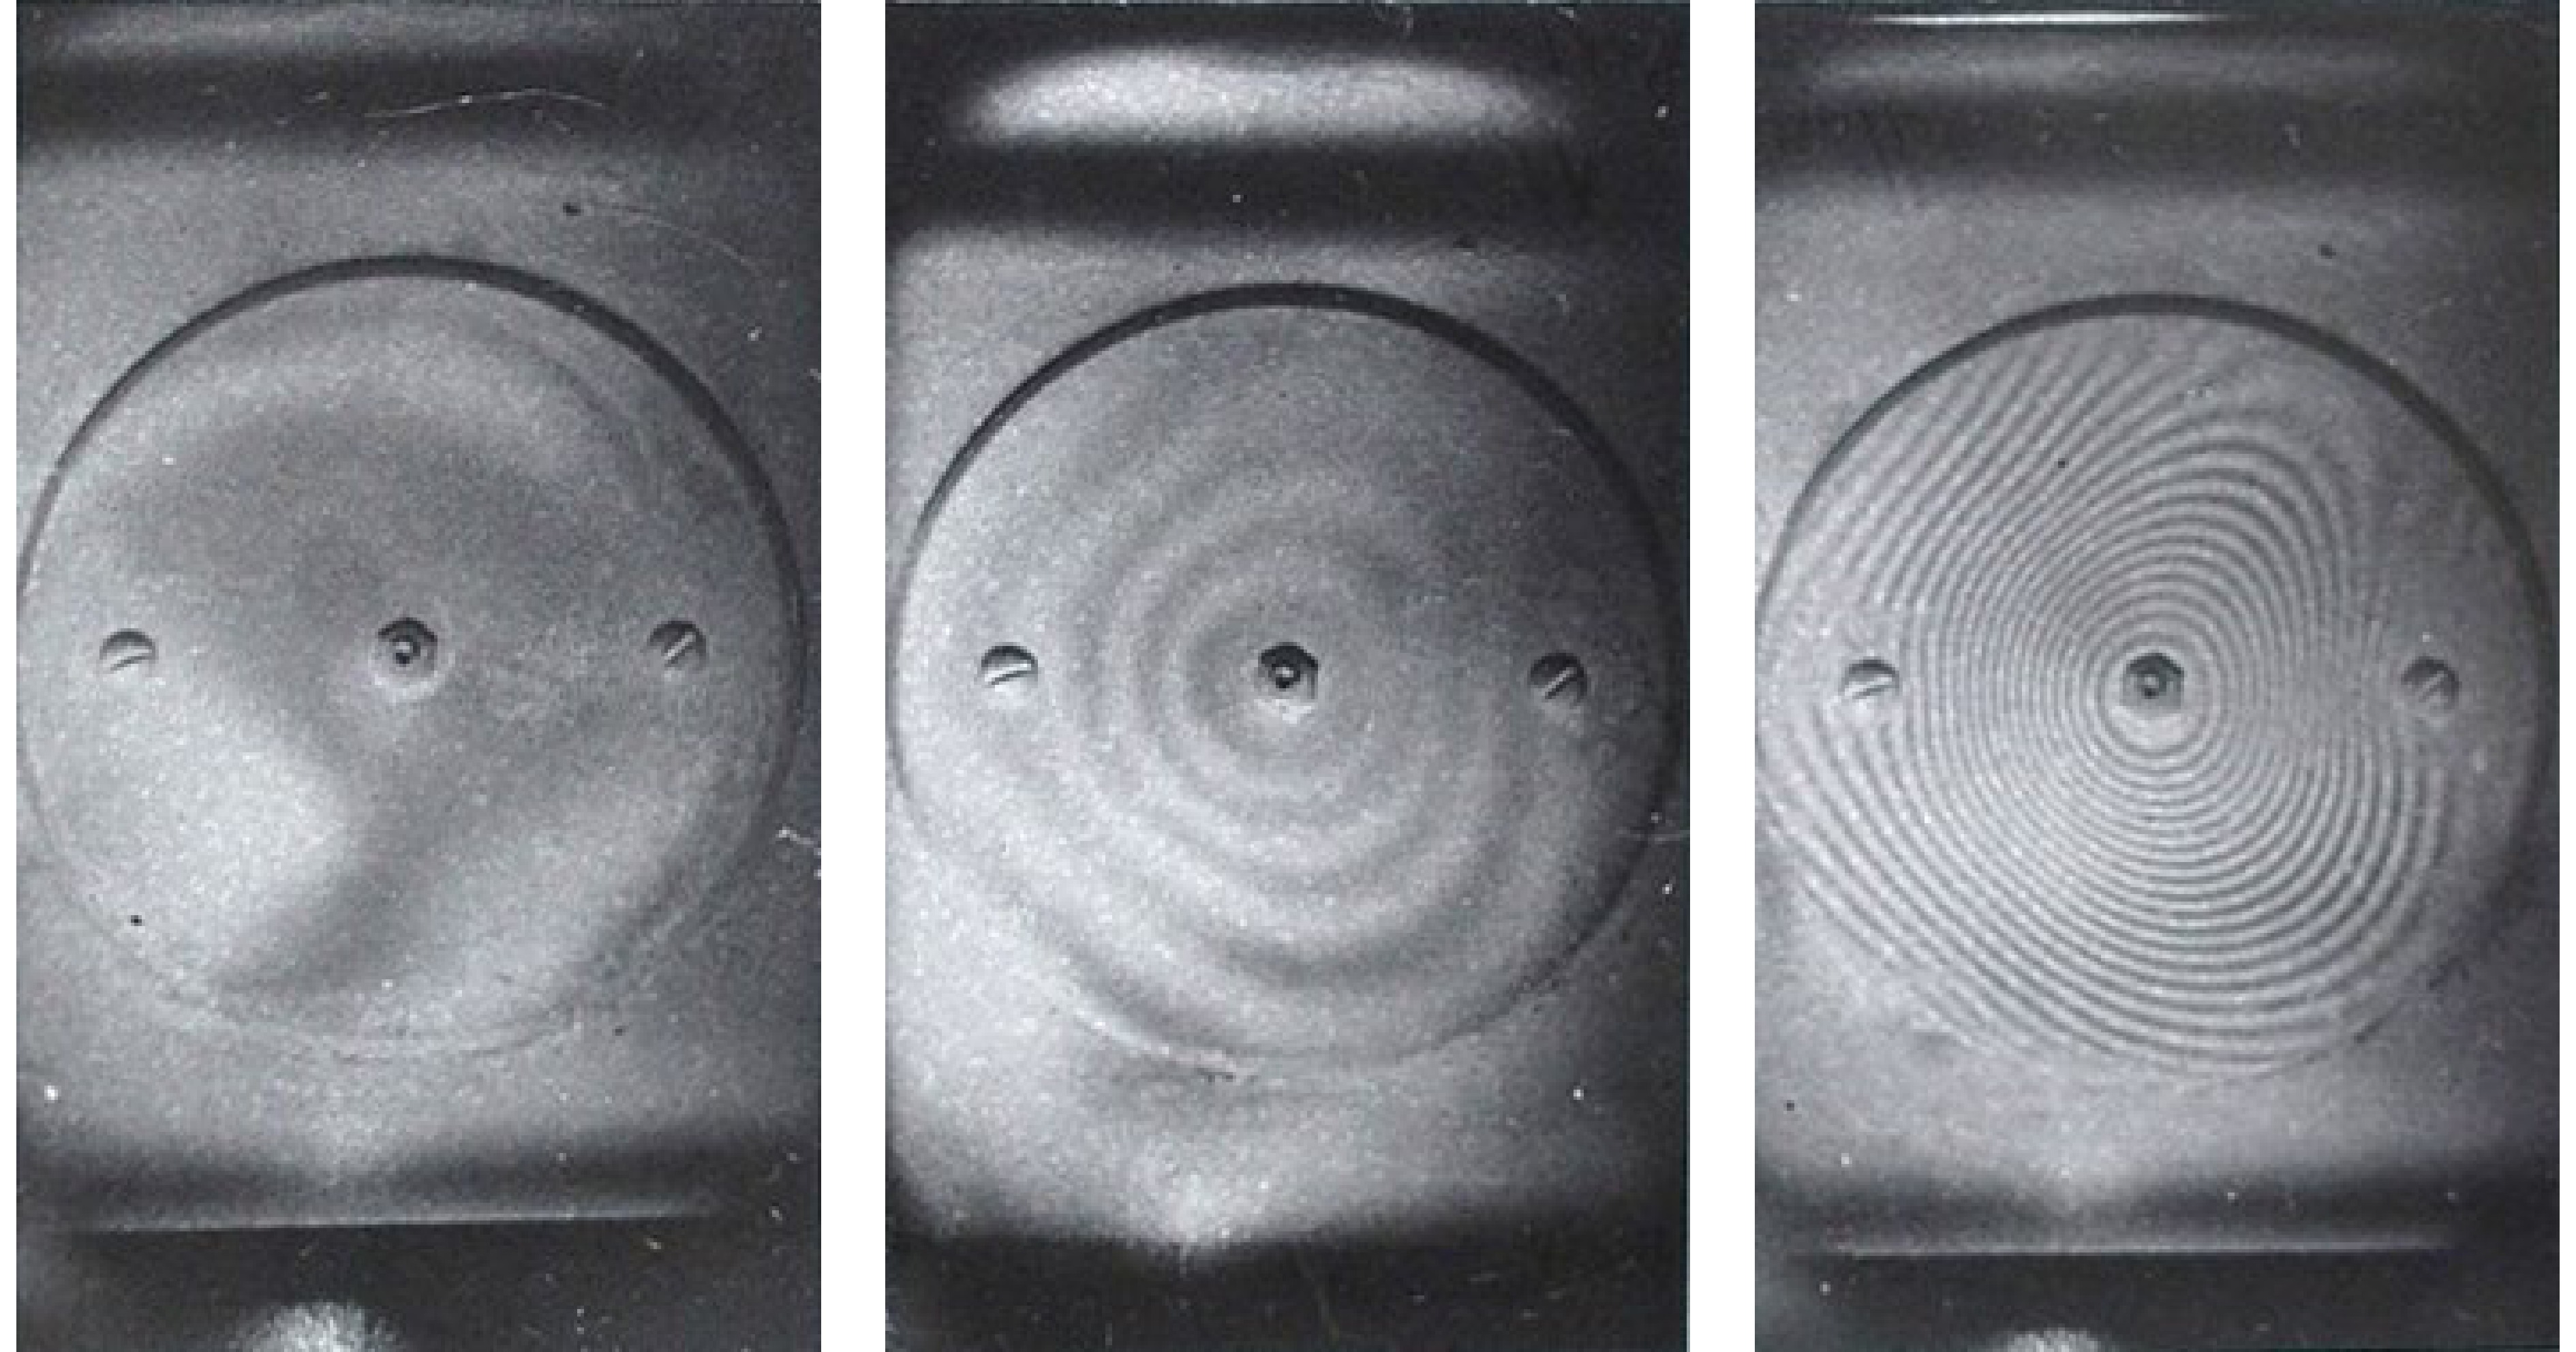
We noticed in one of these holograms what looked like a horizontal black fringe in the nearest image of the object beam spot. More importantly, this fringe moved as we raised or lowered our view through the hologram, so it was clearly not something on the object itself. We immediately set up an experiment to contain the entire object beam on a white surface, and capture the entire reference beam on the hologram plate. This recording gave us fringes that moved as we raised or lowered the point through which we looked on the hologram plate. A photograph of the reconstruction of this hologram is shown in Fig. 2. I checked the laser and found that it was operating in more than one transverse mode. It was a Spectra-Physics/Perkin-Elmer model 110 laser that had a confocal mirror configuration, a spherical output mirror and a flat high reflectance mirror at the center of curvature of the spherical mirror. The discharge tube was located between these two mirrors. There was a longitudinal adjustment for the flat mirror, and a single TEM00 mode was only obtained when the distance was set correctly. We initially had a combination of a 00 mode and a 20 mode and, after adjusting the laser, we recorded a hologram with a 00 mode and a 10 mode.
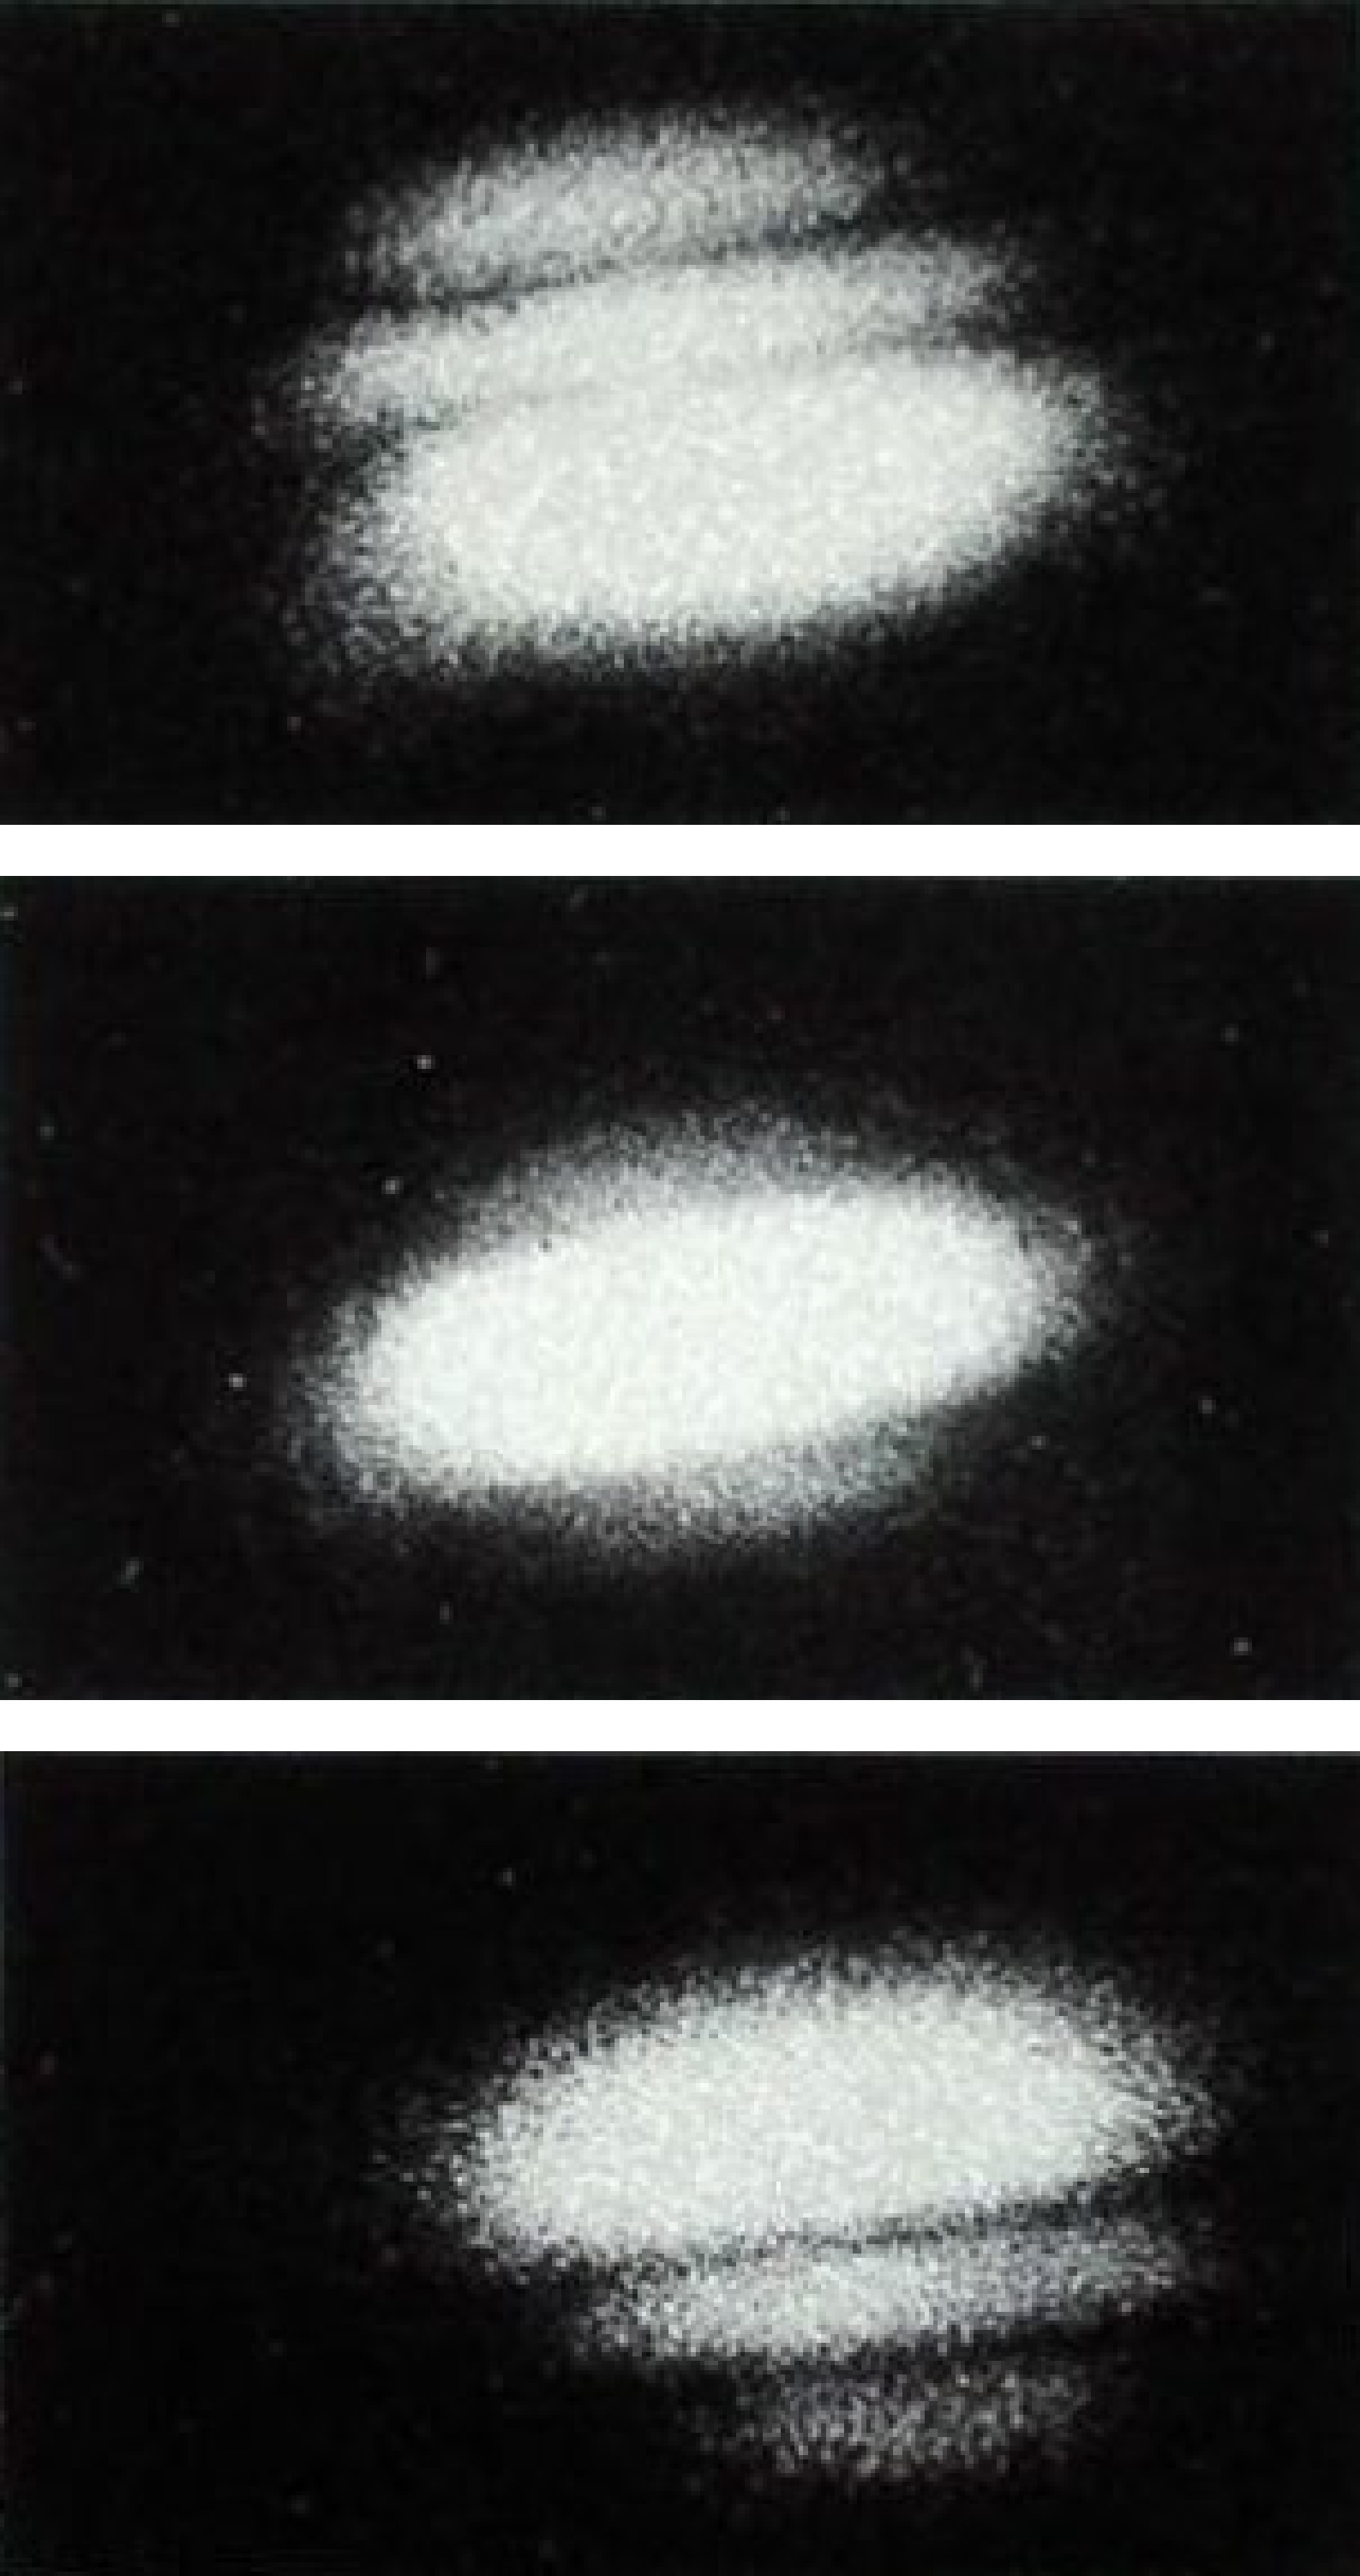
Fig. 2 Reconstructions from a hologram of the object beam illuminating an area on a white background where the laser was operating in a combination of TEM00 and TEM02 modes5. Adapted from Ref. 5 with permission from Optica Publishing Group.
The three images are the spots as seen through the top, center, and bottom of the hologram, which contained the entire reference beam.The question was: What gave us these fringes? I suggested to Bob that the photographic plate was recording separate holograms for each mode combination of the object and reference beams. When the hologram was reconstructed, however, both recordings reconstructed their respective object beams, but since both fields were now being generated by the same reconstruction beam, the two reconstructed fields could interfere. The shifting of the fringe positions would be due to phase variations between the two transverse mode recordings. Bob found this very disturbing, because it meant that fields that were incoherent during the recording of a hologram were being made coherent in its reconstruction. At this point that I referred back to the hologram we had made with the plate wedged against the rubber pad as proof of what I was suggesting. Bob was still unconvinced, and I said something like, “look, if we record a double-exposure hologram and give the object as small rotation between the exposures, wouldn’t we expect to see fringes in the reconstruction?” That question spurred immediate action. It took us some time to learn how much rotation to give the object, hologram plate, or reference beam, but we got this to work and showed double-exposure interference patterns in hologram reconstructions, as shown in Fig. 3.
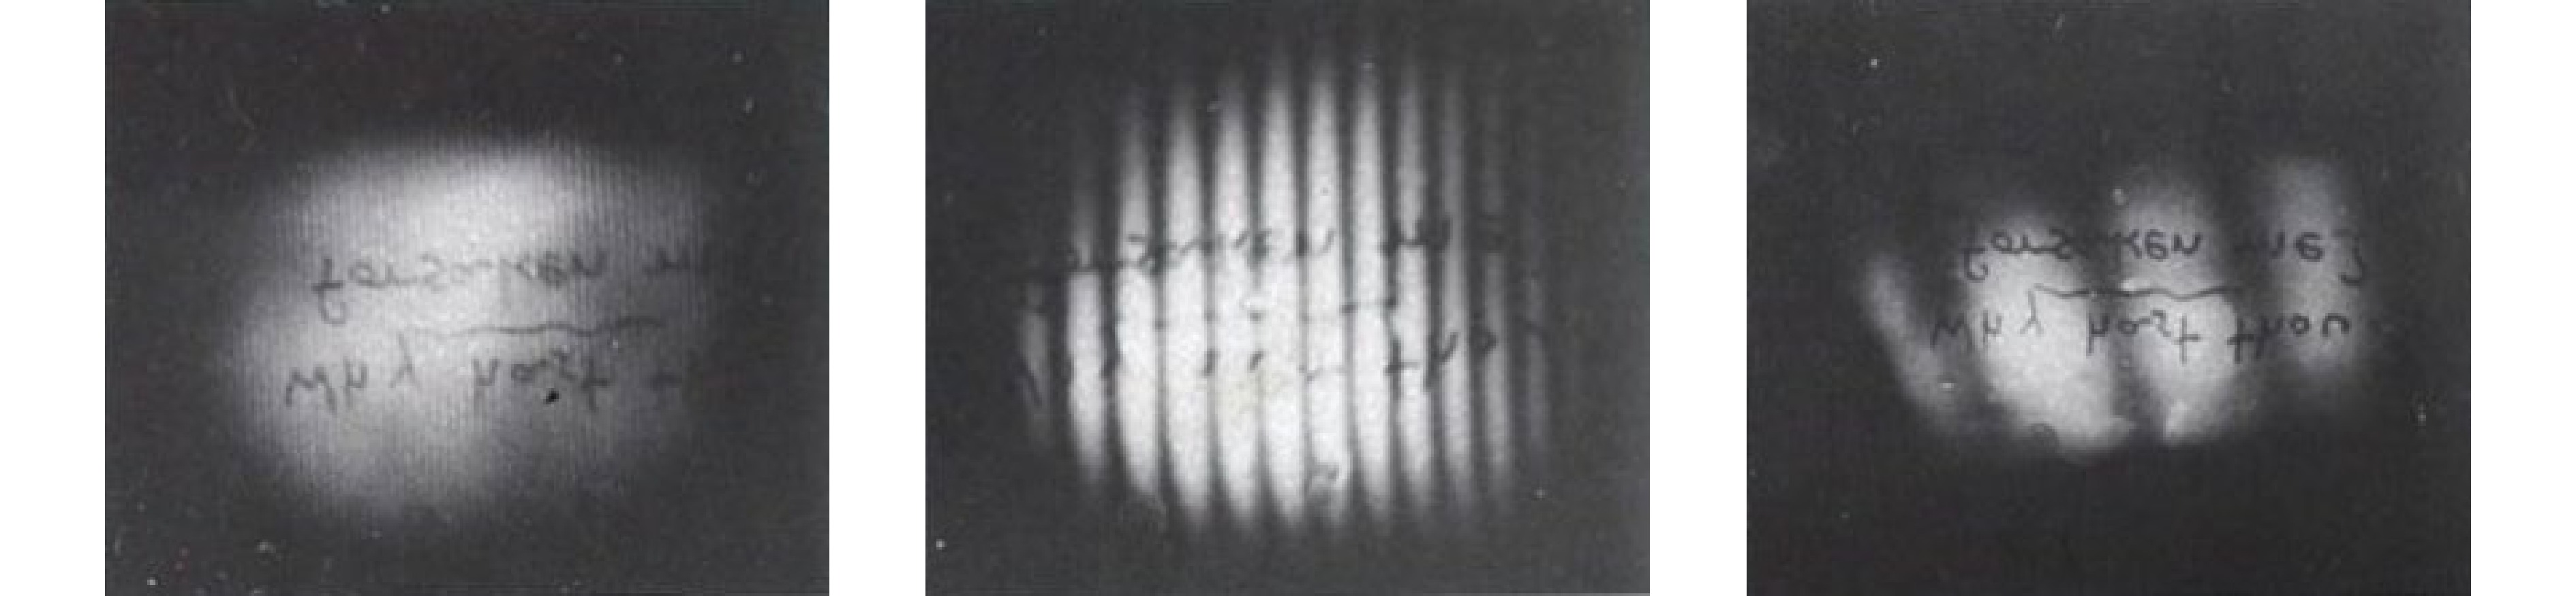
Fig. 3 Reconstructions from double-exposure holograms where the object was given small rotations between exposures.
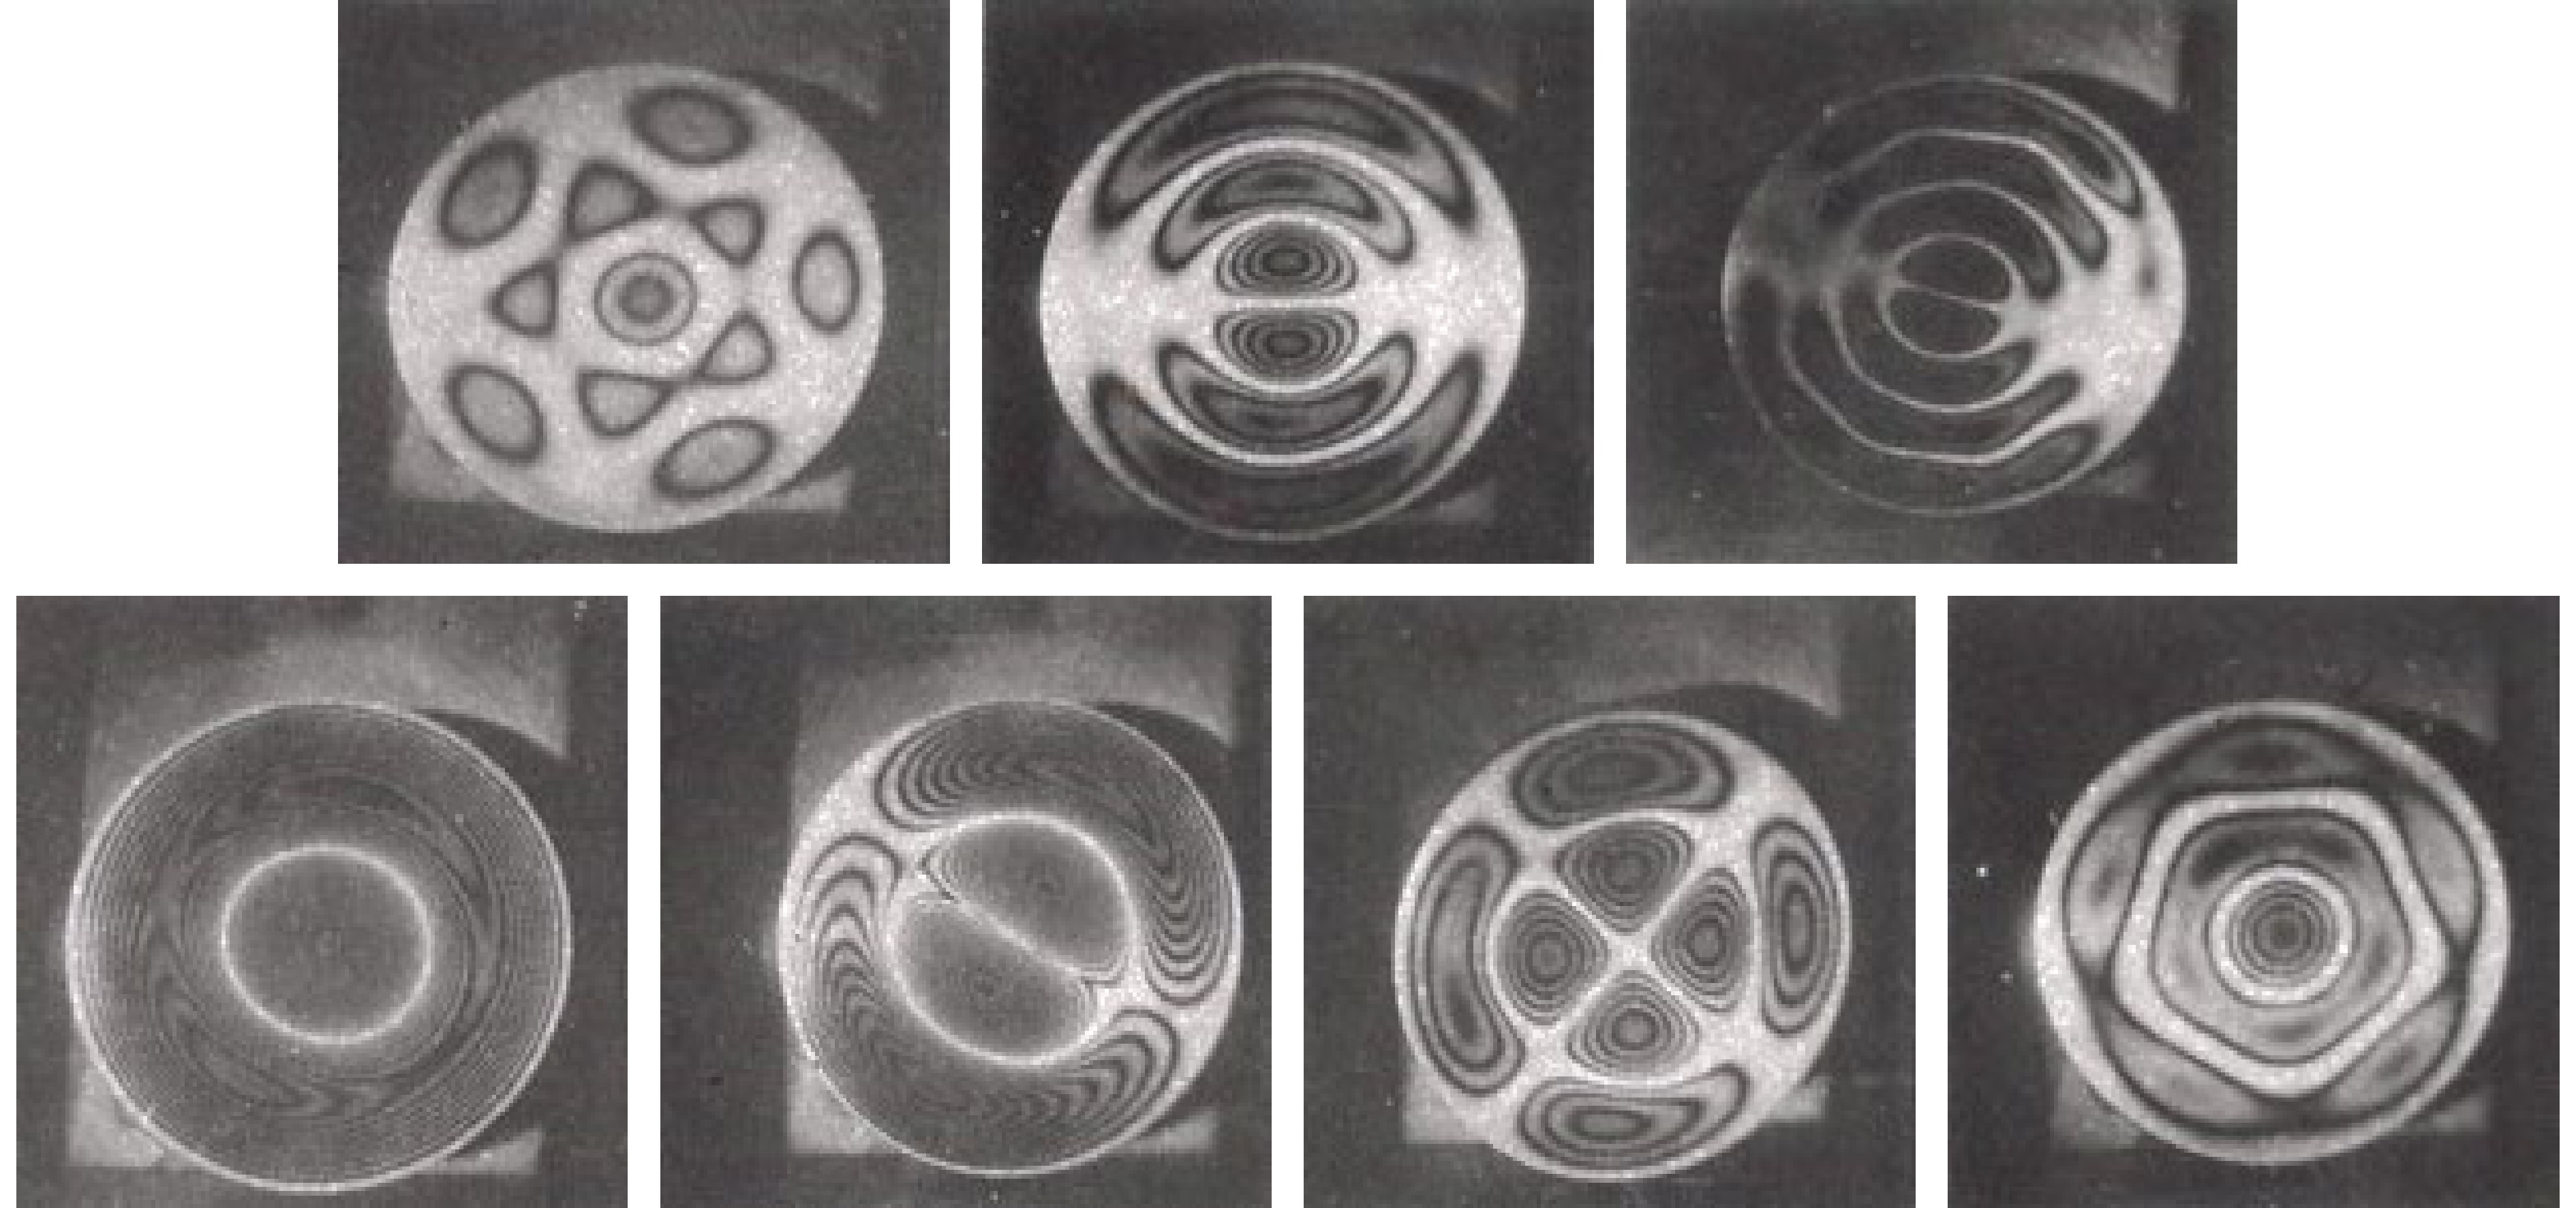
In the first figure, the fringes are too fine to resolve, but were quite visible in the original.As with Leith and Upatnieks, our object was a sheet of paper cemented to an aluminum plate, and in one of the double-exposure reconstructions, we noticed a perturbation of the fringes in a region where there was a bolt hole. In retrospect, I’m sure the paper had statically deformed between the two exposures, but at the time we wondered if the effect could be vibration. We set up a 35 mm film can with a solenoid mounted under it, and this generated the remarkable set of J0 fringe patterns which we presented at the 1965 spring meeting of the Optical Society of America and published in the December 1965 issue of JOSA4. Reconstructions of seven holograms showing vibration modes are shown in Fig. 4.
The point is that Robert Powell and I observed a phenomenon, studied it in detail, proposed an explanation, and then tested and confirmed that explanation, in contrast to the mere observations made by Leith and Upatnieks. I feel that observation of a phenomenon does not count as a discovery. Human beings observed for centuries that the planets move relative to the stars, but Copernicus discovered that this was best explained by a heliocentric solar system. People observed lightning for all of human history, but Benjamin Franklin discovered that it was an electrical discharge. So, the question is: Did Leith and Upatnieks perceive the two properties of holograms that I defined in my opening paragraph and thus understand the concept of holographic interferometry? I think not, and the evidence is found in the patent filed under their names for holographic vibration analysis, US patent number 3548643, which I will discuss later.
As we submitted our paper to the OSA for the spring meeting of the Optical Society of America at Dallas, TX, in April 1965, I proposed to Emmett that we should also present a paper on the entire set of experiments we had done defining holographic interferometry. He vetoed the idea saying that one paper was adequate, an unfortunate decision, and the reason for it became clear to me in 1970. We presented this additional material at the OSA annual meeting in Philadelphia in October 1965, and published it in JOSA in September 19665.
Bob and I searched for prior work using interferometry for vibration analysis and came up with the paper by Harold Osterberg6, which identified the fringes we saw in our reconstructions as a zero-order Bessel function of the first kind. It also suggested a method for real-time vibration analysis. Just after the spring meeting of the OSA, it occurred to me that if we could replace a hologram in its holder accurately enough, its reconstruction ought to interfere with the field from the original object. We tried this and it worked. Interference between the original object and its hologram reconstruction are shown in Fig. 5.
Kenneth Haines and Percy Hildebrand, who also worked in the Willow Run Laboratory, were thinking about holography in April 1965. They borrowed our real-time holography setup to record the holograms they used for real-time interferometry showing deformation of a plate due to bolt tightening, as shown in Fig. 6.
At the time, Bob and I thought that it was good to have more people participating in this work, but it proved otherwise. I have long regretted that we didn’t put a dc current through the solenoid with which we had excited vibrations on our 35 mm film can. We could easily have shown its static deformation, both in double-exposure and real-time holographic interferometry.
In April 1966, Haines and Hildebrand published a paper7 that presented real-time interferometry between an object and its hologram reconstruction as a new method. Our prior work8 is described by the sentence “A related technique for vibration measurement was used by Powell and Stetson.” The primary content of this paper is their analysis of the fringes and fringe localization. Unfortunately, both this paper and a nearly identical paper following it9 were mathematically dense and never provided insight into fringe localization.
Johnston quotes Hildebrand regarding his communication to Emmett Leith in the spring of 1965 as recounted to patent attorneys in 1970, and this confirms our priority. Percy didn’t realize that I had recorded the same ideas in my notebook two weeks earlier and that Leith “did not mention Karl’s entry to me when he signed mine because he didn’t want a conflict to arise. However, he foresaw the present problem, which of course doesn’t help me now.” That problem was the division of the initial U of M patent on holographic interferometry.
The initial University of Michigan patent application on holographic interferometry was filed in 1965 with six names: Emmett Leith, Juris Upatnieks, Robert Powell, Karl Stetson, Kenneth Haines, and Percy Hildebrand to reflect the work all of us had done on this discovery. In 1970, I was at the National Physical Laboratory in Teddington, UK and received a communication from an English solicitor representing the United States lawyers who were handling this patent application. I was told that the initial patent application was being broken up into three applications, each based upon the work initially done by each pair of inventors, Leith & Upatnieks, Stetson & Powell, and Haines & Hildebrand. In particular, the invention of holographic vibration analysis was being filed by Leith & Upatnieks, based on the disclosure they filed in April of 1964. I do not have the papers connected with this, but I am quite sure that Powell and I were credited with the discovery of real-time interferometry between an object and its hologram reconstruction, and Haines and Hildebrand were credited with the concept of holographic contouring by varying laser wavelengths. Leith, Upatnieks, Haines, and Hildebrand had all signed the necessary documents, but Robert Powell was raising objections.
They provided me with a copy of the initial disclosure on vibration analysis by Leith & Upatnieks. After carefully reading this document, I pointed out that it contained no reference to interference within the reconstruction of a hologram, and it did not mention any fringes within the hologram reconstruction. Essentially, the disclosure filed by Leith & Upatnieks described a hologram reconstruction that would be analogous to a Chladni pattern, where small particles on a vibrating surface migrate away from vibration antinodes and collect at vibration nodes. It would be bright at the vibration nodes and dark in the antinodes. Before I would sign their documents, I required that all reference to fringes and all mention of how to measure vibration amplitude within antinode of a vibrating object via its holographic reconstruction be removed from the claims of the patent. This effectively neutered it. There is one mention of fringes in the discussion section, and there are drawings sketching some of the results that Powell and I obtained, but none of this is claimed. In retrospect, I should have insisted on expunging all mention of fringes and any of our work from the entire document, but since the legal teeth of a patent are its claims, I let it go. Powell accepted the modifications I had obtained, and signed the documents also. So far as I know, the other two applications were never awarded patents, and all searches I have performed support that conclusion. I do not know if they were ever filed. Anyone who has worked with lawyers will attest that had there been any way in which the Leith-Upatnieks disclosure or anything in their notebooks could have been used to argue that they understood that the concepts of holographic interferometry, I could never have imposed the restrictions I did. For this reason, I feel justified in saying that Robert Powell and I discovered holographic interferometry. Juris Upatnieks confirmed this for me in an email communication: “We observed the effect and noted it, but did not get into any detail. Our main interest was image quality.”
One possible contender for prior discovery was Melvin H. Horman10. He presented a paper at the same OSA meeting in Dallas where we presented our vibration work, and published in Applied Optics in March of 1965, with a received date of October 1964. His paper was theoretical with no experimental work, and it proposed that a hologram could replace an object in an otherwise conventional Mach-Zehnder interferometer. To perceive that theoretically was impressive, but there is no mention of the fundamentals of holographic interferometry.
The year 1965 saw a number of independent discoveries of holographic interferometry. Collier, Doherty, and Pennington11, described interference effects within a hologram reconstruction as a moiré effect. Pulsed laser holographic interference was reported by Brooks, Heflinger, and Wuerker12, and the interferogram of shock waves around a fired bullet is shown in Fig. 7.
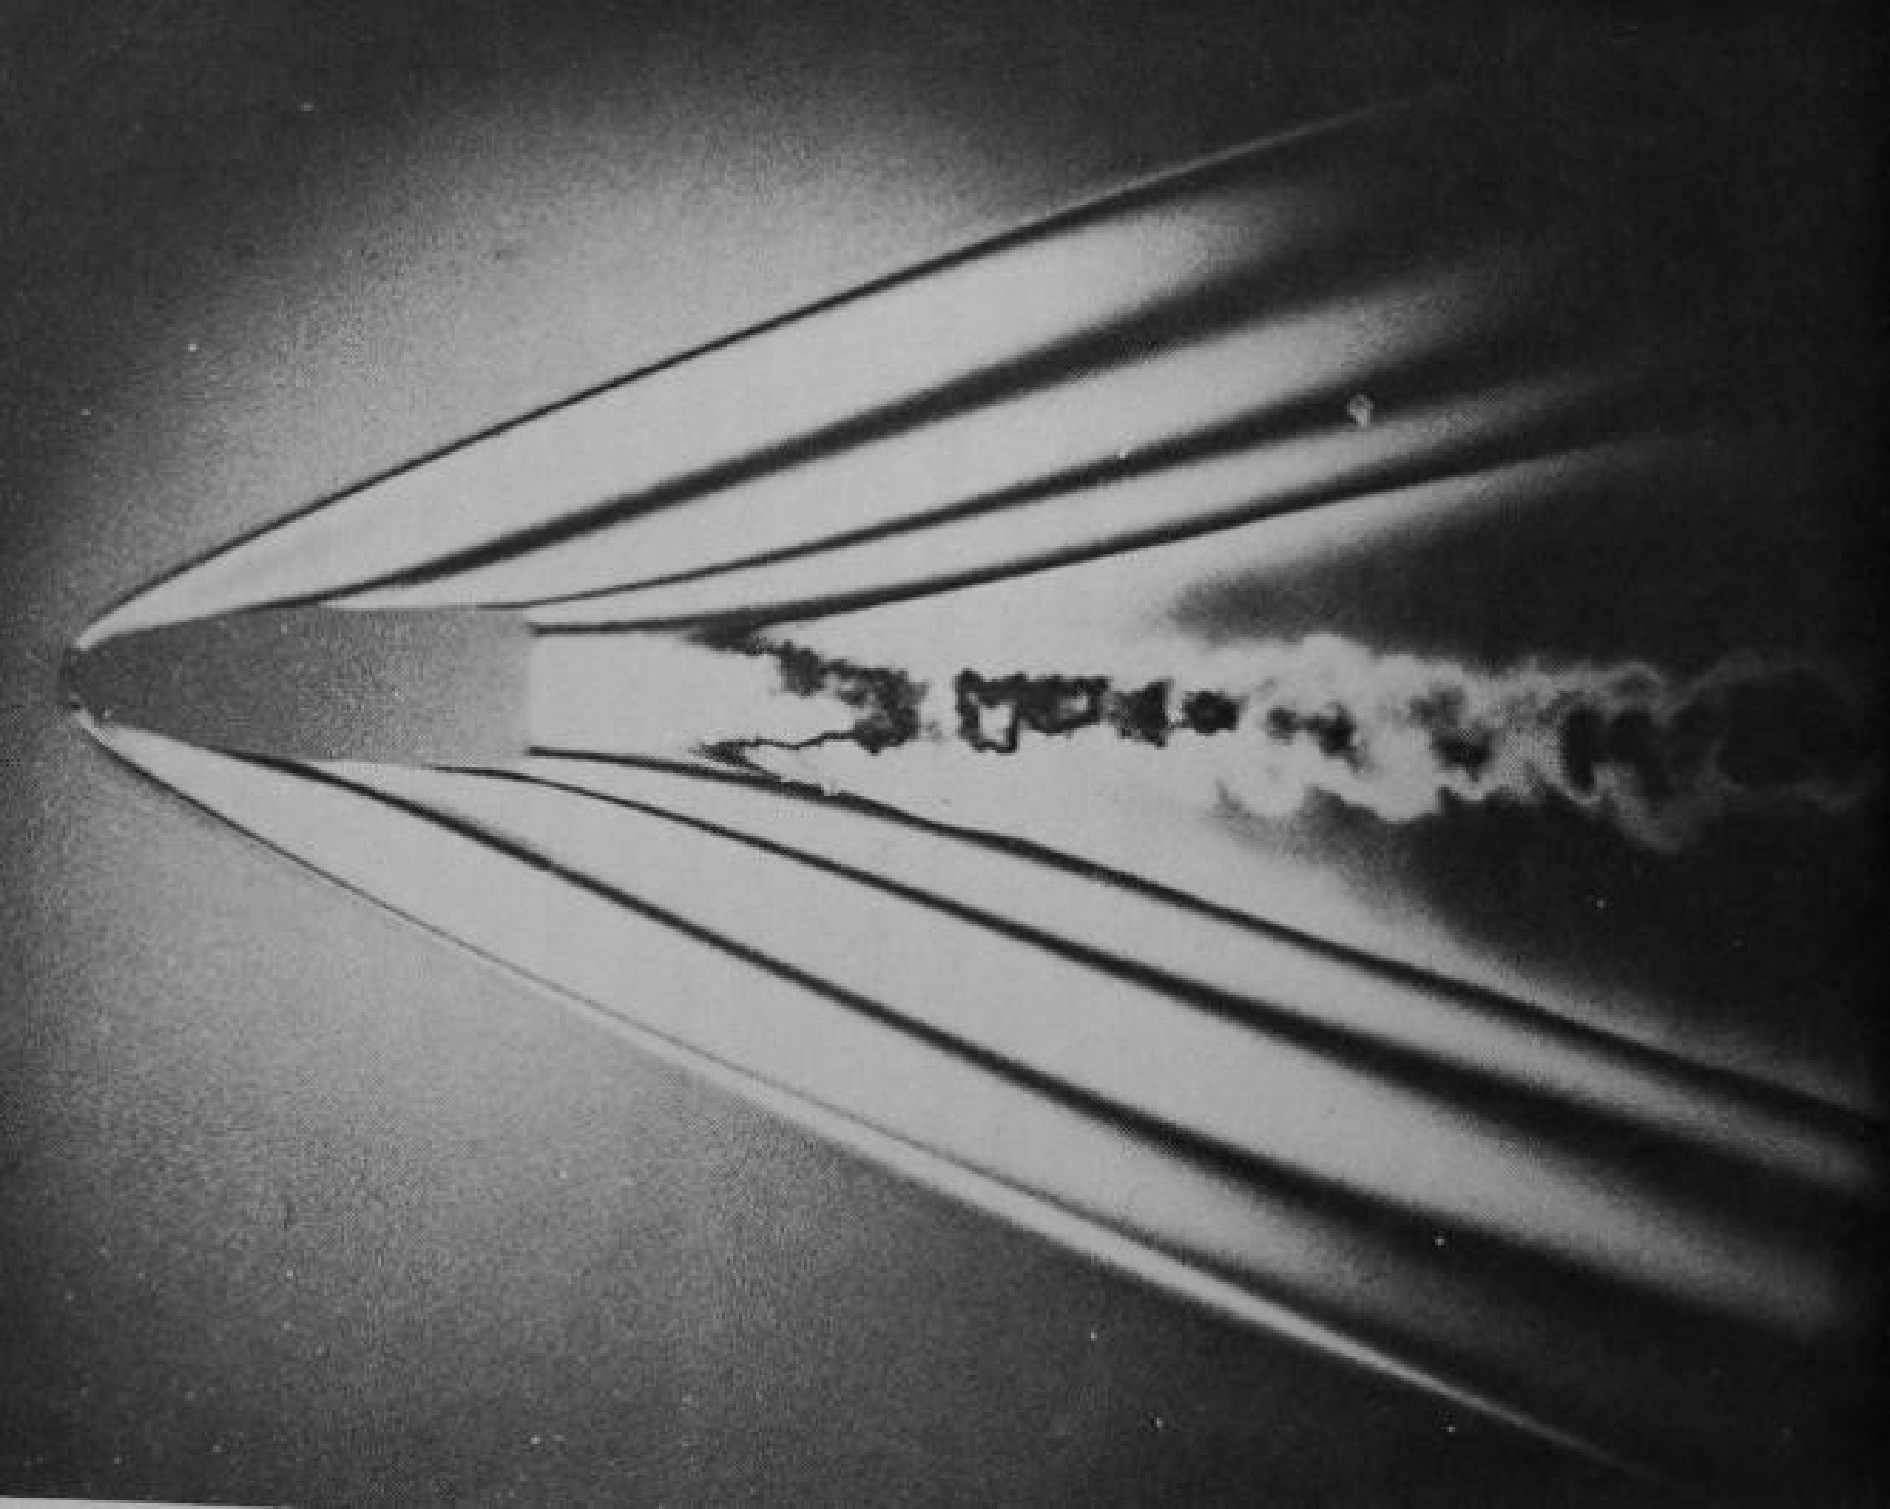
Fig. 7 Fringes formed around a bullet captured in a pulsed laser hologram.
By accident, the laser fired a double pulse, the first of which occurred before the bullet was in the field of view.In England, J. M. Burch published a paper in which he described experiments done at the National Physical Laboratory in Teddington that showed both double-exposure and real-time holographic interferometry13. In September of that year, Haines and Hildebrand published a paper proposing that if the wavelength of a laser could be varied, holograms could be used to generate contours of an object surface via interference effects14. No experimental demonstration was done because at that time laser wavelengths could not be varied. In the Soviet Union, holographic interferometry was discovered about this same time by Yu I. Ostrovsky, et al15. It is clear from these and other publications that year that holographic interferometry was a phenomenon waiting to be discovered by nearly anyone recording holograms.
-
Robert Powell and I were not mechanical engineers. For example, one of the vibration patterns we recorded of our film can bottom showed a five lobed pattern that was an impossible vibration mode for a circular vibrating structure (the upper left image in Fig. 4). In retrospect, it was a combination of a five-diameter mode and a two-ring circumferential mode and not a mode by itself, but we did not understand that at the time. I communicated information about our discovery quite freely, and one of the people I told was Ralph Grant, a professor of acoustics at the University. I also came in contact with Donald Gillespie, who was very interested in finding a way to exploit holograms financially. Don worked in a laser laboratory and was able to make his own lasers. I helped him set up a holography laboratory in his basement in which he made holograms for demonstration purposes. Eventually he and his brother John Gillespie formed the first company to make equipment specifically designed for holography laboratories, Jodon Engineering.
Ralph Grant teamed up with a lawyer, Joseph Crafton to form Grant-Crafton Optronics, aka GCO. They were fortunate to find that this new interferometry could make bonding flaws visible on laminated structures, such as pneumatic tires, when subjected to changes in pressure, and this became a major business. Fig. 8 shows an example of this16.
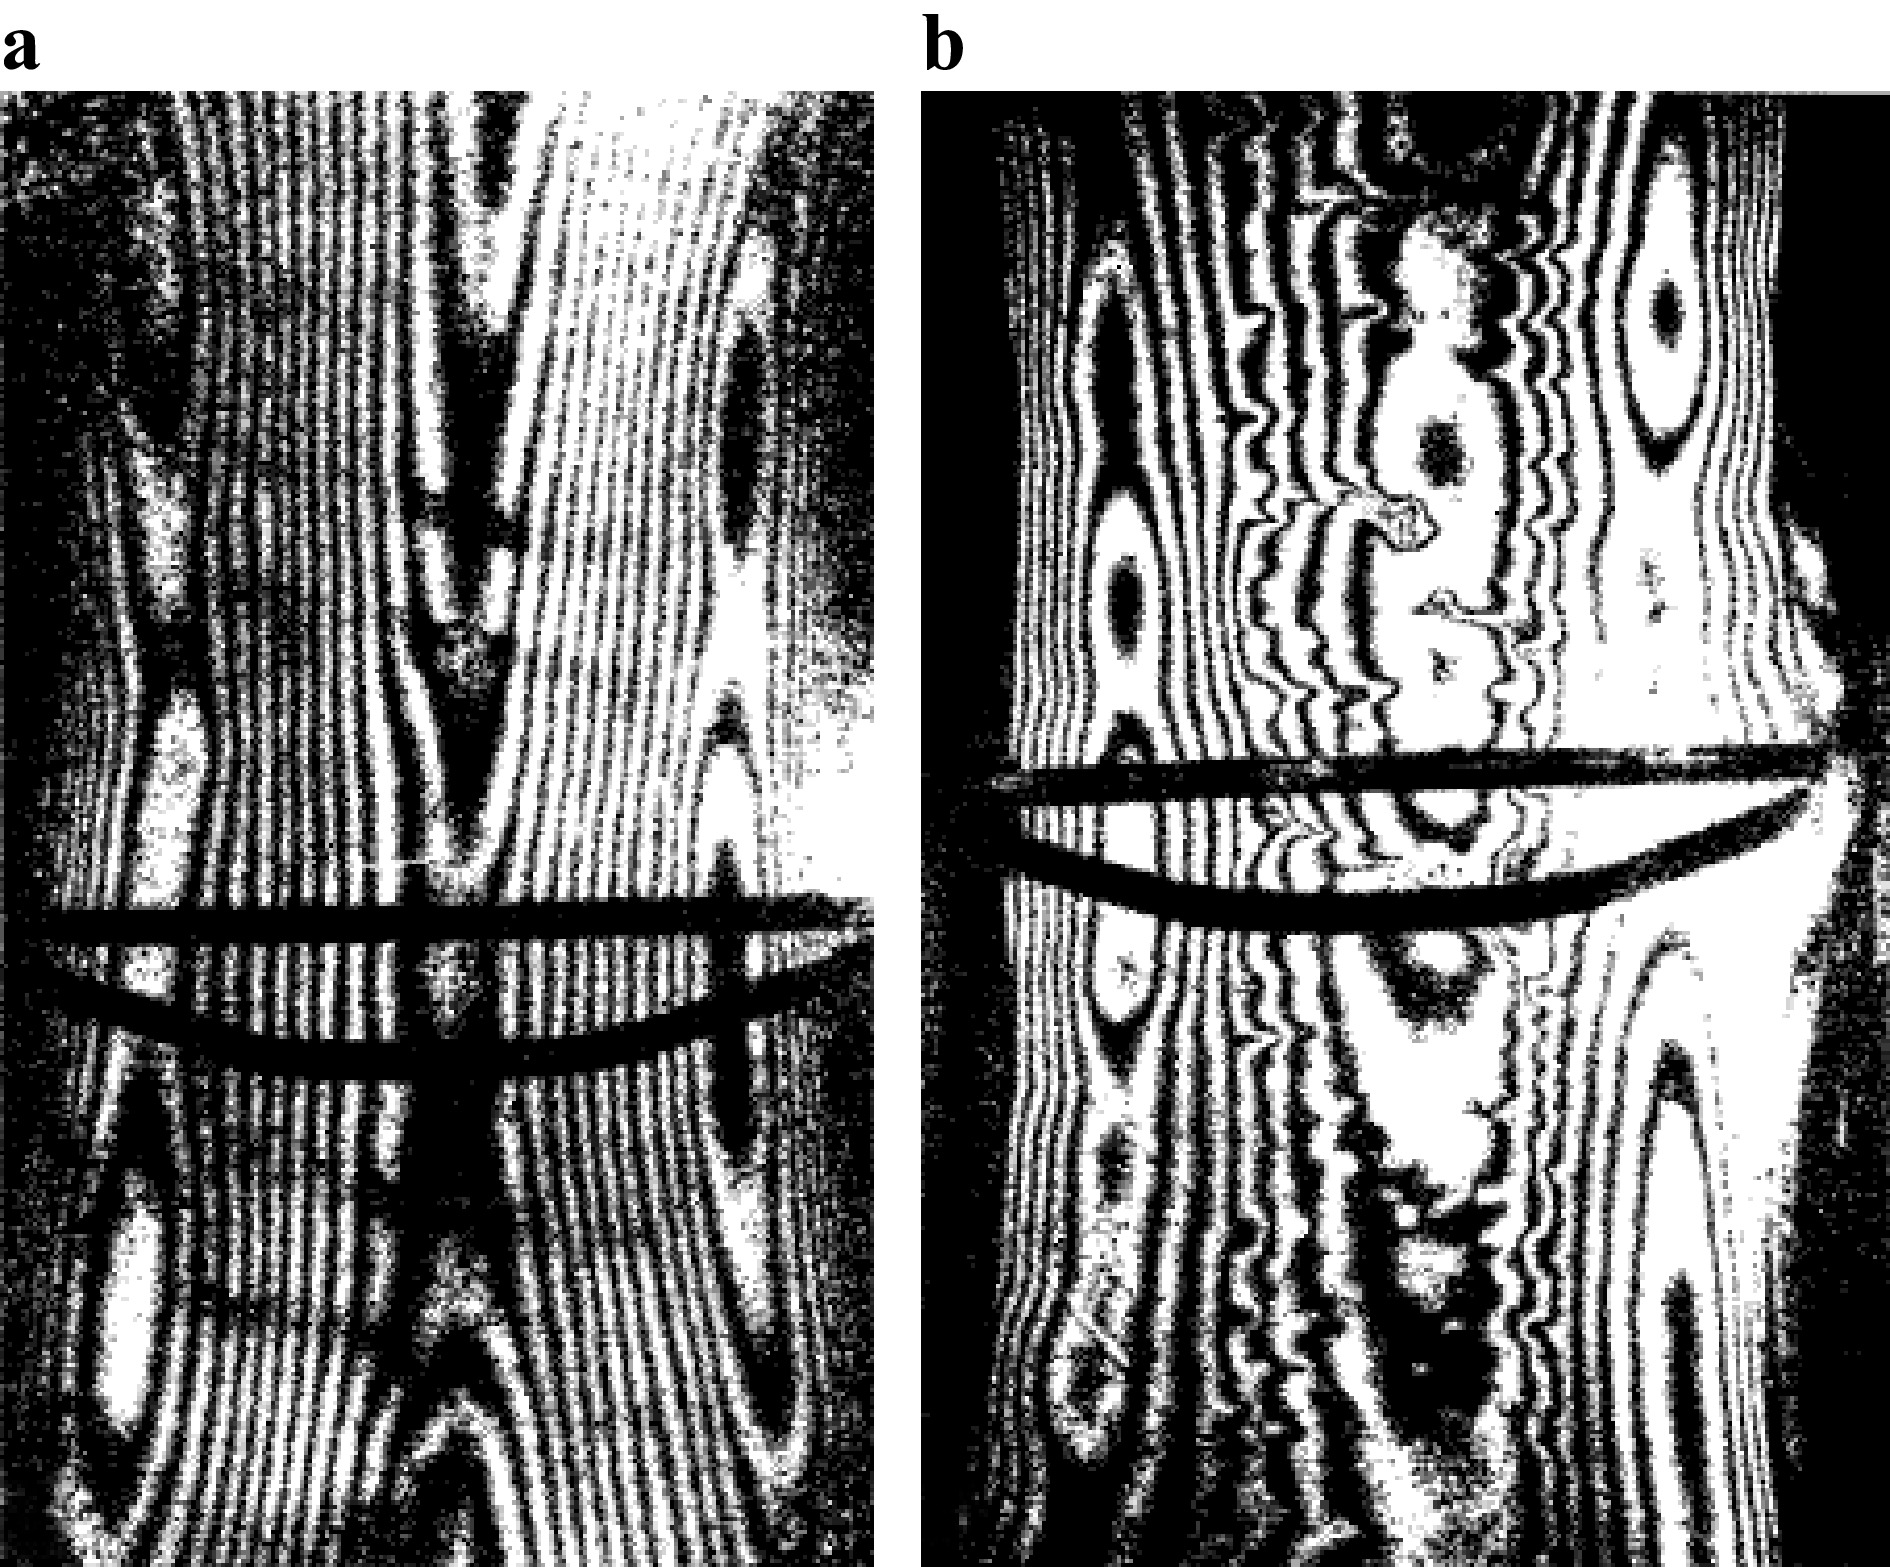
Fig. 8 Holographic Tire Testing.
a Fringes from pneumatic pressure change for a good tire. b Fringes from change in pneumatic pressure showing bonding flaws.The aircraft industry became a major user of holographic interferometry. Holographic testing required a significant initial investment which added considerable cost to products, and this was practical for items like airplanes which cost a lot to make and for which failures are very serious. In jet engines, high cycle fatigue due to vibration is a major source of failure for the blades, and they are designed to have resonances that are not excited at the rotation speeds of operation. Holography offered a way to visualize the mode shapes and confirm mathematical analyses. An example is shown in Fig. 9.
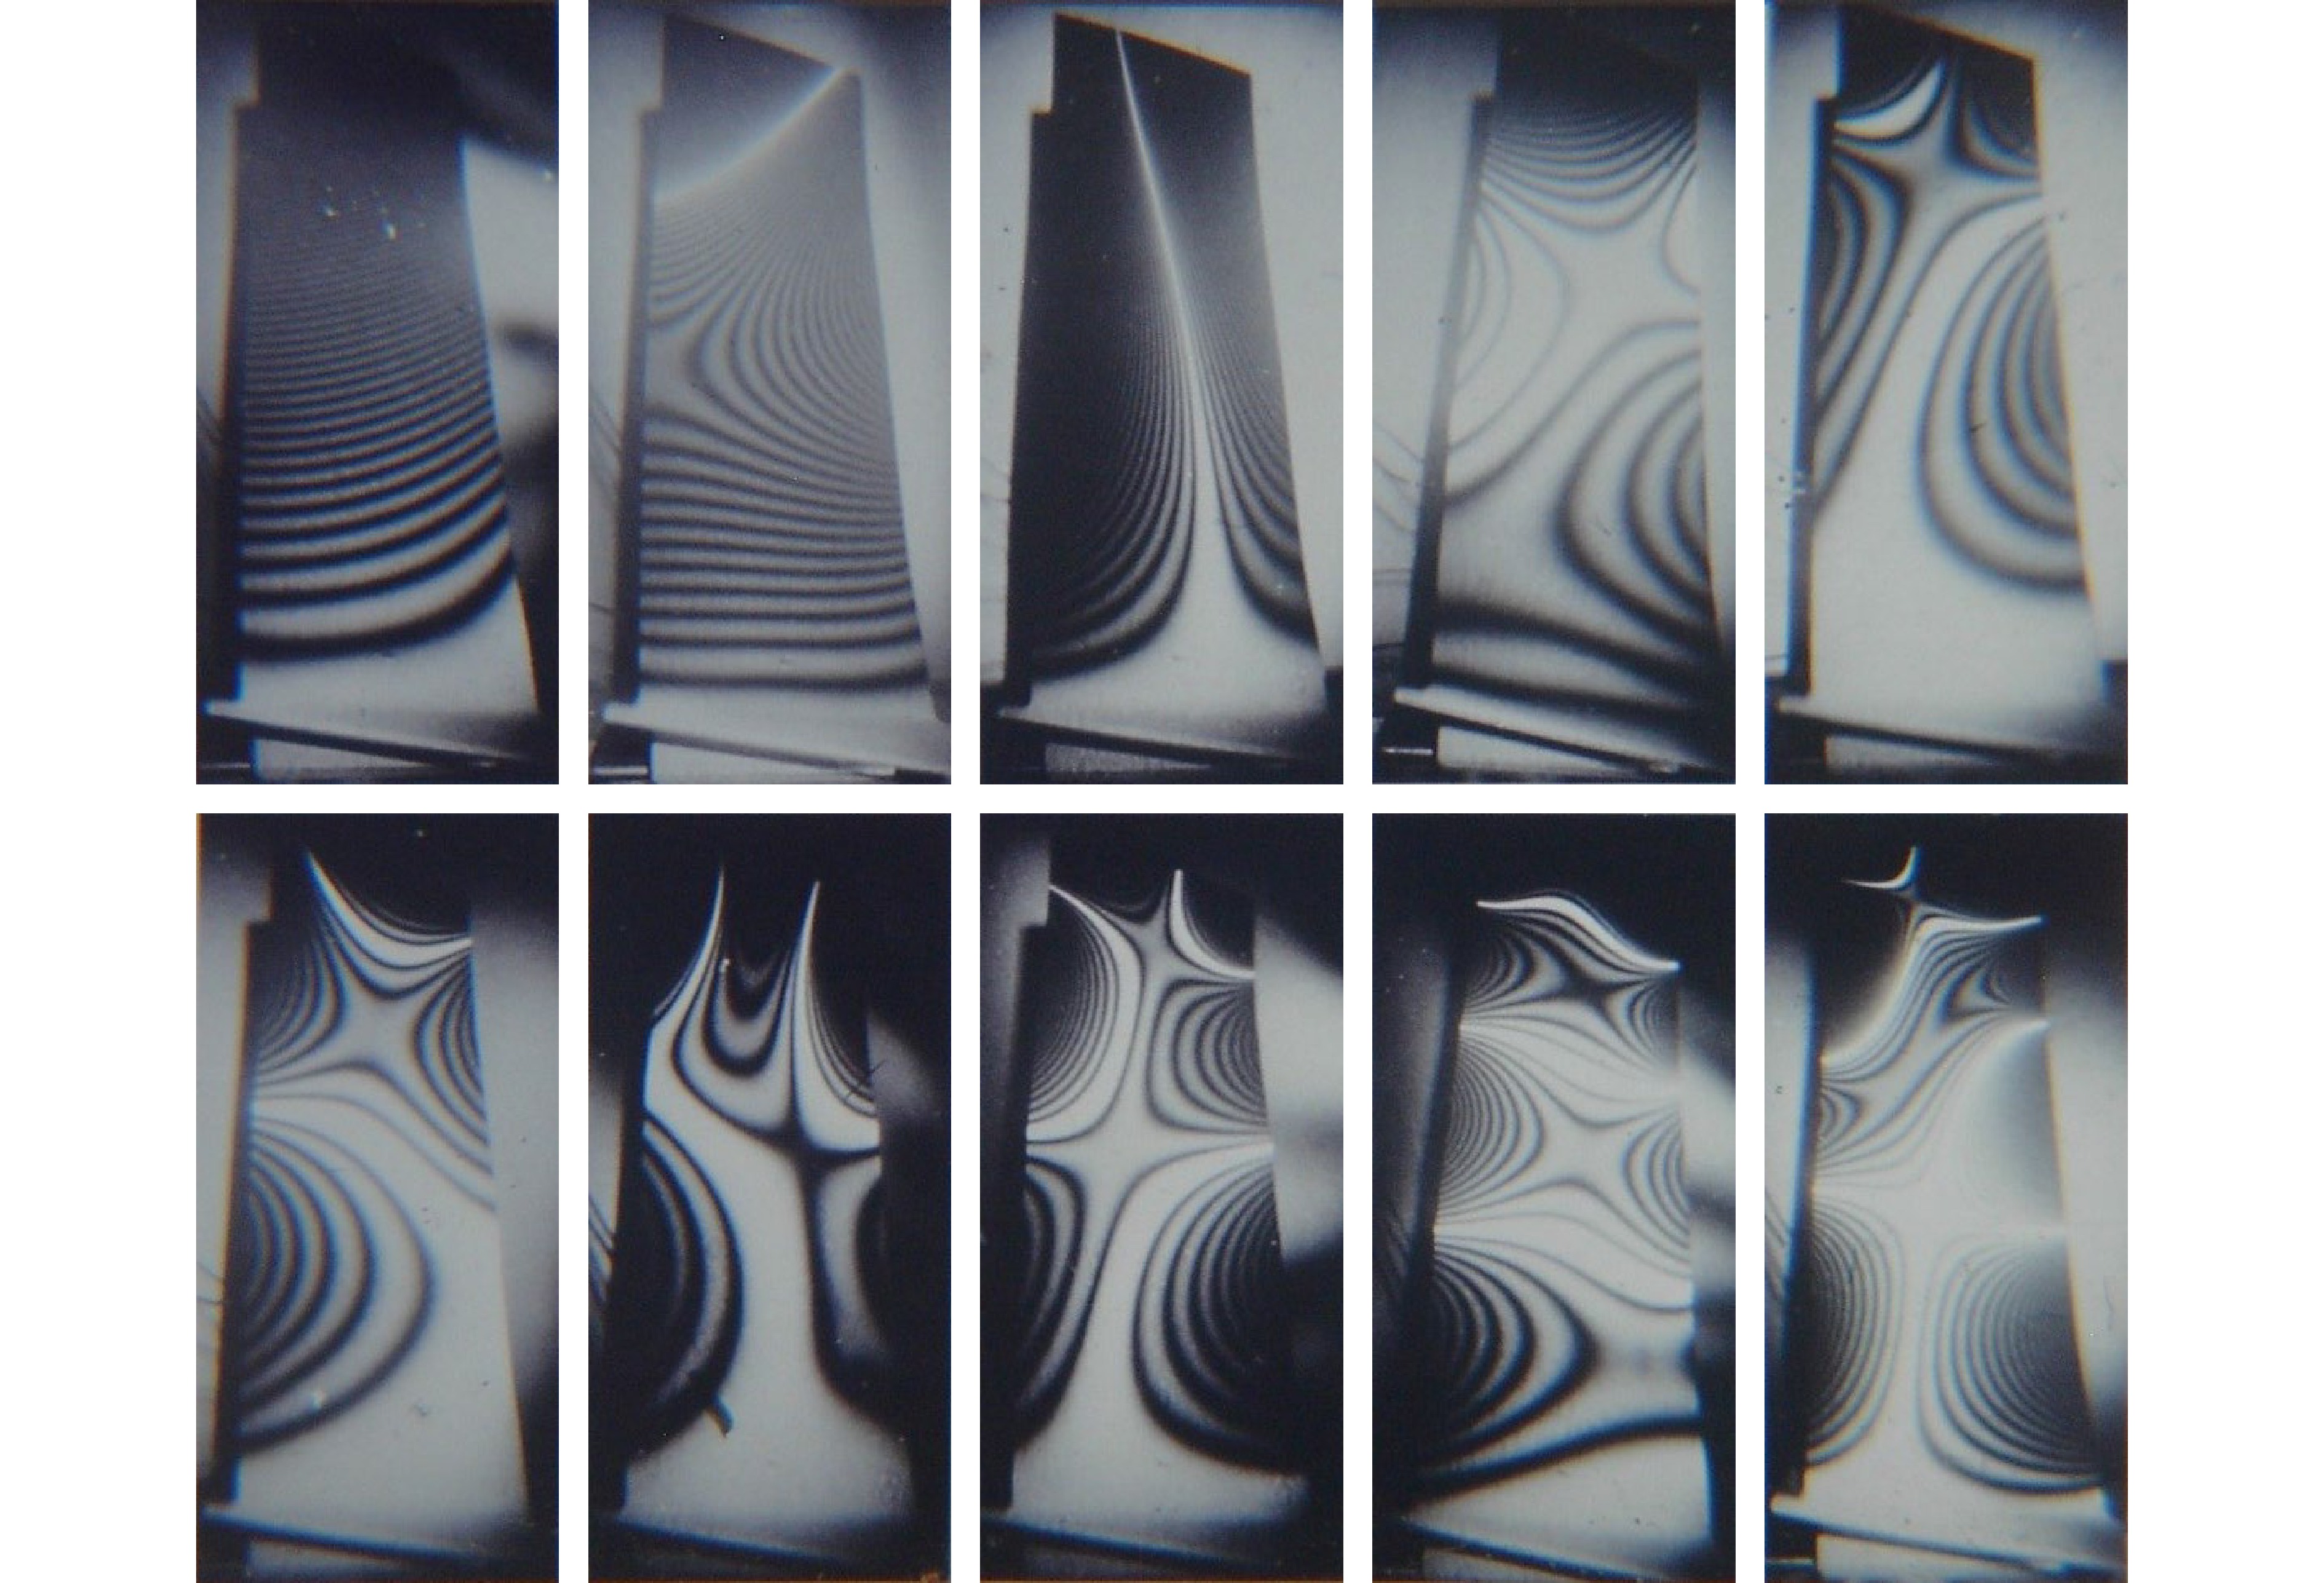
Fig. 9 Ten vibration modes of a jet engine turbine blade (courtesy of Pratt & Whitney). Reproduced with permission from Raytheon Technologies Corporation, Pratt & Whitney division.
This was used very early on by Pratt & Whitney, GE, and Rolls-Royce, and also by Westinghouse for analysis of vibration modes for steam turbine blades. Aircraft structures made of honeycomb cores and metal or composite skins were also inspected by holography for delaminations. Another major area of application has been analysis of air flow and analysis of plasmas, which generally required use of pulsed lasers. A wide survey of techniques can be found in the book, Holographic Nondestructive Testing, edited by R. K. Erf17, and a detailed discussion of holographic interferometry and its applications can be obtained in the books Holographic Interferometry, by C. M. Vest18. and Interferometry by Holography, by Y. I. Ostrovsky, et al19.
Engineers at Pratt & Whitney also developed a holographic method to inspect abradable seals in jet engine casing for bonding flaws. High efficiency of a jet engine depends upon having a narrow gap between blade tips and the engine casing. An abradable material is bonded to the engine casings so that if the rotating blades come in contact with the casing due to any deformation of the engine as a whole, they will merely scrape away some material and not break off. If there are places where the seal is not well bonded to the casing, these may be knocked out by the scraping blades and result in poorer engine efficiency. To inspect a casing segment, it is excited with ultrasonic noise during a hologram recording. Disbonded areas appear as dark spots in the hologram reconstruction (see Fig. 10). Initially, photographic holograms were recorded of the engine casing, and were developed in place using a monobath developer. These systems were eventually replaced with digital holographic interferometry systems.
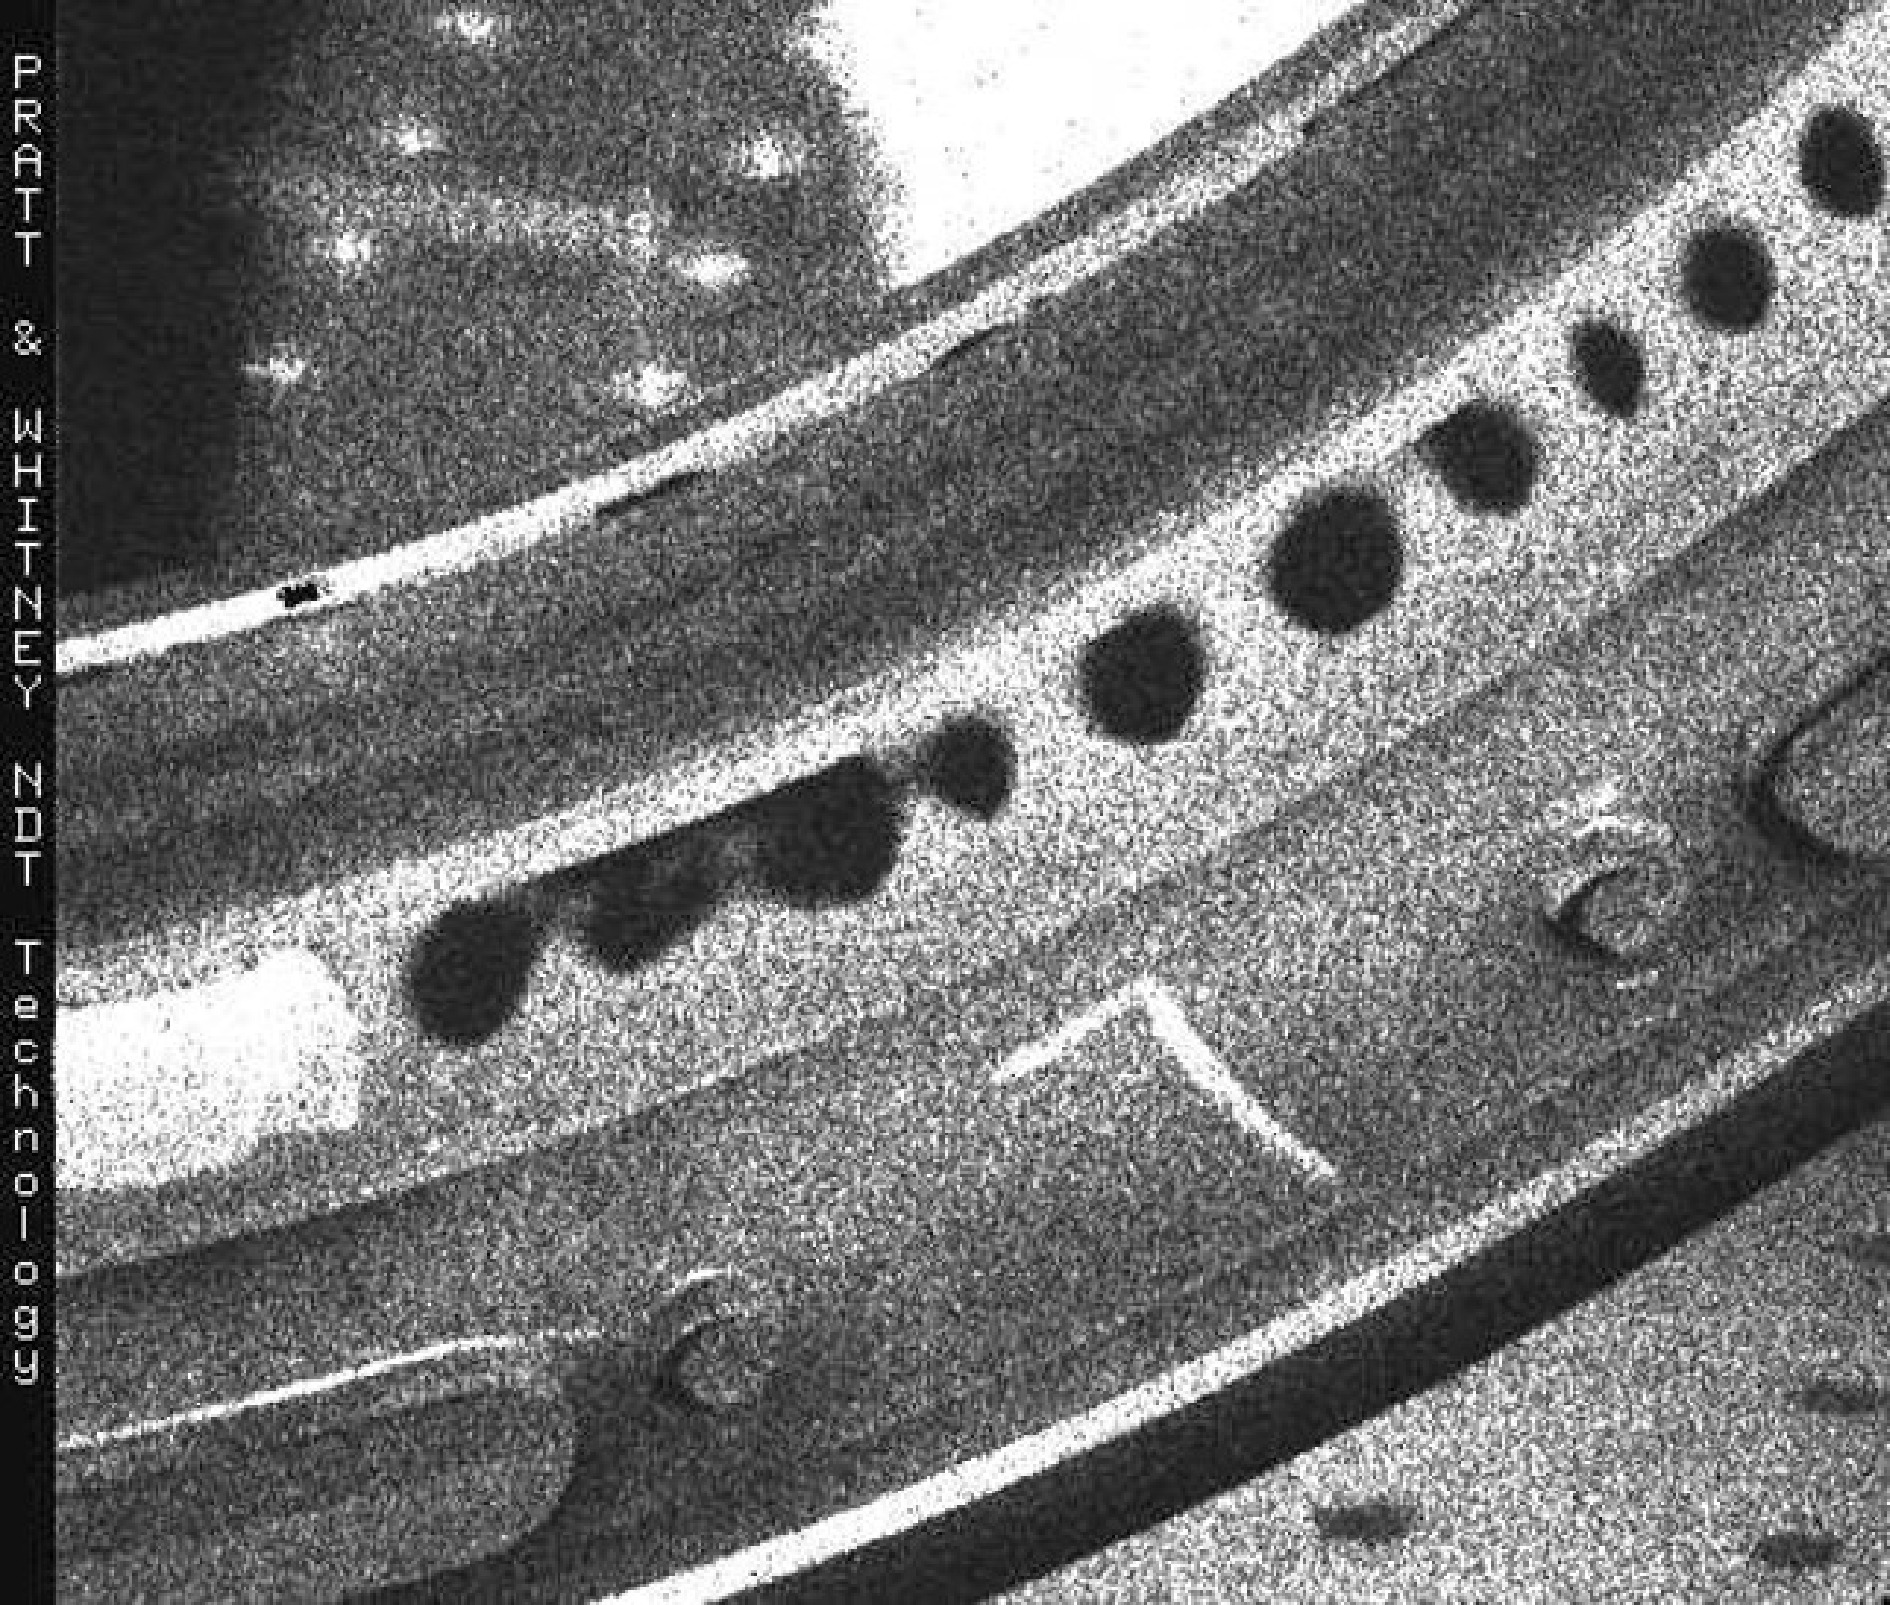
Fig. 10 A hologram reconstruction of an abradable jet engine seal which was excited with ultrasonic noise.
The disbonded areas show up as black spots in the reconstruction. -
There was a major problem with the fringes of holographic interferometry. They provide excellent graphic displays of object deformation or vibration, but converting them to numerical data is not easy. Exact deformations can be assigned to the centers of the fringes, but a continuous deformation function can only be obtained by interpolation between fringes. This is a difficult and tedious process at best. Fortunately, a solution eventually presented itself with the development of digital holographic interferometry and ultimately the development of digital holography20.
Digital holography and holographic interferometry became possible because of three developments. The first was the personal computer, the second was the development of systems for digitizing television camera signals and the eventual development of self-digitizing cameras, and the third was the development of phase-stepping technology. This eventually resulted in systems that could display the reconstruction of a hologram on a monitor in real-time21. With the object imaged directly on the TV camera, the resulting display was a hologram reconstruction of the object in real-time. This allowed the real-time display of vibration fringes and the system could also store a hologram of an object, subtract it from the one displayed in real time, and display fringes due to static deformations. These systems could also the display in real-time of the phase of the static deformation fringe function22. This phase was obtained by an arctangent calculation, and therefore was cycled, or wrapped every value of 2π. The problem of unwrapping phase maps to obtain continuous phase functions is a general one, fortunately, and numerous methods were developed23, 24.
The problem remained of how to obtain numerical data from the J0 Bessel function fringes of a time-average hologram. A solution was found25, 26 by recognizing that J0 fringes were nearly periodic. Applying a bias vibration to the reference beam at the same frequency and phase as the object vibration, while displaying J0 fringes, allows them to be shifted in the same manner as phase stepping in a conventional interferometer. Acquiring three or four such images with the equivalent of π/3 or π/4 phase shifts provided data for a phase calculation. The error that results from using J0 fringes in place of cosine fringe can be calculated and used to correct the resulting phase calculation. The result is a wrapped phase map for the object vibration mode.
The numerical data is obtained at the pixel locations of the TV camera, and, although this does not provide a perfectly continuous data map on the object, it is fine enough for most practical applications. One application is the comparison of measured mode shapes to finite element calculations. A common method for predicting vibration modes on a structure is to divide it into small segments or elements, for which deformations can be modeled as simple bending or stretching. These segments are then connected in a system of equations that results in an overall matrix that can be solved for the deformations or vibration modes of the structure. Comparison of these theoretical mode shapes with actual data requires normalizing the experimental data to match the theoretical mode shape values, finding the experimental values at the points closest to the node points of the model, and calculating a map of differences.
Another application for vibration mode data comes from the jet aircraft engine industry. Replacement blades in the compressors and turbines of an engine must be certified to have not only the same material and geometry as the blades they replace, they must also match their vibration modes, both in frequency and mode shape. Holographic vibration analysis has provided a way to do this using what are called modal assurance criteria27, 28.
-
Holographic interferometry has come a very long way from its origin. Before its discovery, interferometry was reserved for the study of polished optical surfaces, but the laser hologram extended it to virtually any object that could reflect or transmit light. It became possible to measure deformation and vibration on engineering structures with a precision defined by the wavelength of light, and it became possible to find flaws in the bonding between structures. What the future holds in the way of new applications only time will tell.
The discovery of holographic interferometry, its development and applications
- Light: Advanced Manufacturing 3, Article number: (2022)
- Received: 22 July 2021
- Revised: 15 June 2022
- Accepted: 16 June 2022 Published online: 16 June 2022
doi: https://doi.org/10.37188/lam.2022.002
Abstract: This paper recounts the discovery of holographic interferometry, discusses its development, and itemizes some of its major applications.
Research Summary
Holographic interferometry: past, present, and future
Inspired by Holographic Visions, Karl Stetson from Karl Stetson Associates sought to assess the development and impact of holographic interferometry—the technique of measuring stress, strain, and vibration with light. It is defined by the wavelength of light, finding flaws in structural bonds. Karl Stetson reviewed the research he conducted in the 1960s and its developments since then. The aeronautics industry has since become one primary industry that found an application for holographic interferometry, as they could apply it for engine maintenance. While holographic interferometry has come a long way from its origin, there are Infinite applications available to researchers moving forward.
Rights and permissions
Open Access This article is licensed under a Creative Commons Attribution 4.0 International License, which permits use, sharing, adaptation, distribution and reproduction in any medium or format, as long as you give appropriate credit to the original author(s) and the source, provide a link to the Creative Commons license, and indicate if changes were made. The images or other third party material in this article are included in the article′s Creative Commons license, unless indicated otherwise in a credit line to the material. If material is not included in the article′s Creative Commons license and your intended use is not permitted by statutory regulation or exceeds the permitted use, you will need to obtain permission directly from the copyright holder. To view a copy of this license, visit http://creativecommons.org/licenses/by/4.0/.

 DownLoad: