


-
The measurement and assessment of fluid viscosity, which make it possible to determine fluid flow properties, are critical in the oil, food, cosmetic, pharmaceutical, and chemical industries1–4. To date, however, the success in developing rapid, low-cost, miniaturized viscometers covering a wide measurement range has been extremely limited. Herein, a novel design of a viscometer based on the integration of a chip-scale GaN optical device with a bendable strip is reported. The developed viscometer can measure fluid viscosity over an ultrawide range of 100–106 mPa∙s. This work also demonstrates the remarkable features of fast measurement, high stability, and real-time monitoring capability, which prove its potential as a new generation of viscosity-measuring units in various practical applications.
Although traditional viscometers relying on capillary flow and falling balls are simple and effective means for measuring fluid viscosity over a large range5, their low measurement throughput and lack of real-time monitoring capabilities limit their scope of application. For instance, the capillary types of instrument require hours to evaluate the flow of high-viscosity fluids. Rotational viscometers based on measuring the torque required to rotate a spindle in the sample fluids can respond to a wide range of viscosities, but suffer from the drawbacks of being bulky, being expensive, and requiring large volumes of fluid. Various advanced approaches, such as droplet-based microfluidic approaches with microchannels6–9, suspended microchannel resonators10–12, vibrating cantilevers, and piezoelectric resonators13–16, have been proposed to boost the sensitivity to fluid viscosity at specific viscosity ranges. Therefore, the development of miniature, low-cost viscometers capable of wide-range, real-time measurement has remained challenging.
Among the possible methods, viscometry based on fiber-optic technology has received increasing attention because of its advantages of a sensing head with a compact structure, fast response, and immunity to electromagnetic interference17–19. Fiber-optic probing with modified structures, such as hollow capillary tubes17, viscosity-sensitive20 fluorescent probes21,22, and long-period fiber gratings23,24, have been demonstrated. Their implementation relies heavily on the assembly of external light-emitting and detecting units as well as the optical elements used for light coupling. Although noncontact measurements based on optical tweezers and interferometric probes make accurate viscosity measurements possible with low sample consumption25–27, they often involve complex and expensive microscopic setups. The GaN semiconductor and its alloys have been considered an ideal platform for developing light-emitting devices because of their high efficiency, long lifespan, and high physical stability28,29. Recently, other optical devices, such as detectors and waveguides, have been proposed for integration on the same GaN platform, and such applications as on-chip visible-light communication have been realized30,31.
In this letter, the fabrication of a miniature viscometer by integrating an extremely small GaN optical device with a bendable strip, as schematically shown in Fig. 1a, is reported. Without external optical connections, essential light-emitting and light-detecting elements are monolithically integrated into a chip-scale GaN device. In addition to the electrical and optical properties of the device, the optimization of the structural parameters was investigated. Driven by low-frequency vibrations, viscometer responses to varying viscosities were determined. The stability and real-time monitoring capability of the proposed viscometer were studied to verify its performance.
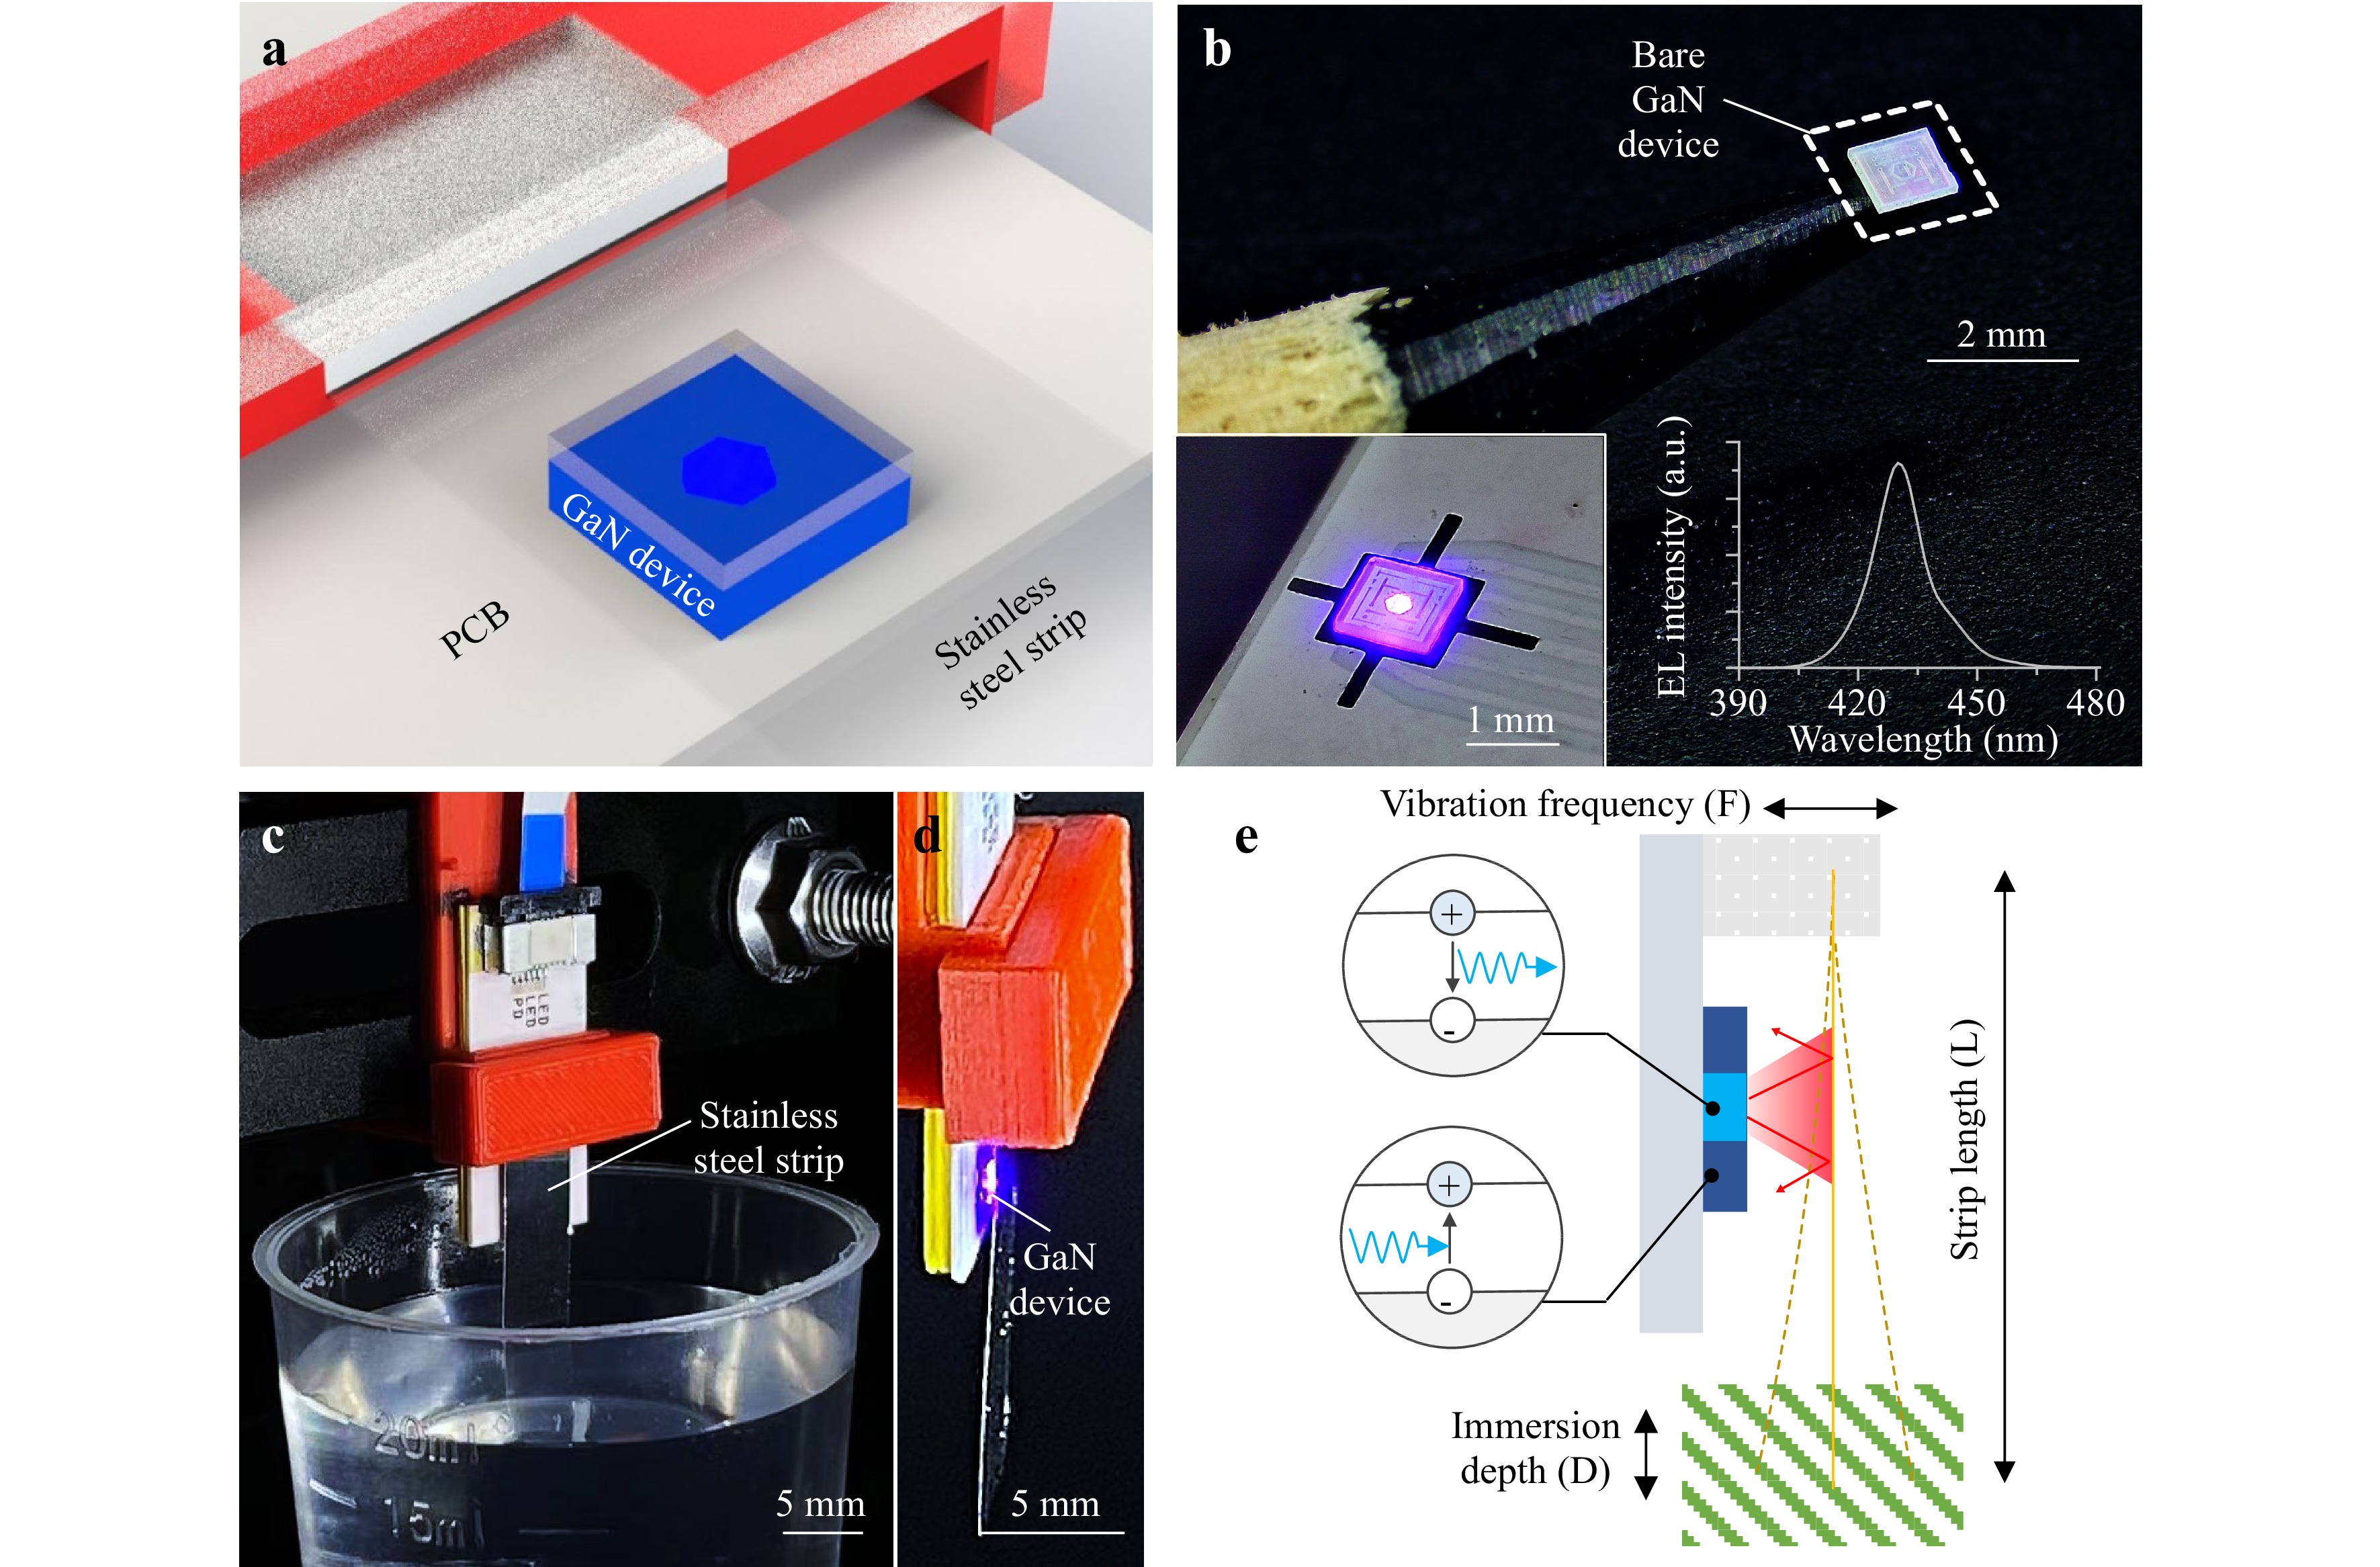
Fig. 1 a Schematic diagram of the proposed viscometer. b Micrograph of the bare GaN device after microfabrication. Insets show the micrograph of the device packaged on the PCB (left) and the emission spectrum of the emitter operating at 2 mA. c Front- and d side-view optical images of the developed viscometer. e Schematic illustration of the operating principle of the proposed viscometer.
As shown in Fig. 1b, a GaN device of size 1 mm × 1 mm was fabricated by wafer-scale microfabrication and a flip-chip bonded on a printed circuit board (PCB) using a reflow soldering process. During device operation, as shown in the inset of Fig. 1b, a hexagonal region with a diameter of 0.275 mm in the center of the chip was biased with a current source to act as an emitter, and the peripheral part was connected to an ammeter as a detector. The inset shows the emission spectrum of the emitter operating at 2 mA with a center wavelength of approximately 430 nm. To facilitate the effective assembly of the GaN chip with the strip, a fixator prepared using a 3D polylactic acid printer was clasped around the PCB and used to hold one end of the strip, as shown in Fig. 1d. The initial spacing between the strip and the device was designed to be 0.2 mm, and type-304 stainless steel with a Young’s modulus of 190 GPa was chosen as the strip material to avoid chemical reactions with the measured fluids. The use of a wide strip with a width of 6 mm can not only avoid the influence of ambient light but also ensure that the light emission from the emitter can be highly covered. Moreover, because the GaN device does not contact the fluids, the absorption or transparency of the fluid does not affect the measurement results.
The schematic diagram in Fig. 1e illustrates the working principle of the viscometer. The GaN device provides luminescence and light detection. By injecting a constant current into the emitter, the light from the emitter is transmitted through the transparent sapphire substrate and is reflected by the strip to the detector. Owing to the diverging emission behavior of the emitter, the variation in the light received by the detector depends on the displacement of the strip. During the viscosity measurement, only the free end of the strip is partially immersed in the fluid sample, whereas the GaN device remains out of contact with the fluid. When vibration is applied, the fluid tends to oppose the movement of the strip and create resistance to the strip. The induced displacement of the strip changes the amount of light reflected into the detector; thus, the photocurrent of the detector can be used to indicate the fluid viscosity.
The chip-scale GaN device, which consists of an emitter and detector, is characterized as the core component of the viscometer. The current–voltage (I–V) curve plotted in Fig. 2a shows that the forward voltage of the emitter is 2.75 V at an injection current of 2 mA. The resistance of the emitter, determined from the reciprocal of the slope of the linear portion of the I–V curve, is 25.9 Ω. As illustrated in the inset of Fig. 2a, the light output power of the emitter increases linearly with the injection current. Fig. 2b shows the I–V characteristics of the detector. Without emitter illumination, the photocurrent level is less than 10−8 A. When bias currents of 0.2–2 mA are applied, the photocurrent level increases by more than two orders of magnitude, reaching 10−6–10−5 A. The ability of the detector to respond to emitter emission can be attributed to the spectral overlap between the emission and absorption spectra of the device incorporating InGaN/GaN multi-quantum wells (MQWs)32, 33. Moreover, the operating wavelength is chosen to be the short visible band at approximately 430 nm because the reduced indium content in the MQWs of the device leads to an increased spectral overlap34. Extracting the photocurrent values of the detector under unbiased conditions results in a linearly increasing relationship, as shown in Fig. 2c, revealing that the detector can respond to variations in light intensity from the emitter. Fig. 2d plots the measured transient response of the detector when the emitter is biased with a square wave. The detector can respond to emission from the emitter operating at frequencies up to 10 kHz, and the rise and fall times are both below 0.05 ms. Fig. 2e shows the sensitivity of the GaN device to the displacement of the strip. The distance of the strip from the device is precisely controlled by mounting the strip on the motorized stage. It is observed that the photocurrent change decreases with an increase in the strip displacement, and a high sensitivity of the sensor is obtained at displacements below 1 mm, as shown in the inset in Fig. 2e.
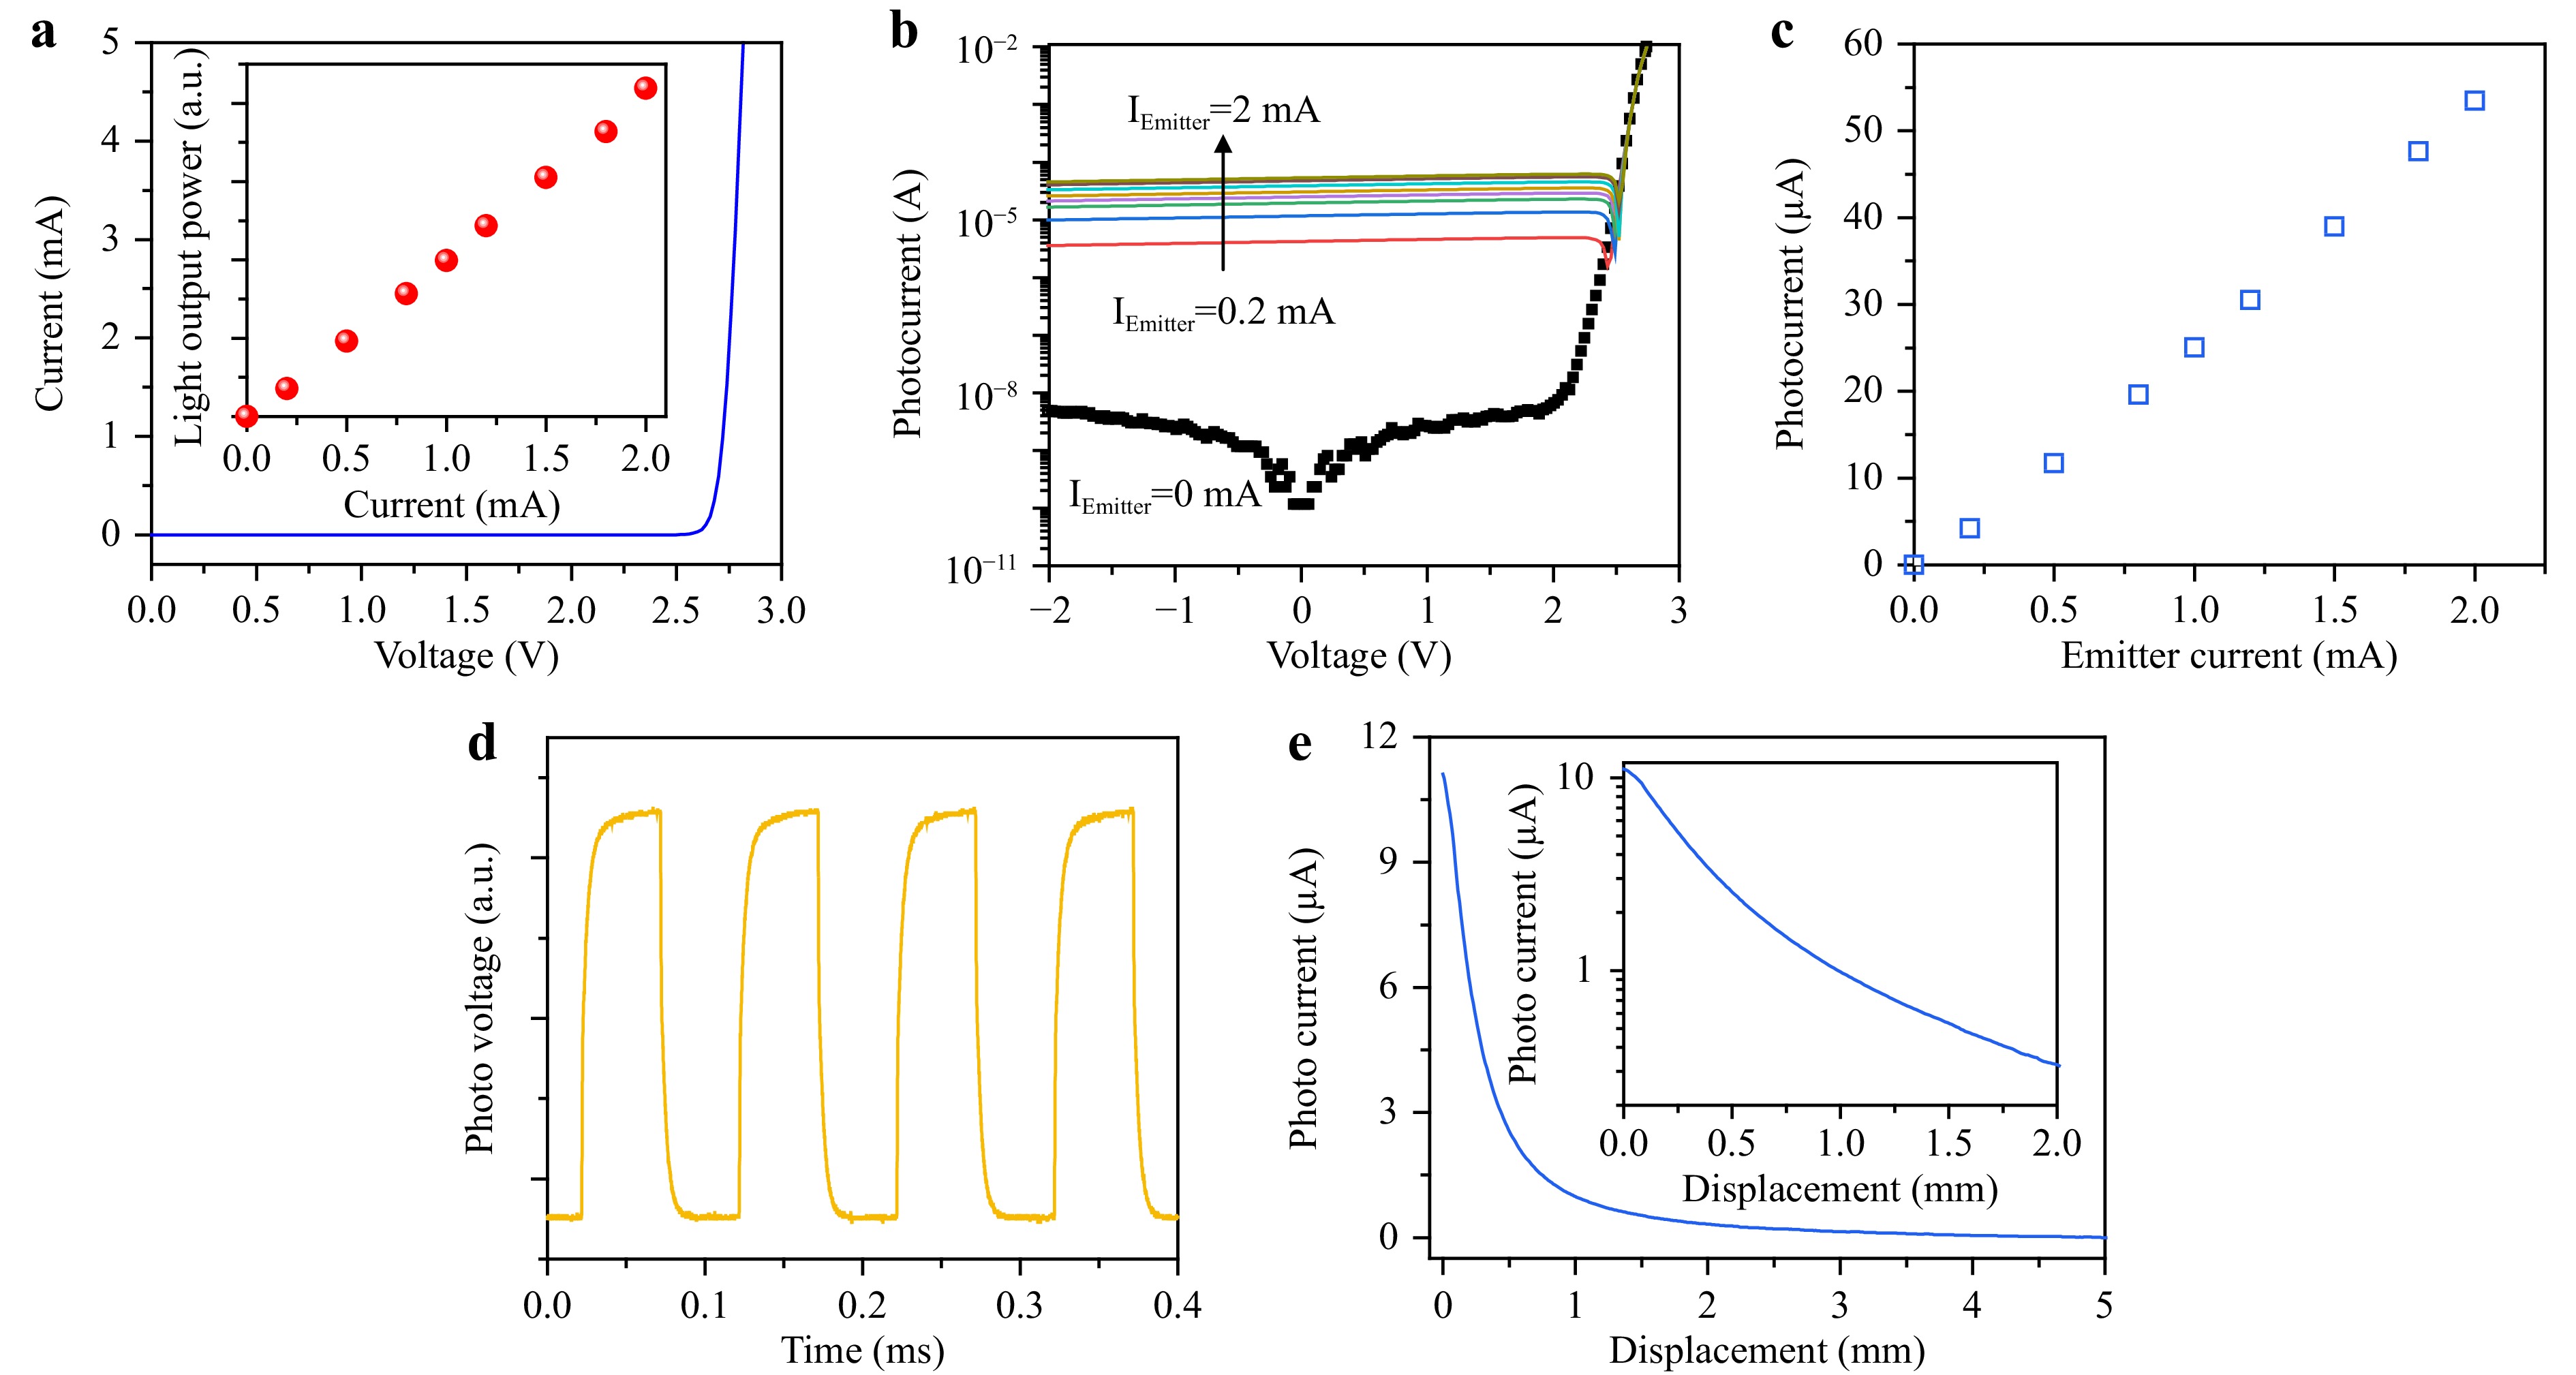
Fig. 2 a I–V properties of the emitter. Inset shows the light output power versus the injection current of the emitter. b I–V characteristics of the detector. c Photocurrent of the detector measured at different injection currents of the emitter. d Transient response of the GaN device. e Measured photocurrent response measured at displacement of the strip from the device. Inset shows the plot on a semilogarithmic scale.
Viscosity measurements were performed at a constant temperature of 25 °C and normal atmospheric pressure. The emitter current was fixed at 2 mA, and the detector was connected to an ammeter under unbiased conditions. Fig. 3a shows the measured results based on different combinations of container diameter (Ø) and fluid volume. The fluid viscosity was fixed at 3 mPa∙s, and the vibration frequency was 2 Hz. When vibration was applied, ripples were generated in the tested sample and rebounded at the container boundaries. This phenomenon is pronounced in small containers with low-viscosity fluids, and slight changes in the volume significantly affect the readout signal. As the container size was increased to 35 mm, a relatively stable response was obtained with a fluid volume of 20 mL. Additional measurements of fluids with viscosities of 105 and 910 mPa∙s were performed. As shown in Fig. 3b, despite the large difference in the fluid volume, the measured photocurrent responses were almost the same, implying that a container with a size of 35 mm is also applicable for fluids with different viscosities.
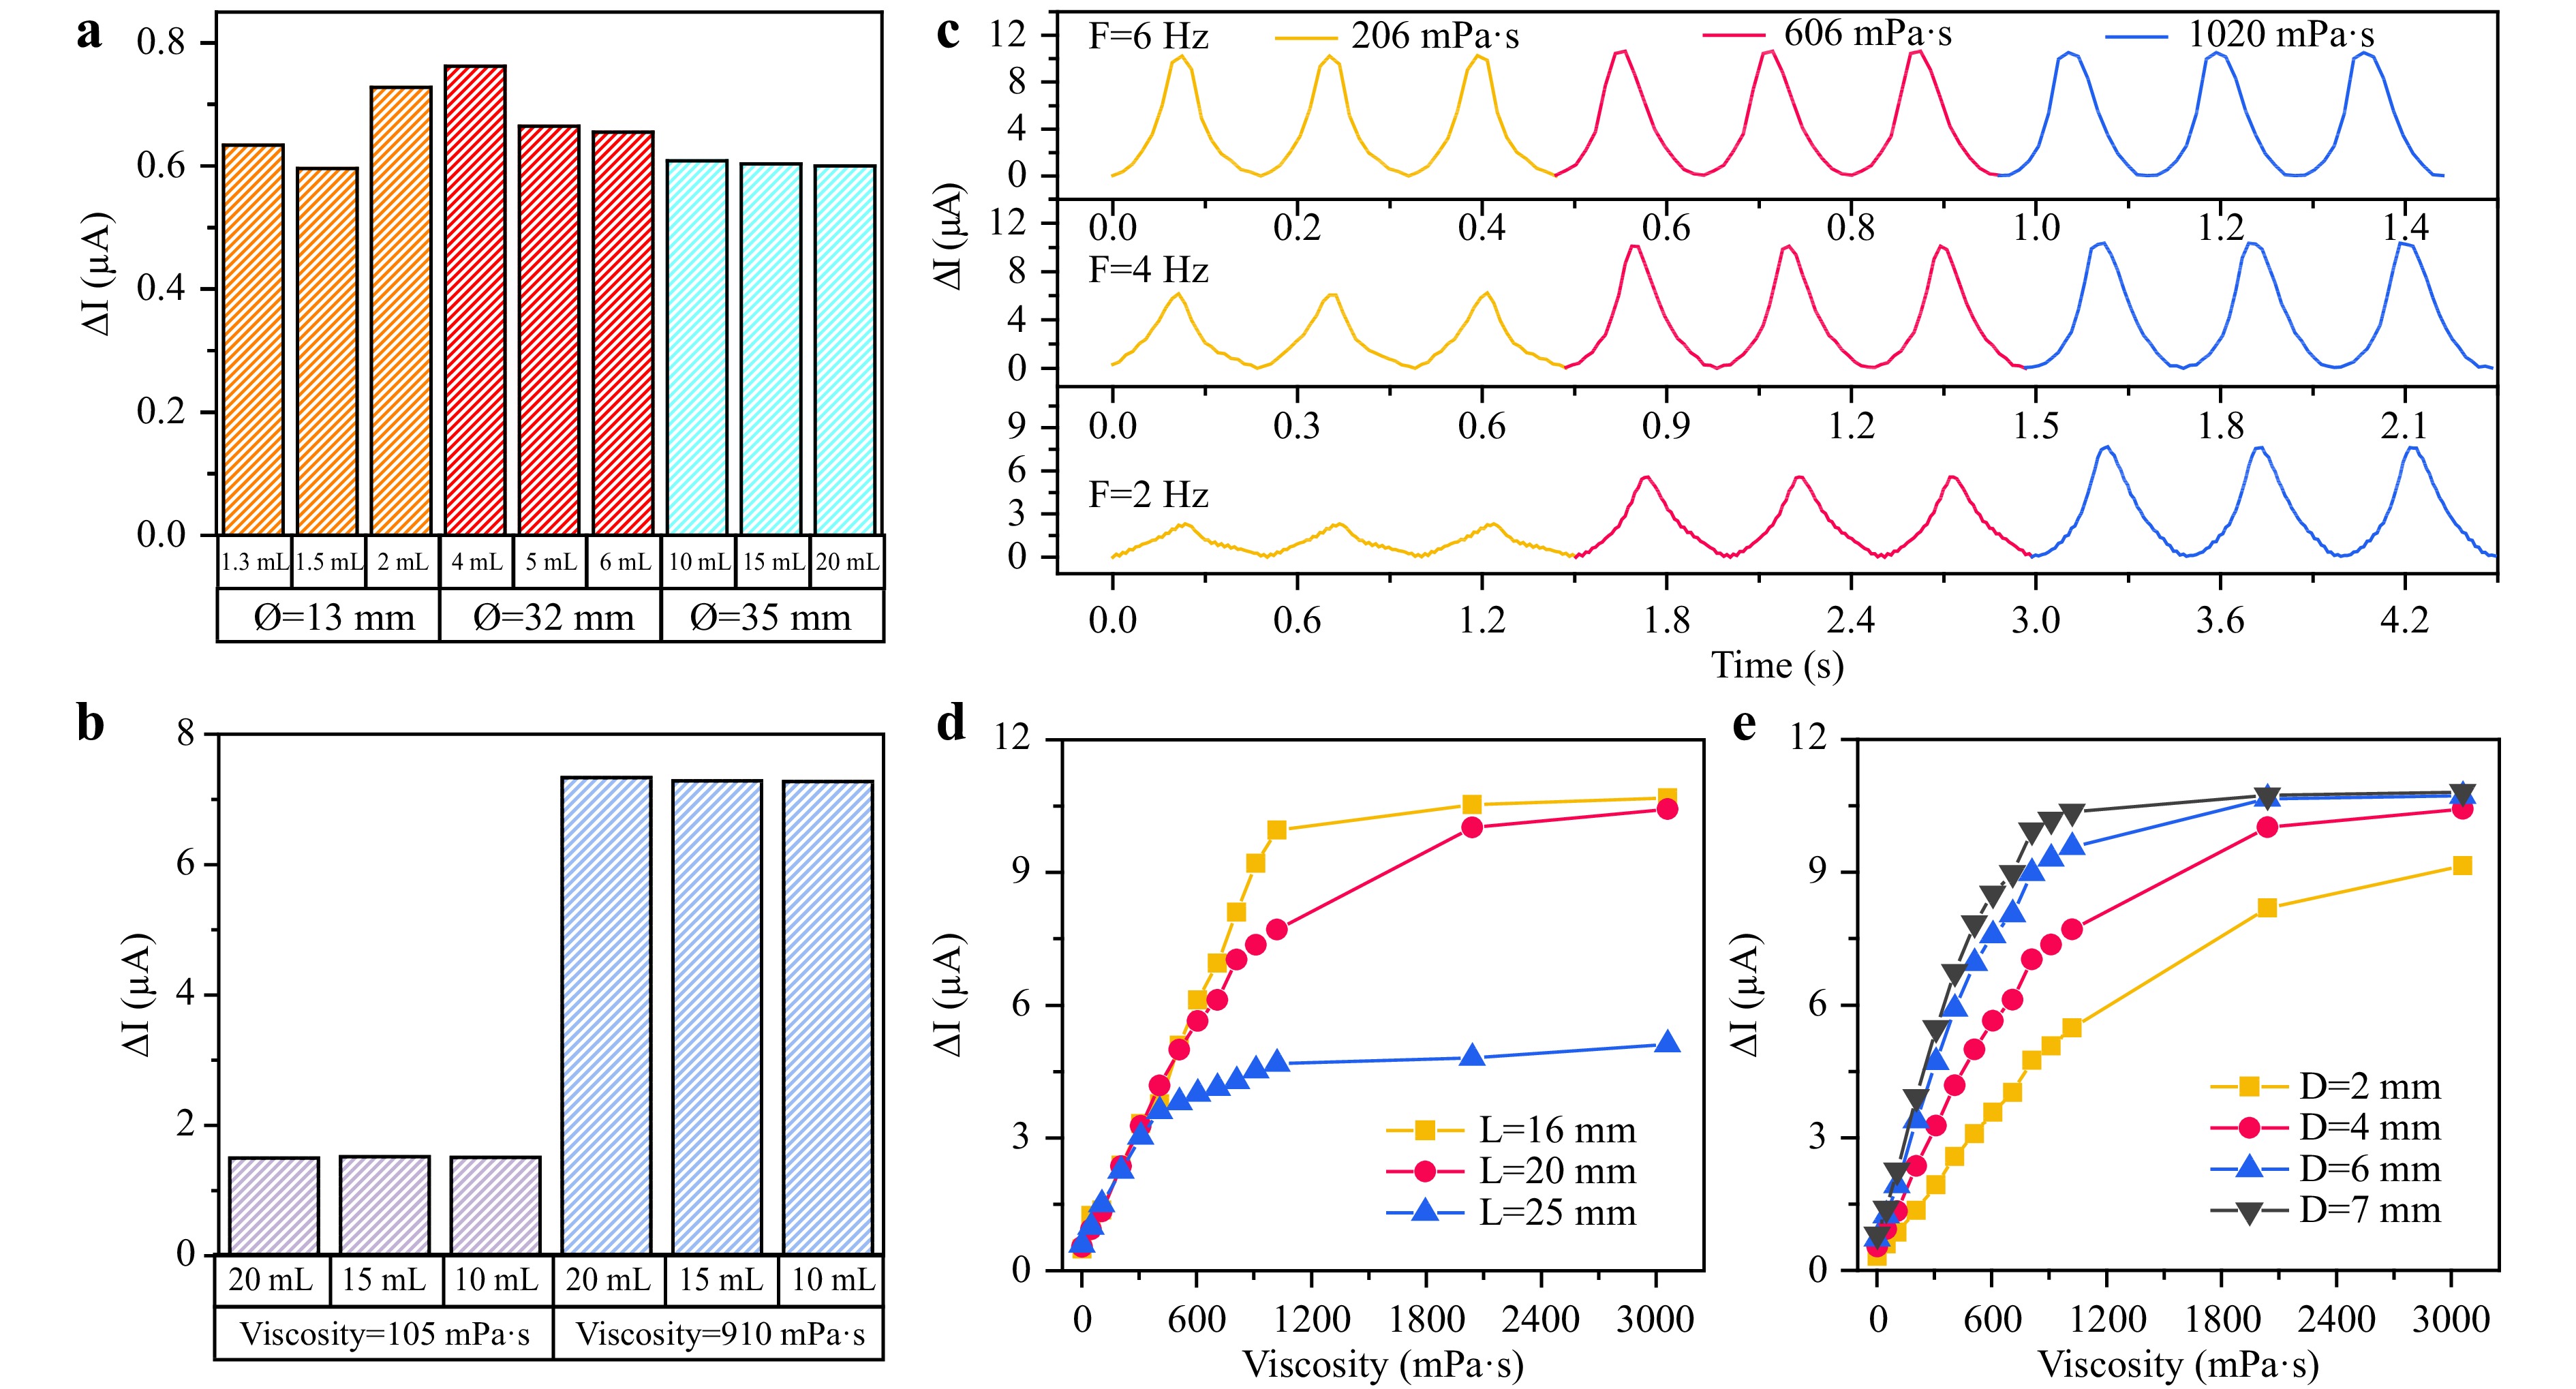
Fig. 3 a Effect of container diameter and fluid volume on the photocurrent response of the viscometer. The viscosity of fluid is 3 mPa∙s. b Effect of fluid viscosity and volume on the photocurrent response. The container diameter is 35 mm. c Measured photocurrent response based on varying combinations of fluid viscosity and vibration frequency. Measured photocurrent changes as a function of viscosity according to different d lengths of strips and e immersion depths.
Fig. 3c plots the measured photocurrents based on various combinations of fluid viscosity and vibration frequency. The higher viscosity introduces a larger resisting force to the strip, thus increasing its bending extent. The peak-to-peak photocurrent (ΔI) of the periodic signal can be used to indicate the viscosity of the sample. Although applying a frequency of 6 Hz can introduce a large ΔI of greater than 10 µA for a low-viscosity sample of 206 mPa∙s, only a slight increase in ΔI of less than 0.5 µA is found when the viscosity is further increased to 1020 mPa∙s.
To make the difference in measured results for fluid viscosity more pronounced, vibrations with reduced frequencies were utilized. At a frequency of 2 Hz, the difference in ΔI between fluid viscosities of 206 and 1020 mPa∙s can be expanded to greater than 5.3 µA. A low vibration frequency of 2 Hz is also preferrable to avoid unwanted heat and air bubbles in the fluid sample.
In addition to the vibration frequency, the structural parameters of the viscometer were investigated. When the fixed end of the strip was close to the device and vibrations of the same magnitude were applied to the device equipped with different strips, the strip region exhibited a decreasing displacement change with increasing distance from the free end of the strip. In other words, a shorter strip introduced a larger displacement change in the device. Although the shorter strip resulted in a higher sensitivity (represented by steeper slopes), the measurement more readily reached saturation, as illustrated in Fig. 3d. Thus, a strip length of 20 mm was selected. Moreover, the strip with deeper immersion experienced greater resistance, increasing the extent of strip bending and, thus, the measured ΔI. To balance the performance in terms of measurement range and sensitivity, the immersion depth was maintained at a moderate level of 4 mm, as shown in Fig. 3e.
According to the optimization results presented in Fig. 3, a balanced and reliable measurement can be achieved with the parameter combination of a strip length of 20 mm, an immersion depth of 4 mm, and a vibration frequency of 2 Hz. Fig. 4a shows the measured ΔI as a function of the viscosity. The device incorporating a 0.02-mm-thick strip provided a linear response over a viscosity range of 3–910 mPa∙s. When a linear regression was performed on the measured data, a slope of 7.785 nA/mPa∙s and an R2 value of 0.989 were determined. When the fluid viscosity exceeded 910 mPa∙s, ΔI began to saturate. To extend the measurement range, strips of the same lengths and widths but increased thicknesses from 0.02 to 0.04 mm were employed to withstand the high resisting force introduced by the high-viscosity fluids. As shown in Fig. 4b, a linear response range was obtained from 910–7920 mPa∙s. When a strip with a thickness of 0.09 mm was equipped, linear responses were found in the viscosity ranges of 7910–39,800 and 39,800–100,100 mPa∙s, as shown in Fig. 4c. Fig. 4d summarizes the measured ΔI with the three strips, revealing an ultrawide measurement range of 100–106 mPa∙s with insignificant error bars. The natural frequencies were 52.8, 107.6, and 188.3 Hz for the strips with thicknesses of 0.02, 0.04, and 0.09 mm, respectively. Mild vibration with a low frequency of 2 Hz was maintained to prevent the generation of air bubbles trapped in the fluid samples. This driving frequency was much lower than the natural frequencies of the strips; thus, resonance is unlikely to occur.
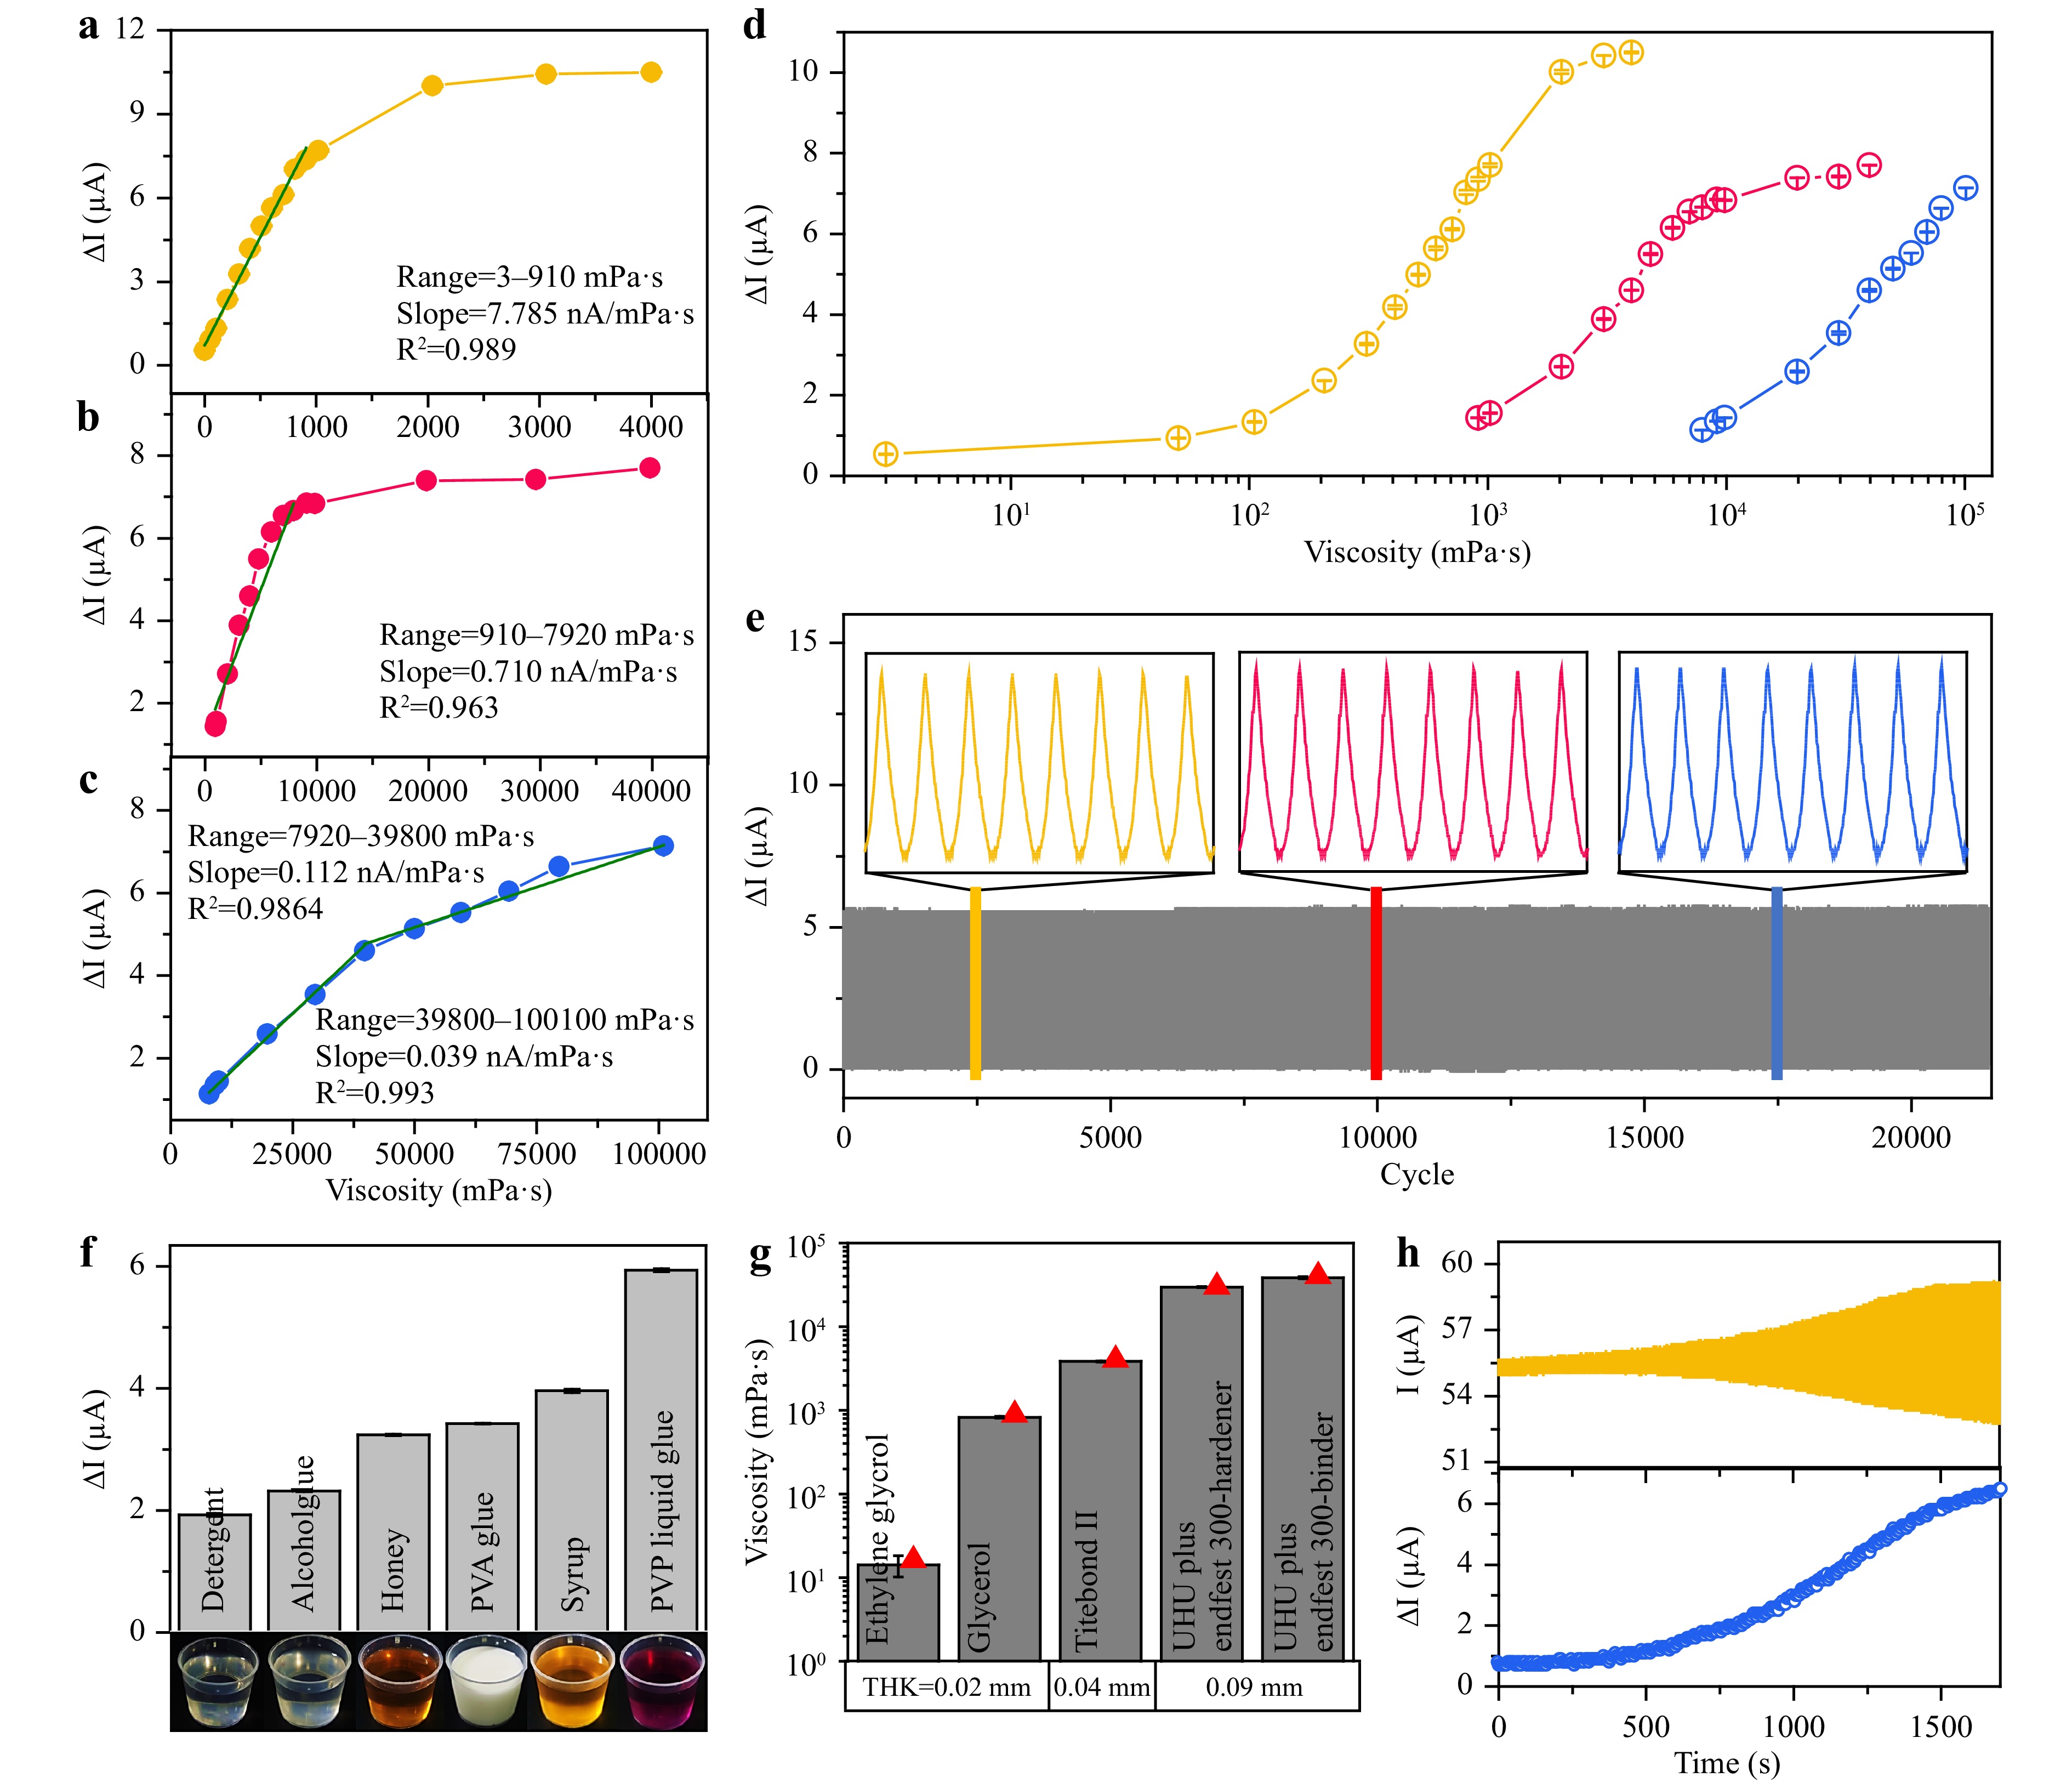
Fig. 4 Measured photocurrent change as a function of viscosity for the viscometer using strips with thicknesses of a 0.02 mm, b 0.04 mm, and c 0.09 mm. The green lines correspond to the fitted regression lines. d Plot of a–c in semilog scale. e Stability test of the viscometer measuring a fluid sample with a viscosity of 4810 mPa∙s over 21,000 cycles at 2 Hz. f Photocurrent response measured from different practical samples using the viscometer with a 0.04-mm-thick strip. g Viscosity measurement of five samples with largely different viscosities using the viscometer equipped with strips of varying thicknesses (THK). The red triangle represents the known viscosity of the sample. h Real-time monitoring of the silicone elastomer gel during the curing when the viscometer is equipped with a 0.09-mm-thick strip.
A cyclic test of the viscometer was performed by measuring a fluid sample with a viscosity of 4810 mPa∙s over 21,000 repeated cycles. As shown in Fig. 4e, a high degree of stability of the readout signal was maintained throughout the entire period. The magnified photocurrent plots for the three different periods in the inset of the figure are identical. The practicality of the proposed viscometer was verified by measuring its photocurrent response in practical fluid samples. The viscosities of the tested fluids with a volume of 20 mL can be readily distinguished by the measured photocurrent levels, as shown in Fig. 4f. In addition, viscosity measurements were conducted for five fluids with largely different viscosities. Based on the photocurrent–viscosity relationship presented in Fig. 4a–c, the viscosity value can be determined by linear interpolation between the two closest data points based on standard silicone oils with verified viscosities. As illustrated in Fig. 4g, the viscosity values measured with the proposed viscometer were highly consistent with known values. The real-time monitoring capability of the viscometer was determined by acquiring the photocurrent response of high-viscosity silicone elastomer gels during the curing process. As shown in Fig. 4h, the measured photocurrent increased with curing time, implying an increase in the elastomer viscosity. This increasing trend with curing time is highly consistent with those reported in the literature35, confirming the real-time monitoring capability of the viscometer.
Table 1 summarizes a comparison of the proposed viscometer with the commercial and previously reported ones. Various advanced measurement methods reported in the literature can measure viscosities up to the order of 102 mPa∙s based on sub-milliliter fluid volumes. For approaches with wider measurement ranges, sample volumes of tens of milliliters are required. The proposed viscometer, based on a low-cost, miniaturized design, not only provides a measurement range comparable to those of commercial ones but also exhibits superior performance in terms of rapid measurement and real-time monitoring capability.
Method Range (mPa∙s) Sample volume (mL) Measurement time Real-time monitoring ability Rotational torque36 (commercial) 100–4 × 10⁶ 500 NA No Falling ball36(commercial) 0.5–7 × 10⁴ 40 Long No Capillary36(commercial) 0.3–106 18–25 Long No Capillary wave/laser interferometer27 1–105 30 Short NA Optical fiber19 0.8–612 0.5–4 Long No Microfluidic9 2–100 0.08–0.4 Short Yes Resonant frequency37 0–200 0.13 Short NA Drag force38 0.1–100 0.031–1.4 NA NA Fluorescent dye/optical fiber21 6–13.36 NA NA Yes This work 3–1 × 10⁶ 20 Short (<5 s) Yes Table 1. Comparison of the proposed viscometers with commercial and previously reported ones.
The operation of existing optical systems involves the assembly of the essential components: light source, waveguide, and detector. In addition to external optics and mechanical supporting parts for light coupling between components, spectral analysis units are necessary to determine the spectral shift. For the GaN device adopted in this work, the emitter and detector are monolithically formed on a chip-scale GaN platform, and the on-chip detector can directly sense the change in light intensity reflected by the strip displacement, which eliminates the external components and spectral analysis process. Therefore, the proposed measurement system has distinct advantages of high compactness and ease of operation. The major weakness of the proposed viscometer is that the optical and electrical properties of the GaN device incorporating InGaN MQWs are sensitive to temperature change39, and the current design must operate at a constant temperature of 25 °C. In environments with changing temperatures, further postprocessing and calibration of the measured data are necessary to improve the accuracy of the measured results. Moreover, the lateral vibration provided by the electrodynamic shaker is a sinusoidal back-and-forth movement rather than a constant linear movement, which may cause the shear rate to be less quantifiable. To obtain reliable measurements, a low vibration frequency of 2 Hz is necessary to avoid introducing air bubbles into the fluid. Such limitations may also restrict the adjustability of the shear rates when non-Newtonian fluids are measured.
In summary, a miniaturized viscometer was designed by integrating a GaN optical device with a bendable strip. The operating and structural parameters of the viscometer, including the vibration frequency, length, and immersion depth of the strip, were optimized. With the aid of three strips of varying thicknesses, the viscometer exhibited an extremely wide viscosity range on the order of 100–106 mPa∙s. Apart from the high degree of stability over 21,000 cycles, the ability to distinguish practical fluids of different viscosities and the real-time monitoring of elastomers under curing times were demonstrated, proving the potential of the proposed viscometer for the rapid analysis of various fluids in practical applications.
-
A GaN optical device consisting of an emitter and detector was fabricated using wafer-scale fabrication processes. The process begins by growing a 6-μm-thick GaN epitaxial structure on a 4-inch sapphire substrate in a Veeco K465i reactor using metal-organic chemical vapor deposition. Through mature developed sequences and parameters, the device structure is primarily composed of an undoped GaN layer, Si-doped GaN (n-GaN) layer, InGaN/GaN MQWs, and Mg-doped GaN (p-GaN) layer. The mesa regions of the emitter and detector were patterned using photolithography, and the n-GaN surface was exposed using Cl2-based inductively coupled plasma (ICP) etching. An indium tin oxide current spreading layer was deposited on the p-GaN surface, followed by the deposition of the electrodes. For the emitter and detector to operate simultaneously without introducing electrical crosstalk, an intermediate GaN layer spaced at 10 µm was etched down to the sapphire using ICP. Coated by plasma-enhanced chemical vapor deposition, a SiO2 layer was used to passivate the etched sidewalls. A TiO2/SiO2 distributed Bragg reflector was deposited as the optical reflector. The p- and n-electrodes were exposed using photolithography and ICP etching. The photomask patterns in the p- and n-pad areas were defined by photolithography, and the metal pads were electron-beam evaporated to complete the electrical connection. After the sapphire substrate was polished and the processed wafer was diced, the chip, with a size of 1mm × 1 mm, was flip-chip bonded on a PCB using a reflow solder process at 250 °C.
-
The viscometer was mounted vertically, and the unfixed end was partially immersed in the fluid samples. Calibrated samples based on silicone oils with viscosities ranging from 3 to 100,100 were purchased. During the measurement, lateral vibration with a fixed amplitude of 5.6 mm was provided by an electrodynamic shaker, and the emitter was biased with a constant current of 2 mA. The photocurrent signals from the unbiased detector were collected using a Keithley Model 2450 SourceMeter unit with a measurement resolution of 50 pA. To measure the transient response of the detector, the emitted signal was powered by a square wave with an amplitude of 0–2.7 V and a frequency of 10 kHz using an arbitrary waveform generator. The detector was connected to a transimpedance amplifier equipped with an oscilloscope to acquire the photovoltage signals. For real-time measurement, a silicone elastomer gel (Dow Corning Sylgard 184) prepared by mixing the base/curing agent in a 10:1 ratio by weight was placed on a hot plate at 120 °C.
-
K.H.L. acknowledges financial support from the National Natural Science Foundation of China (Nos. 62004088 and 12074170) and the Shenzhen Fundamental Research Program (No. JCYJ20220530113201003).
Miniature viscometer incorporating GaN optical devices with an ultrawide measurement range
- Light: Advanced Manufacturing 4, Article number: (2023)
- Received: 14 June 2022
- Revised: 12 December 2022
- Accepted: 17 December 2022 Published online: 10 February 2023
doi: https://doi.org/10.37188/lam.2023.002
Research Summary
Miniature viscometer incorporating GaN optical devices with an ultra-wide measurement range
The measurement and assessment of fluid viscosity, which make it possible to determine fluid flow properties, are critical in the oil, food, cosmetic, pharmaceutical, and chemical industries. Herein, a novel design of a viscometer based on the integration of a chip-scale GaN optical device with a bendable strip is reported. The developed viscometer can measure fluid viscosity over an ultrawide range of 100–106 mPa∙s. This work also demonstrates the remarkable features of fast measurement, high stability, and real-time monitoring capability, which prove its potential as a new generation of viscosity-measuring units in various practical applications.
Rights and permissions
Open Access This article is licensed under a Creative Commons Attribution 4.0 International License, which permits use, sharing, adaptation, distribution and reproduction in any medium or format, as long as you give appropriate credit to the original author(s) and the source, provide a link to the Creative Commons license, and indicate if changes were made. The images or other third party material in this article are included in the article′s Creative Commons license, unless indicated otherwise in a credit line to the material. If material is not included in the article′s Creative Commons license and your intended use is not permitted by statutory regulation or exceeds the permitted use, you will need to obtain permission directly from the copyright holder. To view a copy of this license, visit http://creativecommons.org/licenses/by/4.0/.

 DownLoad: