HTML
-
Various applications, including water quality monitoring, environmental analysis, analytical chemistry, biomedical and pharmaceutical research, require precise pH control. Two common laboratory methods for pH detection are ion colorimetry (using pH strips) and electrochemistry (using pH meters). Strips offer a quick and affordable option but lack precision, typically providing the accuracy of approximately one pH unit. Special strips designed for narrow pH ranges may feature color graduations as fine as 0.2 pH units and respond within several tens of seconds. Electrochemical pH meters are several orders of magnitude more precise, and modern instruments with advanced electronics enable the resolution down to 0.001 pH units with a response time down to several seconds1. However, they have drawbacks, such as fragility, limited suitability for analyzing small volumes, challenges in miniaturization, signal drift without recalibration, sensitivity to temperature changes, and the need for regeneration before use2. Optical pH sensors are promising alternatives to traditional electrochemical methods with advantages like compactness down to submicrometer sizes, cost-effectiveness, and high sensitivity. In addition, they are resistant to electromagnetic interference, support remote interrogation, can be minimally invasive, and eliminate the need for separate reference sensors.
Optical pH detection uses changes in absorption or fluorescence in a solid matrix with encapsulated colorimetric or fluorescent indicator dyes, with fluorescence offering greater selectivity and sensitivity3, 4. The typical performance of these pH sensors is defined by limited dynamic range of ±1.5, response time of up to several minutes, and resolution of 0.01 pH unit. Another approach involves the pH-triggered reversible expansion of specific polymers, which is optically detected by changes in the refractive index. Both methods rely on establishing equilibrium within the sensitive material through diffusion, with a reduced layer thickness accelerating the response time. However, they are susceptible to variations in temperature and ionic strength, and indicator dyes are additionally affected by photobleaching and ambient light. Unlike indicator dyes, pH-sensitive materials benefit from a wider dynamic range, with the possibility of measuring extreme pH values that are not accessible to electrochemical pH meters5. Common refractive index-based pH detectors include fiber/waveguide6, surface plasmon resonance (SPR)7, and interferometric8 schemes. The performance of fiber/waveguide sensors is limited by their interaction length, SPR suffers from rapid wave attenuation, and interferometric schemes offer high sensitivity at the cost of increased complexity. The most technologically advanced refractive index-based pH-sensing schemes among them can be as accurate as 0.001 pH units with response times of few tens of seconds5. Optical microresonator-based sensing, featuring extended interaction length and other advantages, is emergeing as a competitive pH detection solution9, 10.
In optical microresonators, the electromagnetic field is confined within the dielectric material by the refractive index contrast, forming closed round loops11, 12. Whispering gallery mode (WGM) resonances, characterized by the constructive interference of waves within the circular cavity and low energy dissipation, exhibit high quality (Q-) factors13. Changes in the resonator or environmental properties, such as temperature or biomolecule binding, appear as spectral changes in WGM, enabling sensing14−16. These changes include resonance line shift, linewidth broadening, and mode splitting, as well as variations in the backscattered field intensity caused by nearby nanoparticles17, 18. Various extensions, such as plasmonic-photonic schemes19, 20, doping with gain medium21, 22, and utilization of exceptional points23, enhance the sensitivity of the original WGM detection method24. Multiple optically coupled microresonators can transform symmetric WGM resonances into asymmetric Fano resonances with sharper lines, thereby improving the sensing performance25, 26. Recently, deep learning algorithms have paved the way for affordable and robust sensing in the multiplexed detection scheme, allowing the simultaneous monitoring of hundreds or even thousands of resonators27, 28.
Advancements in microresonator-based sensing technology have enabled the detection of various physical and chemical parameters29−35. For example, pH detection can be achieved by coating microresonators with pH-sensitive layers and tracking the refractive index of the layer caused by structural changes36−38. One method involves depositing polyelectrolyte (PAA/PAH) multilayers onto silica toroidal microresonators, ensuring detection at the level of 0.14 pH units36. Another approach involves functionalizing the interior surface of hollow bottle/bubble silica resonators37, 38. Unlike the previous example, this allows the main part of the electromagnetic field, instead of solely the evanescent tail, to interact with the pH-sensitive layer without a significant loss in the loaded Q-factor. Hydrogel-embedded particles demonstrate detectivity of 0.06 pH units and a response time down to 15 s37. Films out of polyelectrolyte gels (PVA/PAA) sense pH in the range of 6-10, with a suppressed reaction to refractive index changes38. Recently, pH variations in surfactant solutions were tracked via the molecular reactions of Rhodamine B, which was used as the active medium to obtain WGM lasing39. This approach demonstrated the sensing step of 0.15, a response time of up to 60 s, and numerically estimated detection limit of 0.004 pH.
Thus, the primary emphasis in the development of optical pH detectors has been given so far achieving a fast response within a wide pH range to become valuable alternatives to pH meters. Notably, alterations in pH to a level of 0.01 or below in a narrow range can have significant implications for analytical accuracy in biomedical research, clinical diagnostics, and environmental assessment40, 41. In particular, for studies on enzyme kinetics or immunoassays, where optical microresonators are effective sensing tools, maintaining a stable pH within a narrow range is critical to ensure reproducibility and accurate interpretation of the results. Here, pH fluctuations in a buffered solution, in which the sensed components are immersed, can occur slowly over time as the buffer components react to external influences.
Using smart materials such as hydrogels and polymers throughout the entire volume of the microresonator, rather than depositing them locally as a film on the cavity, amplifies the spectral response of the sensor. The fabrication of structures capable of changing their function or shape in response to various external factors, such as temperature, humidity, light, electric field, pH, and chemical composition, is known as 4D printing42, 43. The 4D printing of micrometer-scale structures with optical quality can be ensured by two-photon polymerization (2PP)44. We recently demonstrated the capability of this technique for fabricating 4D microresonators which enables loaded quality factors of up to 105 in aqueous media45, 46. Another recent example is the 4D printing of the fiber-tip microcantilever probes with 2PP using a multimaterial strategy for accurate magnetic field sensing47.
In this paper, we report a novel approach for high-precision pH value detection of aqueous solutions utilizing a multiplexed sensor of 4D optical microresonators fabricated with two-photon polymerization. We discuss the design and manufacturing of multiplexed sensors with integrated structures appearing as dual optically coupled 4D microresonators for simultaneous interrogation. We evaluated the sensing performance for detecting small pH changes in an aqueous environment near pH = 7.4 using multiplexed sensors with both single and dual 4D microresonators. It has been revealed that, compared to single 4D microresonators, the dual structures exhibit enhanced spectral shifts and increased distinctions between spectral features in response to pH-induced cavity shape changes. We demonstrated that the pH state of aqueous media can be determined explicitly in steps of 0.01 (limited by an external reference pH meter). Together with the estimated detection limit of 0.003, this ranks our approach among the most sensitive pH value detection schemes. By taking advantage of the multiplexed imaging platform with up to thousands of optical microresonators integrated, dual 4D microresonators combined with other types of microresonators are able to provide accurate biochemical studies which are immune to pH alterations.
-
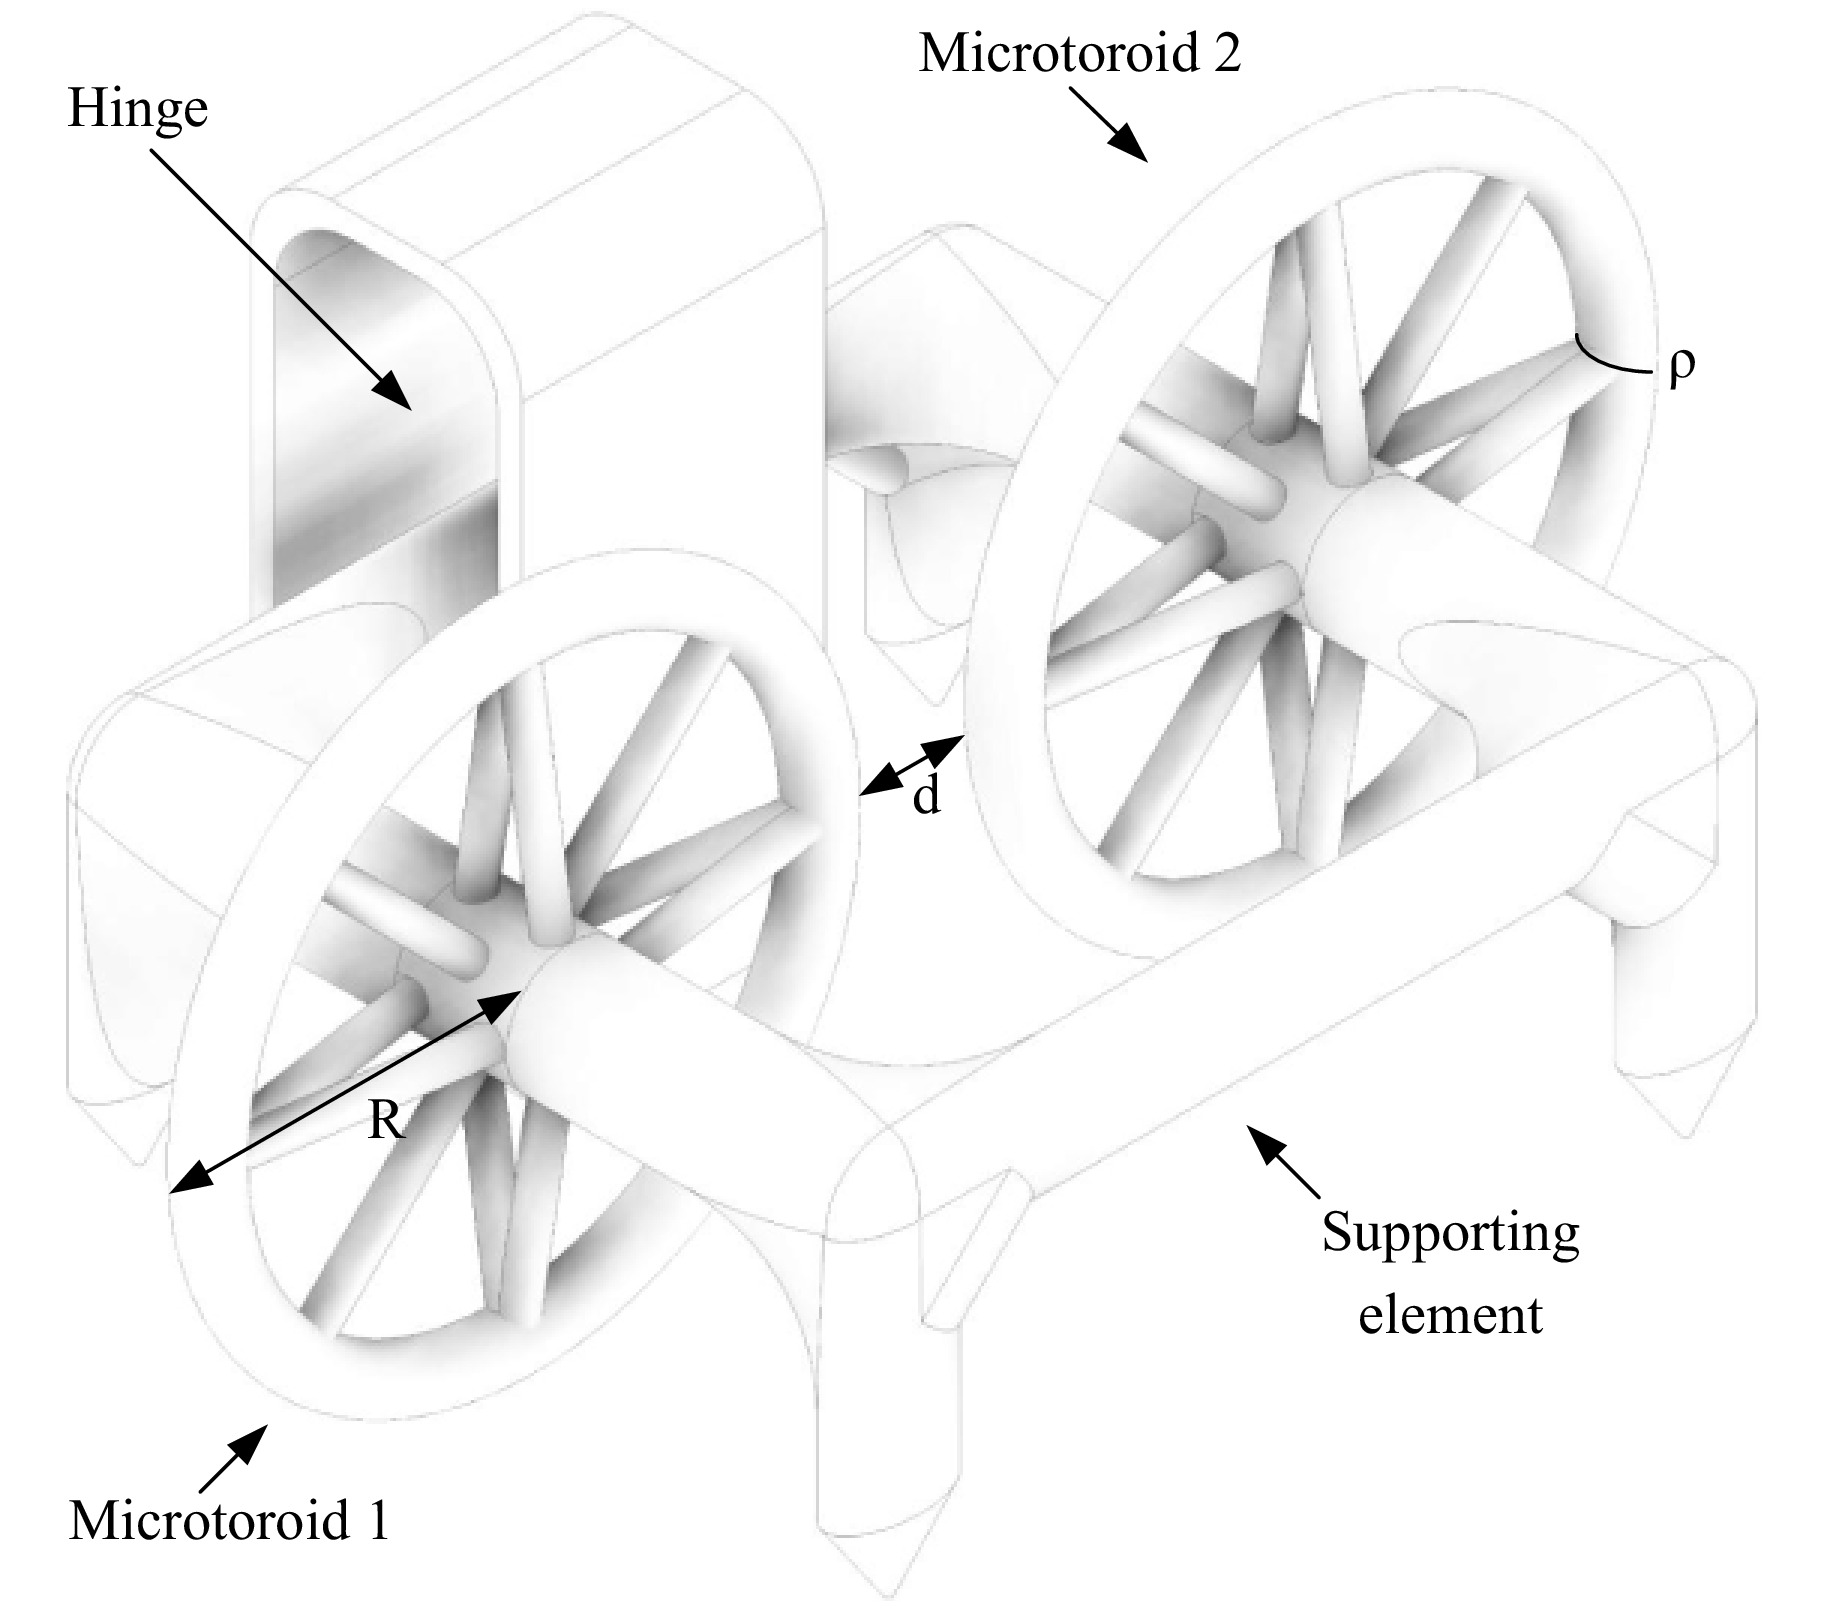
Dual 4D microresonator design and fabrication In order to fabricate a dual microresonator sensing structure using two-photon polymerization, we propose a model with two identical toroidal cavities allocated in the vicinity of each other to enable optical coupling between them (Fig. 1).
The features of a single 4D microcavity closely followed the parameters described in our previous publications45, 46. The microtoroid model is characterized by major and minor radii with values of R = 21 μm and ρ = 1.8 μm, respectively, which were optimized to minimize the radiation losses along the curvature of the microcavity. The chosen microtoroid geometry allows the numerically estimated radiation-limited Q-factor to approach the absorption-limited one (1.3 × 10⁷)45. Individual microtoroids are fixed to each other via a supporting element for long-term stability and are allocated at a distance, or gap, (d). The latter was searched in the range between 600 nm and 3 μm to enable optical coupling between single microtoroids after fabrication. In order to mitigate the surface roughness and associated scattering losses, primarily originating from the cross-linking between the polymer layers, as well as to precisely control the distance between the two resonators, a flexible support (hinge) is introduced to the model of the dual microcavity structure. This support enables the use of a layer-wise polymerization strategy, accommodating various orientations of the microresonator's symmetry axis during the polymerization and sensing phases. The reduction of scattering losses relies on optimizing the intersection between the polymerization voxels and translation speed of the focus spot to ensure the smoothness of the microresonator rim. The upper limit of the loaded Q-factor of microresonators fabricated with 2PP was estimated at the level of 105 in water, constrained by the remaining surface roughness (Fig. 2).
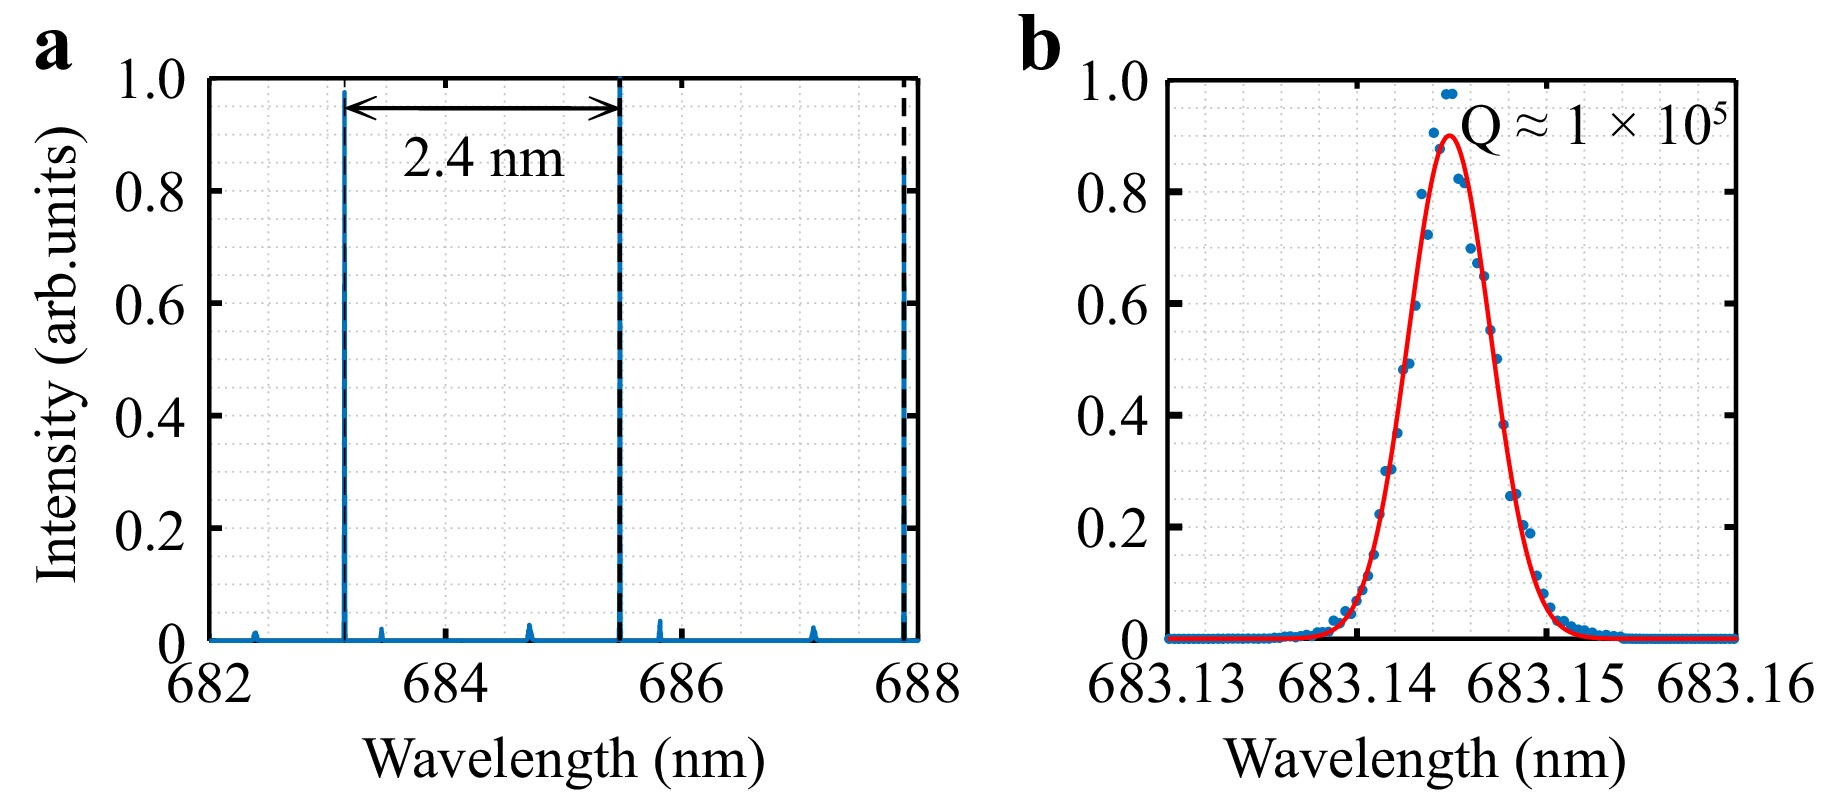
Fig. 2 WGM spectral properties of the representative 4D microresonator with highest Q-factor. a Overview of the WGM resonances over the 6 nm spectral range. b Spectral shape of the resonance line (blue dots) along with the fitting curve (red line).
Loaded Q-factor variation is typical for both single and dual microresonator sensors. This is due to the natural shape discrepancy of the microresonators on the same substrate and slight variations in the thickness of the distancing layer dedicated to optimizing the coupling conditions. Owing to the increased fabrication voxel caused by the geometrical dimensions of the dual resonators, the probability of excitation of multiple modes of higher orders increases. They may overlap even under optimized illumination conditions in the multiplexed imaging scheme. Moreover, in case of optical coupling for dual microresonator sensors, mode mixing and their overlapping are also possible. Because of the mode overlapping, the loaded Q-factor for particular dual 4D cavities drops down to 5 × 10³ (Fig. 3).
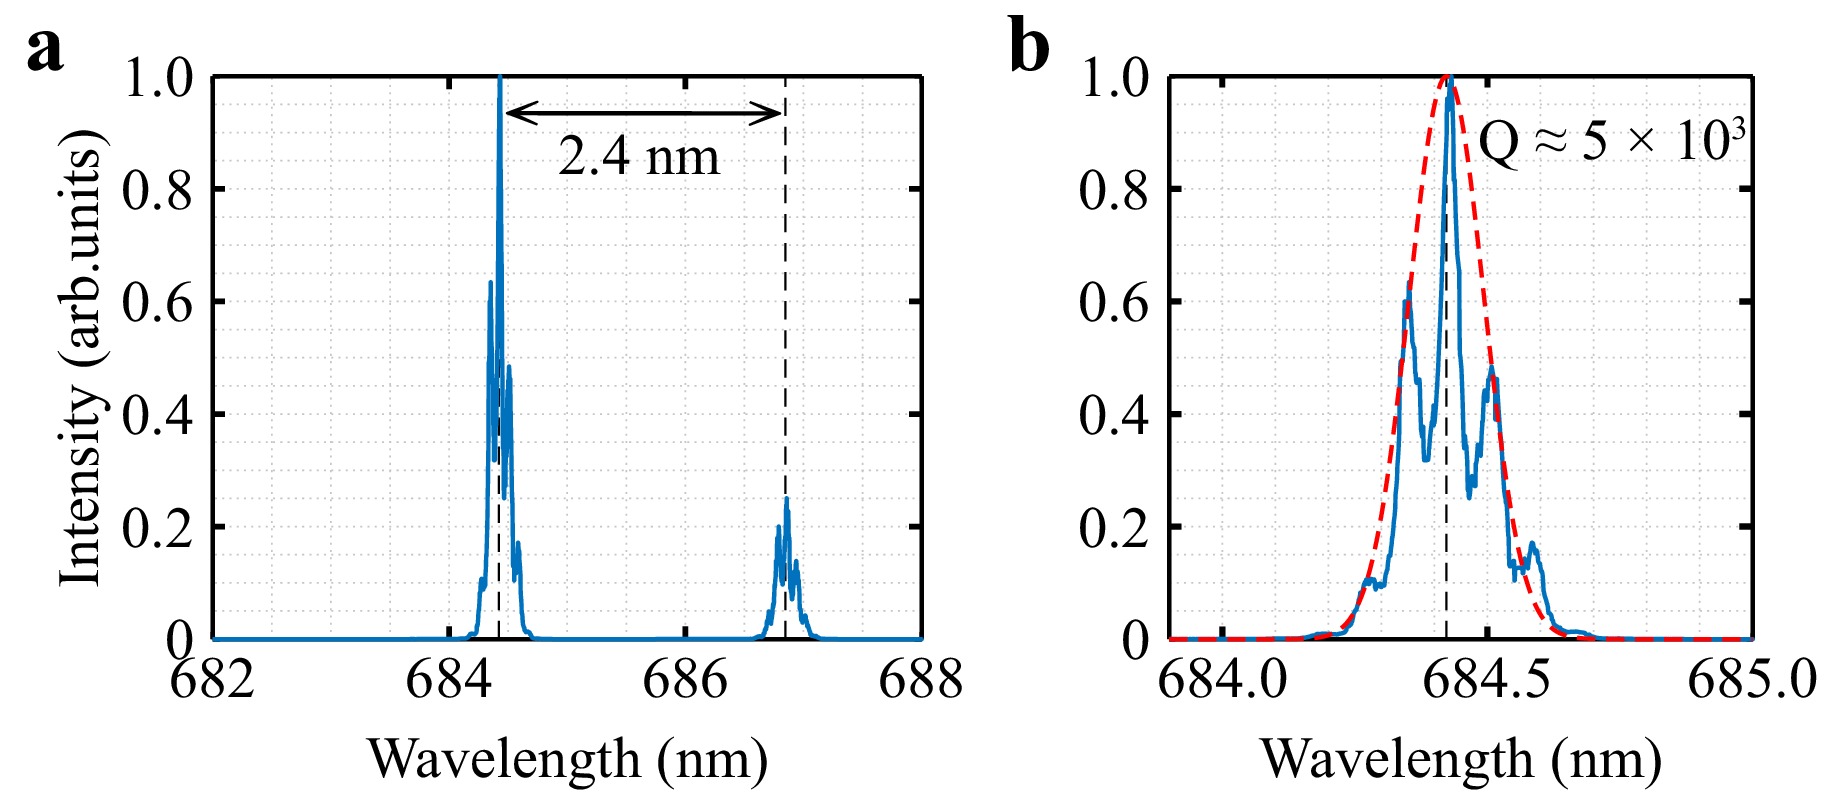
Fig. 3 WGM spectral properties of the representative 4D microresonator with lowest Q-factor. a Overview of the WGM resonances over the 6 nm spectral range. b Spectral shape of the resonance line (blue) along with the fitting curve (red).
It was determined that for the applied photoresin illumination conditions, the gap below 1.4 μm set in the model remains insufficient to avoid cross-polymerization of the two microresonators. This is due to the partial yielding of the polymerization voxel outside the geometry and the cumulative effect of radical polymerization, resulting in the gap defined in the model exceeding the measured gap by ≈1.4 μm. When the gap between toroids defined in the model approaches 2.2 μm, the microresonators stand apart on more than a wavelength. At this point, the resonators can be considered two individual optically independent, microcavities. Representative SEM images of the microresonators, that are polymerized together (direct contact), optically coupled, and optically independent, are shown in Fig. 4.
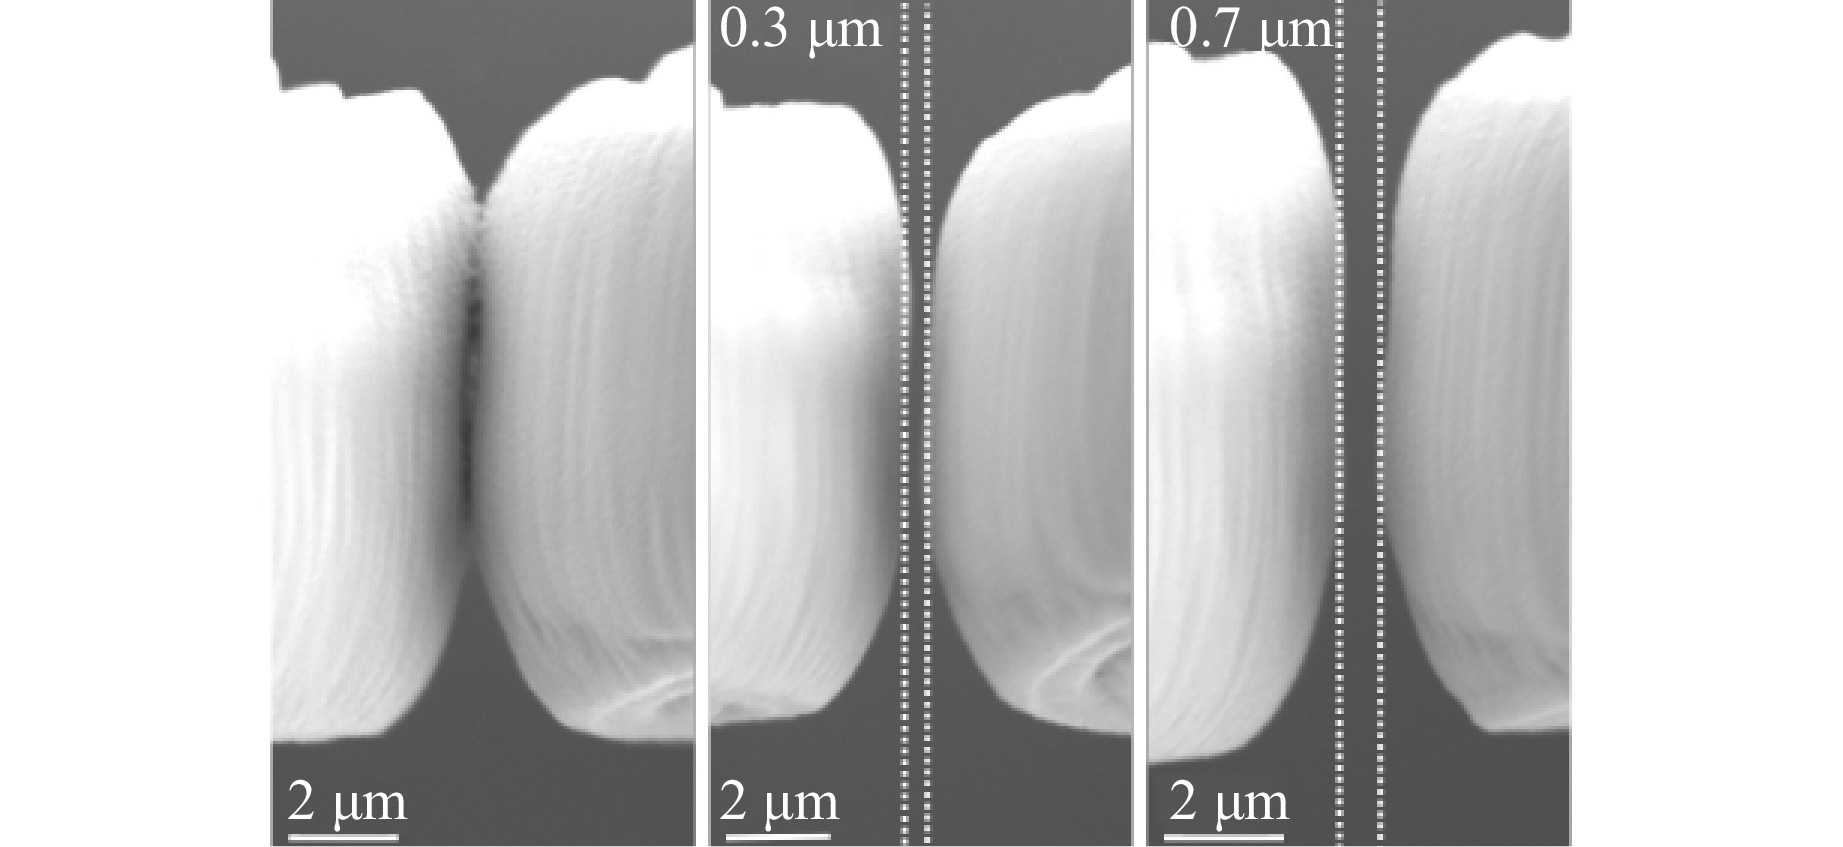
Fig. 4 SEM images of the dual microresonator sensor with a zoomed-in view of the gap between the cavities for three different coupling regimes (from left to right): polymerized together (direct contact), optically coupled, and optically independent.
Despite the high precision provided by two-photon polymerization, when the photoresist is illuminated at medium to high focal spot translation speeds, the standard deviation of the gap in the double microresonator structure reaches a hundred nanometers for the same model. For this reason, an array of hundreds of dual structures made using the same model enables the evaluation of the sensing performance of the coupled dual 4D microresonators. Scanning electron microscopy (SEM) image of a representative multiplexed sensor with dual 4D microresonators is provided in Fig. 5.
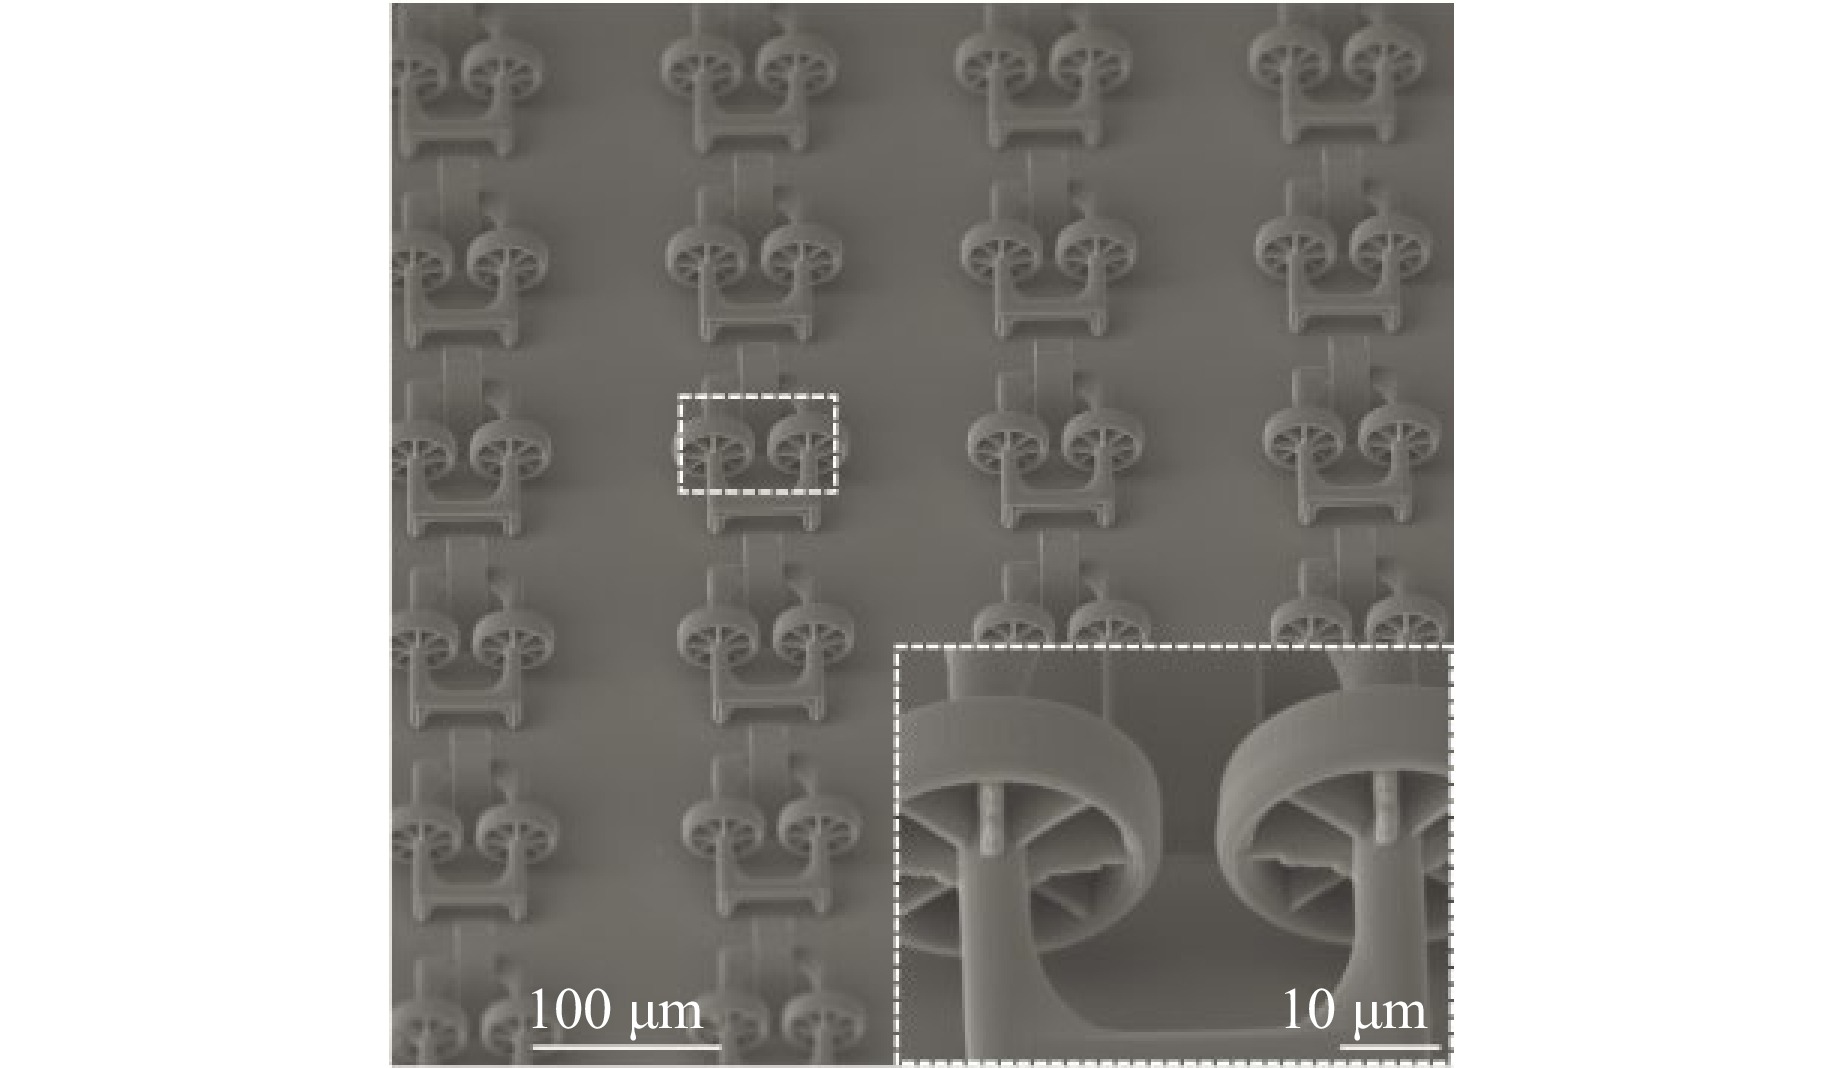
Fig. 5 SEM images (Zeiss EVO MA 15) of the array of dual 4D toroid microresonator sensing units. Inset zooms into a single dual structure to show the quality of the microcavity rims.
Sensor samples with two different models of dual structures with the design gap of 1.6 and 1.8 μm were fabricated: the first group predominantly comprised coupled and in-contact resonators, whereas the second group contained coupled and independent toroids. Fig. 6 presents an image of the fabricated multiplexed sensor sample captured using the measurement setup. The displayed sample features four groups of dual toroid microcavities (two upper groups −1.6 μm and two bottom ones −1.8 μm) allocated in steps of 200 μm.
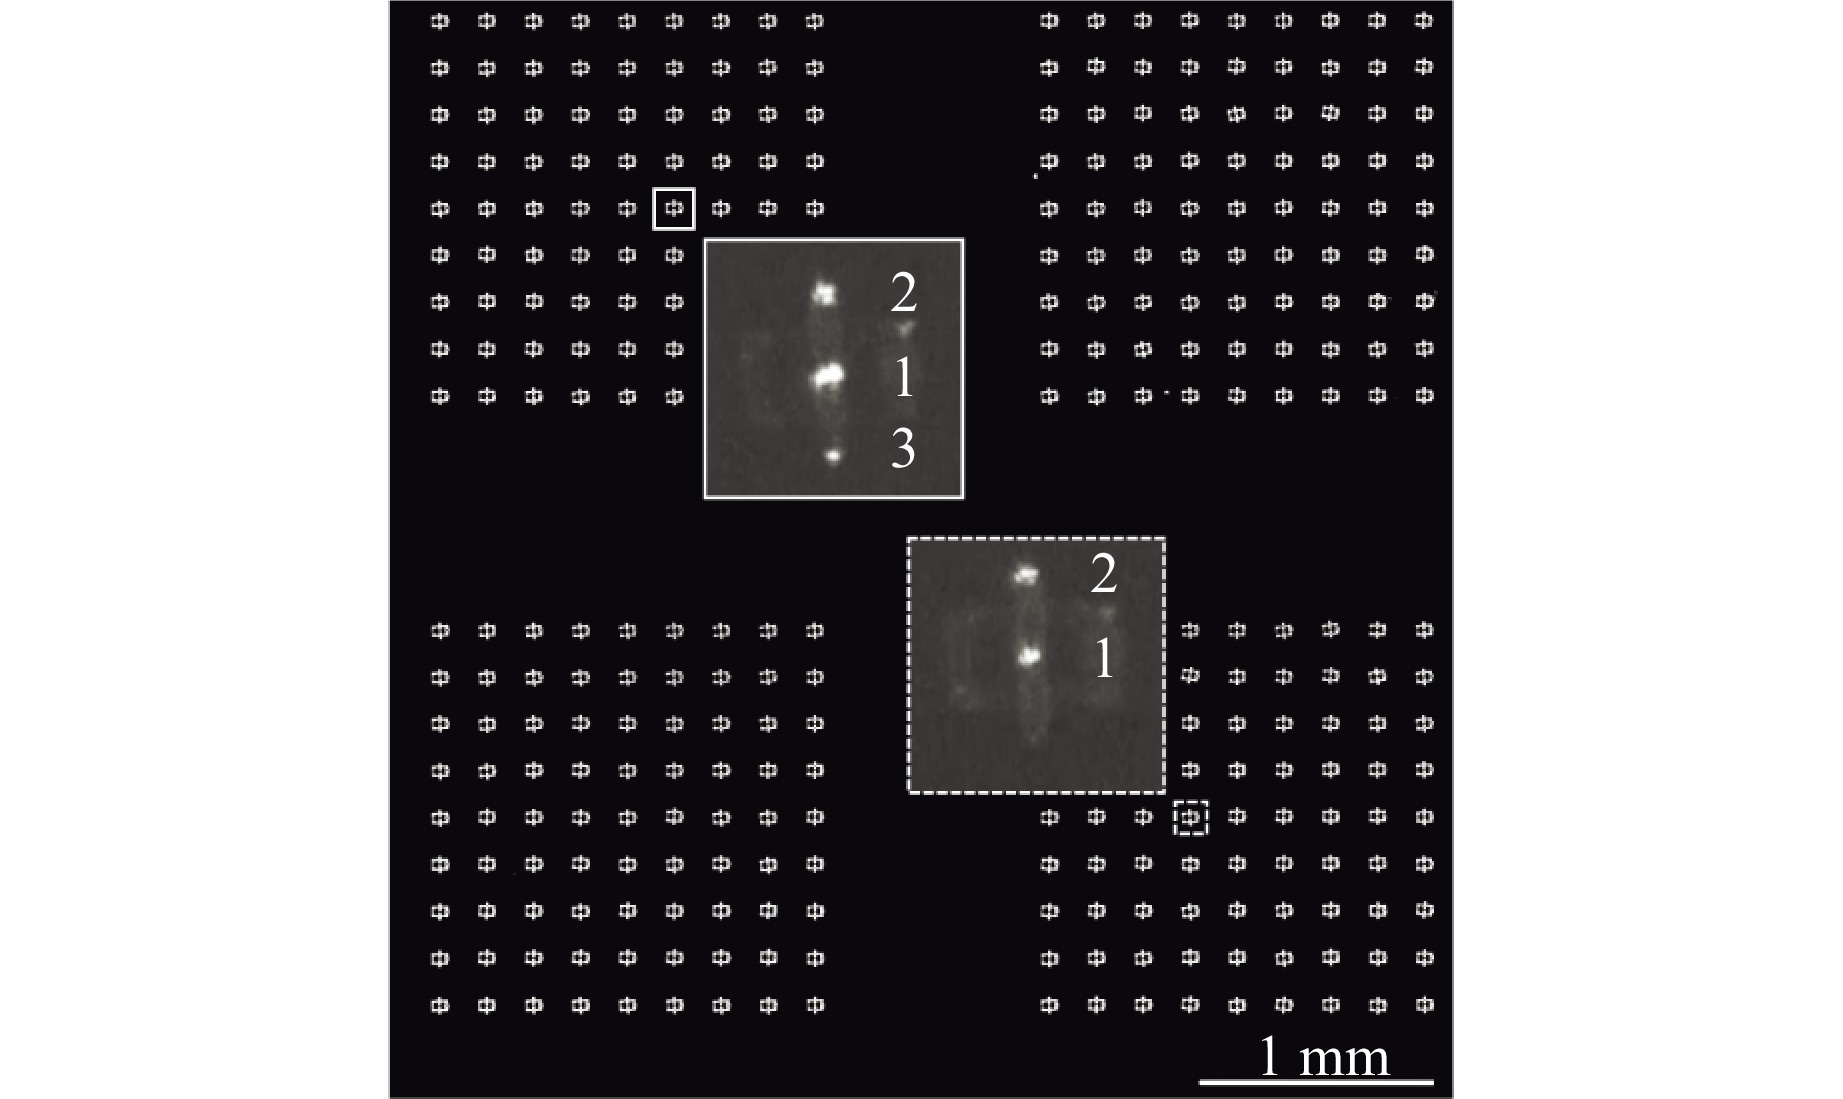
Fig. 6 Overview of the multiplexed sensor out of four groups of 4D microresonators with 81 dual structures in each. The image has been captured by the camera of the measuring instrument under external illumination. Insets demonstrate an overview of the resonance signal for coupled (solid) and independent (dashed) toroids with three and two sensing spots respectively.
In the multiplexed microresonator imaging scheme, the signal of an individual microresonator is characterized by the appearance of a single light radiation (sensing) spot45. It is localized at the resonator edge along the laser beam propagation path and indicates the propagation direction of the dominant mode in the cavity. In the geometry of the sample shown in Fig. 6, the excitation direction is oriented from the bottom upward and thus the sensing spot appears at the top end of the image of the toroid. As seen in the insets in Fig. 6, the signal of the dual microresonator sensor is characterized by at least two sensing spots (1,2 in Fig. 6), one per each toroid in the structure. The third sensing spot (3 in Fig. 6) in the case of independent resonators is absent or remains weak, which indicates only back radiation on the surface roughness of the first microresonator. When the microresonators are fabricated closer to each other and the interval between them approaches the distance suitable for optical coupling, the mutual energy transfer occurs between the first and the second resonators. Thus, the strength of the signal at the third point becomes significant and indicates the secondary back-radiated waves propagating in the first toroid. The radiation spot related to the secondary waves inside the second toroid appears in the vicinity of the sensing spot of the first cavity and cannot be resolved as a separate signal. Therefore, the third sensing spot is a clear indicator of mutual energy transfer between the toroids.
pH detection with a single 4D microresonator The structures fabricated from the diffusion-assisted SZ2080 material with two-photon polymerization exhibit the self-sensing capabilities enabling the realization of a 4D sensor. The self-sensing mechanism is conditioned by the incorporation of the DMAEMA monomer that contains dimethylamino group that can protonate (gain a hydrogen ion) under acidic conditions and deprotonate (lose a hydrogen ion) under basic conditions. The change in the DMAEMA charge state initiates expansion and contraction forces acting on the polymerized structure when immersed in different liquids. This phenomenon has already been revealed for single 4D microtoroids, where their spectral shift response rises by an order of magnitude compared to the one expected for the pure evanescent field reaction45, 46. In case of significant distortions in the 4D resonator shape, the spectral composition within a single free spectral range (FSR) may alter. Moreover, the natural diversity between the fabricated 4D structures results in a variance in the spectral composition for individual structures. Therefore, to address this, we introduced a second parameter, the mode intensity, in addition to the spectral shift. This parameter is intended to describe the excitation efficiency of WGMs of different orders and was estimated as the radiated light intensity integrated over the single FSR where the spectrum is corrected for shift in advance. At first, the sensing response of the array with single 4D microresonators for pH detection was studied. Alterations of the pH value around pH = 7.4 were validated with an external pH meter and ensured by mixing the phosphate buffer saline (PBS) solution with small portions of 0.2 M NaOH (increase) and 3.7% HCl (reduction). The PBS buffer is able to provide a stable pH environment, making it more suitable for the validation of sensing performance compared to, e.g., deionized water which, in turn, lacks buffering capacity and is susceptible to pH changes when exposed to external factors such as dissolved gases, atmospheric CO2 absorption, and contamination. It is anticipated that variations in the final viscosity of the adjusted PBS solutions are negligible.
The PBS buffer is known for maintaining the pH within a relatively narrow range, even with changes in temperature. At around room temperature, the observed shifts in pH due to variations of several °C are generally small, amounting to only a few hundredths or even thousandths of a pH unit. Here, with increasing temperature pH tends to decrease. Consequently, the changes in the pH values within the measured solutions for the reported configurations can be considered negligible. At the same time, the temperature variations in the sensing chamber affect the spectral properties of microresonators caused by thermo-optic and thermoelastic effects. This impact was analyzed on example of the sensing phases representing the WGM signal of the microcavities in the pure PBS environment (which could last in total up to 30000 s for one single measurement). The spectral shift linearly follows the small temperature alterations, with different negative slope values for particular 4D microresonators. Based on the temperature response determined for each microresonator, the experimental data were adjusted for the temperature-related shift. An example of the temperature-altered spectral shift response summarized for an array with single 4D microresonators is represented in Fig. 7.
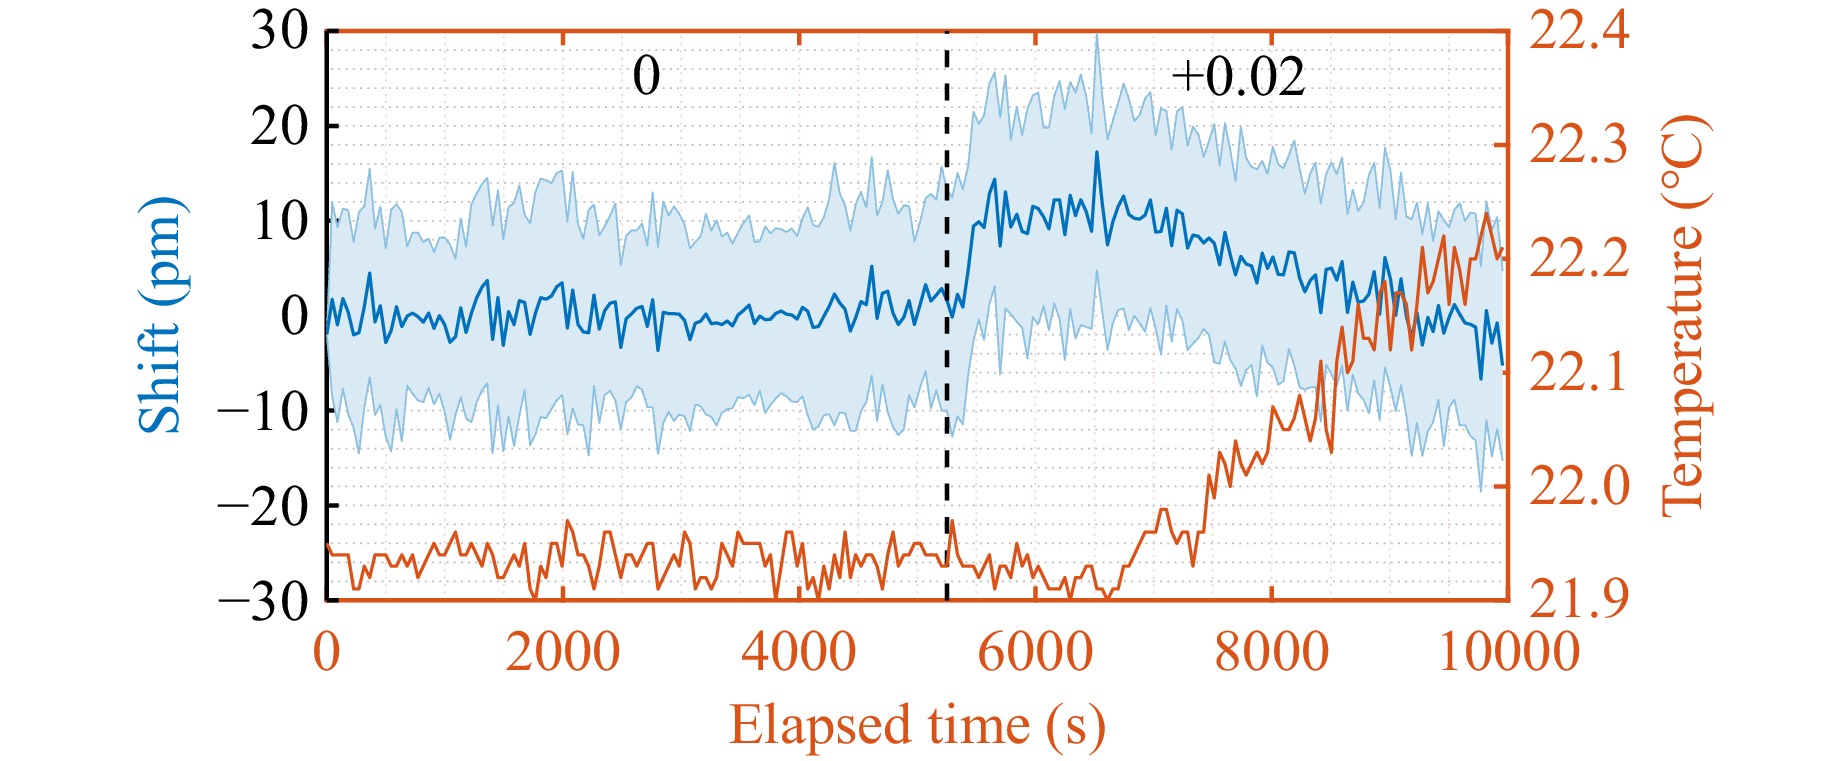
Fig. 7 Experimental results on the response of an array of single 4D microresonators for pH change of +0.02 (left axis) under thermal variations (right axis). Spectral shift data is calculated over 225 microresonators (solid line - mean value, shaded area - 95% confidence interval).
Here, for the first 5000 s of the measurement, the sensing chamber was filled with a pure PBS solution, and for the next 5000 s with a +0.02 pH-altered PBS solution. As it can be seen from the graph, as long as the temperature remains stable, the averaged spectral shift remains constant. Then, at 5000 s, when the pH value increases by 0.02, the averaged spectral shift rises by ≈10 pm and remains stable for the next 1000 s. Then, the temperature increased by 0.3 °C over the next 4000 s, which led to a back-shift of the resonance wavelength to the initial position measured for pure PBS. Thus, the temperature response for this example can be estimated at the averaged level of ≈ 33 pm/°C. The considerable confidence interval for the spectral shift demonstrated in Fig. 7 clearly indicates the dispersion of the sensing properties of the microresonators caused by the natural dispersion in fabrication of the individual microcavities and their illumination. For this reason, the selected parameters are first calculated for each sensor and then generalized by applying principal component analysis (PCA) to the entire group27. In contrast to averaging among the microresonators, where each of them has equal contribution to the generalized response, PCA effectively captures the most significant variance within the dataset. For the generalized spectral shift, only the first principal component (PC1) was considered, since it commonly reflects more than 80% of the shift variability for the array. For the generalized mode intensity, more than only PC1 was accounted for. This approach to representing spectral variations offers the advantage of accommodating the varying sensitivities of the microresonators while mitigating the influence of localized fluctuations or noise, which are identified as insignificant components through the application of PCA.
The experimental results for the spectral responses of the single-microtoroid 4D sensor are represented in Fig. 8. The results present a clear spectral reaction of the multiplexed sensor with single 4D microresonators to the pH value changes. The spectral responses as the generalized spectral shift for pure and NaOH augmented PBS solutions (0, +0.07, +0.12, +0.2, and +0.29 pH) are shown in Fig. 8a. The sensor reaction to HCl augmented solutions (−0.05, −0.08, −0.12, and −0.2 pH) are demonstrated in Fig. 8b. Each solution was pumped for 6000 s through the measurement chamber, followed by the pumping of the PBS solution for 6000 s. As can be seen from the figures, the changes in the pH value lead to a clear dynamics of the generalized spectral shift response, where the sign of the pH value alteration matches the direction of the resonance spectral shift. This indicates that 4D toroids swell when the pH value increases and shrink when it reduces. Also, for a single microresonator, the 4D response in the case of pH change primarily manifests itself as a spectral shift. It is also revealed that the saturation values of the generalized shift are linearly dependent on small variations in the pH value in both the upward and downward directions. The dynamical variations represented in Fig. 8a, b indicate that the time interval required to reach equilibrium is longer when the difference between the pH values of the sensed liquids increases and may exceed 1000 s already at the absolute pH change of ≈ 0.2. When further increasing the step in the pH value between the two solutions measured in series up to the order of unity (the maximum pH value change of ≈ 5 was measured), the steady state for the generalized spectral shift is not attained within the chosen measuring range of 6000 s.
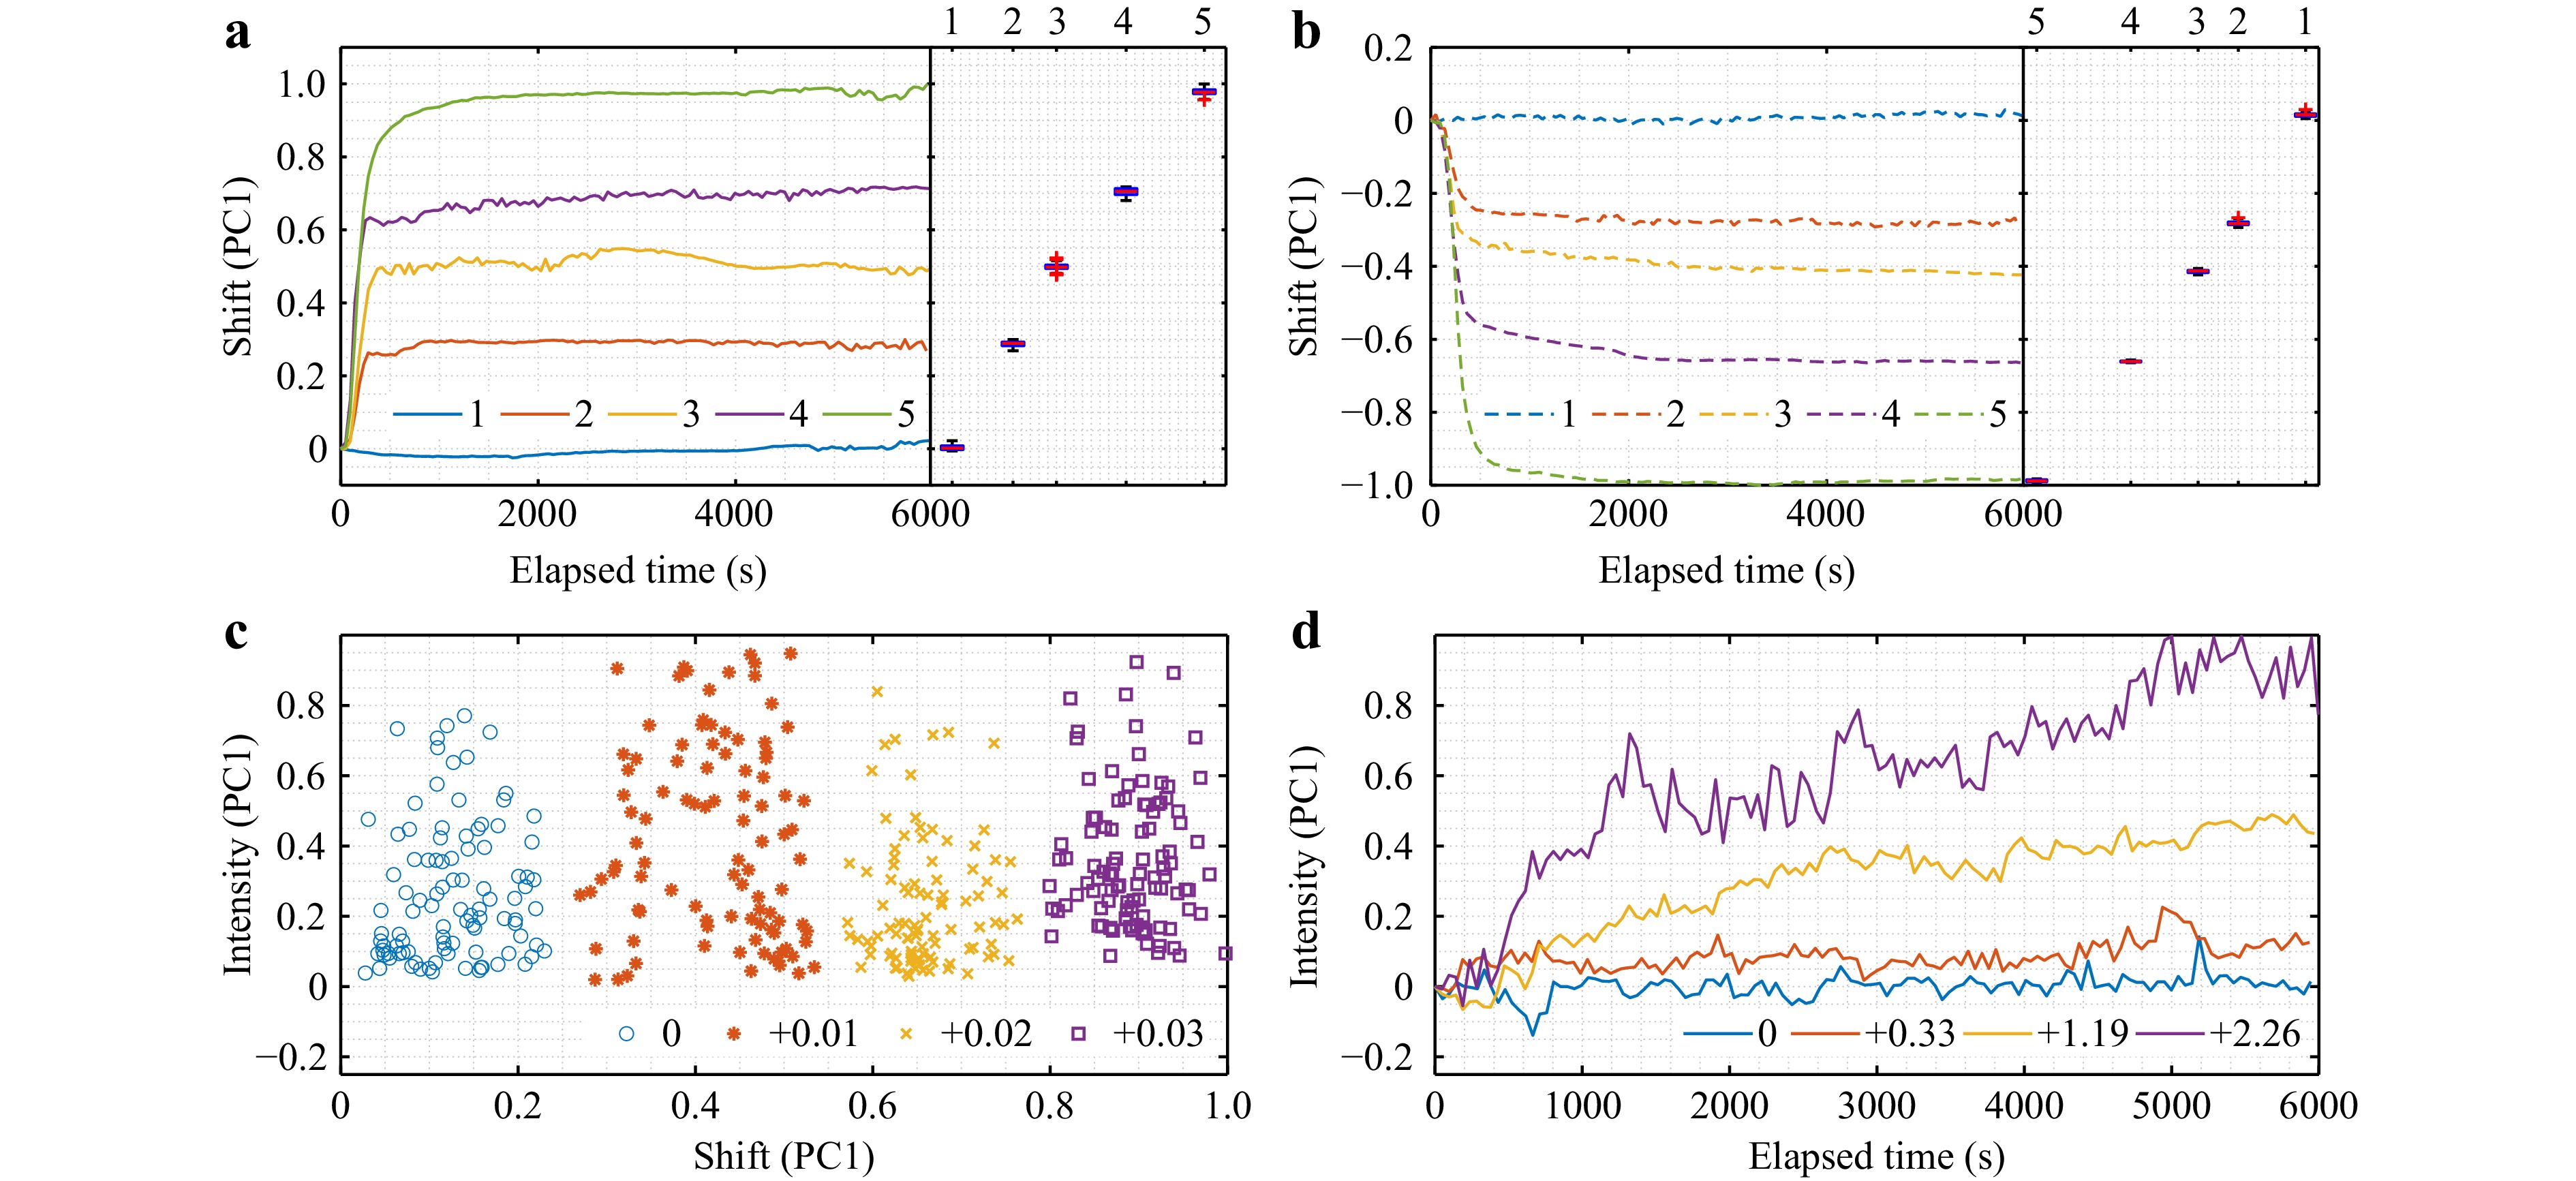
Fig. 8 Experimental results on pH-value detection with an array of single 4D microresonators. a Dynamics of the generalized spectral shift as a scaled first principal component (PC1) over 6000 s for a increasing [0 (1), +0.07 (2), +0.12 (3), +0.2 (4), +0.29 (5)] and b decreasing [0 (1), −0.05 (2), −0.08 (3), −0.12 (4), −0.2 (5)] pH values. c Allocation of pH values with the step of 0.01 in the space of the generalized spectral shift/mode intensity. d Dynamics of the generalized mode intensity over 6000 s for significant pH value alterations from +0.33 up to +2.26.
In order to estimate the pH value detection limit for the single 4D microresonators, a small portion of NaOH solution was added to PBS to attain the step in the pH value at the accuracy level of the reference pH meter (+0.01, +0.02, and +0.03). Each of these solutions was pumped over 6000 s, as done previously, and the saturation time points for the generalized spectral shift were extracted. It has been determined that for pH value changes below 0.03, the response time does not exceed 200 s. This is caused by refilling the sensing chamber (≈ 300 μl) with incoming liquids at the selected pumping speed (100 μl/min). To verify whether the different pH values can be distinctly separated from each other, we allocated them in the space of the generalized spectral shift and mode intensity (see Fig. 8c). The results show that the pH states can be explicitly separated with the step of 0.02, where the cluster formation for the spectral data is guaranteed by the generalized spectral shift, whereas the generalized mode intensity (PC1) spreads in the same region for all measured states. By increasing the pH value step by an order of magnitude (+0.33), the measured dynamics of the generalized mode intensity begins to exhibit a slight discrepancy from the baseline (Fig. 8d). When the pH value alteration approaches the unit order, the generalized mode intensity becomes valuable for the detection of different environmental states. In the case of large pH changes, the 4D microresonator shape undergoes strong swelling/shrinkage, which eventually leads to a change in the excitation efficiency of WGMs of different orders within the coupling region. Thus, when the resonator geometry is significantly altered, the 4D response is observed as changes in both the generalized spectral shift and mode intensity.
pH detection with dual 4D microresonator Next, we focused on analyzing the spectral variations of the dual 4D microresonators induced by changes in the pH value. Similar to single 4D microresonators, the swelling and shrinking of each toroid of the dual structure are initiated by varying the pH value. In turn, this leads to changes in the gap between the cavities and affects the conditions for coupling the modes between them. Here, the prominence of individual WGMs in the spectrum rises or declines depending on the initial conditions. Owing to the natural variance in the gap size between the toroids within an array, some of the dual 4D microresonators might not have optical contact. Therefore, from the entire array on the sample, only the structures with prominent signal in the back-radiated light spot (#3 in Fig. 6), i.e., structures with signal appearing at more than three standard deviations relative to the noise level, were included into the analysis. Thus, the dual toroids in physical (direct) or optical contact were selected. With the above considerations in mind, we repeated the measurement at the minimum increment (0.01) of the pH value for PBS solutions mixed with NaOH as previously performed for single microresonators (Fig. 9).
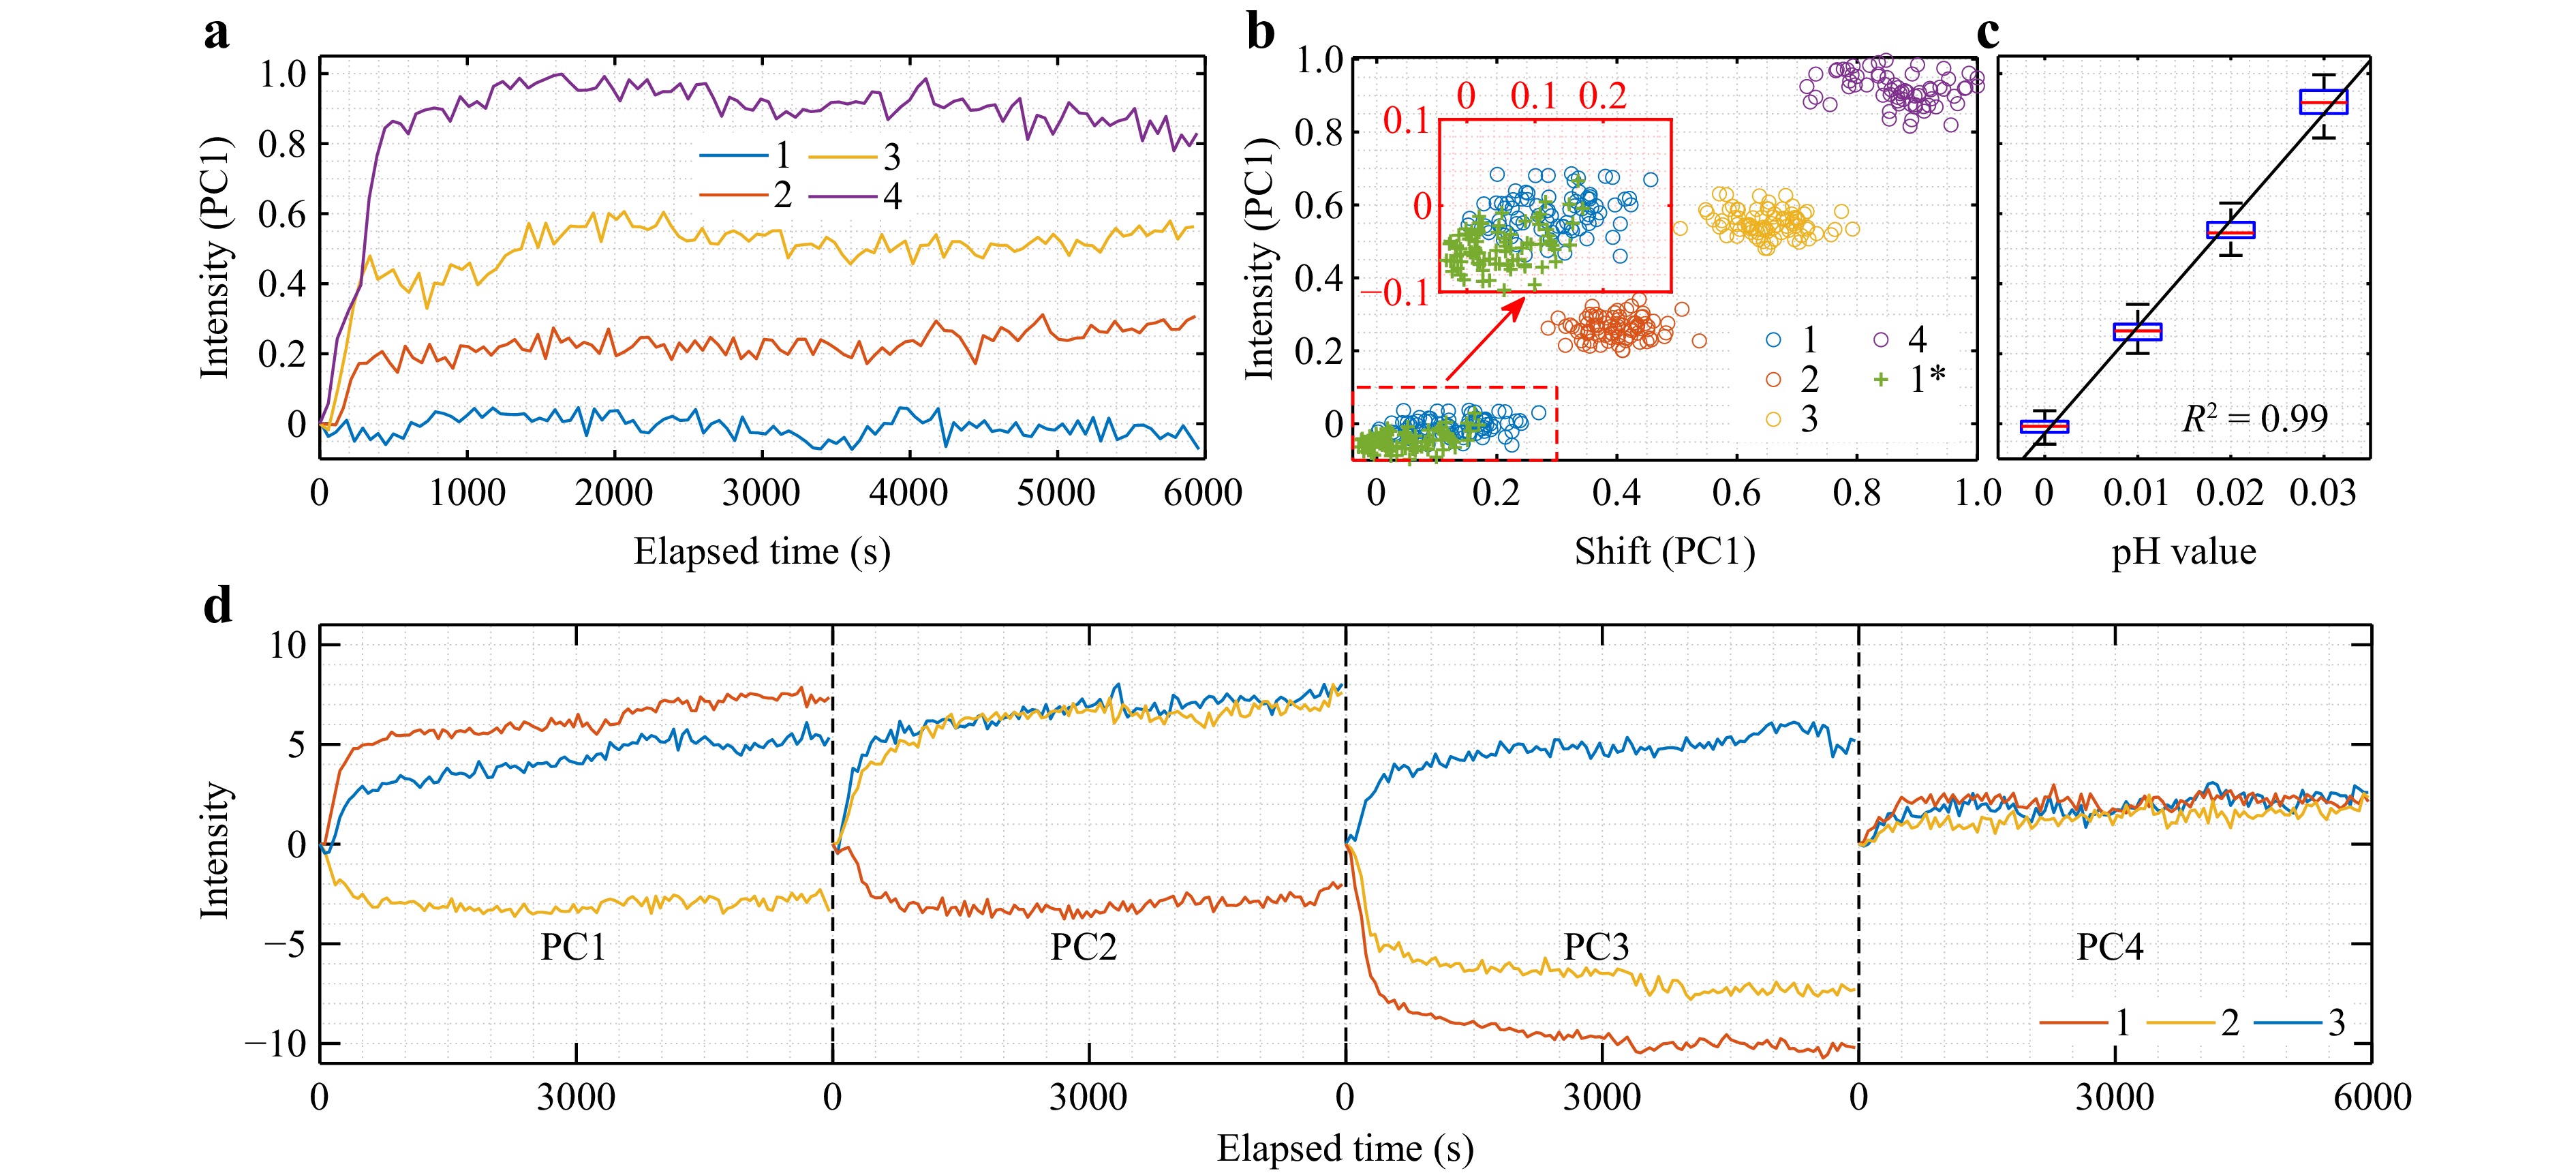
Fig. 9 The spectral response of the multiplexed sensor of optically coupled dual 4D microresonators on pH-value variations around pH = 7.4 measured for 6000 s. a Temporal dynamics of the generalized mode intensity (in the form of the scaled PC1) for different pH values [0 (1), +0.01 (2), +0.02 (3), +0.03 (4)]. b Scatter plot for stationary sensing data of different pH values [0 (1), +0.01 (2), +0.02 (3), +0.03 (4)] along with pH state 0 (1*) measured after the sensing cycle in the space of the generalized spectral shift and mode intensity. c Linear fit of the generalized mode intensity to changes in pH value. d Linkage between radiations spots sensing dynamics (1-center, 2-upper, 3-bottom) of the dual microresonator structure for sensing phase +0.03 pH.
The responses for the generalized mode intensity were classified into two groups according to the dynamics severity, where all the signal spots (see Fig. 6) were considered as independent signals. The first group of signals is characterized by expressed variations in dynamics with pH (Fig. 9a). Here, the saturation values increase with a larger step in the sensed pH level, indicating the intensified changes in the spectral mode structure. Together with the generalized spectral shift, the mode intensity-based responses for measured pH values states with the step of 0.01 form separate clusters that can be explicitly separated (Fig. 9b). Hence, when the optical contact is established, the multiplexed sensor with dual 4D microresonators demonstrates sensing performance improved at least twice compared to 4D sensors based on single toroids. An extra cluster (1*) with responses in pure PBS after measurement cycles of solutions with altered pH is added to denote the ability of the sensor to recover the baseline, and thus its repeatability. Clusters indicating the original sensor response and the response after several measurement cycles have a large overlapping area, with the mean offset of the scattered data not exceeding the initial spread range. Based on this, the baseline recovery after the measurement of a small pH value alteration can be defined as sufficient. The theoretical detection limit for the dual 4D structures is estimated by considering the sensitivity of the generalized mode intensity (S) using the formula $ LOD = 3\sigma/S $48, 49, where σ is the standard deviation of the generalized mode intensity for the baseline. A linear model describes the relationship of the generalized mode intensity over small variations in the pH value and is used to calculate parameters S and σ mentioned above (Fig. 9c). It was determined that alterations in the pH value at the level of 0.003 can be effectively determined.
Another group of responses of the dual sensors is characterized by random variations in the dynamics of the generalized mode intensity for all pH states studied. At the same time, the dynamics of the generalized spectral shift shows differences, with partial overlaps of the time points for different pH states. This group is expected to indicate dual resonators with physical contact, where the swelling of the microtoroid caused by the rise of pH value does not lead to significant disturbances in the conditions for coupling the modes between the microcavities.
In order to study the linkage between the mode structure variations of different sensing spots of the coupled resonators, their mode intensity dynamics are considered as independent signals and are merged for each dual structure. The principal components calculated from the mode intensity data for the linked sensing spots of the dual sensor for the highest step of the pH value in the batch (+0.03) is shown in Fig. 9d. The plot represents the dynamics of the first four PCs (together accounting for >60% of the variability in the sensing data) for the three signal spots of the coupled cavities. It can be clearly seen that different PCs indicate various directions and expressions of the dynamics of the mode intensity among the signals of the coupled resonators. Since the PC is a linear combination of the original microresonator signals, its direction does not necessarily coincide with the direction of the actual mode intensity changes. Therefore, only the mutual consistency of the temporal variations in terms of the sign was investigated. In this sense, the monitored PCs demonstrate all available combinations of spectral alterations, where PC1 describes the consistency of the backscattered signal (3) with the signal of the first resonator (1), PC2 with the second toroid (2), PC3 with neither the first nor second cavity, and PC4 with both signals. The numbering of the sensing spots is the same as that one used in Fig. 6 and denotes the first resonator, the second, and the back-radiated signals, respectively. In comparison to any of the first three PCs, the PC4 accounting less than 6% of the original data dispersion, shows a weak response to the measured pH alteration. Together with the same direction of dynamics for all signals, this case is expected to describe the response caused by the changed coupling conditions between the cavities and the optical prism.
An overview of the spectral mode changes for the initial (0) and increased (+0.03) pH values captured for the third sensing spot of the two representative dual microresonator structures is represented in Fig. 10. The demonstrated spectra are restricted to a single FSR since their variations are estimated to be below the spectral resolution, and consequently, remain non-resolvable. The demonstrated spectra were acquired for each phase under saturation conditions and corrected for spectral shift to express spectral shape variations. For the first dual sensor (Fig. 10a), a clear energy redistribution between the modes is observed, where the suppression and promotion of separate modes within a single FSR occur. Besides suppression of the first mode as a result of the increasing pH level, the loaded Q-factor decreases by ≈ 15%, which is linked to the changes in the coupling-limited Q-factor. The second mode, being originally completely suppressed, appears as a distinct peak when the pH value was increased. The measured spectrum for the second sensor is characterized by the mode splitting phenomenon, which is observable as the resonance lines spaced at a small interval (Fig. 10b). This response could be explained by the slight ellipticity of the path of the WGM propagation, where the split modes move away from each other with the deformation degree50, 51. As shown in (Fig. 10b), the swelling of the microcavities induced by the increased pH value results in the increased pitching step from 76 to 84 pm which corresponds to the change in the eccentricity level of just 0.3%.

Fig. 10 Overview of the spectral changes within the single FSR for stationary states of different pH values (0 and +0.03) measured at the third sensing spot for two exemplary dual 4D microcavities.
As a result, the reported multiplexed sensor based on dual 4D microresonators shows the detection limit of 0.003 for pH changes, which was determined from the difference in both the spectral shift and mode intensity dynamics. However, the ultimate precision is possible when small alterations in the pH value are monitored. When the pH value increases by one order of magnitude (compare to Fig. 9), the non-linear character of the spectral mode changes for optically coupled microresonators has to be considered. An example of the generalized mode intensity response for the pH value changing by −0.94, −0.51, +0.4, and +1.5 from the initial value of pH = 7.4 is depicted in Fig. 11.
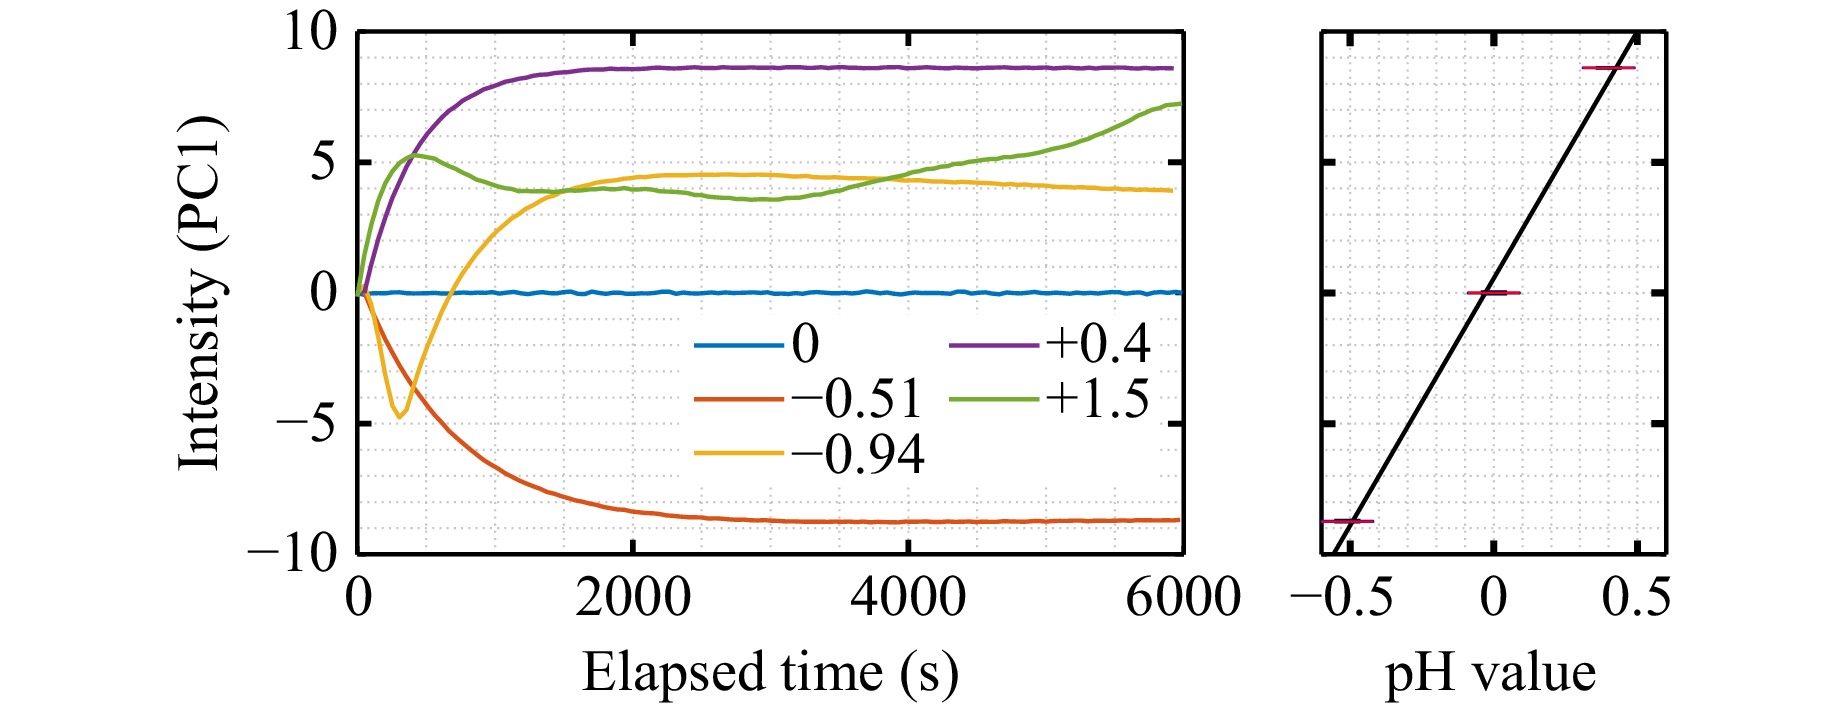
Fig. 11 Spectral response of the multiplexed sensor of optically coupled dual 4D microresonators in the form of generalized mode intensity for high-magnitude pH-value variations.
These results clearly show that different sign of the pH value alterations (−0.51 and +0.4) results in the opposite direction of dynamics for the generalized mode intensity similar to the generalized spectral shift. When reducing the pH value by 0.94 or increasing it by 1.5, a complex response appears. This is most evident for pH value reduction by 0.51, where the generalized mode intensity moves toward negative values with an increase in the slope, but shortly after the changes begin (at ≈ 300 s), the dynamics has a turning point. Such behavior indicates that at high alterations of pH values, the mode structure undergoes a series of significant spectral changes, each of which nonlinearly impacts the entire spectrum. Whereas the variations in pH value in the range of ±0.5 are described by a linear function, different pH values separated by ~1 cannot be unambiguously distinguished by the generalized intensity of the modes at saturation. For this reason, the high-precision measurement of the pH value with dual 4D microresonators over a wide range should involve two steps: tracking the generalized spectral shift for preliminary pH level estimation, followed by its refinement via analysis of the generalized mode intensity. The moderate speed of the response of the 4D microresonators to high pH alterations is caused by diffusion that occurs over the entire microresonator volume. Thus, the 4D microresonator as a pH sensor is highly efficient for the detection of small and slow environmental alterations and exhibits limited performance in tracking the rapid and significant pH value changes. However, given the clear correlation between the spectral shift dynamics and pH value, the method of dynamical responses analysis based on deep learning algorithms, as we previously proposed in28, can be applied. Hereby, the decision time can be reduced multiple times compared with the time required to observe the stationary state, which we will reflect in future studies.
Further complication of the coupled structure design for the multiplexed sensor construction may allow for the introduction of the preferential nature of mode changes or intensity variations in the backscattered signal. In particular, the realization of the dual microresonator structure with 4D cavities of different dimensions and variable optical linkage with an external coupler will eliminate constraints on the narrow excitation bandwidth of the laser source, which, in turn, will further improve the affordability of the detection capabilities.
-
In this paper, we propose a method for the high-precision tracking of small pH alterations in biochemical solutions. This is enabled using a multiplexed sensor with single or dual 4D optical microresonators produced via two-photon polymerization. The sensor features tight integration of hundreds of similar structures for simultaneous tracking, whereas individual sensing units are characterized by an advanced post-fabrication material response. It exhibits the transformation of the spectral features triggered by the pH-induced cavity shape responses alongside the boosted spectral shift due to structural changes in the individual 4D microresonators. The sensing performance of the proposed pH sensor is studied on tracking opposite pH value alterations of biochemical buffer solution (pH ~7.4). We show that the triggered structural changes in WGMs in optically coupled 4D microresonators enable the detection limit at the level of 0.003 pH units. This sensing performance allows the allocation of multiplexed sensor with dual 4D microresonators among the most sensitive pH detection schemes currently available. Furthermore, owing to its remarkable integration capabilities with other types or functional groups of microresonators on the same substrate in an affordable manner within the multiplexing imaging platform, the proposed approach becomes a notable solution for multiparameter biochemical sensing.
-
Chemicals For the fabrication of the coupled dual microresonators, we chose the sol-gel SZ2080 photoresin, incorporating the photoinitiator 4,4'-Bis-(diethylamino)-benzophenone and another monomer, 2-(dimethylamino) ethyl methacrylate (DMAEMA)52. In this composition, the secondary monomer functions as a radical quencher during the polymerization. This modification increases the spatial resolution of the polymerization process and realizes diffusion-assisted two-photon polymerization, which is a chemical analogue of stimulated emission depletion microscopy (STED) inspired multiphoton lithography. As a result, the polymer matrix of the fabricated structures is endowed with the increased surface-to-volume ratio. These characteristics can be finely tuned by adjusting the illumination conditions and thus allowing the gap between the polymerized areas ≈ 100 nm or below.
To prepare the phosphate buffer saline solution, we utilized deionized water to obtain concentrations of 0.01 M phosphate buffer, 0.0027 M potassium chloride, and 0.137 M sodium chloride, maintaining the pH of 7.4 at the temperature of 25 °C. Different pH values for the test solutions were achieved by adding small portions of either hydrochloric acid (HCl) to decrease the pH or sodium hydroxide (NaOH) to increase the pH. All chemicals for preparing the solutions were obtained from Sigma-Aldrich.
Fabrication process The substrates for allocating the multiplexed sensing array of dual optically coupled microresonators were cover glasses of 150 μm thickness. The substrates were covered by ≈ 400 nm layer of low (water-matched) refractive index adhesive in advance to optimize the overlap between the evanescent fields of the coupling prism and microresonator and thus to enhance the coupling-limited Q-factor46. Layer uniformity was ensured by spin-coating at 3000 rpm for 30 s. After adding the photosensitive material to pre-processed substrate, it was heated at 80 °C until the solvent evaporated. Finally, the solidified droplet of the photosensitive material on the substrate was positioned within the two-photon polymerization (2PP) setup.
Fabrication of the dual microresonator sensors with 2PP is conducted using a custom-built optical setup. It incorporates a mode-locked Ti:Sa laser system (Tsunami, Spectra Physics) with emission wavelength of 780 nm, repetition rate of 82 MHz, and pulse duration of 90 fs. The setup is supplemented by acousto-optical modulator serving as a shutter, a galvo scanner that allows redirection of the laser beam within the plane parallel to the substrate, and linear stages which allow for the precise positioning of the sample relative to the galvo scanner. All together this enables three-dimensional versatility in the photopolymerization process. The high resolution for fabricating polymer structures with the increased field of view is facilitated by focusing the laser light via 40× objective with NA of 0.95. The sample with the photoresin is illuminated layer-wise according to the predefined path for the laser spot calculated from the computer-aided design (CAD) model of the structure to be fabricated.
The illumination parameters were finely tuned to expedite the polymerization process so that hundreds of dual microresonator structures could be fabricated in an acceptable time slot while maintaining the smoothness and regularity of the cavity rims. The laser power was fixed at 32 mW, the slicing and hatching distances were set at 200 and 100 nm, respectively, and the laser spot translation speed was selected as 100 mm/s for the rims and 200 mm/s for the supporting components. With the aforementioned illumination configuration, the production time for a dual microresonator structure does not exceed 3 min. To eliminate the non-polymerized remains, the samples underwent wet-chemically treatment for 20 min in a 4-methylpentan-2-one developer, followed by a 10-minute immersion in 2-propanol. By necessity, circulation of the developing solutions was performed to improve the removal of the residues in the gap between the cavities. Finally, the substrates with microresonators were left to dry for several hours to allow the solvent to dissipate. The samples were then cleaned using UV-ozone procedure for 5 min in order to improve the wettability of the microresonator surfaces and ensure the penetration of the sensed liquids between the coupled cavities.
Measuring instrument Signal collection from an array with both single and dual microresonators was realized using the multiplexed microresonator imaging scheme developed earlier27, 32, 46, where the resonances in the cavities are excited in the optical prism-based scheme. Here, unlike the typical photodiode-based monitoring of the excitation channel, the signal radiated by each individual microresonator is captured in the far field using a camera. By choosing the cavities with the axis of rotational symmetry oriented parallel to the optical prism, signals from many microresonators can be simultaneously collected. In order to ensure the same excitation conditions for all the cavities, the microresonator array is illuminated with a collimated beam. The area for effective microresonator interrogation was restricted to the diameter of ≈ 8 mm, which is defined by the achromatic optical collimation package (60FC-T-4-M40-24, Schaefter+Kirchhoff). In order to address the elongation of the collimated beam projection in the propagation direction at the prism excitation surface, an anamorphic prism pair is introduced to reshape the laser beam profile from circular to elliptical. The light source was a diode laser (Velocity, New Focus) with a tunable emission wavelength ranging from 680 to 690 nm and a linewidth of 200 kHz. The laser beam profile is governed by propagation through a single-mode fiber (630HP, Thorlabs). The polarization of the beam is tuned using a polarization controller (FPC030, Thorlabs) to excite the TE modes in the microcavities, and the wavelength was monitored by a wavelength meter (WS7-30, HighFinesse). The use of a monochrome low-noise camera (pco.edge 4.2, PCO) allocated in the far field as a signal detector enables spatial separation of signals from different structures, as well as separation between the signals of the first and second resonators and the backscattered signal within each dual-resonator structure. The temperature fluctuations of the liquids being sensed were controlled with an embedded sensor (PT 100) located within the sensing head. Schematic of the measuring instrument, including a diagram of the optical path, can be found in the46. For reference pH measurements, a calibrated pH meter (Greisinger GMH 5530) was used to ensure a measurement accuracy of 0.01.
The substrate with an array of dual microresonators was allocated on an optical prism via the immersion oil to ensure stable coupling conditions. The assembly of the sensing head involves the combination of the prism holder, optical prism, sensor sample, and flow chamber components, which are carefully positioned on a precise three-axis stage. The fluid flow parameters were set using a pressure-based controller (LINEUP FLOW EZ, Fluigent) in conjunction with a flow rate sensor (FLOW UNIT, Fluigent). The instrument allows the sequential pumping of fluids from different containers selected by a valve (M-SWITCH, Fluigent) through the array of dual microcavities. The fluid pumping rate was maintained at 100 μl/min which reduces the possible impact of the viscosity of the liquids on the pH response of the 4D microresonator sensor.
-
We thank the group of Dr. Maria Farsari (IESL-FORTH) and, particularly, Dr. Gordon Zyla for providing the photoresin. Andreas Ostendorf and Anton Saetchnikov are grateful to the German Federal Ministry for Research and Education (BMBF) for partially funding this work under the VIP+-Programme in the project IntellOSS, 03VP08220. Furthermore, the authors thank Parisa Baghery for her help with the fabrication and SEM characterization of the samples.






 DownLoad: