


-
Achieving precise high-speed measurements of dynamic displacement and velocity are core challenges in fields such as modern physics, engineering technology, and materials science1–5 that play an irreplaceable role in detecting work trajectories in high-speed motion6–9, micro and nanoscale experiments10,11, and complex dynamic systems12,13. With rapid advancements in laser technology and the emergence of ultrafast pulse lasers, powerful tools have been developed to enable dynamic measurements with exceptionally high temporal and spatial resolution14–17. In particular, ultrafast laser pulses can capture minute variations in the displacement of objects with extremely high temporal precision on nanosecond or even picosecond timescales18–22, which enables real-time dynamic trajectory monitoring of high-speed moving components2,17,19. For example, the work trajectories of micro and nanofabrication platforms such as high-precision computer numerical control (CNC) lathes23–25 and high-precision 3D printers26–28 present a significant challenge in scientific exploration as well as a critical demand in the industrial sector for real-time and precise detection.
In recent years, researchers have introduced a series of techniques utilizing advanced lasers for precise dynamic displacement and velocity measurements3,12,29-35, including photon Doppler velocimetry2,29–31, dual-comb methods32–34, and comb-based dispersive interferometry (DPI)35. Doppler velocimetry, also known as photon Doppler velocimetry, involves emitting a narrow linewidth laser onto a target surface, where the moving target causes a frequency shift in the reflected light. This approach has attracted considerable attention as a topic of active research because it analyzes the beat frequency between the reflected and reference light to perform velocity measurements on the order of meters per second. However, to determine the direction of the velocity, a heterodyne setup is required to detect frequency differences2, which increases the complexity of the system. As velocity increases, frequency shifters are required to extend the measurement range, which increases costs. Additionally, in heterodyne systems, the absolute frequency stability of a single-frequency laser directly impacts the accuracy of the obtained measurements29–31. Moreover, achieving high spectral accuracy requires longer acquisition times to enhance frequency resolution, which introduces a trade-off between measurement precision and update rate. In the past few decades, the emergence of optical frequency combs has provided an unparalleled standard for ultraprecise time-frequency measurements36. In particular, frequency combs inherently generate highly coherent pulse sequences that offer a revolutionary light source for dynamic displacement and velocity measurements37–39. However, in dual-comb-based measurement systems, the measurable speed depends on the difference in the rate of repetition. Fiber-based dual combs typically offer kilohertz-level differences, which limits their high-speed measurement capability. Although dual-soliton microcombs can achieve MHz-level differences in the repetition rate, their unambiguous measurement range is restricted to millimeter-scale40. Although they can leverage a large difference in repetition rate to enhance measurement speed, this often comes at the cost of reduced precision. In addition, in terms of dynamic displacement measurement range, avoiding the occurrence of dead zones is notably challenging41. The comb-based DPI method can also be applied to certain dynamic measurements. However, the data acquisition (DAQ) rate of the CCD imposes a limitation on the dynamic measurement frame rate of the system by confining it to below 100 kHz, which severely restricts its velocity measurement performance42,43.
In this study, we propose a high-precision method based on a chirped power oscillation wave (CPOW) formed by interference signals of a dispersion-controlled dual-swept laser (DCDSL) to precisely detect the motion of devices under dynamical operating conditions. By monitoring the intensity oscillation of the zero-frequency point (ZFP) with a high signal-to-noise ratio (SNR) on the CPOW, we can measure the dynamic displacement with sub-micrometer-scale accuracy. The velocity is obtained by calculating the differential of displacement. We then successfully revealed rapid variations in the velocity of an electrically controlled precision translation stage on a millisecond time scale. The experimental results confirmed that the proposed system achieved a relative velocity measurement error of less than 0.1%. The velocity depends only on the time-domain intensity signal at the ZFP in the interference signal, which does not require the use of a Fourier transform to analyze the frequency difference between the signal and reference light in conventional Doppler velocimetry. Thus, this method surpasses the frequency resolution limitations in the frequency domain within a short time scale on the order of nanoseconds and overcomes the trade-off between the update frame rate and the accuracy of Doppler velocimetry. This approach may provide a new platform for broad applications such as dynamic positioning, trajectory tracking, and rapid analysis of surface deformation.
-
Fig. 1a illustrates the conceptual design for the motion tracking and velocimetry of high-speed components using CPOW. The proposed approach uses ultrafast pulse lasers, which were broadened by a segment of dispersion-compensating fiber (DCF) after undergoing dispersion, collimated, and emitted via a collimator into a measurement system based on a Michelson interferometer. One beam serves as the reference signal, whereas the other acts as a detection signal. After the precise dispersion control of both beams, sweep-frequency curves with slightly different slopes are generated. The intersection of these two sweep curves corresponds to the ZFP of the interference signal, which is also the chirp center. At the receiving end, we utilize a high-speed photodetector (PD) to capture the interference signals over a certain time interval. In our study, the dispersion of the two interference arms in the system was controlled by utilizing two segments of DCF to generate an asymmetric interference signal. The reference and detection signals are expressed as follows.
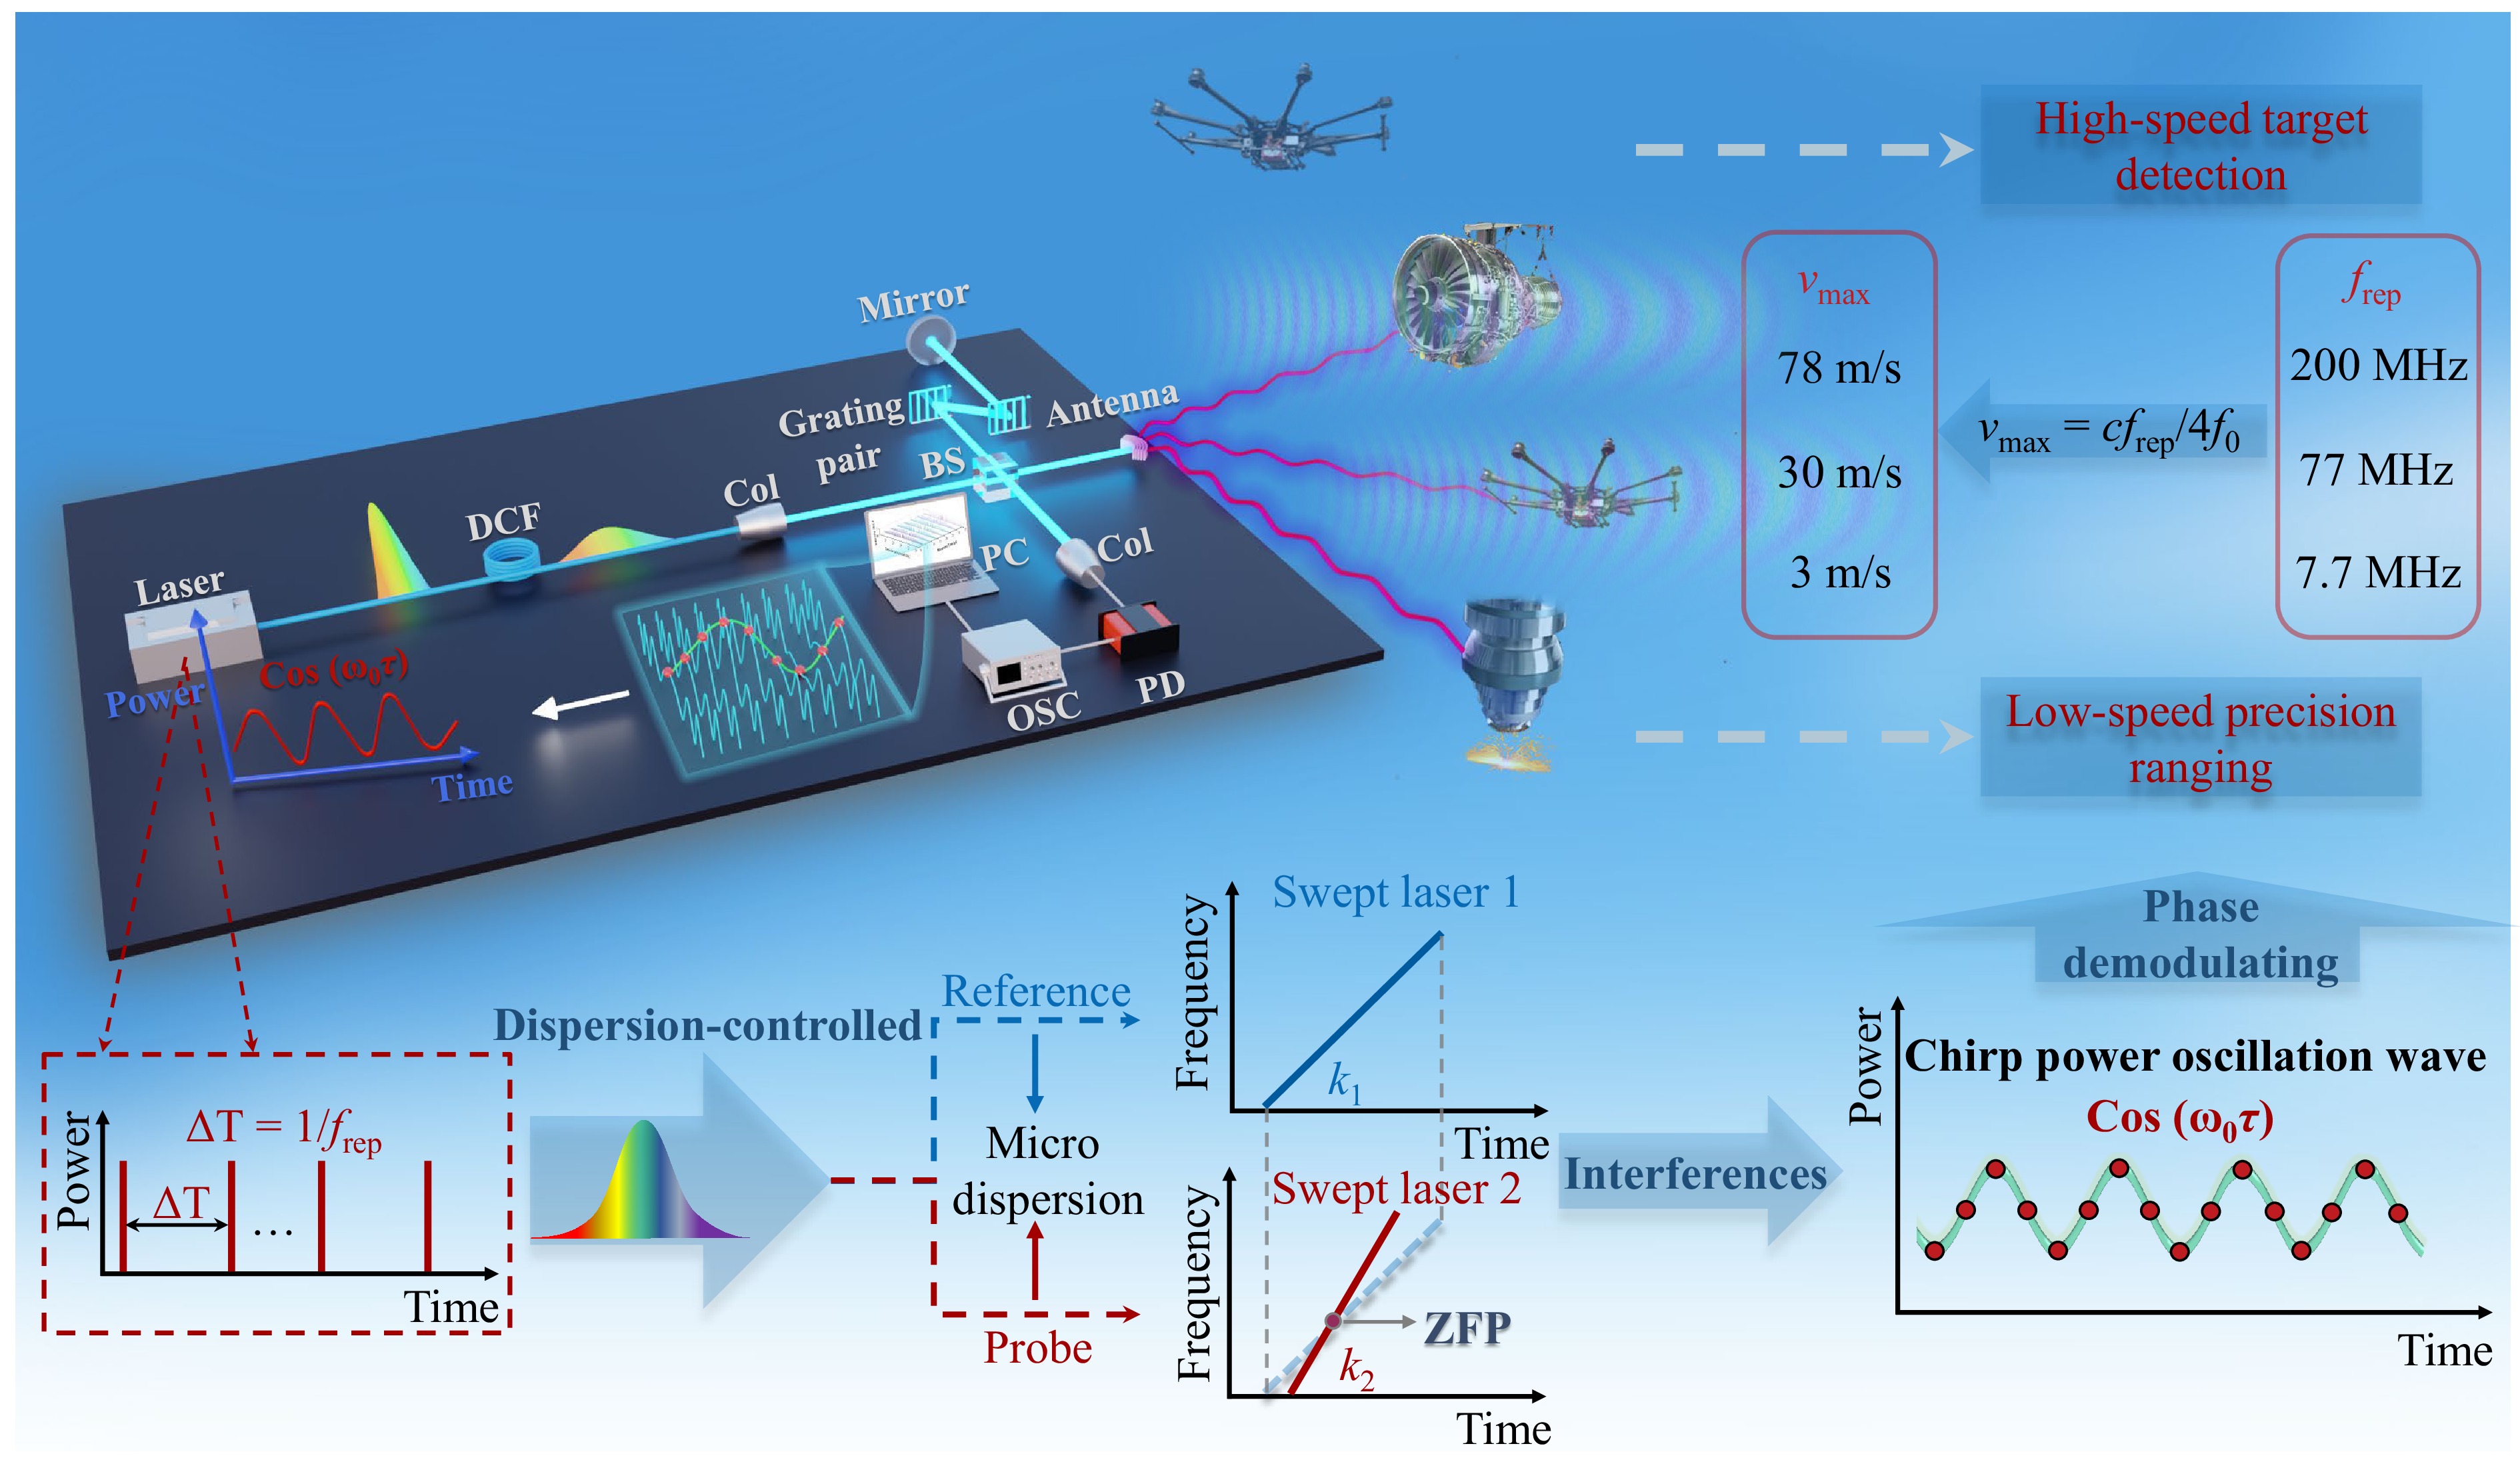
Fig. 1 Conceptual design and operation of the CPOW method-based precise motion tracking and velocimetry. The Michelson interferometer-based measurement system detects the motion displacement trajectory of high-speed operating devices by precisely identifying the variation patterns of the CPOW in the interference signals. The abbreviations in the image are provided as follows. dispersion-compensating fiber (DCF), collimator (Col), beam splitter (BS), photodetector (PD), oscilloscope (OSC), and personal computer (PC).
$$ {E}_{1}(t)={A}_{1}(t){e}^{-j\left[2{\text{π}} {f}_{0}t+2{\text{π}} \int\nolimits_{0}^{t}{g}_{1}(t)t{\rm d}t\right]} $$ (1) $$ {E}_{2}(t)={A}_{2}(t){e}^{-j\left[2{\text{π}} {f}_{0}t+2{\text{π}} \int\nolimits_{0}^{t}{g}_{2}(t)t{\rm d}t\right]} $$ (2) where A1(t) and A2(t) represent the optical fields incident on the reference and measurement arms, respectively, f0 is the central frequency, and g1(t) and g2(t) denote the dispersion parameters of the reference and measurement arms, respectively. After linearly tuning the dispersion in both arms, we considered only second-order dispersion. Thus, the signals from the two arms can be expressed as follows.
$$ {E}_{1}(t)={A}_{1}(t){e}^{-j(2{\text{π}} {{f}_{0}}t+{\text{π}} {{k}_{1}}{{t}^{{{}_{2}}}})} $$ (3) $$ {E}_{2}(t)={A}_{2}(t){e}^{-j(2{\text{π}} {{f}_{0}}t+{\text{π}} {{k}_{2}}{{t}^{{{}_{2}}}})} $$ (4) where k1 = 1 / (β12L1 + β22L2), k2 = 1 / (β12L1), where β12 and β22 represent the second-order dispersion coefficients of DCF1 and DCF2, and L1 and L2 denote the lengths of DCF1 and DCF2, respectively. When the measurement arm signal is used to measure the distance, the signal from the measurement arm becomes E2(t − τ) after introducing the corresponding delay. Upon interference with the reference arm signal, the actual detected interference signal is expressed as
$$\begin{split} I(t)=\;&{\left| {E}_{1}(t)+{E}_{2}(t-\tau )\right| }^{2}={\left| {E}_{1}(t)\right| }^{2}+{\left| {E}_{2}(t-\tau )\right| }^{2}\\&+2{A}_{1}(t){A}_{2}(t-\tau )\cos \varphi (t) \end{split}$$ (5) where the phase difference of the delayed measurement pulse relative to the reference pulse is described by the equation φ(t) = π (k2 – k1) t2 – 2πk2τt + (πk2τ2 − 2πf0τ), τ = 2nairL/c represents the time delay introduced by the spatial distance L to be measured, where c is the speed of light in vacuum and nair is the refractive index of air. We define the point with the minimum oscillation frequency (chirp center) in the interference signal, which coincides with the intersection of the two sweep-frequency curves as the ZFP, as shown in Fig. 1. At the ZFP, the condition ∂φ(t) / ∂t = 2π (k2 – k1) t − 2πk2τ = 0, t = (k2/ (k2 − k1)) τ holds. Therefore, the phase at the chirp center is φ (t = k0τ) = −πk0k1τ2 − 2πf0τ, where k0 = k2/ (k2 – k1). At this point (the ZFP), the interference signal can be expressed as
$$ \begin{split}I(t)=\;&{\left| {E}_{1}({k}_{0}\tau )+{E}_{2}({k}_{0}\tau -\tau )\right| }^{2}\\ =\;&{\left| {E}_{1}({k}_{0}\tau )\right| }^{2}+{\left| {E}_{2}({k}_{0}\tau -\tau )\right| }^{2}\\&+2{A}_{1}({k}_{0}\tau ){A}_{2}({k}_{0}\tau -\tau )\cos (-{\text{π}} {k}_{0}{k}_{1}{\tau }^{2}-2{\text{π}} {f}_{0}\tau ) \end{split} $$ (6) After filtering the acquired interference signal to remove the direct current (DC) component, the resulting alternating current (AC) signal is A0cos(− πk0k1τ2 − 2πf0τ), where A0 = 2A1A2k0τ(k0τ – τ). For the phase, the quadratic term in τ is neglected during the processing because τ2 << τ and their magnitudes differ by a factor of 1012. Thus, the intensity oscillation curve of the interference signal over a short time interval Δt can be expressed as I(Δt) = A0cos(2πf0τ), which we define as the CPOW, as shown in Fig. 1 and Fig. 2d. The time delay τ can be obtained accurately by demodulating the phase variation within the CPOW, which enables precise detection of the high-speed operational displacement trajectory of targets.
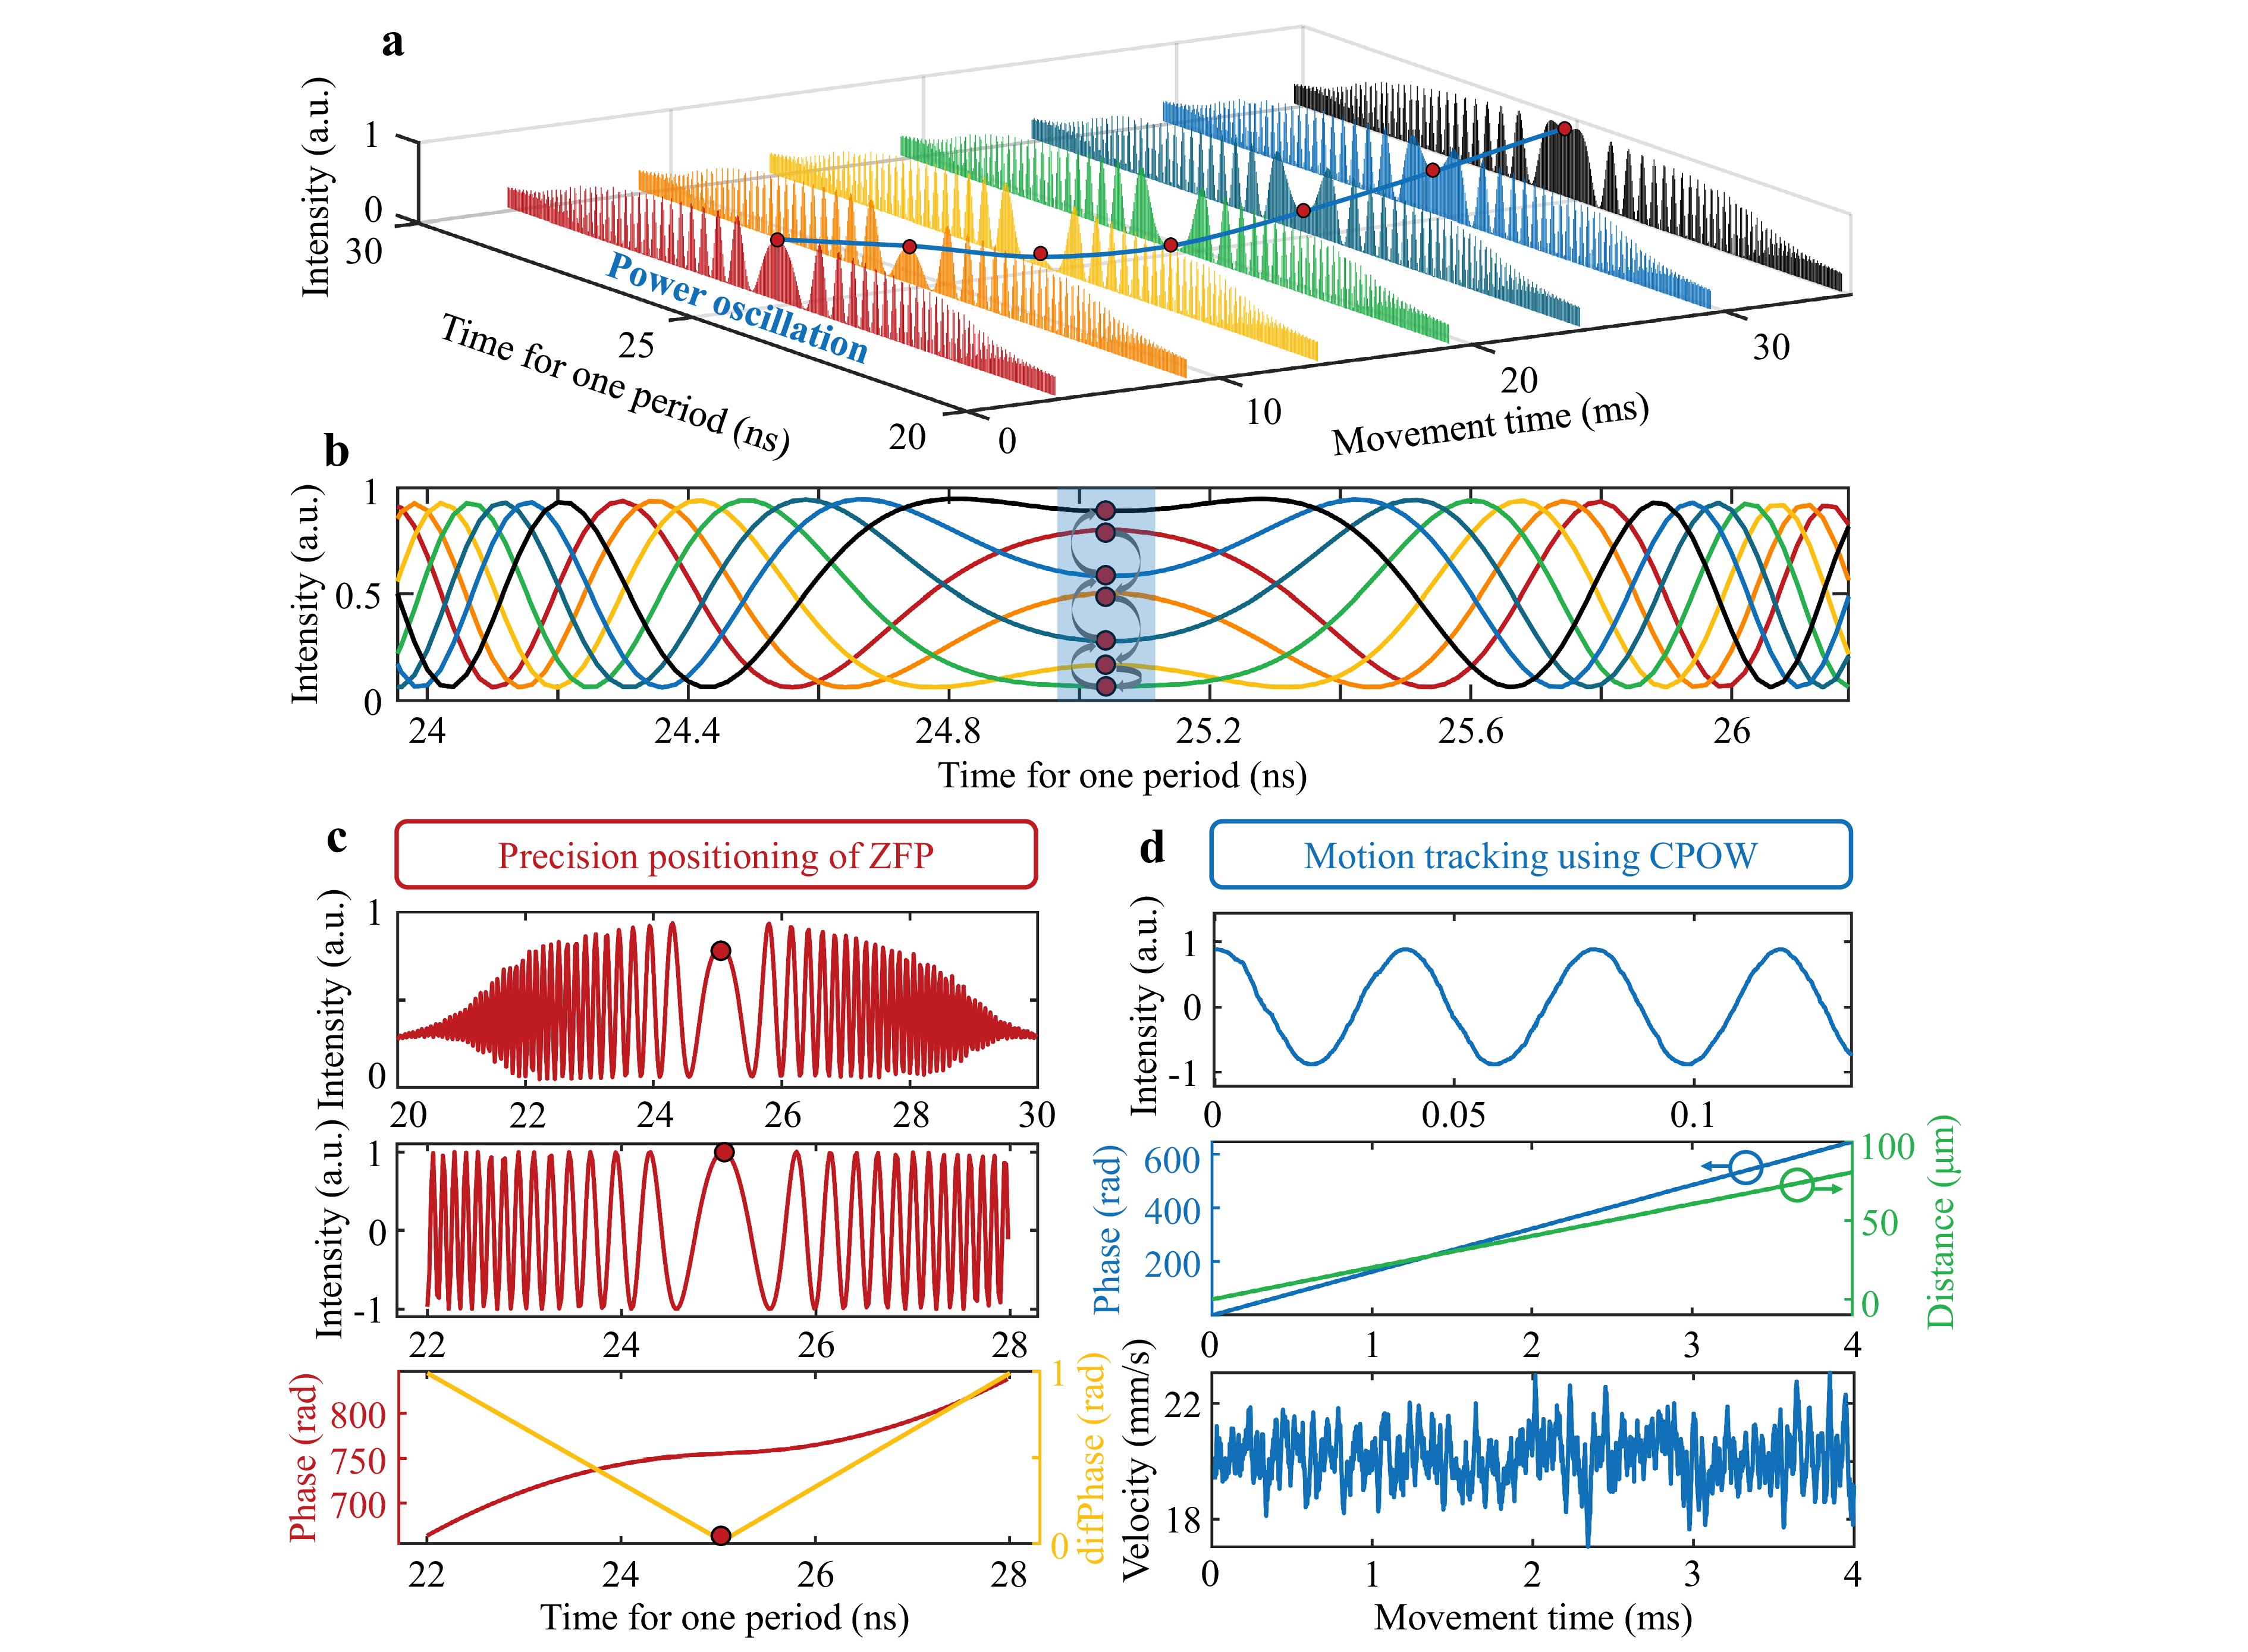
Fig. 2 Principle for CPOW-based precision detection. a Seven sets of interference signals were collected at a velocity of 20 mm/s during the simulation. b Power variation process of ZFP. c Positioning process of the ZFPs includes envelope removal from the interference signal, phase demodulation, and derivative calculation after phase curve fitting. d Process of determining the motion displacement trajectory of the targe in which the intensity variation curve is obtained from the positioning information of ZFP to determine the displacement curve and velocity changes of the target.
We performed a numerical simulation of the proposed CPOW method using the nonlinear Schrödinger equation (NLSE). The relevant parameters were set as follows. The ultrafast pulse laser had a pulse width of 25 ps, the length of the first dispersion-compensating fiber (DCF1) used for pulse stretching was 7,400 m, and the length of the second dispersion-compensating fiber (DCF2) introduced in the reference arm was 105 m. The sampling rate was set to 50 GS/s. The specific process of dispersion control is described in note S1. Additionally, the noise introduced by the fiber and detector was also included in the simulation to match real experimental conditions. First, we set the target velocity to a random value close to 20 mm/s, with fluctuations not exceeding 3 mm/s.
A portion of the acquired interference signals is shown in Fig. 2a, where it is evident that for a given time within the interference period, the intensity of the ZFP in these 7 sets of interference signals oscillates in a sinusoidal pattern with the rapid movement of the target, as shown in Fig. 2b. Fig. 2c illustrates the precise process of locating the ZFP in the interference signals. After removing the envelope from the acquired interference signal, an AC signal with constant amplitude oscillations is obtained. Then, the corresponding phase curve is derived through Hilbert transformation and unwrapping. Finally, the phase curve is fitted and differentiated, with the point of minimum derivative corresponding to the specific position of the ZFP. After determining the time coordinate corresponding to the ZFP within one interference period, we obtain the intensity variation curve at this coordinate and begin to detect the motion displacement trajectory of the target as shown in Fig. 2d. After acquiring the CPOW of the ZFP, we perform phase demodulation to obtain the time delay τ, which then allows us to calculate the corresponding dynamic displacement. The instantaneous velocity of the target is subsequently determined by calculating the derivative of the displacement curve.
Additionally, we conducted numerical simulations of dynamic targets with higher speeds (set to a constant velocity of 1 m/s). Fig. 3a shows a color map of the interference signals acquired within 4 ms at a random speed of approximately 20 mm/s, where the color intensity represents the signal strength at each point. It may be observed that the power at the chirp center oscillated periodically throughout the process, resembling a wave-like fluctuation. Fig. 3b shows a color map of the interference signals acquired within 80 μs at a constant speed of 1 m/s. In comparison, it is clear that the density of the oscillation ripples was related to the speed of the target.
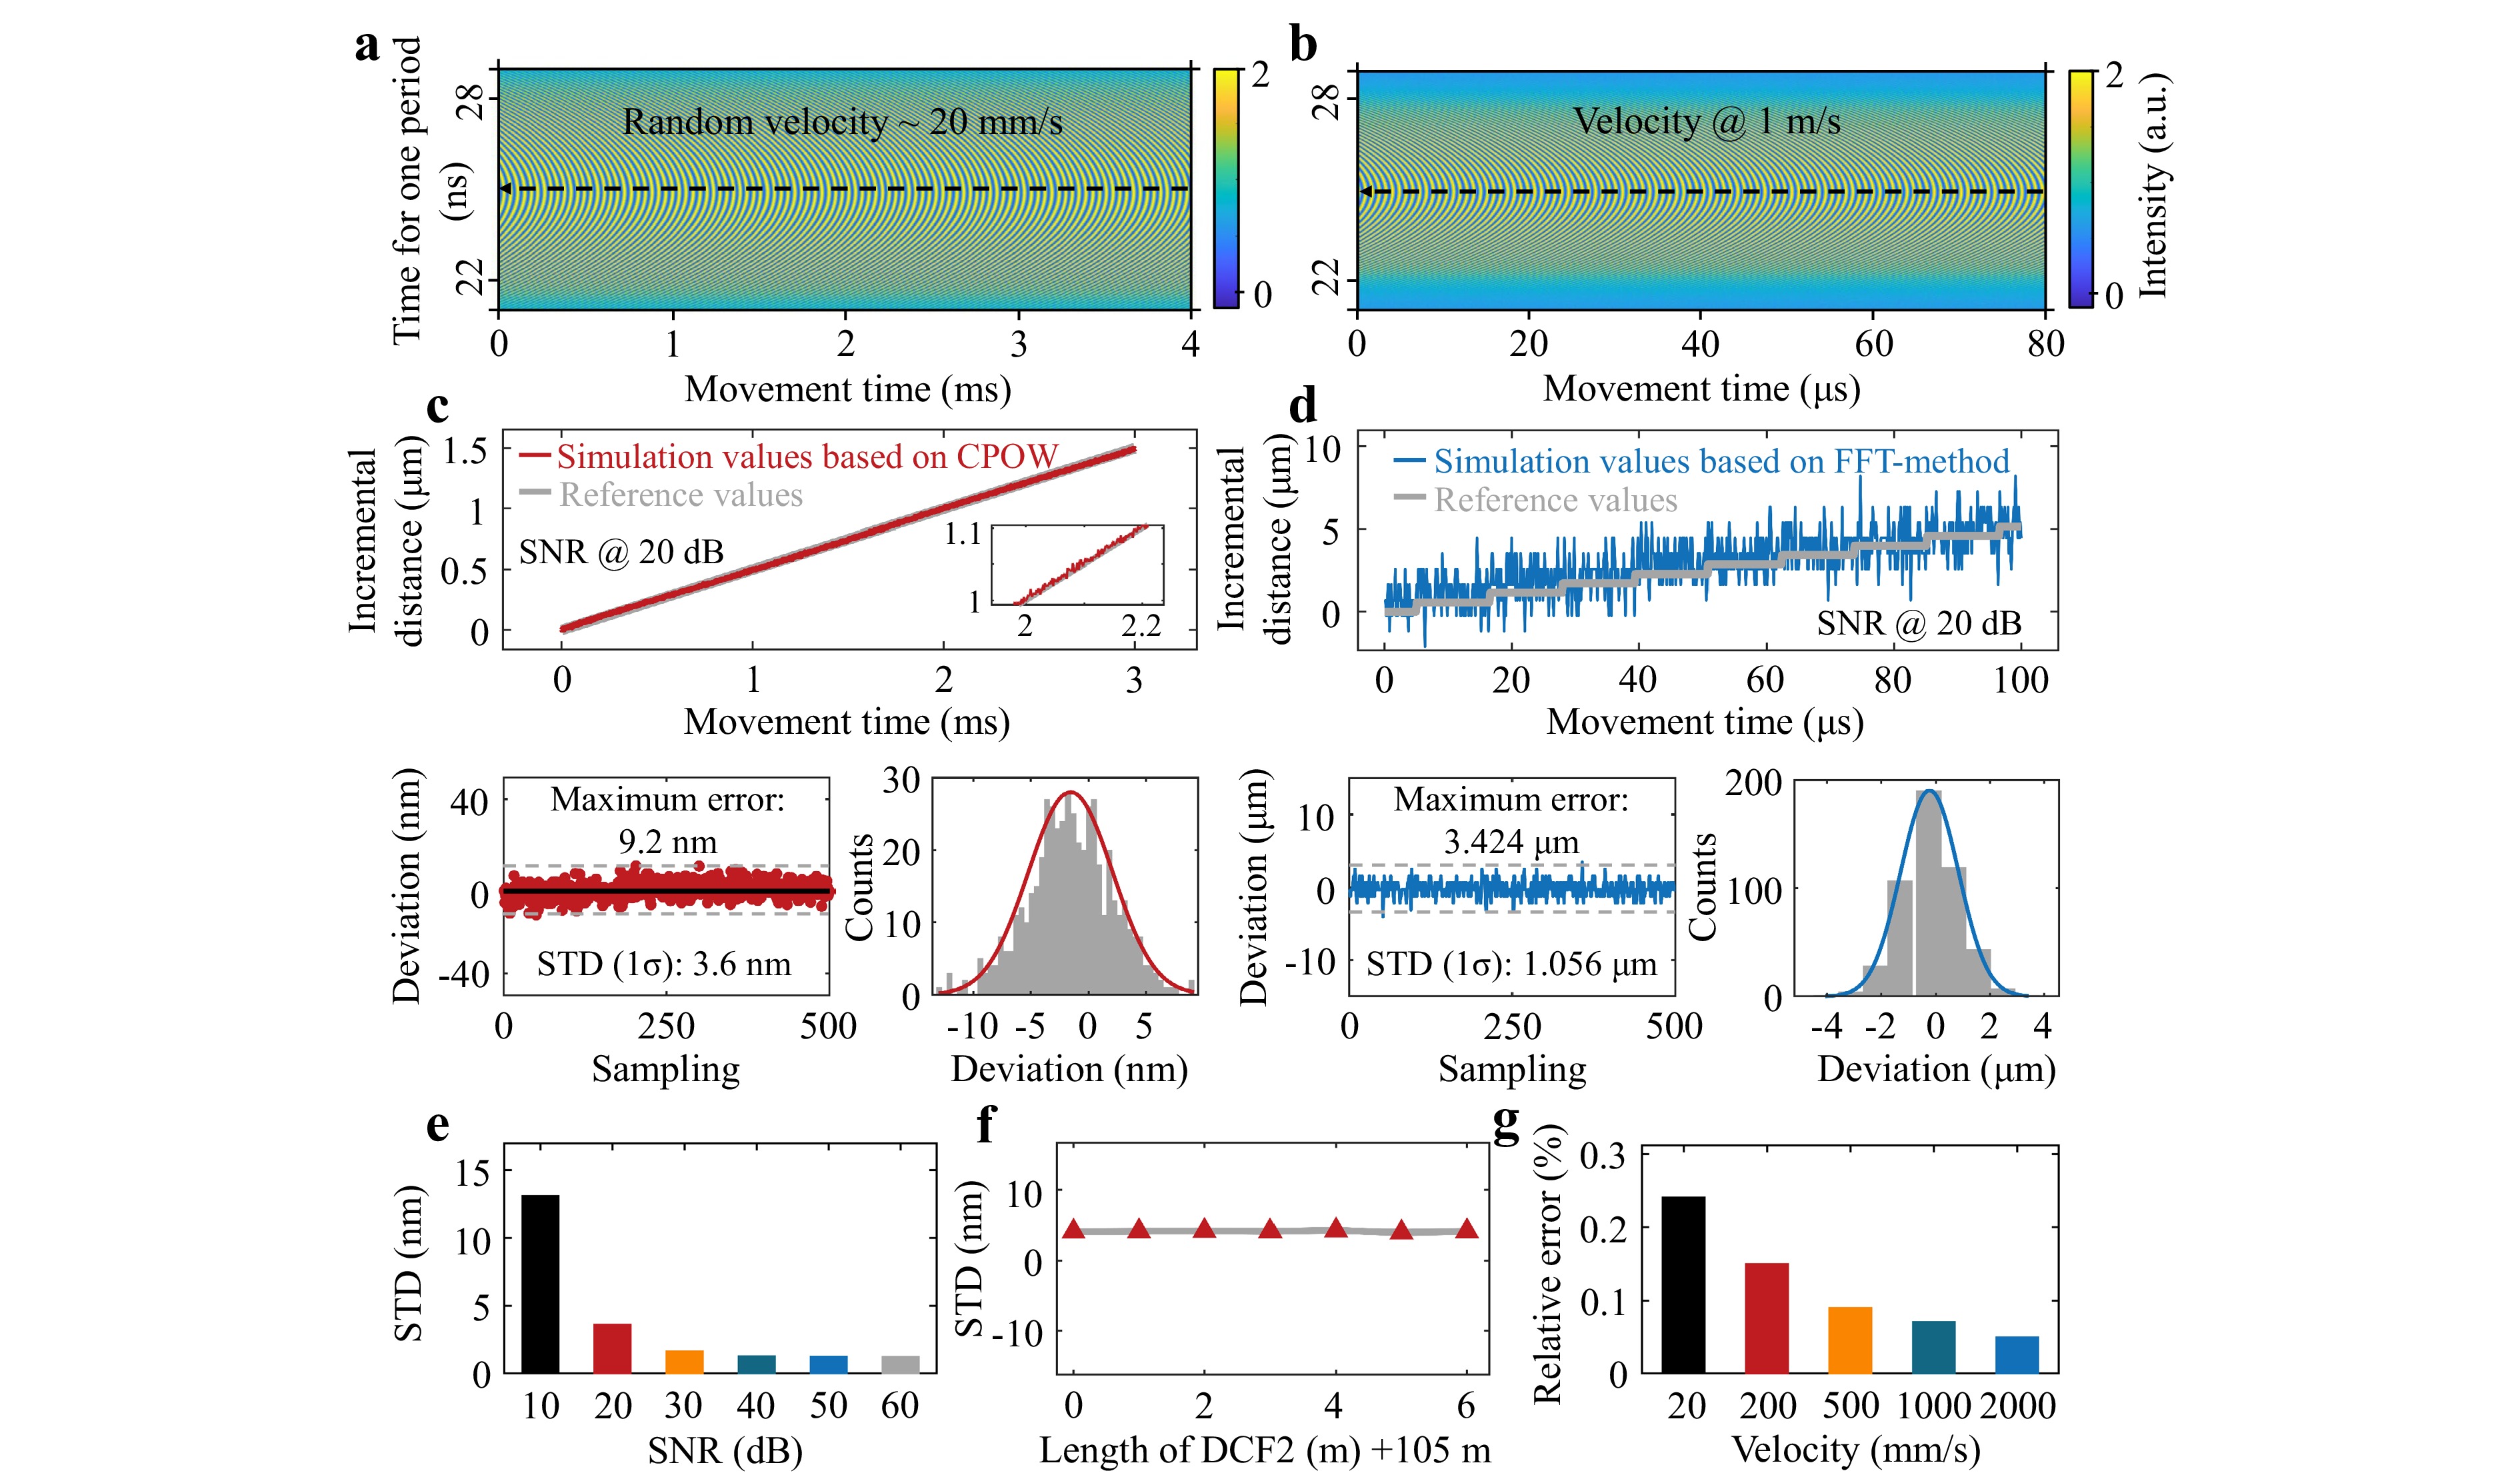
Fig. 3 Results and analysis of the numerical simulation. a Interference signals image obtained through simulation within 4 ms for a target moving at a random velocity of approximately 20 mm/s. b Interference signals image obtained through simulation within 80 μs for a target moving at a constant velocity of 1 m/s. c Detection sensitivity and error probability analysis for the proposed CPOW-based method. d Detection sensitivity and error probability analysis for the fast Fourier transform (FFT)-based method. e Standard deviations of simulation results under different SNRs. f Influence of the dispersion difference (the difference in the slope of the frequency sweep) between two chirped beams on detection accuracy. g Relative errors of simulation results under different velocities.
To theoretically verify the detection sensitivity and accuracy of the proposed method for measuring small displacements under high system and environmental noise, we conducted numerical simulations by setting the target velocity to 0.5 mm/s and the SNR to 20 dB. The interference signals were sampled for 3 ms, corresponding to a dynamic displacement of 1.5 μm. Fig. 3c illustrates the detection sensitivity and accuracy of the proposed method for small displacements. Among the 500 sampled datasets, the maximum error was 9.2 nm, and the standard deviation (STD) was 3.6 nm. We used STD (3.6 nm) as the theoretical detection sensitivity of the proposed method. For a performance comparison, we also evaluated a conventional FFT-based detection method under the same SNR conditions. In this case, the target velocity was set to 50 mm/s, and the sampling duration was 100 μs. The corresponding numerical simulation results are shown in Fig. 3d. It may be observed that the reference dynamic displacement exhibited step-like behavior, with each step corresponding to a displacement of approximately 500 nm. However, the FFT-based method failed to resolve such fine steps with a resolution capability limited to the micrometer scale. Among 500 sampled datasets, the maximum error reached 3.424 μm, and the STD was 1.056 μm. Under identical noise conditions, the proposed method demonstrated significantly higher sensitivity for dynamic displacement detection compared to the FFT-based approach. To further investigate the effect of weak-signal conditions on the sensitivity of the proposed method, we simulated the detection sensitivity at various SNR levels as shown in Fig. 3e. Evidently, weak signal conditions did affect the sensitivity of the proposed method. However, even at an SNR of 10 dB, the sensitivity remained within 15 nm. As the SNR increased to 30 dB, the sensitivity remained nearly unchanged, maintaining a level below 3 nm.
In addition, to examine the influence of the difference in the slope of the frequency sweep between the two chirped light beams on detection performance, we conducted numerical simulations by varying the dispersion of the reference signal as shown in Fig. 3f. As the dispersion of the reference signal increased, the difference in the slope of the frequency sweep between the two chirped beams also increased. However, detection accuracy and sensitivity remained nearly constant. Therefore, the resolution of the measurement did not improve significantly with a larger slope difference. Moreover, a larger slope difference not only implies a broader detection bandwidth but also leads to reduced signal intensity, thereby degrading detection accuracy. Conversely, an excessively small slope difference may result in signal overlap, which can make it impossible to observe the ZFP in the interference signal. A slope difference that ensures clear intensity oscillations of the ZFP in the interference signal was sufficient given that the proposed method does not rely on a long time window. Extremely large or small differences in slope did not substantially affect detection performance. Subsequently, we selected five motion speeds and conducted numerical simulations, the simulation results indicated that the error decreased and the stability improved as the target speed increased, as shown in Fig. 3g.
Finally, we derived the relationship between the theoretical limit of maximum measurable velocity of the proposed system and the repetition rate of the ultrafast pulsed laser. The theoretical limit of the proposed method can be expressed as vmax = cfrep / 4f0 (please refer to note S2 for a detailed comparison). At a repetition rate of 200 MHz, the theoretical limit of the maximum measurable velocity was 78 m/s. To investigate the impact of source, PD, and environmental noise on the maximum measurable velocity, we performed simulations of the maximum measurable velocity under different SNRs (20 dB, 40 dB, 60 dB, 80 dB) when the repetition rate of the light source was 7.7 MHz (please refer to note S3). It may be clearly observed that the phase noise in the interference signal decreased as the SNR increased, which led to an increase in the final maximum measurable velocity. When the SNR was 80 dB, the maximum measurable velocity was 99.7% of the theoretical velocimetry limit. Further details are provided in note S3.
-
Fig. 4a illustrates the generation process of the dual-swept lasers used for detection. By carefully adjusting the dispersion of the two interferometric arms, two dual-swept curves with a slight deviation in slope were generated.
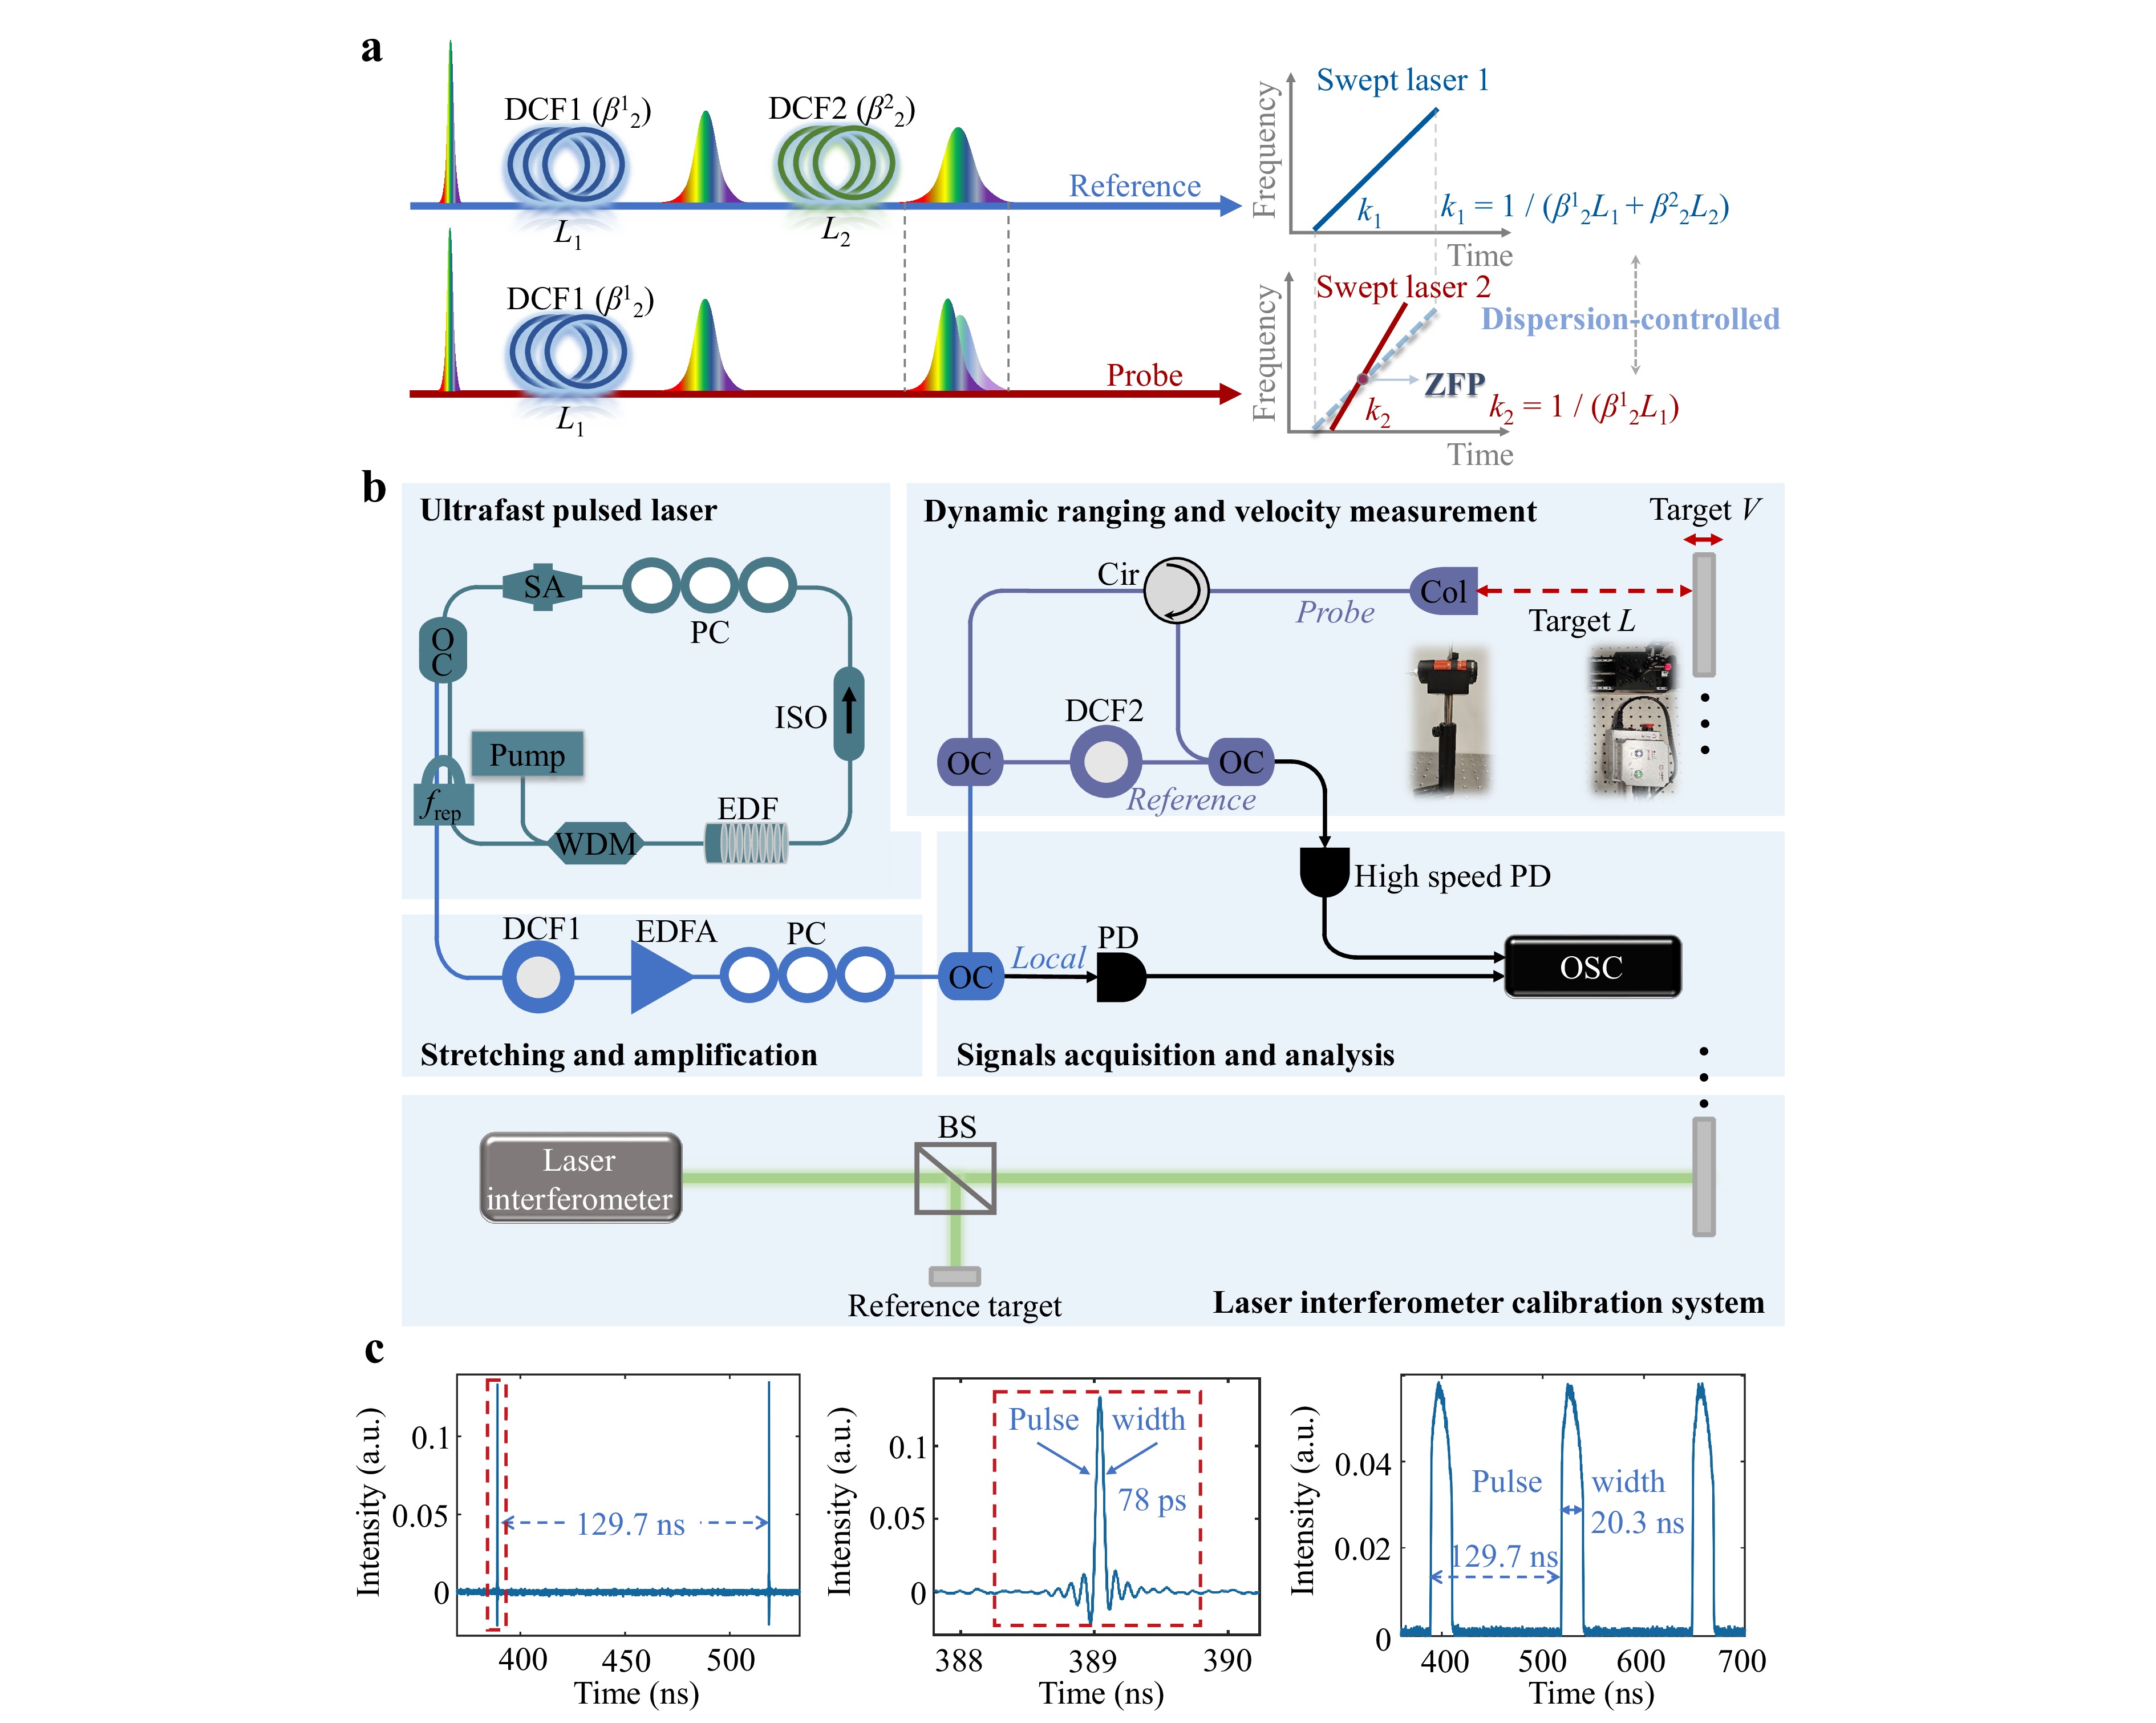
Fig. 4 Characterization of the actual experimental system and light source. a Generation process of dual-swept lasers. Regulating the dispersion amounts of the two DCFs to induce a slight slope difference between the frequency sweeping curves corresponding to the two interference arms. b Experimental setup. The abbreviations used in the image are provided as follows. Erbium-doped fiber (EDF), optical coupler (OC), wavelength division multiplexer (WDM), polarization-independent optical isolator (ISO), polarization controller (PC), saturable absorber (SA), EDF amplifier (EDFA), circulator (Cir). c Operation of the ultrafast pulse stretch.
The experimental setup is shown in Fig. 4b. After being stretched by DCF1, the chirped pulse used as the swept source was further amplified by an erbium-doped fiber amplifier (EDFA). The pulses were split by an optical coupler (OC) into two paths, one of which was directed to a PD as a time reference, whereas the other entered the detection system. The reference signal passed through DCF2 to generate a sweep-frequency curve with a slope slightly different from that of the measurement signal. At the receiving end, the interference signal was received by a high-speed PD and connected to an oscilloscope for display.
Fig. 4c shows the characterization results of the system light source and pulse characteristics after dispersion stretching. The ultrashort pulse used in the experiment underwent dispersion stretching through DCF1, with its pulse width expanding from 78 ps to 20.3 ns. For the laboratory measurements, the target under test was an electrically controlled precision-translation stage. Fig. 5a illustrates the experimental configuration used for precision calibration and measurement, which was conducted at the Chongqing Academy of Metrology and Quality Inspection. The proposed system, together with the auxiliary equipment, was firmly installed on a 30-meter granite long-guide-rail integrated inspection platform. The precision translation stage was precisely calibrated by the Chongqing Academy of Metrology and Quality Inspection in accordance with the international length measurement guide (JJF 1305-2011) and the Chinese length measurement guide (ISO 16331-1: 2012). Therefore, the experiment was conducted with traceable precision.
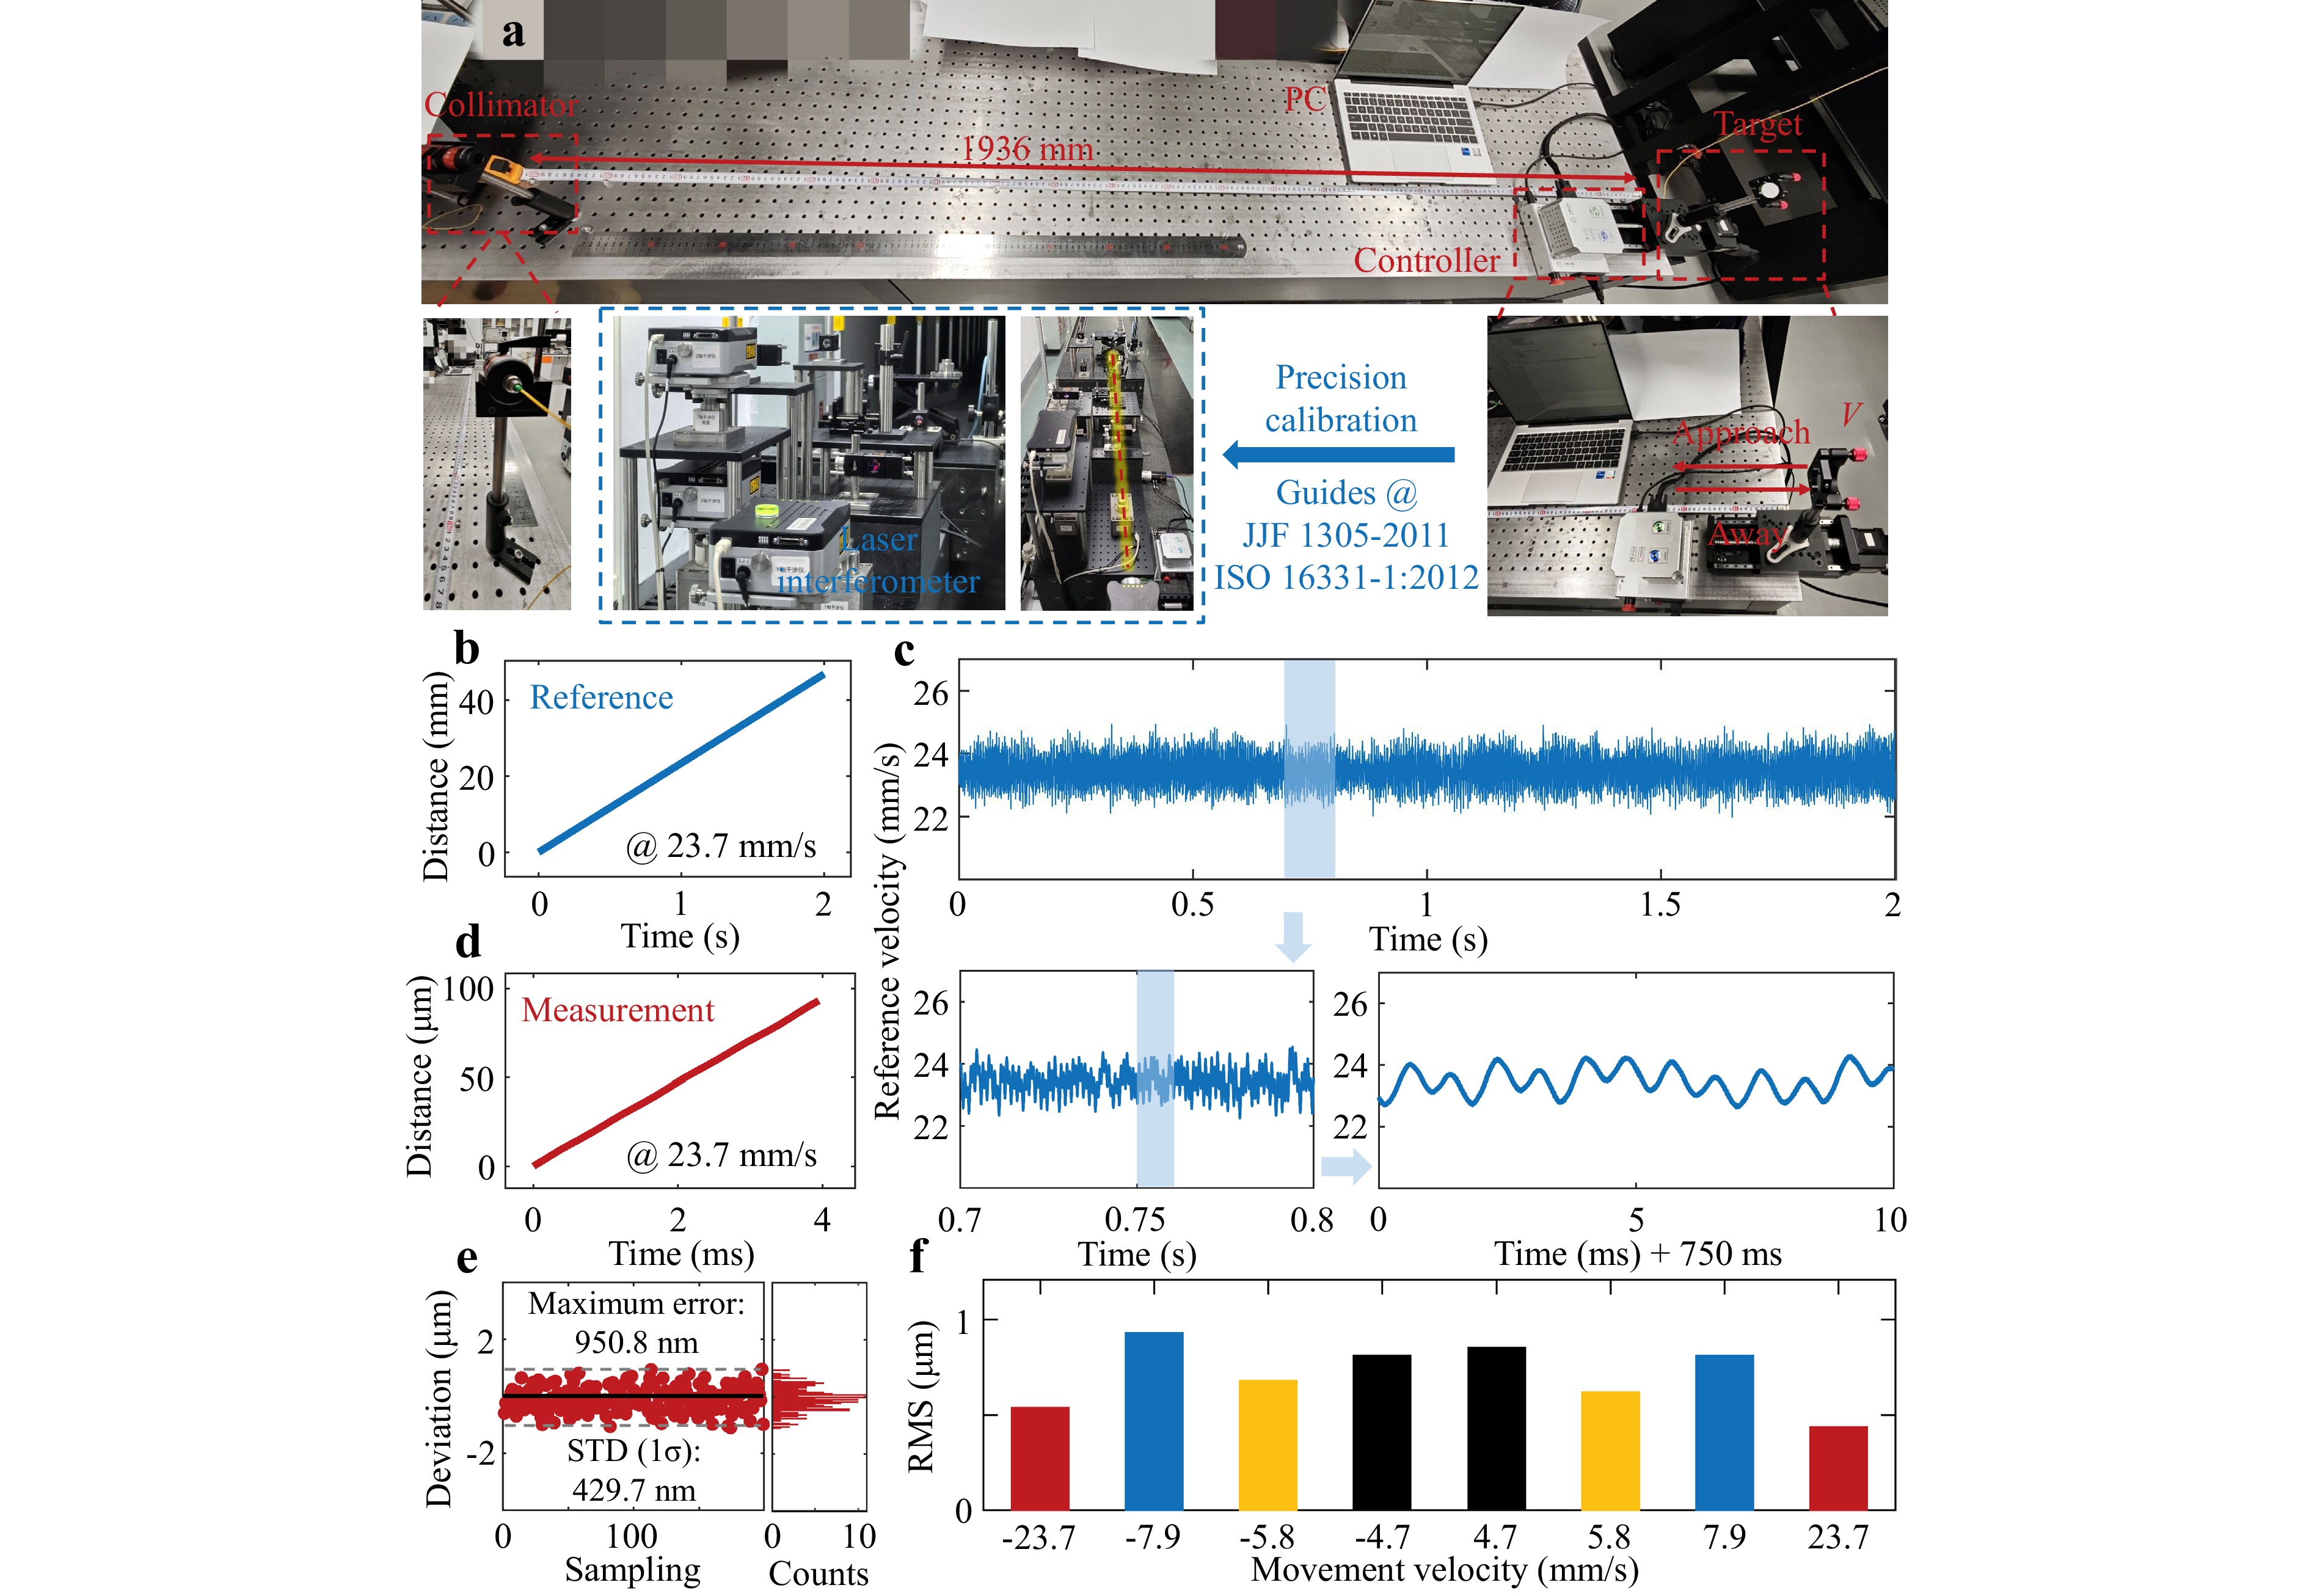
Fig. 5 Real-time displacement trajectory detection results of the target and their statistical analysis. a Experimental demonstration in the laboratory and precise calibration process of the precision translation stage. b Reference real-time displacement curve after metrological calibration at a target velocity of 23.7 mm/s. c Reference velocity variation curve after metrological calibration at a target velocity of 23.7 mm/s. d Real-time displacement curves measured by the system at a target velocity of 23.7 mm/s. e Accuracy and error probability analysis of dynamic displacement. f Performance of dynamic ranging. When the velocity of the precision translation stage was in the forward direction, maximum RMS was 852.8 nm. When the velocity was in the reverse direction, maximum RMS was 930.8 nm.
In the actual experimental process, we positioned the target approximately ~ 1.9 m from the detection laser for motion-tracking purposes, as shown in Fig. 5a. To detect the precise translation stage, an oscilloscope was configured at a sampling rate of 50 GS/s. The metrological reference curves for the dynamic displacement and instantaneous velocity of the precision translation stage at a velocity of 23.7 mm/s are shown in Fig. 5b, c, respectively. It may be observed that the instantaneous velocity of the translation stage exhibited variations in both amplitude and frequency, which are attributed to motor-induced vibrations. The displacement curve obtained using the proposed system is presented in Fig. 5d. Using the metrologically calibrated values as a reference, the analyses of the deviation and error probability based on 200 sampling instances are illustrated in Fig. 5e. These results demonstrate that the proposed method achieved submicrometer-scale accuracy in practical dynamic displacement measurements, with a maximum deviation of 950.8 nm and an STD of 429.7 nm.
Eight different velocities were assigned to the target motion, specifically −23.7, −7.9, −5.8, −4.7, 4.7, 5.8, 7.9 and 23.7 mm/s. Subsequently, the dynamic displacement trajectory measurement performance of the proposed method based on the real-time displacement measurement results within 4 ms is shown in Fig. 5f. The experimental results reveal that for velocities between −23.7 mm/s and 23.7 mm/s, the root mean square (RMS) errors remain below 1 μm, which shows that the system maintained sub-micrometer-scale measurement precision. These results demonstrate that the proposed method exhibited an excellent dynamic displacement detection capability.
Moreover, we further investigated the instantaneous velocity during the startup process. Fig. 6a shows the interference signal color maps collected at eight different velocities, with the oscillation wave patterns corresponding to changes in instantaneous velocity. The direction of the CPOW also indicates the direction of motion. We solved for the instantaneous velocity of the precision translation stage within 4 ms and fitted the results as shown in Fig. 6b. This demonstrates the motor vibration frequency of the precision translation stage at a speed of 23.7 mm/s (approximately 1 kHz).
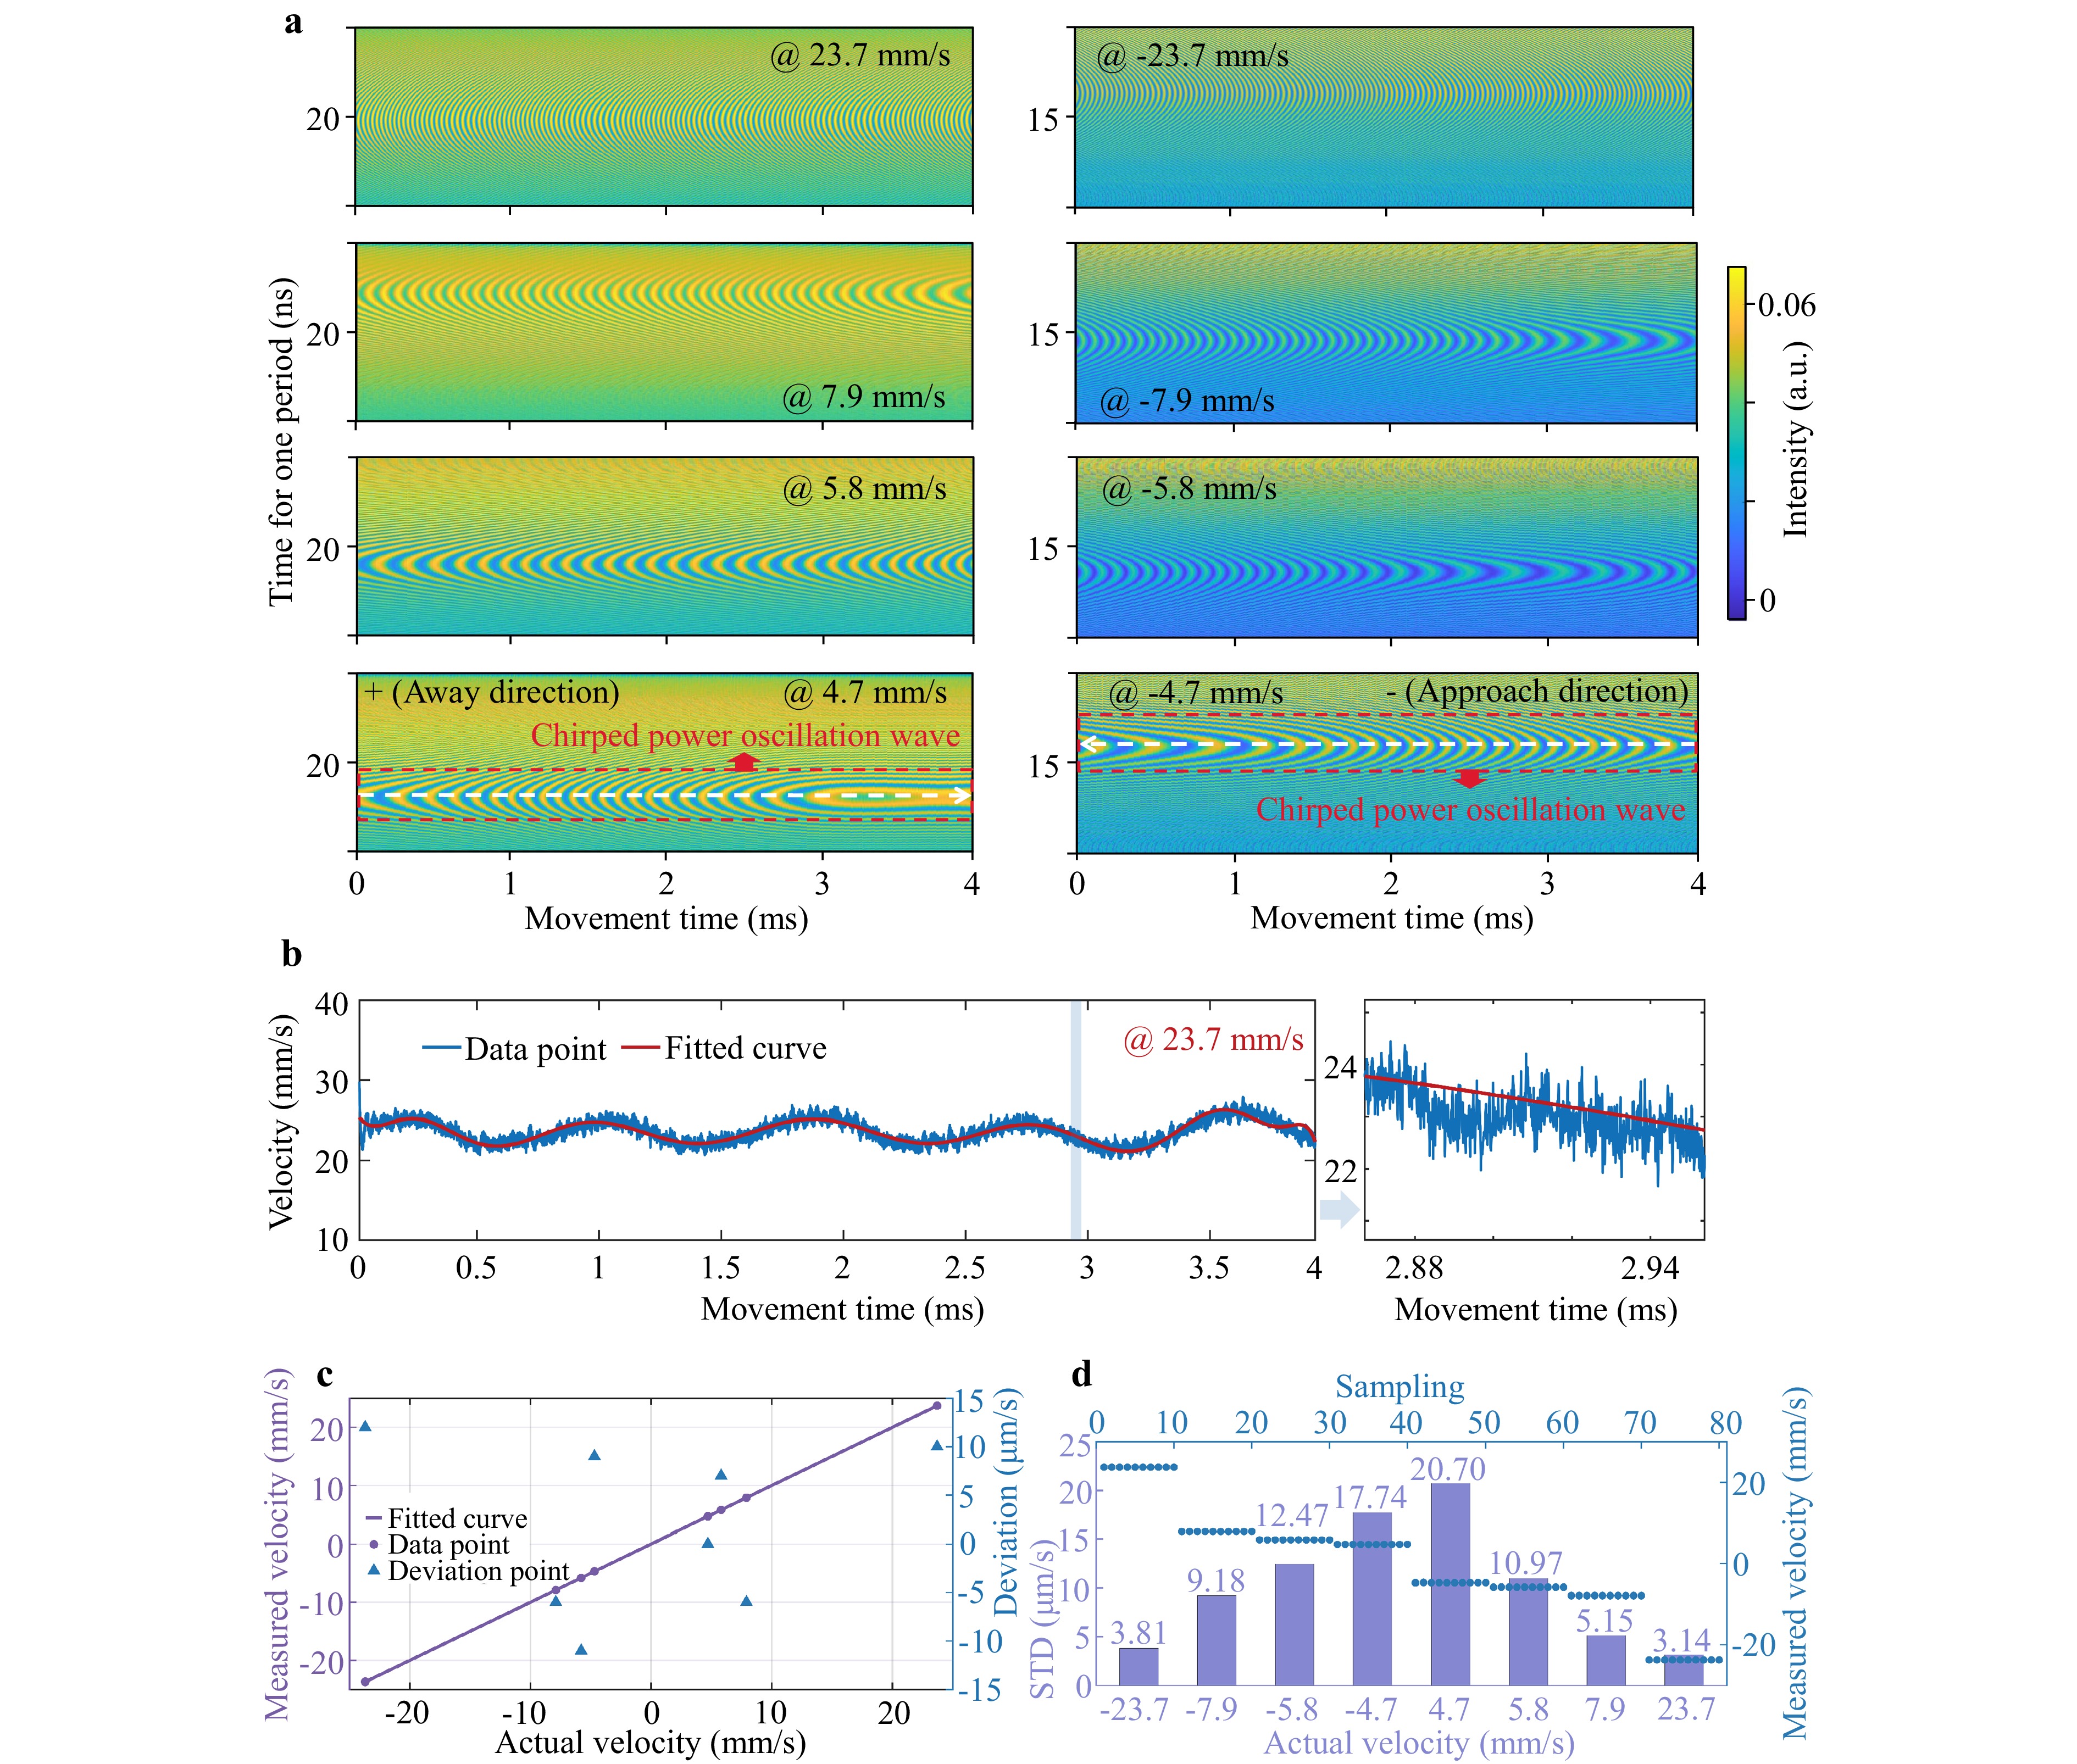
Fig. 6 Detection of instantaneous velocities of the precision translation stage. a CPOW images obtained under four different velocities in two distinct directions (away direction and approach direction). b Variation of instantaneous velocity of the precision translation stage under velocity of 23.7 mm/s. c Measurement results of the average velocities for eight experimental sets and their associated deviations. d Results of repeated experiments and the statistical analysis of their measurement deviations.
Using the metrologically calibrated velocity curve as a reference, the average velocity measurements within 4 ms and their deviations are shown in Fig. 6c. The deviations of all eight measured velocity results were within 15 μm/s. The relative error (less than 0.1%) confirms the excellent accuracy of the system in detecting the target velocity. In Fig. 6d, we present the statistics from repeated measurements. We selected eight average velocities to drive the precision translation stage and repeated the experiments ten times for each velocity. The experimental results show that the STDs for velocities from −23.7 mm/s to 23.7 mm/s reach 3.81, 9.18, 12.47, 17.74, 20.70, 10.97, 5.15 and 3.14 μm/s, respectively. This further demonstrates the superior measurement stability of the proposed method. As shown in Fig. 6d, it may be observed that the STD of the measurement results gradually decreased as the startup speed increased, which indicates that the system performed better in detecting higher-speed targets.
-
In addition to measurements in a laboratory, we also validated the effectiveness of our CPOW-based detection system in field applications. For example, this method provides a tool to detect the working displacement trajectory of moving targets such as uncrewed aerial vehicles (UAVs), which are critically important in both civilian and military applications. However, precise detection of such targets presents some significant challenges of note. For Fig. 7a, b, we demonstrate the experimental scenario. The detection system was installed on an optical platform in the laboratory with a collimator (Thorlabs, ZC618APC-C) used to transmit and receive ultrafast pulses, and a mirror with a reflectance of 95% was mounted on the UAV (DJI MAVIC MINI) to enhance light reflection. In the experimental setup, the UAV’s flight altitude was 7.5 m, and the flight speed was 2 m/s. Fig. 7d shows the view from the perspective of the UAV along with real-time parameter displays. Interference signals were captured at a sampling rate of 50 GS/s, as illustrated in Fig. 7c, where a distinct CPOW may be observed in the center. However, the CPOW is less distinct because the signal contrast was low due to a high level of noise in the outdoor experimental environment.
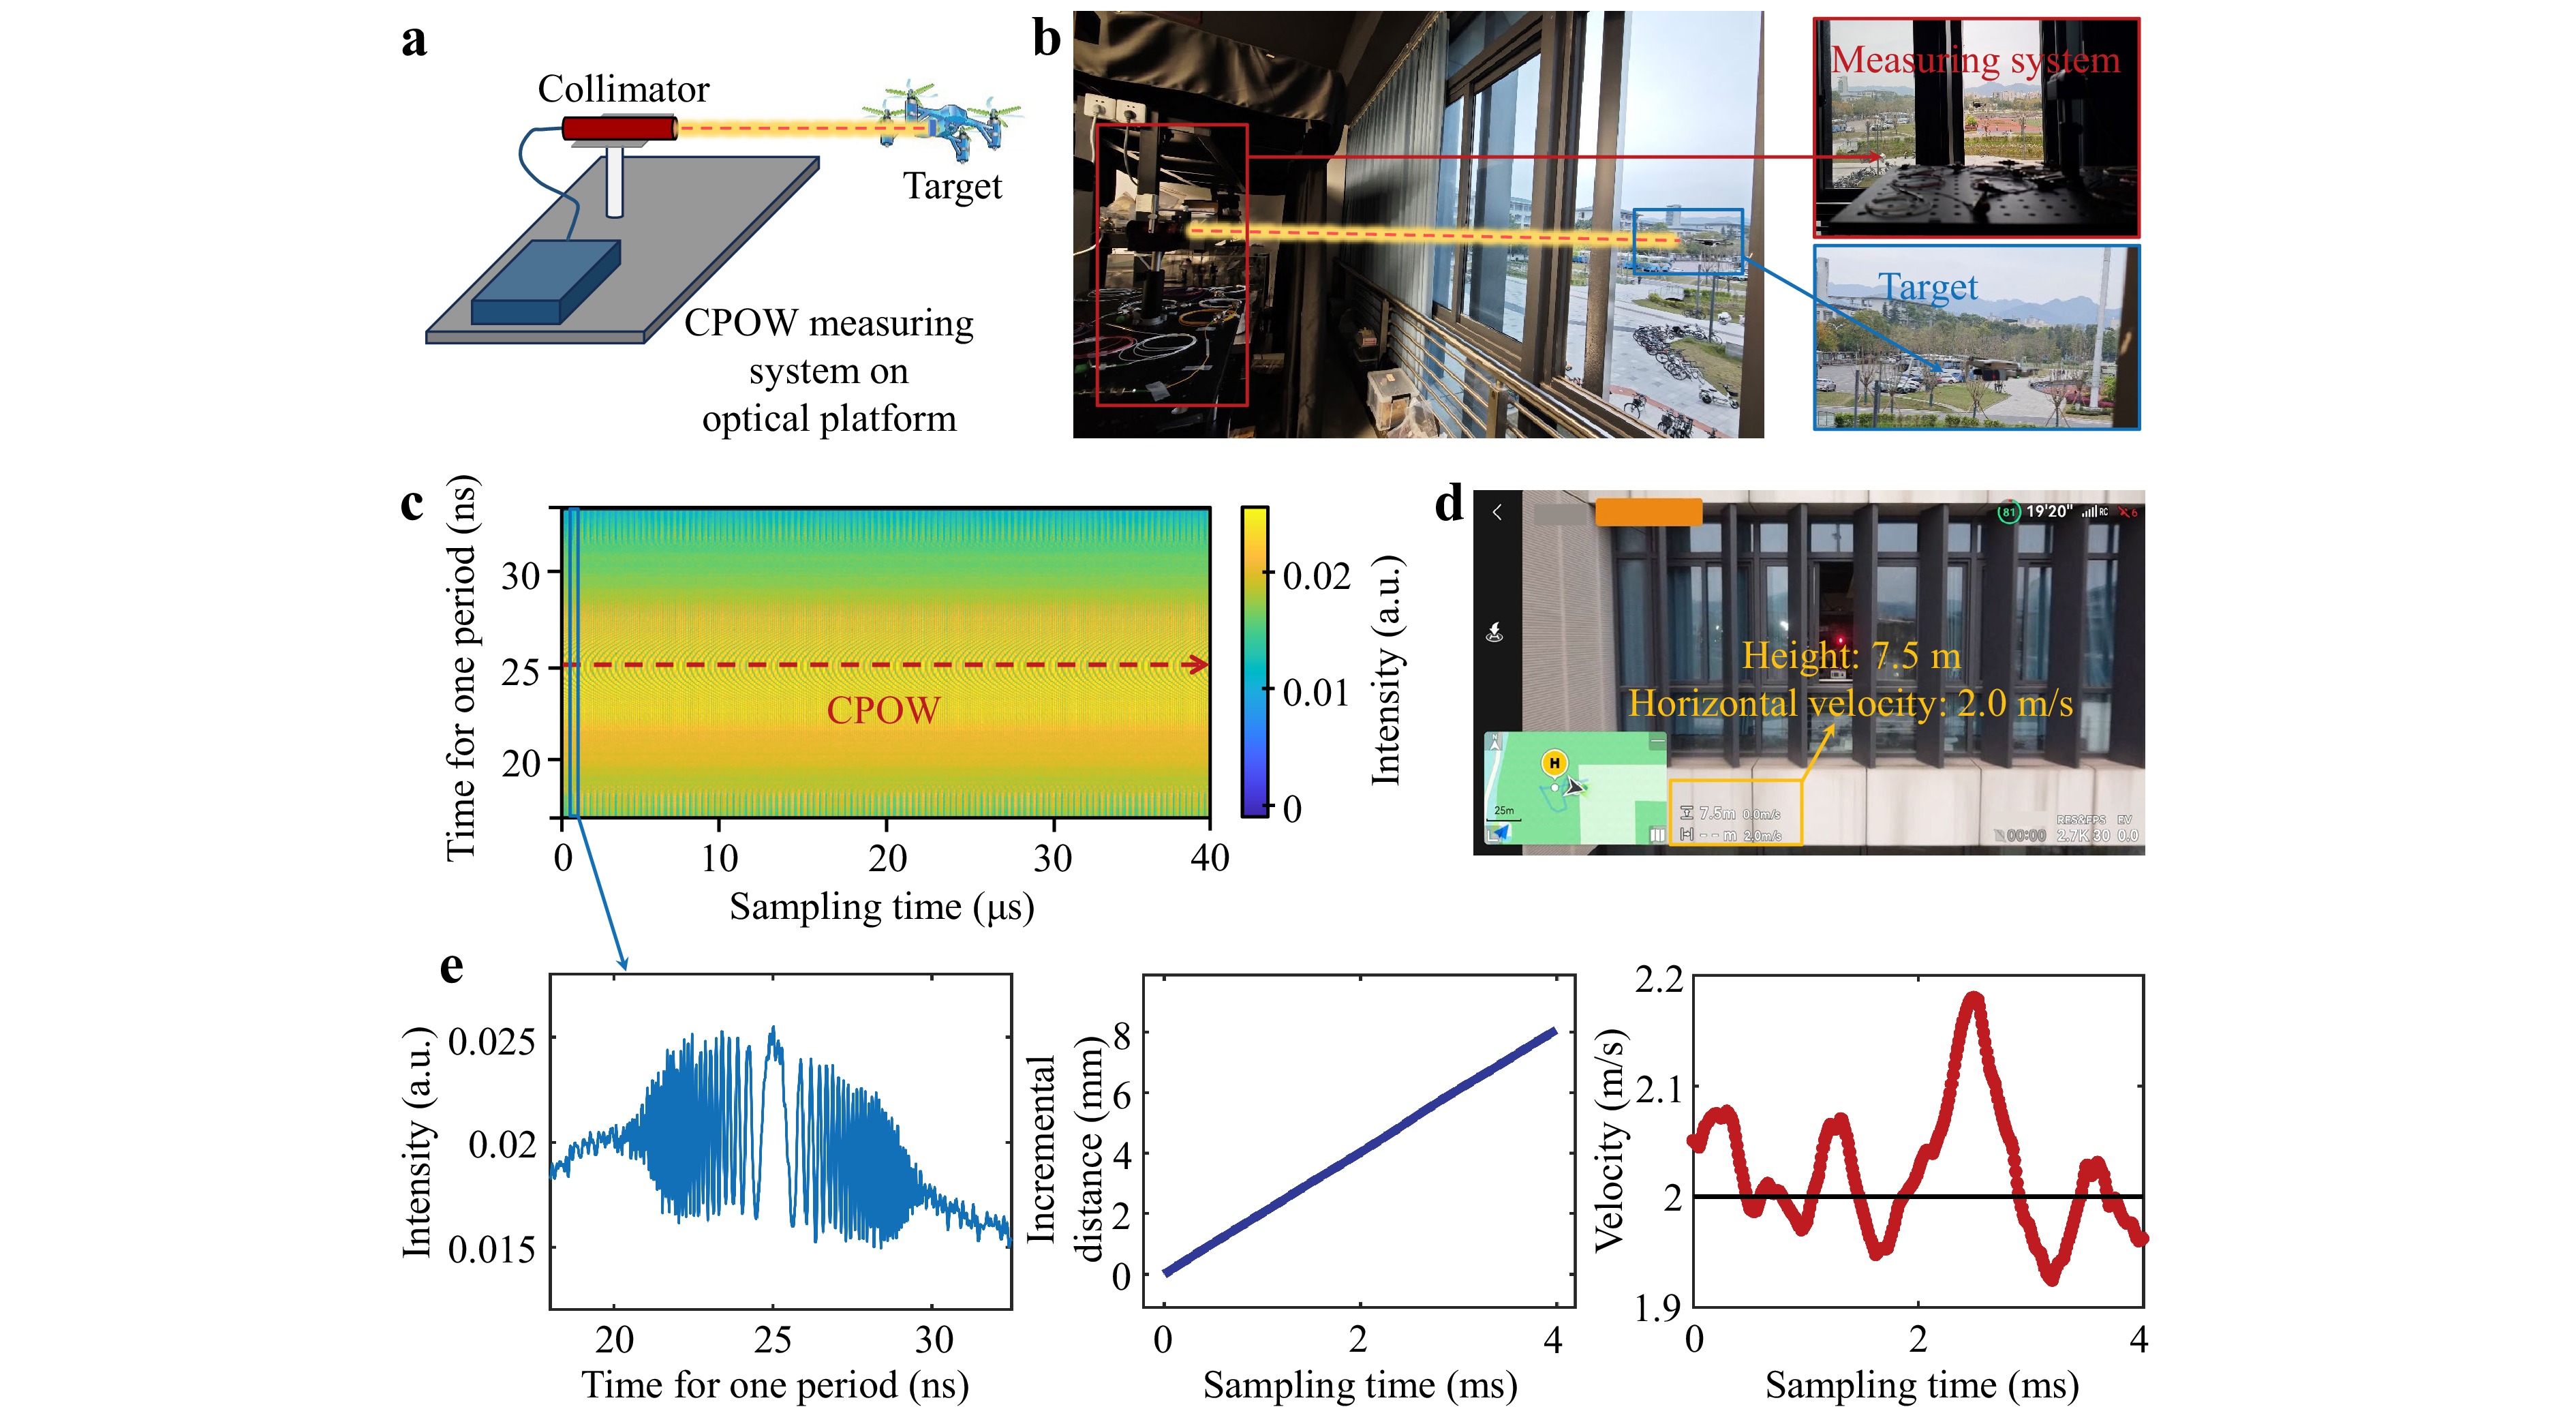
Fig. 7 Motion tracking of a UAV out of lab. a Concept and experimental schematics. b Pictures of the field test. The probe ultrafast pulses are transmitted and received by a collimator fixed on the optical platform. The target is a typical 4-axis UAV. c CPOW image. When the UAV is moving at a speed of 2 m/s, the interferometric signals image captured within 40 μs reveals a central CPOW. d Perspective of the UAV. The flight altitude is 7.5 m, and the horizontal flight speed is 2 m/s. e Results of the UAV’s horizontal flight motion tracking, including single-frame interferometric signal, flight displacement measurements, and velocity measurement results.
Fig. 7e presents the motion tracking results for the UAV’s horizontal flight, including displacement and velocity. In Fig. 7e, we plotted the continuously collected displacement data along with the corresponding velocity variation curve. The vibration caused by the UAV’s engine and propellers led to an unstable flight speed, which resulted in speed oscillating around approximately 2 m/s at a certain frequency.
-
In this study, although the maximum velocity tested in our measurable validation experiments was limited to 2 m/s, we conducted comprehensive numerical simulation as described in the supplementary materials to demonstrate the capability of the proposed method in detecting high-speed dynamic targets (see note S2). Additionally, we conducted simulations to investigate the effects of the Doppler frequency shifts on the maximum measurable velocity, measurement accuracy, and measurement stability of the proposed method. The results of the simulations demonstrated that the Doppler frequency shift had only a minimal effect on the maximum measurable velocity, with an influence not exceeding 1% of the original measurement range. In terms of the system structure and data processing efficiency, in future work, we plan to explore the integration of high-speed DAQ solutions with optimized front-end circuits to further improve the flexibility of the obtained measurements and the modularity of the system.
In conclusion, by introducing carefully controlled dual-frequency-swept lasers in an ultrafast laser-based dispersive interferometric system, we have demonstrated a physical paradigm that integrates the time-domain performance of pulsed lasers with the high-precision advantages of dispersive interferometric ranging. Unlike traditional methods that rely on Doppler frequency shifts induced by motion for velocity demodulation, the motion trajectory detection method based on CPOWs precisely examines the variations in the intensity of the interference signal at the chirp center to provide a solution for high-speed, high-dynamic-range measurements without compromising accuracy or introducing directional ambiguity. This creates a powerful tool for high-speed dynamic trajectory detection, boasting high velocity measurement accuracy down to 0.1% and enabling measurements of speeds up to 280.8 km/h using ultrafast pulses with 200 MHz-level repetition rates. By utilizing this CPOW-based dynamic trajectory detection scheme, we demonstrated its promising potential in high-precision dynamic displacement measurements and velocity detection. By combining the strengths of the on-chip optical frequency combs and photonic integrated technologies, this CPOW-based approach could pave the way for the development of advanced ultrafast LIDAR systems with broader applications. Thus, our findings are of significant interest in fields such as ultraprecision manufacturing and health monitoring.
-
We used an ultrafast pulsed laser as the light source for the experimental system, as shown in Fig. 4b. The dissipative soliton (DS) laser system used in the experiment was configured as shown in the diagram and primarily consists of a 15 m EDF (Nufern, EDFC-980-HP), a 2.7 m single-mode fiber (SMF), an OC, a wavelength division multiplexer (WDM), a polarization-independent optical isolator (ISO), a polarization controller (PC), and a saturable absorber (SA) made from single-walled carbon nanotubes. Because of its low saturation power, this laser system can operate stably with a relatively low pump power of 35 mW. The DS laser generated pulses with a repetition rate of approximately 7.75 MHz. The length of DCF1 used for pulse broadening was 7,400 m, whereas the length of DCF2 in the reference arm was 105 m. Frequency-swept curves with slightly different slopes were generated after meticulous dispersion control of the two signal beams.
-
During the experiment, the interference signal was detected with a high-speed single-pixel PD with a 20 GHz electrical bandwidth (GD45220R) and digitized with a high-speed real-time 20 GHz oscilloscope (DSA72004B, Tektronix) at a sampling rate of 50 GS/s.
-
This research was supported in part by the National Natural Science Foundation of China (NSFC) under Grants (625B2029, 62405036, U23A20378), in part by the Graduate research and innovation foundation of Chongqing under Grant No. CYB240013, in part by the Exchange Project for Key Lab of Optical Fiber Sensing and Communications (Ministry of Education of China) under Grant ZYGX2025K010.
Precise motion tracking and velocimetry using chirped power oscillation wave
- Light: Advanced Manufacturing , Article number: 33 (2026)
- Received: 26 June 2025
- Revised: 29 January 2026
- Accepted: 05 February 2026 Published online: 29 April 2026
doi: https://doi.org/10.37188/lam.2026.033
Abstract: Precise high-speed motion tracking and velocimetry are critical underlying technologies in various areas such as advanced manufacturing, robotics, and modern physics. Mature detection methods such as Doppler velocimetry and dual-comb interferometry measurements cannot achieve directional unambiguity detection without a trade-off between speed and precision due to the inherent limitations of their system mechanisms. In this study, we propose an innovative high-speed and precise motion detection method based on chirped power oscillation waves (CPOW) generated by dispersion-controlled dual-swept lasers. Our results demonstrate that the displacement and velocity of the target can be directly identified via the power oscillation of the zero-frequency point on the interference signals after carefully controlling for the difference in group delay dispersion between the two beams of the swept lasers. We achieved sub-micrometer-scale displacement measurement accuracy with an update frame rate on the order of MHz and a relative velocity measurement error of better than 0.1%. Furthermore, the proposed method can also be used to reveal the unpredictable operational states of motion-control equipment influenced by mechanical vibrations. This dynamic displacement measurement and velocimetry method based on CPOW opens the door to advanced, fast, and high-precision ranging systems.
Research Summary
Precise-tracking: Chirped power oscillation waves leading velocimetry
Precise high-speed motion tracking and velocimetry are critical underlying technologies in various areas such as advanced manufacturing, robotics, and modern physics. Wei Du from China’s Chongqing University and colleagues now report an innovative high-speed and precise motion detection method based on chirped power oscillation waves (CPOW) generated by dispersion-controlled dual-swept lasers. They achieved sub-micrometer-scale displacement measurement accuracy with an update frame rate on the order of MHz and a relative velocity measurement error of better than 0.1%. Furthermore, the proposed method can also be used to reveal the unpredictable operational states of motion-control equipment influenced by mechanical vibrations. This dynamic displacement and velocimetry method based on CPOW opens the door to advanced, fast, and high-precision ranging systems.
Rights and permissions
Open Access This article is licensed under a Creative Commons Attribution 4.0 International License, which permits use, sharing, adaptation, distribution and reproduction in any medium or format, as long as you give appropriate credit to the original author(s) and the source, provide a link to the Creative Commons license, and indicate if changes were made. The images or other third party material in this article are included in the article′s Creative Commons license, unless indicated otherwise in a credit line to the material. If material is not included in the article′s Creative Commons license and your intended use is not permitted by statutory regulation or exceeds the permitted use, you will need to obtain permission directly from the copyright holder. To view a copy of this license, visit http://creativecommons.org/licenses/by/4.0/.

 DownLoad: