


-
With the continuous advancement of biomedical research, single-modality optical microscopy has shown inherent limitations1,2, as it cannot simultaneously satisfy the increasing demands for high-resolution, high-throughput, and minimally invasive imaging, thereby restricting its broader applications in areas such as drug screening3 and organ atlas construction4. Multimodal microscopy leverages the complementary advantages of different imaging modalities and enables flexible switching according to specific imaging requirements5–7, thus facilitating intelligent tasks such as high-throughput screening8 and event-triggered acquisition9. Owing to these advantages, it has emerged as a key direction for next-generation optical microscopy.
Optical microscopy techniques can be divided into two main categories: labelled and label-free techniques. Among the labelled techniques, structured illumination microscopy (SIM) has become widely used because of its super-resolution capability and low phototoxicity10–17, which make it suitable for long-term and dynamic imaging, including specific subcellular imaging in live cells. However, SIM has several inherent challenges. First, because of its wide-field detection configuration, an out-of-focus background is easily introduced when imaging thick samples, resulting in reconstruction artifacts18. Second, the excitation of fluorescence signals requires relatively high-intensity illumination, which can adversely affect cell viability during prolonged imaging. Additionally, SIM typically requires nine raw images for reconstruction, and its effective illumination region is confined to the coherence area of the excitation beam, leading to limited imaging speed and field of view (FOV), and constraining its applicability for large-scale and high-throughput scenarios19.
In the field of label-free imaging, differential phase contrast (DPC) has attracted increasing interest in recent years owing to its high cost-effectiveness and excellent optical compatibility20–22. Unlike fluorescence imaging, which relies on specific labelling, DPC provides rich global structural information for an entire specimen without requiring labelling. It only requires replacing the light source of traditional bright-field (BF) microscopy with a programmable LED array to extract phase information via multi-angle illumination22,23. Furthermore, the illumination intensity required for DPC is relatively low, resulting in negligible phototoxicity and minimal disturbance of the biological state. Moreover, DPC employs global illumination, and its FOV is not constrained by optical modulation devices, enabling a larger imaging area under the same objective lens. Because of its simple optical configuration and strong system scalability, DPC is naturally complementary to SIM in terms of resolution and spatiotemporal throughput, making it ideal for constructing highly integrated and biofriendly multimodal imaging systems.
Based on these considerations, we propose an integrated multimodal fluorescence-phase microscopy (MFPM) system that seamlessly combines DPC and SIM into a unified wide-field detection architecture. This system provides a low-cost and excellent biocompatibility platform that supports high-throughput acquisition across fluorescence, polarisation, and phase dimensions. Through incorporating the dark channel prior-based background removal algorithm24,25 for SIM preprocessing and the frame-reduction strategy26 to reduce the number of raw SIM images, only ten raw frames are required to achieve five distinct reconstruction modes: optical sectioning structured illumination microscopy (OS-SIM), super-resolution structured illumination microscopy (SR-SIM), polarisation dipole analysis, fast DPC (fDPC), and quantitative DPC (qDPC) imaging. The system is highly integrated with a space-efficient design, occupying only 60 cm × 60 cm, which facilitates its rapid deployment in laboratory and clinical settings. In practical applications on various biological samples, MFPM synergistically combines high resolution with a large FOV, offers multiscale adaptability and excellent biocompatibility, and provides complementary structural and dynamic information in a single unified platform through system-level integration of established modalities, such as DPC, SIM, and orientation mapping. Robust system-level integration enables capabilities that no individual modality can achieve, making it a cost-effective, multimodal imaging solution for biomedical research.
-
In this study, a highly integrated multimodal fluorescence-phase system was established, as illustrated in Fig. 1a, b. The system architecture combines a coherent structured illumination module for fluorescence excitation with a programmable partially coherent LED illumination module for label-free imaging while utilising a unified detection optical path for signal collection across both modalities. This design retains the high compatibility of wide-field detection within a compact 60 cm × 60 cm footprint (Fig. 1b).
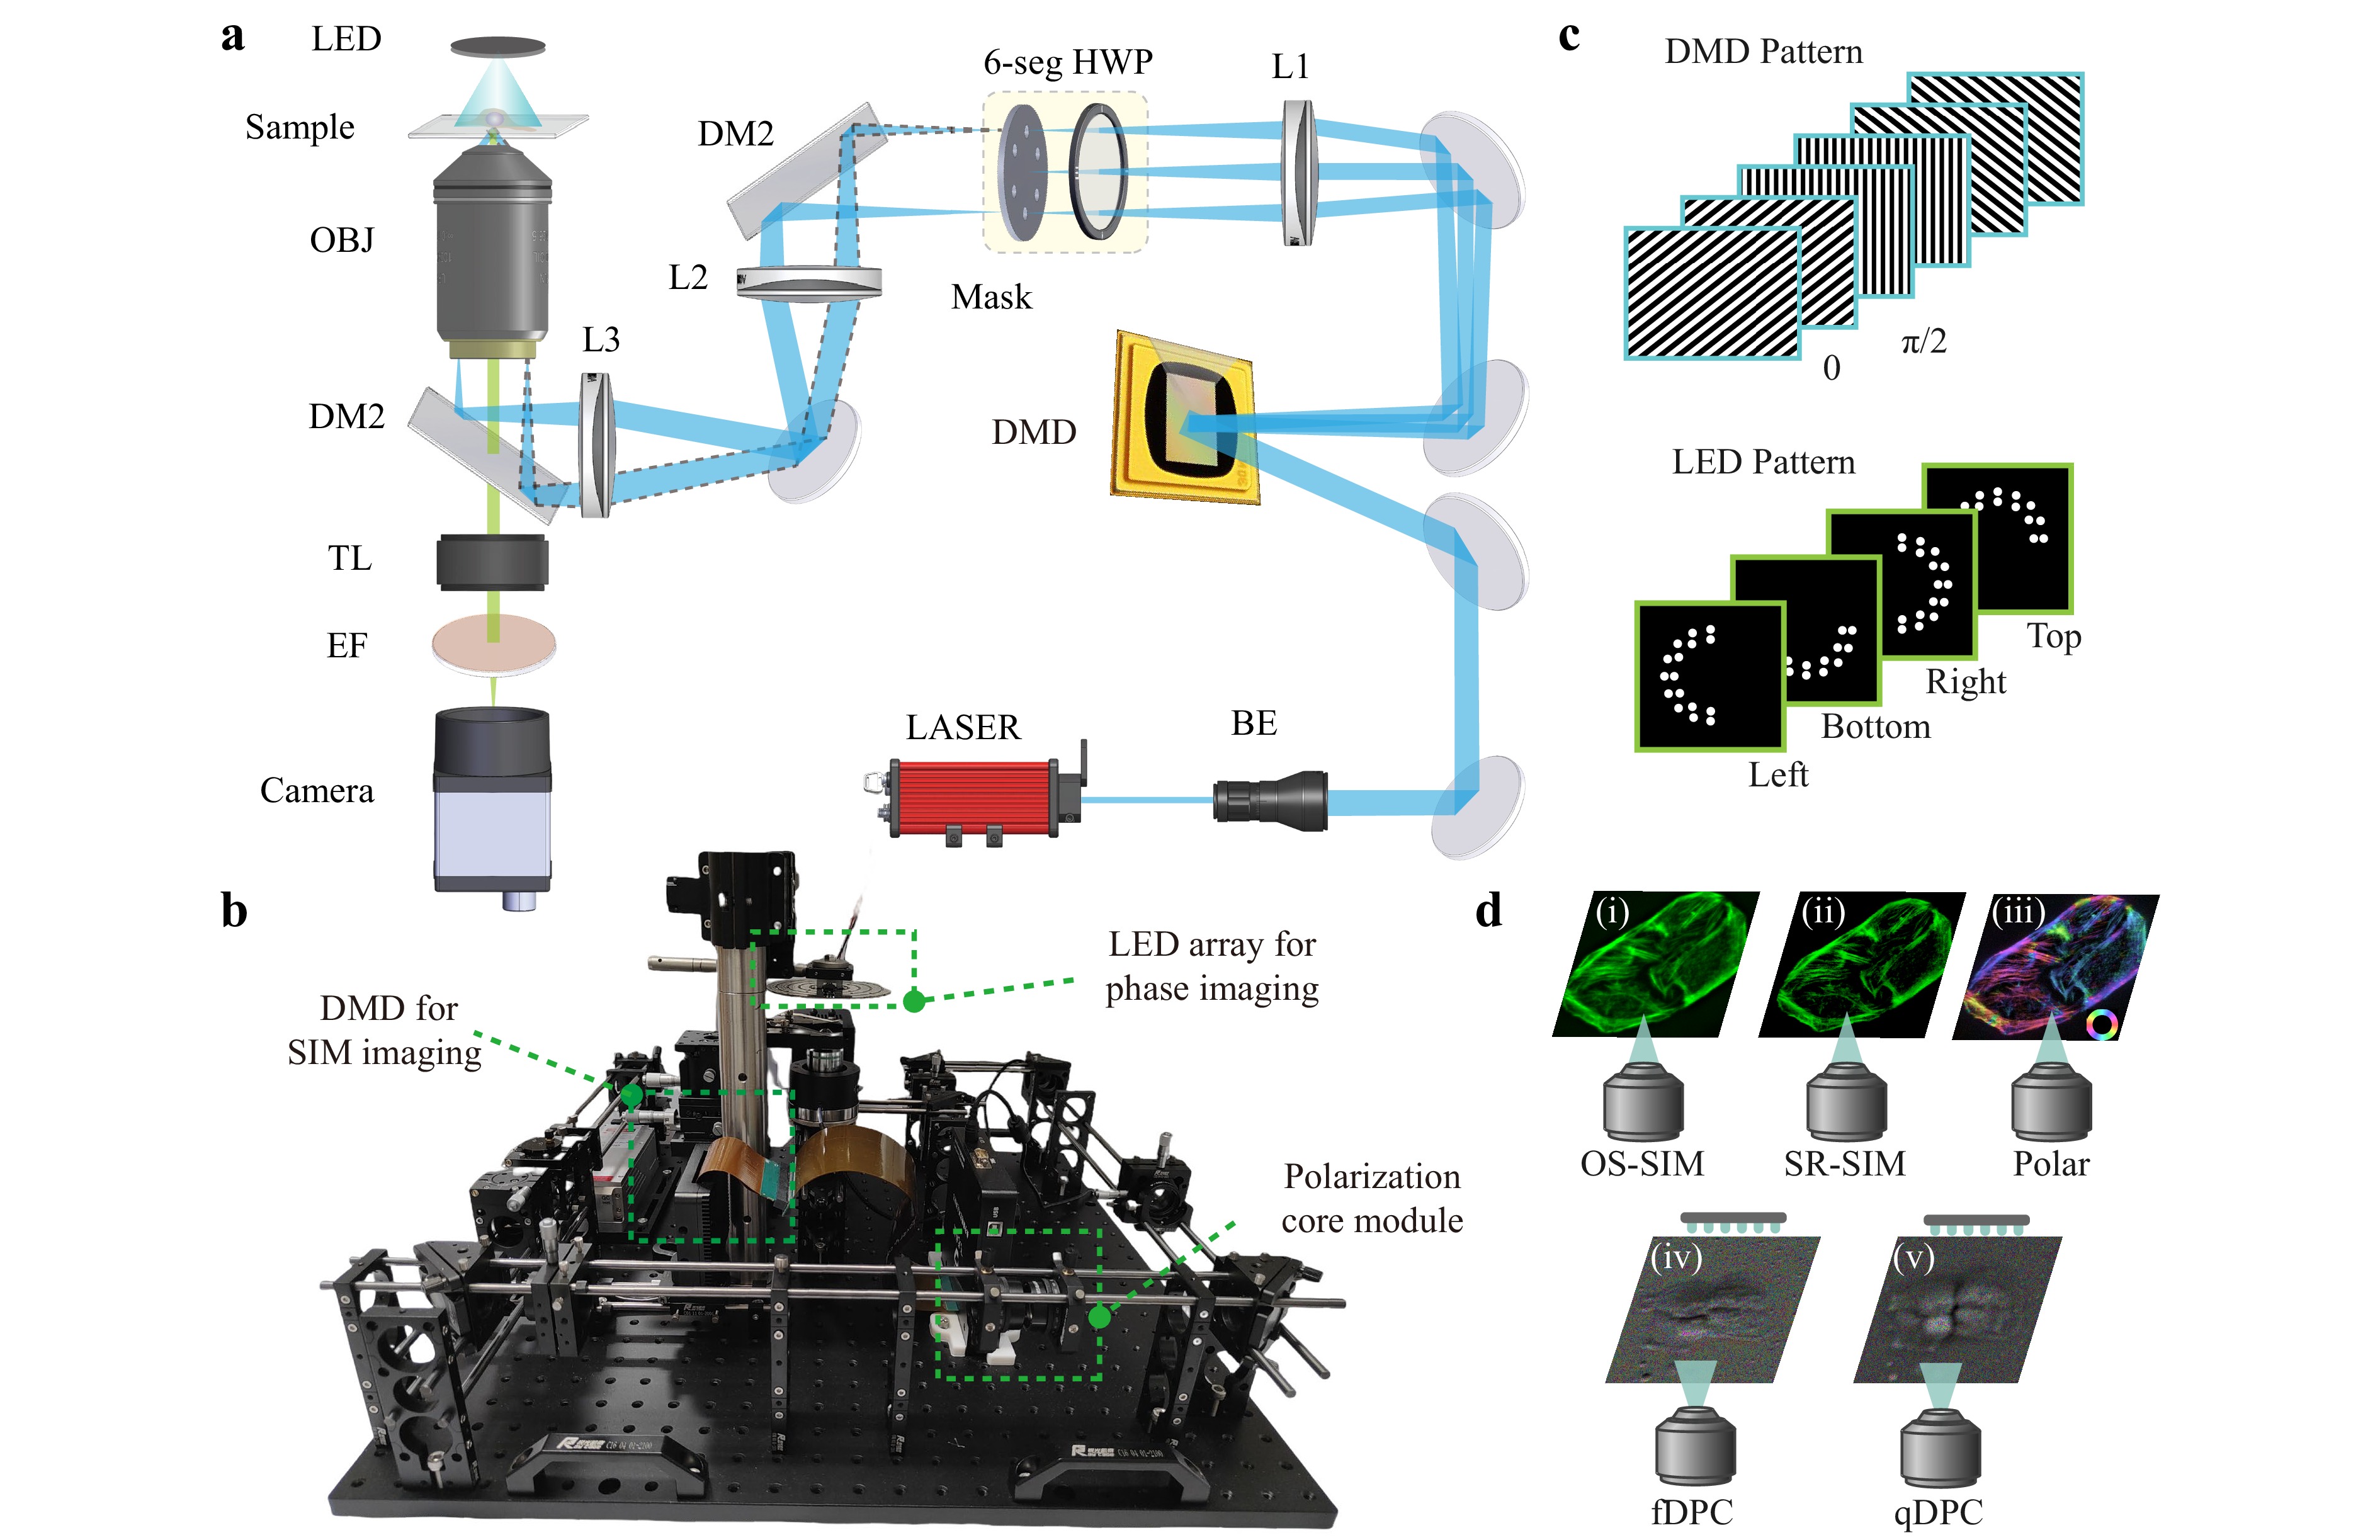
Fig. 1 System design and multimodal imaging modes of MFPM. a Optical schematic of the MFPM system. L: lens, 6-seg HWP: six-sector half-wave plate, DM: dichroic mirror, OBJ: objective lens, TL: tube lens, EF: emission filter, DMD: digital micromirror device, BE: beam expander. b Experimental layout of the imaging system. Core modules for different imaging modalities are outlined with green dashed boxes. c Modulation patterns loaded into DMD and programmable LED array. d Supported imaging modes of MFPM, including OS-SIM, SR-SIM, polarisation dipole analysis, fDPC, and qDPC imaging.
For the fluorescence illumination optical path, a 561 nm laser is expanded using a beam expander (GBE10-A, Thorlabs) and directed onto a digital micromirror device (DMD, F6500 Type-A, Fldiscovery Technology) at an incident angle of 24°. When periodic fringe patterns are sequentially loaded into the DMD, as shown in Fig. 1c, multiple diffraction orders are generated. The 0th and ±1st diffraction orders are collected by an achromatic lens (L1, AC254-300-A-ML, Thorlabs) and focused onto a custom-designed spatial mask, with hole diameter of 400 μm. This mask acts as a spatial filter by blocking the 0th-order beam and selectively transmitting the ±1st-order beams from three predefined directions. A six-sector half-wave plate (AHWP25-VIS-A-6P-M, LBTEK) is used to ensure that the ±1st-order beams exhibit azimuthal polarisation states depending on the direction. Owing to the coherence of the laser source, these beams interfere at the focal plane of the objective lens, forming structured illumination patterns on the sample.
The label-free illumination module consists of a cost-efficient, programmable LED array controlled by a microcontroller (DFRduino Mega 2560, DFRobot). Because the DPC technique uses transmitted illumination, a LED array is placed above the objective lens. By adjusting the vertical distance between the LED array and the sample, the illumination numerical aperture (NA) can be tuned to match that of the imaging objective lens for optimal imaging conditions (detailed adjustment strategies are provided in Supplementary Note 6). Because each LED can be controlled individually, flexible illumination patterns can be generated electronically without mechanical movement. In the DPC imaging mode, asymmetric illumination patterns (such as semi-circular or semi-ring illumination) are encoded to modulate the spatial frequency content of the sample, thereby enhancing the image contrast, the LED patterns are shown in Fig. 1c.
The two illumination modalities share a unified wide-field detection pathway. Through the combination of an emission filter (ET600/50M, Chroma) and dichroic mirror (ZT561rdc, Chroma), the system can obtain information from two distinct illumination modes using a single sCMOS camera (Dhyana 400BSI, Tucsen) with a 2,048 × 2,048 pixel array. Based on a highly integrated configuration, five different imaging modes are supported by algorithmic reconstruction: OS-SIM, SR-SIM, polarisation dipole analysis, fDPC, and qDPC imaging, as illustrated in Fig. 1d. Owing to the limitations of camera read-out and synchronisation switching, we recommend a time interval of 15 ms or more for acquiring raw images in all five modes of imaging. Refer to Supplementary Note 4 for detailed experimental results.
-
As mentioned earlier, the proposed MFPM system acquires multi-dimensional information from only ten raw images. The shared detection path between SIM and DPC ensures precise spatial registration for co-imaging, eliminates alignment artefacts, and enhances data utilisation efficiency. A flowchart of the algorithm is shown in Fig. 2a.
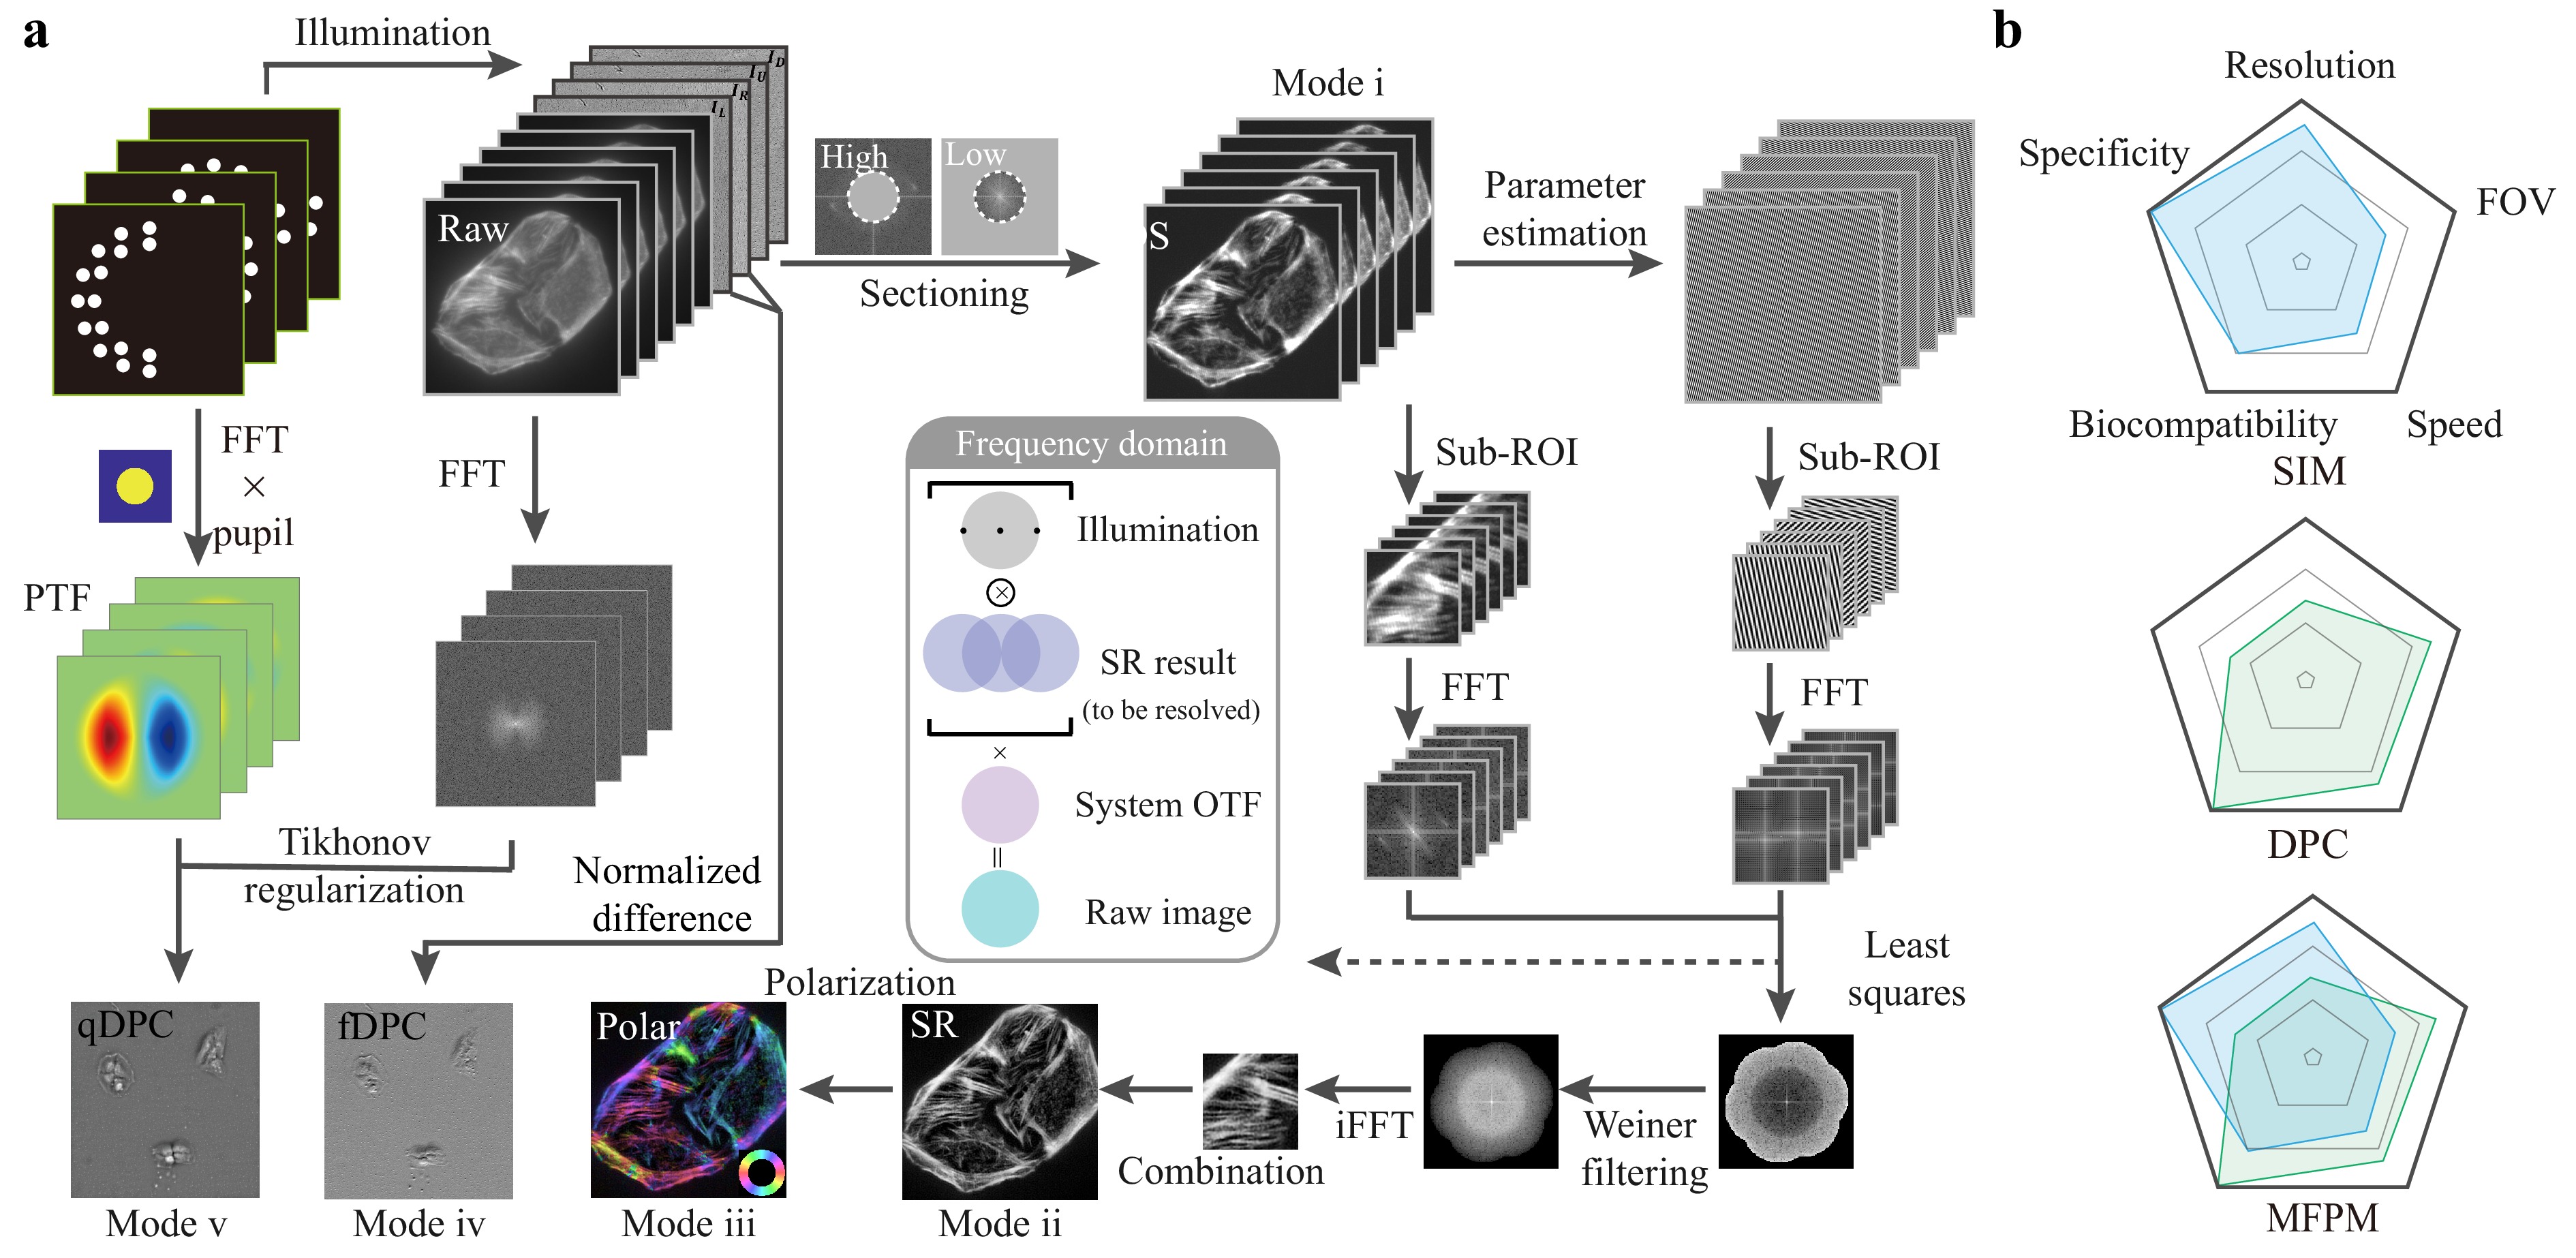
Fig. 2 Multimodal image reconstruction process and comparison of modality performance radar chart. a Image reconstruction workflow in MFPM imaging. The grey box in the middle represents the frequency domain representation of the process of super-resolution information imaging of the sample. b Radar chart of SIM, DPC, and MFPM on different performance criteria.
Both DPC and SIM employ illumination encoding and inverse-problem-based decoding in their reconstruction processes. These techniques utilise multiple modulated illumination patterns to encode distinct spatial frequency components of a sample into an observable frequency band, followed by spectrum fusion or deconvolution for high-fidelity reconstruction. However, these two methods aim to recover different information characteristics: DPC focuses on retrieving phase distributions, whereas SIM targets higher-spatial-frequency components of the fluorescence intensity beyond the diffraction limit. Consequently, the physical models and reconstruction details differ. For qDPC reconstruction, raw intensity images are captured under pairs of complementary asymmetric illuminations generated by the programmable LED array. Each pair encodes the phase gradient along opposite directions, and the qualitative phase gradient of the fDPC can then be retrieved from only two corresponding raw images (e.g. $ {I}_{\rm L} $ and $ {I}_{\rm R} $, which denote the images captured under left and right illumination directions, respectively) at a very high processing speed via differential normalization21,22:
$$ {I}_{\rm{DPC}}=\frac{{I}_{\rm L}-{I}_{\rm R}}{{I}_{\rm L}+{I}_{\rm R}} $$ (1) Similarly, another illumination pair is used to obtain the gradient in the orthogonal direction. By utilising two or more raw image sets from orthogonal directions, isotropic phase information can be reconstructed23,27. We then apply the Tikhonov regularisation method to solve the inverse problem stably using an appropriate regularisation parameter $ \alpha {}_{\text{DPC}} $:
$$ \phi (\boldsymbol{r})={\mathcal{F}}^{-1}\left\{\frac{{\sum}_{j}\left[H_{j}^{*}(\boldsymbol{u})\cdot \mathcal{F}\left\{{I}_{j}(\boldsymbol{u})\right\}\right]}{{\sum}_{j}{\left| {H}_{j}(\boldsymbol{u})\right| }^{2}+{\alpha }_{\text{DPC}}}\right\} $$ (2) where $ \mathcal{F}\left\{I(\boldsymbol{u})\right\} $ represents the frequency spectrum of the raw frame, H represents the phase transfer function (PTF), $ \boldsymbol{u} $ denotes the spatial frequency coordinates, * is the conjugate symbol, $ {\mathcal{F}}^{-1}\left\{\cdot \right\} $represents the inverse Fourier transform, and $ j $ represents the number of original images. Note that the reconstruction process relies on a weak-scattering approximation. Therefore, only the samples that satisfy this condition can yield relatively accurate results. For a detailed derivation of the DPC phase reconstruction algorithm, please refer to Supplementary Note 1 and Fig. S1.
For the OS-SIM mode, we use two raw images and perform reconstruction using the HiLo algorithm28,29. The MFPM system further performs frame-reduction reconstruction and polarisation analysis to improve the imaging speed of the SR-SIM and resolve the dipole orientation. Therefore, we acquire only six raw images to achieve SR in this paper: two phase-shifted patterns for each of three stripe directions (with a phase difference of π). To mitigate out-of-focus background interference in thick samples caused by the wide-field detection hardware implementation of SIM, we use dark channel prior-based background removal algorithms, termed Dark sectioning, as the preprocessing step of SIM imaging. This algorithm separates the low- and high-frequency components in the Fourier domain. Through the application of dark channel processing to the low-frequency component, background contributions can be effectively suppressed24.
Subsequently, a least-squares reconstruction26 is conducted to reduce the number of reconstruction frames. Thus, the background-removed fluorescence distribution can be expressed as$ D{'}_{\theta ,\varphi }(\boldsymbol{r})=\left[S(\boldsymbol{r})\cdot {I}_{\theta ,\varphi }(\boldsymbol{r})\right]\otimes h(\boldsymbol{r}) $, and its frequency-domain representation becomes $ D{'}_{\theta ,\varphi }(\boldsymbol{k})= \left[S(\boldsymbol{k})\otimes {I}_{\theta ,\varphi }(\boldsymbol{k})\right]\cdot h(\boldsymbol{k}) $, where $ S(\boldsymbol{r}) $ and $ {I}_{\theta ,\varphi }(\boldsymbol{r}) $ are the sample and illumination distributions, respectively, and $ h(\boldsymbol{r}) $ is the point spread function. Using mutual correlation parameters, the frequency components across all illumination angles θ and phases $ \varphi $ are extracted. The frequency domain expression of the structured light modulation process can be obtained as
$$ \boldsymbol{d}'=\boldsymbol{M}\cdot \boldsymbol{S} $$ (3) where $ \boldsymbol{d}' $ denotes the combination of known raw image frequency-domain pixels $ D{'}_{\theta ,\varphi }(\boldsymbol{k}) $, $ \boldsymbol{M} $ is the result of multiplying the optical transfer function $ H(\boldsymbol{k}) $ by the estimated illumination stripes, and $ \boldsymbol{S} $ is the pixel combination of the SR image to be obtained. Subsequently, a Weiner filter is applied and the final spectrum of the SR image is transformed into the spatial domain. To accelerate computation, we separate the image into small patches for the acceleration of computation. Note that despite using only six raw images for super-resolution reconstruction, the final result is comparable to that achieved with nine frames (see Supplementary Note 5 for details). Furthermore, owing to the Dark sectioning preprocessing applied to the raw image, the reconstructed SIM achieves an increased imaging depth.
To further resolve the dipole orientation information, we obtain a wide-field (WF) image $ {W}_{\theta }(\boldsymbol{r}) $ by superimposing two phase-shifted fluorescence images, where the dipole response to polarised illumination follows $ {g}_{{{\theta }_{i}}}(\boldsymbol{r})=\left[1+\cos (2{\theta }_{pi}-2\rho )\right]/2 $30–32. The orientation can then be determined by solving the following linear system:
$$ \left[\begin{array}{c} {W}_{{{\theta }_{1}}}\\ {W}_{{{\theta }_{2}}}\\ {W}_{{{\theta }_{3}}} \end{array}\right]=\frac{1}{2}\left[\begin{matrix} 1 & \cos 2{\theta }_{p1} & \sin 2{\theta }_{p1}\\ 1 & \cos 2{\theta }_{p2} & \sin 2{\theta }_{p2}\\ 1 & \cos 2{\theta }_{p3} & \sin 2{\theta }_{p3} \end{matrix} \right]\left[\begin{array}{c} 2{I}_{\text{DC}}\\ {I}_{\text{AC}}\cdot \cos 2\rho \\ {I}_{\text{AC}}\cdot \sin 2\rho \end{array}\right] $$ (4) where $ {\theta }_{pi} $ is the polarisation angle in each illumination, $ \rho $ is the dipole of the fluorescence orientation, and $ {I}_{\text{DC}} $ and $ {I}_{\text{AC}} $ are the unchanged and changed components of the polarisation modulation, respectively. The detailed implementation of fluorescence reconstruction and a comparison of the polarisation-resolved methods are described in Supplementary Note 2 and Supplementary Tables.
We conducted a comprehensive performance evaluation of the MFPM by comparing SIM, DPC, and MFPM across five key metrics using radar charts: resolution, FOV, specificity, biocompatibility, and imaging depth. As illustrated in Fig. 2b, the MFPM system demonstrated remarkable synergistic advantages by combining the super-resolution and specificity of SIM with the large FOV and rapid imaging characteristics of DPC. Specifically, our actual measurements showed that the FOV of the phase modality was approximately 11.5 times that of the fluorescence modality (See Supplementary Note 4 for detailed results). Benefiting from the frame-reduction algorithm and integrated reconstruction of phase and polarisation information, MFPM significantly enhances both information throughput and content richness within the same acquisition time. More importantly, the ability to switch between imaging tailors to different scenarios significantly improves the biocompatibility of MFPM. This multimodal integration strategy not only overcomes the inherent limitations of conventional single-mode microscopy but also establishes a framework for high-throughput, multidimensional biological imaging, laying the foundation for more versatile biological applications.
-
MFPM involving five modes can provide multidimensional information jointly: optical sectioning and high-resolution fluorescence information (OS-SIM and SR-SIM), large-FOV label-free panoramic cellular information (fDPC and qDPC), and orientation-dependent information (polarisation dipole analysis). To validate the fluorescence super-resolution capability and quantitative phase reconstruction performance of the system, we first imaged 1 μm fluorescent polystyrene beads using a 20×/0.80 NA objective lens. See Supplementary Note 9 for the detailed preparation of fluorescent polystyrene beads. As shown in Fig. 3b, the reconstructed qDPC results clearly resolved the densely clustered fluorescent beads that remain indistinguishable in conventional BF images. Given that the fluorescent beads are composed of polystyrene (refractive index n = 1.59), the theoretical maximum phase value of a 1 μm bead is calculated to be $ 2{\text{π}} (n-{n}_{0})d/\lambda =0.72 $ rad. The experimentally measured phase difference between the centre and edge of the bead was approximately 0.71 rad, indicating that the experimental results agreed well with the theoretical value.
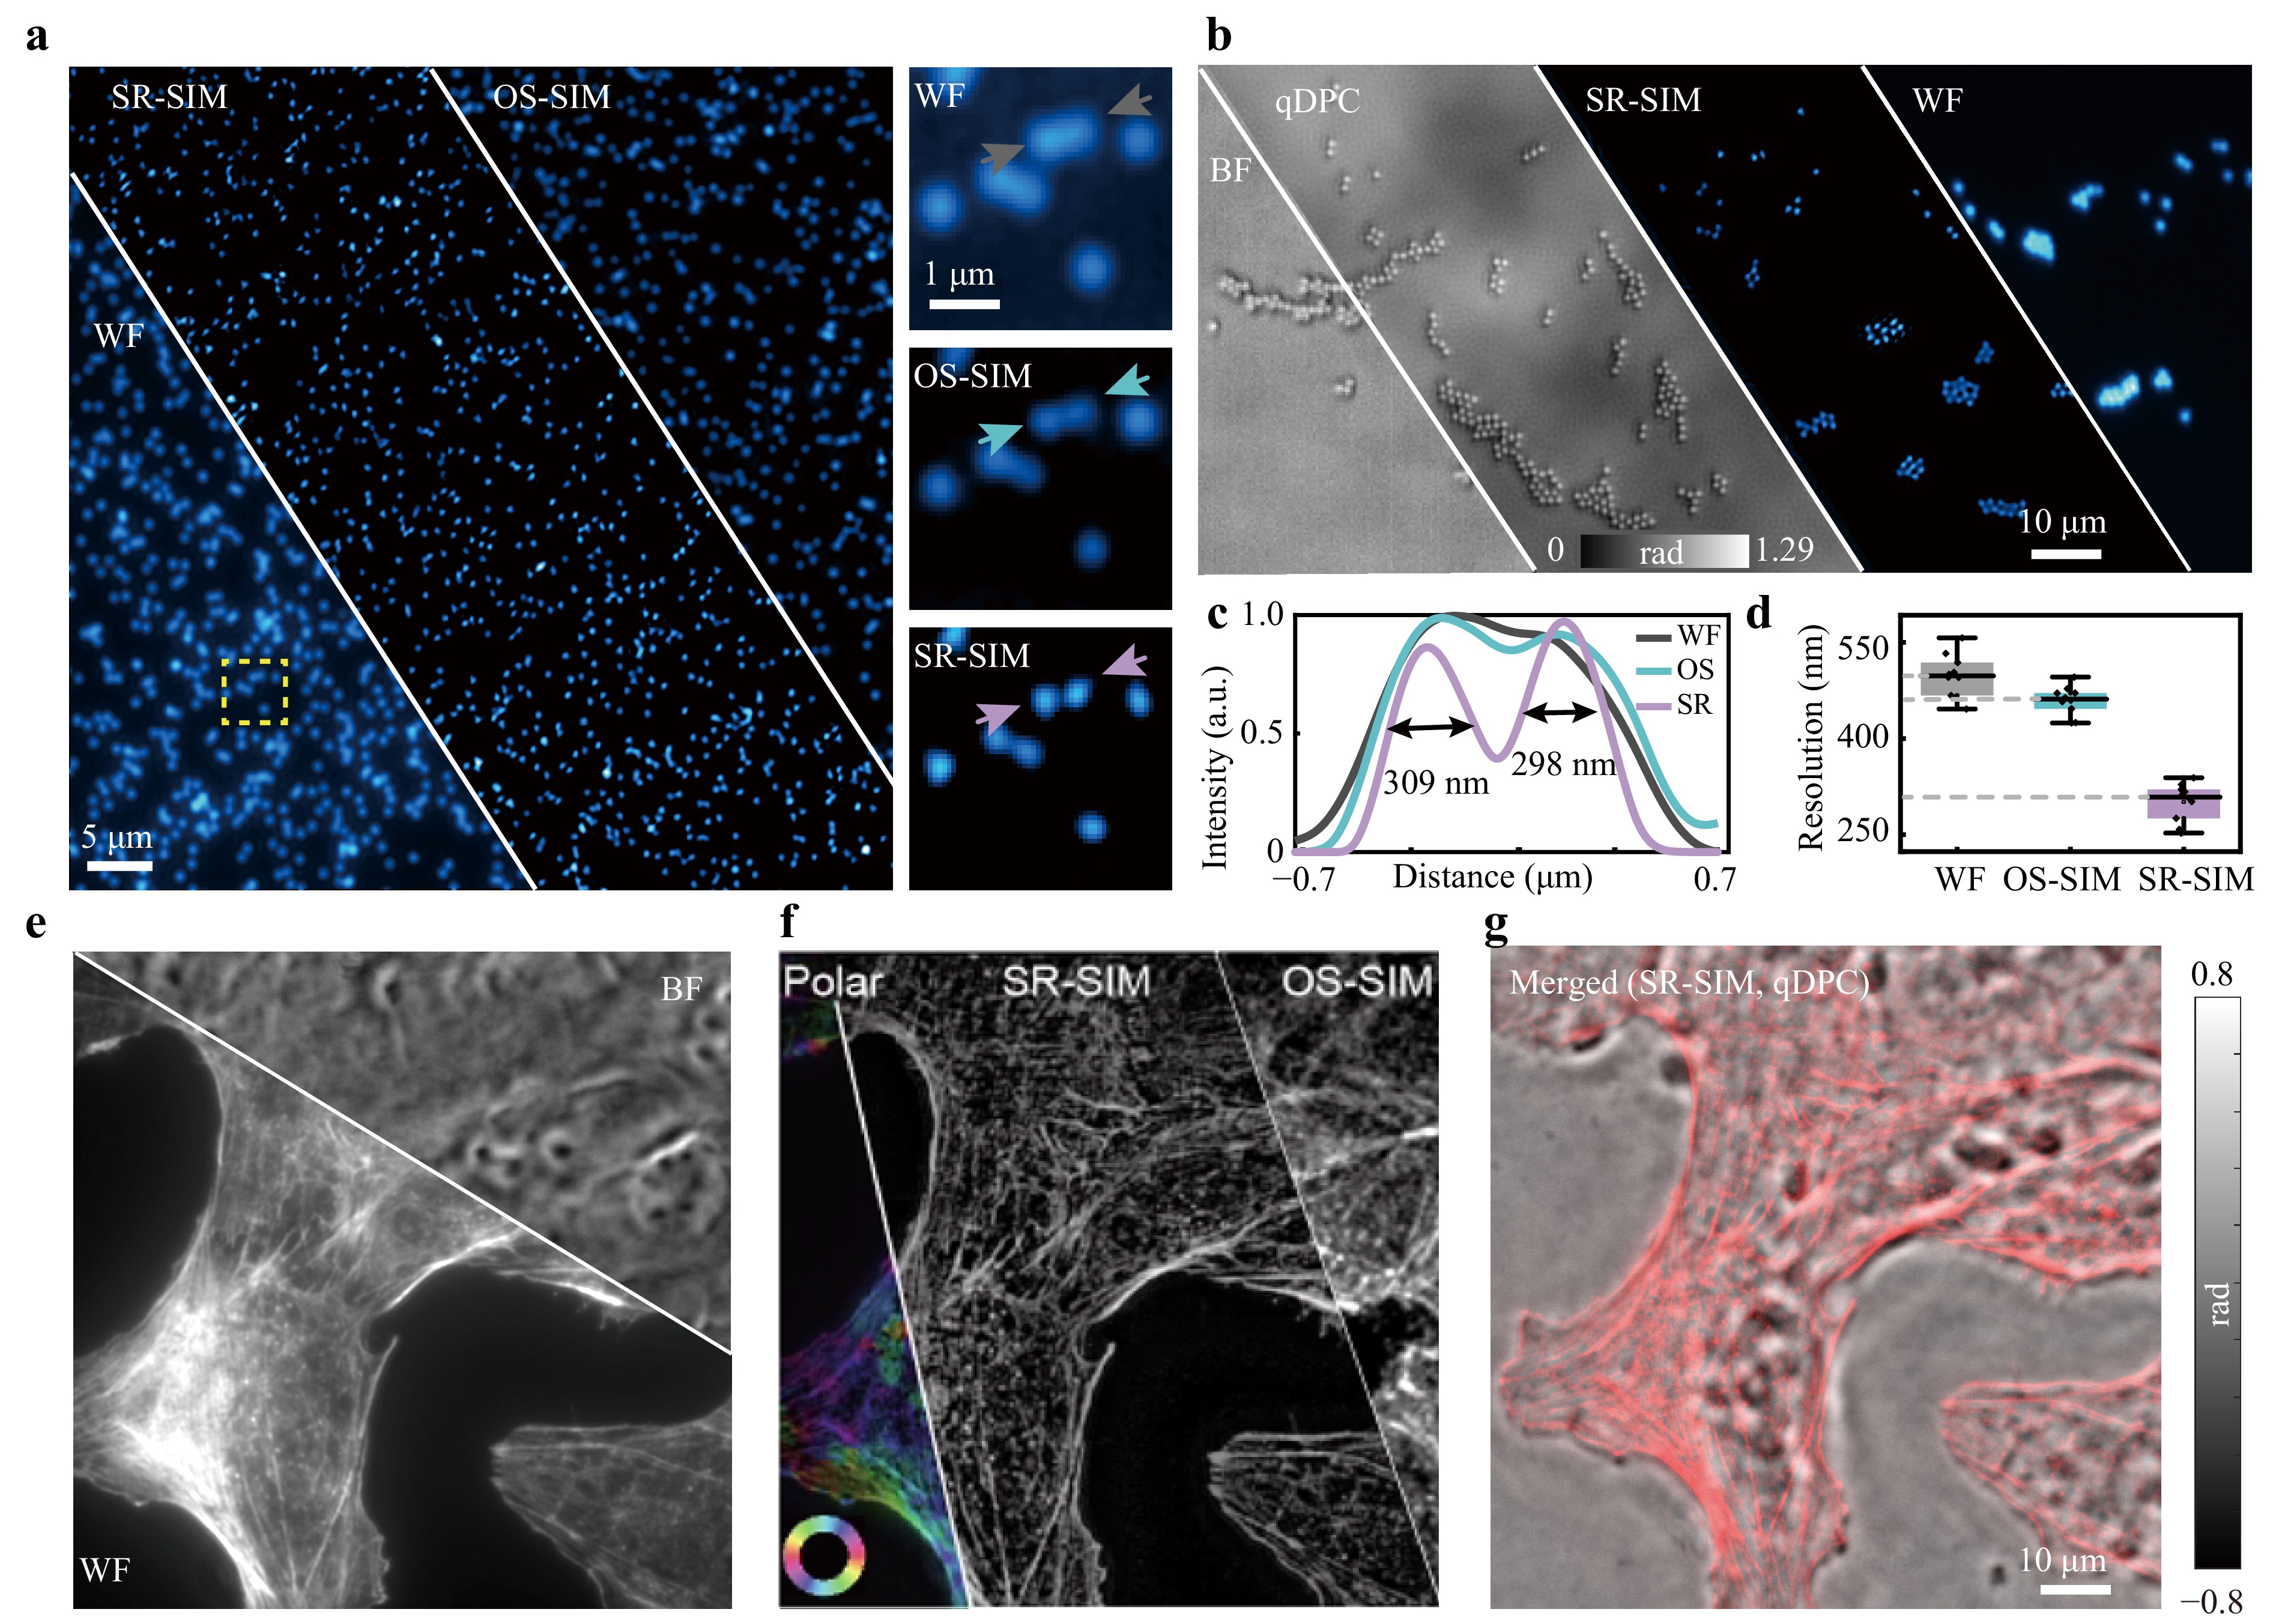
Fig. 3 Comparison of MFPM results of fluorescent beads and subcellular structures under different imaging modes. a Comparison of WF, OS-SIM, and SR-SIM imaging results for 100 nm fluorescent beads using a 40×/0.95 NA objective lens. The figures on the right are the comparison of imaging results within the yellow dashed box in left images. b BF, qDPC, fluorescence WF and SR imaging results of 1 μm beads using a 20×/0.80 NA objective lens. c Intensity distribution of the arrowed region in a. d Average resolution obtained by statistically analysing the imaging results of 10 randomly selected fluorescent beads from a. e Comparison of BF and fluorescence WF imaging results using a 40×/0.95 NA objective lens. f Fluorescence imaging results of polarization, SR-SIM, and OS-SIM. g Multimodal integration of SR-SIM reconstruction results and qDPC imaging results. For fluorescence modes, the emission wavelength is 610 nm, and the centre wavelength of the LED used for phase imaging is 610 nm.
Meanwhile, fluorescence SR-SIM reconstruction significantly improved the spatial resolution compared with fluorescence WF microscopy. To assess this improvement, we further imaged 100 nm fluorescent beads using a 40×/0.95 NA objective lens (Fig. 3a). The SR reconstruction results achieved better resolution than the WF and OS-SIM, breaking the theoretical diffraction limit of 392 nm calculated based on the Rayleigh criterion. For two adjacent fluorescent beads, both WF and OS-SIM failed to resolve them, whereas the fluorescence SR results could distinguish them and full width at half maximum (FWHM) values of 309 and 298 nm, respectively (Fig. 3c). To ensure statistical reliability, we analysed the FWHM of 10 randomly selected fluorescent beads, yielding an average SR resolution of 298 ± 29 nm (mean ± standard deviation), compared with 496 ± 33 nm for WF and 457 ± 22 nm for OS-SIM imaging, as illustrated in Fig. 3d. This represents an approximately 1.7-fold improvement in resolution over conventional WF imaging. Note that the resolution of the WF was slightly larger than the diffraction limit, and we concluded that the cause of this degradation was spherical aberration resulting from the refractive index mismatch.
Consequently, the MFPM platform enables seamless multimodal imaging of both label-free and fluorescence-labelled structures within the same area of the sample, offering the potential for in-depth subcellular organelle analyses. In multimodal imaging, DPC imaging offers an outline of the global cellular morphology, whereas the fluorescence channel reveals subcellular features with enhanced resolution. We imaged U2OS cells stained with Alexa Fluor 568-phalloidin to visualise the filamentous actin. With a 40×/0.95NA objective lens, the phase image effectively provided panoramic structural information of the cell, whereas the fluorescence SR results provided more specific and detailed spatial information. The SR imaging results were compared with WF and OS-SIM methods, as shown in Fig. 3e, f. Quantitative analysis demonstrated that the signal-to-background ratio of SR reached 9.19 dB, exceeding that of WF imaging (7.34 dB). Fourier ring correlation (FRC)33 analysis indicated that the SR achieved a nearly 1.6-fold resolution enhancement (see Fig. S17).
Polarisation-resolved analysis was performed on the same dataset to extract the dipole orientation information of the actin filaments. The resulting polarisation maps complemented the structural details obtained from SR imaging and provided insights into cytoskeletal alignment and anisotropy (Fig. 3f). Finally, we merged the qDPC and SR-SIM fluorescence reconstructions to create a composite view combining the morphological context with high-resolution and more detailed information, highlighting the capability of MFPM to simultaneously capture multidimensional subcellular information across different imaging modalities (Fig. 3g).
-
Cervical cancer is one of the most prevalent malignancies affecting women globally and poses a significant threat to their health and survival34. In the diagnosis and treatment of cervical tumours, surgical excision of the lesion tissue is typically required for pathological evaluation. However, in the differential diagnosis of common cervical lesions, particularly for distinguishing cervicitis (a benign condition) from cervical cancer (a malignant tumour), traditional H&E staining, which is widely recognised as the gold standard in clinical pathological diagnosis, relies heavily on subjective interpretation by pathologists, introducing uncertainties and inter-observer variability. To mitigate these limitations, we employed our MFPM system to acquire fluorescence and phase information from standard cervical tissue sections with a thickness of 5 μm. This approach leverages quantitative fluorescence intensity data combined with nuclear features (nuclear density and count) derived from subsequent cell segmentation analysis.
During the imaging process using a 20×/0.80NA objective, fDPC imaging was first performed on cervicitis and cervical cancer tissue sections to quickly obtain the corresponding gradient map. This mode was prioritised because of its large FOV and imaging speed (requiring only two raw images), which enabled the efficient capture of structural contour information across the sample. DPC observations revealed distinct tissue architectures; cervical cancer tissues demonstrated weaker edge information, reduced structural continuity, and a narrower phase variation range than benign cervicitis tissues (Fig. 4a, b). Upon identification of suspicious regions using the large FOV of DPC, fluorescence signal acquisition was performed. However, thick tissue sections often introduce significant out-of-focus background light. Therefore, the use of the dark-channel prior-based background removal algorithm significantly enhanced the structural clarity of the fluorescence image. Fig. 4a, b present representative co-registered results, showing the fluorescence SR images, fDPC images, and their merged multimodal visualisation within identical regions of interest. The DPC images revealed global cellular contours within the tissue. In contrast, SR-SIM resolved more detailed structural features, including fine perinuclear distributions, that reflect subtle variations related to cellular differentiation and malignancy. Together, these two modalities provided complementary information that could not be obtained individually.
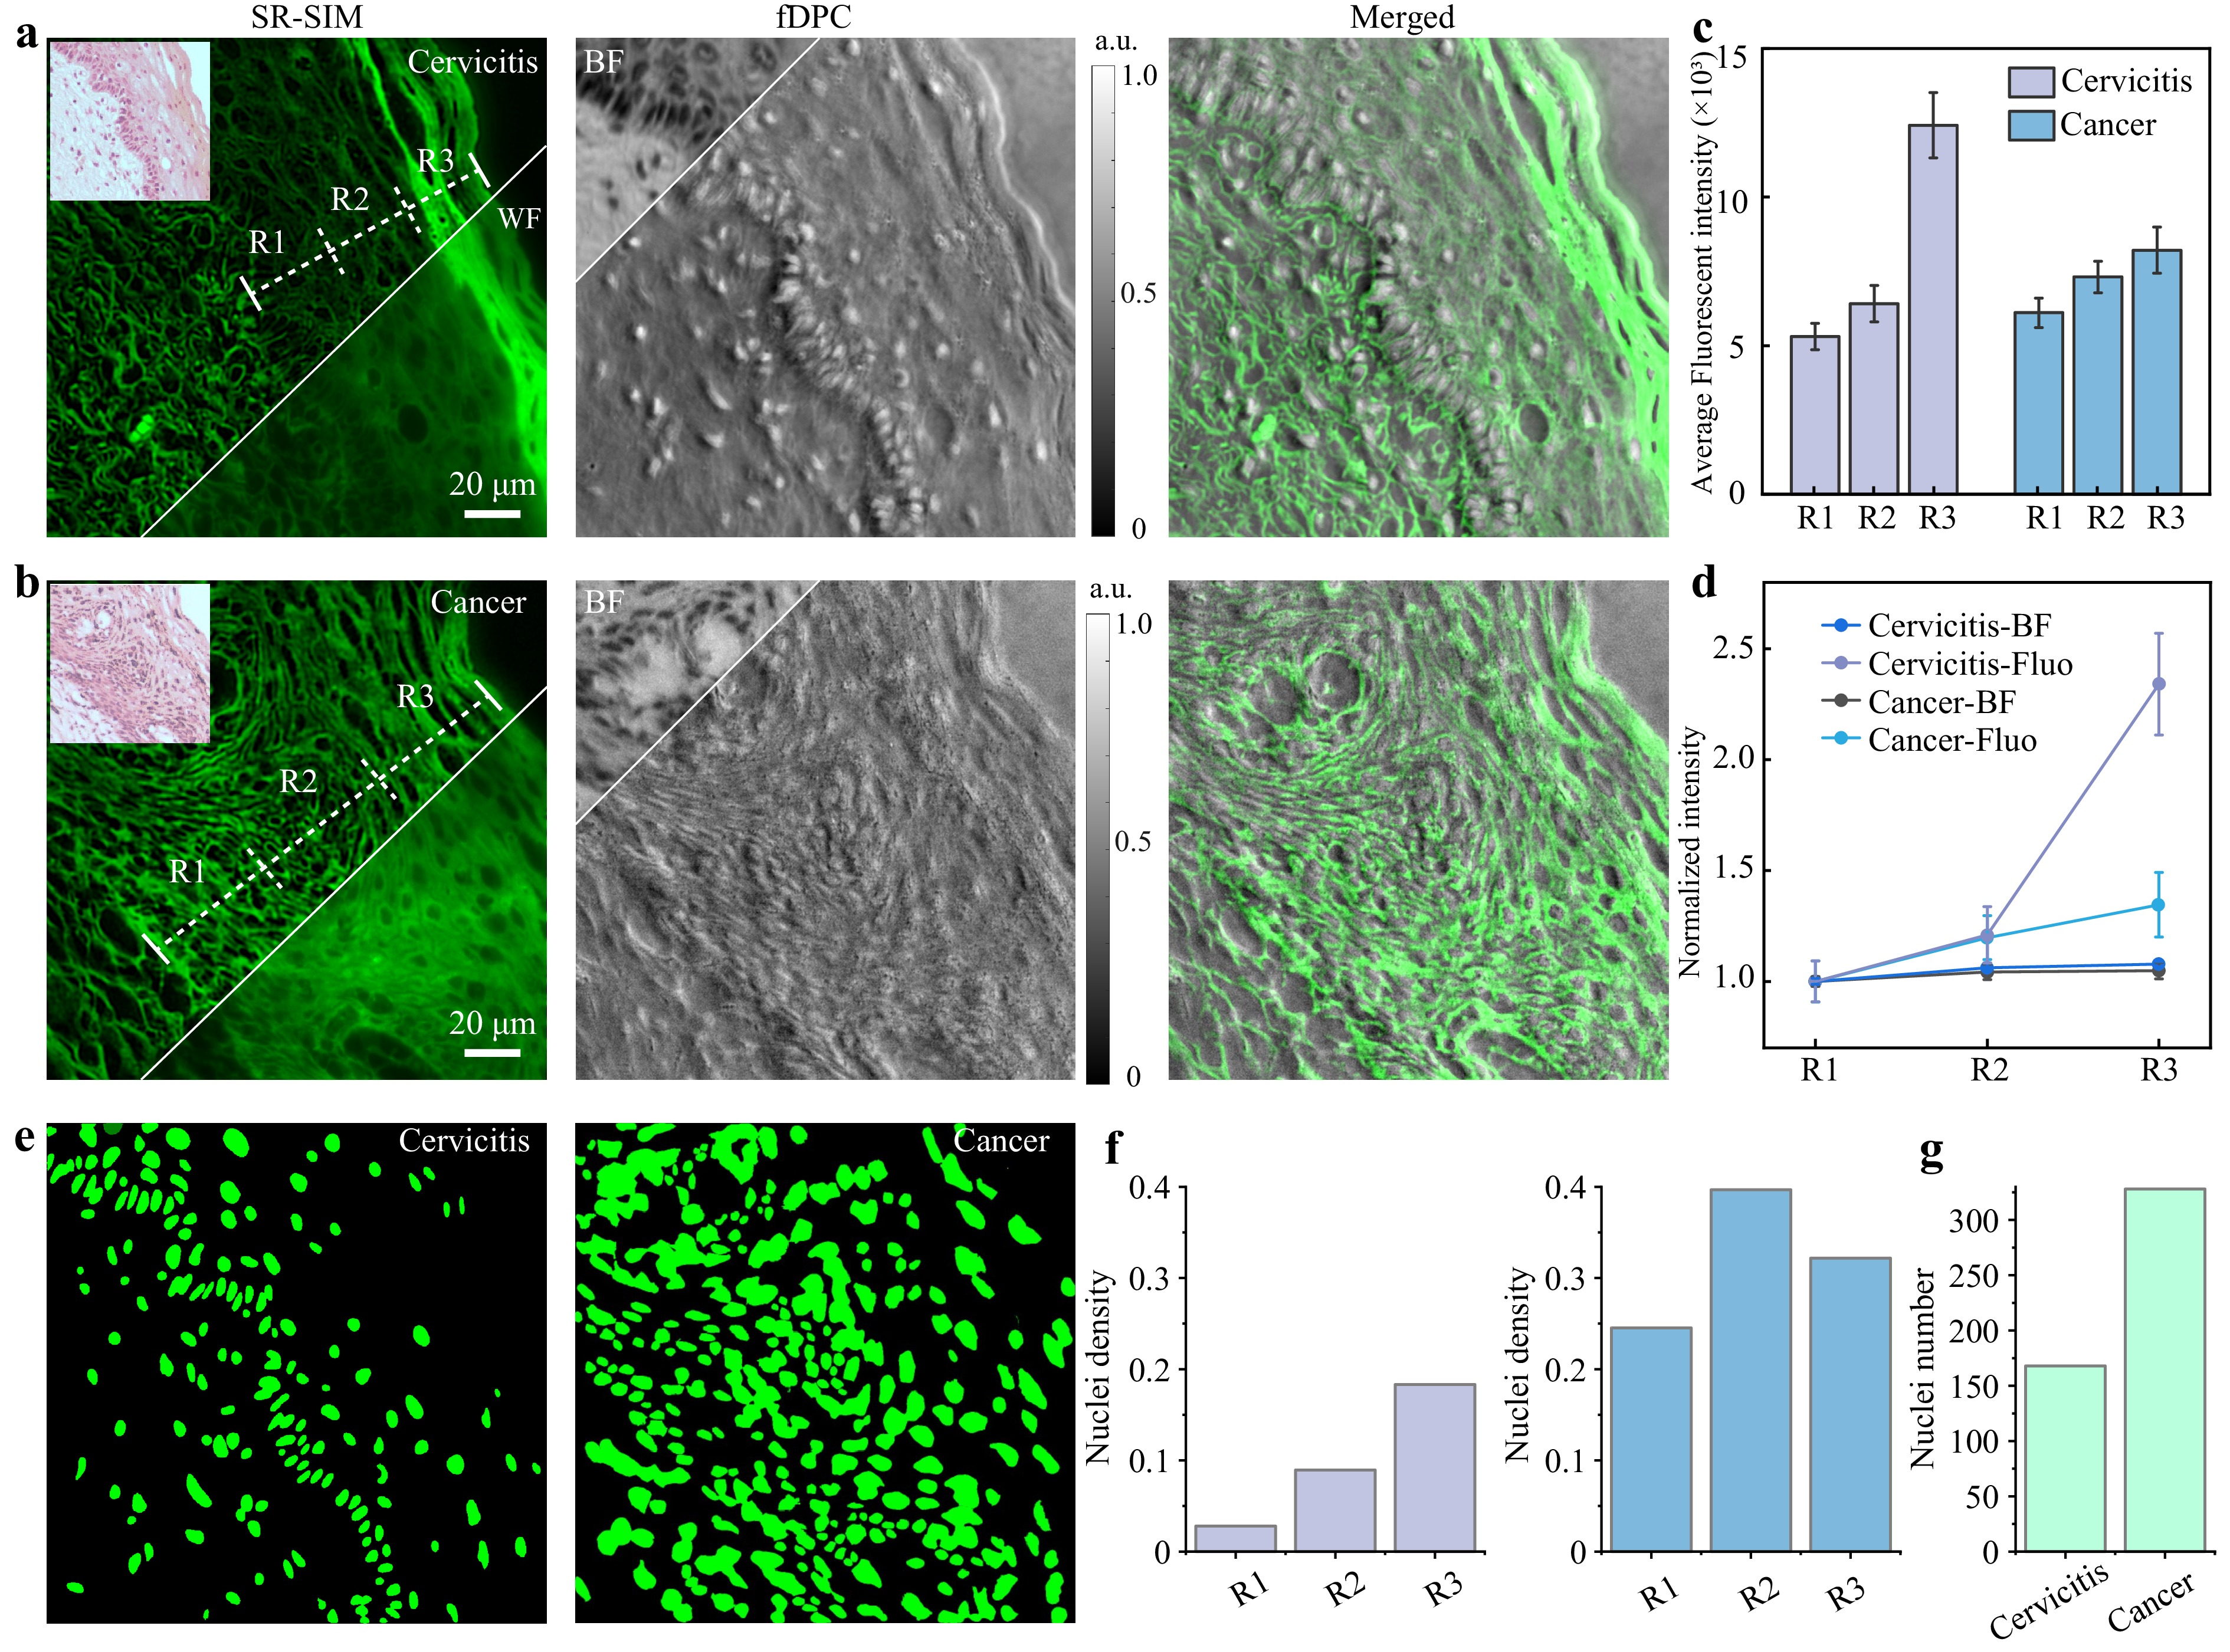
Fig. 4 Multimodal imaging and quantitative statistics result for cervicitis and cervical cancer using a 20×/0.80 NA objective lens. a Multimodal imaging results for cervicitis. b Multimodal imaging results for cervical cancer. c Fluorescence intensity statistics under different regions. d Fluorescence intensity normalization. e Cell segmentation results for cervicitis and cervical cancer. f Statistical results of nuclei density in different regions of cervicitis (left) and cancer (right). g Results of cell nucleus counting in the same FOV for cervicitis and cervical cancer. The emission centre wavelength was 610 nm.
Quantitative analysis of fluorescence intensity within the epithelial regions of the tissue sections was performed using SR fluorescence images. More than 20 line segments were drawn traversing the epithelium perpendicularly and extending from the basement membrane to the epithelial surface. The fluorescence intensity profiles along these lines were determined. The epithelial thickness along each line was systematically divided into three equal segments, Segments 1–3, corresponding to different differentiation stages from the basal to the superficial layer. The average fluorescence intensity within each segment was calculated for analysis, as shown in Fig. 4c. To mitigate variations arising from technical factors, such as staining intensity, exposure time, and tissue thickness, we normalised each individual fluorescence intensity profile was by dividing all intensity values within a profile by the average intensity of its corresponding Segment 1 (basal layer). The resulting normalised fluorescence intensity profiles, along with the normalised BF intensity profiles for comparison, are shown in Fig. 4d. The results indicated significant differences in the epithelial fluorescence intensity distribution between cervicitis and cervical cancer specimens, whereas almost no difference was observed in the intensity distribution of BF. Therefore, the fluorescence intensity of the sample can objectively reflect whether the cervical tissue section is malignant. Compared with cervical cancer tissues, cervicitis samples retained significantly more fluorescence within the epithelium, with the highest intensity localised in the cytoplasm of keratinocytes in the superficial epithelial layer. The fluorescence intensity was the lowest in basal cells and progressively increased with keratinocyte maturation and epithelial differentiation. These findings are consistent with previous reports35 and may be attributed to the accumulation of various keratins and other proteins associated with mature keratinocytes36.
To further quantify the nuclear morphological features for diagnostic differentiation, we performed nucleus segmentation on the fDPC images of cervical tissue sections using Cellpose SAM37. Fig. 4e shows the results for cervicitis and cervical cancer samples after the segmentation parameters were optimised. Cervical cancer samples exhibited markedly higher nuclear densities than cervicitis samples. For rigorous quantitative analysis, the nuclear density was calculated within three distinct regions for each sample type (Fig. 4f). The results demonstrated a consistent trend: across all three regions, cervical cancer tissues displayed a significantly elevated nuclear density relative to cervicitis. This difference was most pronounced in region R2, where the nuclear density of cervical cancer tissues peaked at 0.40 nuclei/pixel, indicating increased cellular proliferation associated with malignancy. Additionally, the total number of nuclei was compared among the groups, as shown in Fig. 4g. Cervical cancer tissues exhibited more than twice the nuclear density of cervicitis tissues, providing quantitative support for the observed differences in the nuclear distribution between benign inflammatory and malignant neoplastic lesions. Collectively, these findings, derived from the quantitative analysis of the data acquired using our MFPM system, indicate that nuclear density and count serve as robust quantitative markers for distinguishing cervical inflammatory conditions from neoplastic transformations.
In summary, we demonstrated the feasibility of performing quantitative pathological analysis of standard tissue sections by integrating multimodal imaging, normalised image-processing pipelines, and nuclear analysis. This integrated approach provides a more objective and reproducible imaging-based framework for auxiliary diagnosis of cervical lesions. The analytical workflow which utilises fDPC imaging for the high-throughput screening of a large FOV, followed by SR fluorescence validation and detailed quantitative analysis of the regions of interest, further underscores the inherent advantages of our MFPM system. The key is the synergistic capability of the correlation between the overall structures and quantitative molecular or functional data. Furthermore, the complementary capabilities of the DPC and fluorescence imaging modalities within the MFPM platform were exemplified by additional results obtained from mouse skin tissue sections (Figs. S14 and S15), as detailed in Supplementary Note 7.
-
In pharmaceutical research, cardiotoxicity is one of the major factors contributing to the early termination or delay in candidate drug development. Cardiotoxicity assessment primarily relies on heart rate-related parameters, particularly heart rate variability (HRV), which is widely recognised as a key biomarker of cardiac arrhythmias38. Consequently, accurate high-throughput quantification of heart rate and HRV in model organisms such as zebrafish is essential to efficient drug screening and toxicology. Commonly used methods for heart detection include electrocardiography (ECG), image-based analysis software39, and manual counting40. However, these methods often lack cross-validation mechanisms to verify the accuracy of heart rate quantification, and manual counting is significantly affected by human factors in arrhythmia detection, resulting in low efficiency and insufficient accuracy.
To overcome these constraints, the proposed MFPM system leverages its unique multimodal capabilities. Exploiting the rapid pattern-switching capacity of its LED array and DMD alongside our frame-reduction reconstruction algorithm, MFPM enables synergistic cardiac imaging; DPC provides rapid global localisation of the beating heart within seconds, whereas the simultaneously acquired fluorescence delivers subcellular-resolution contractile dynamics. In this study, Tg (lyzC: Cherry) transgenic zebrafish were used as the experimental model, and the detailed sample preparation process is shown in Supplementary Note 9. Combining DPC and fluorescence imaging to cross-validate the results can significantly improve the measurement accuracy of heart rate parameters (such as heart rate, heartbeat interval, and rhythm fluctuation) while significantly reducing the time and labour demands associated with manual analysis. Time series derived from intensity fluctuations in sequential video frames, which reflected atrial and ventricular contractions, were analysed to extract and quantify zebrafish heartbeat dynamics.
The synergistic multimodal workflow of our MFPM system offers significant advantages. During the experiment, we used a 10×/0.30 NA objective lens. The fDPC imaging enabled rapid whole-organ screening, instantly locating the zebrafish heart within seconds across a large FOV, and eliminating the need for manual searching. Considering motion during the imaging process, we used agarose to embed juvenile fish and the scale-invariant feature transform (SIFT)-based41 registration plugin in Fiji for rigidity correction. More specifically, the fDPC images clearly captured the phase gradient of the zebrafish heart throughout the beating cycle, revealing a periodic contraction approximately every 0.4 s, corresponding to a heart rate of ~150 beats per minute (bpm), which is consistent with the typical range (120–180 bpm) for zebrafish at 72 h post-fertilisation (72 hpf)42, as shown in Fig. 5a, c. Subsequently, fluorescence images were captured and OS-SIM results were reconstructed. After photobleaching correction and image registration, the fluorescence intensity of the heart region shown in Fig. 5b was further subjected to time-series statistics, with the original intensity fluctuations depicted in Fig. 5d. During diastole, the heart chambers expand to accommodate more labelled cells, resulting in stronger fluorescence. However, during systole, the number of labelled cells decreases. Therefore, the periodic fluctuations in fluorescence intensity faithfully represent the cardiac systole and diastole phases, with intensity peaks corresponding to systole and troughs to diastole42. A t-test confirmed a statistically significant intensity difference between the two states (p < 0.00001), supporting its use in quantitative heartbeat characterisation. By analysing the intervals between adjacent fluorescence peaks and applying Fourier transform analysis, we determined the estimated heart rate was to be approximately 153 bpm. The high concordance between the DPC-derived (~150 bpm) and fluorescence-derived (~153 bpm) heart rates provides an intrinsic cross-validation that is unattainable with single-modality systems, significantly enhancing the reliability of HRV and arrhythmia assessment. This framework significantly reduces the analysis time compared with manual methods, providing unprecedented measurement confidence for efficient cardiotoxicity screening.
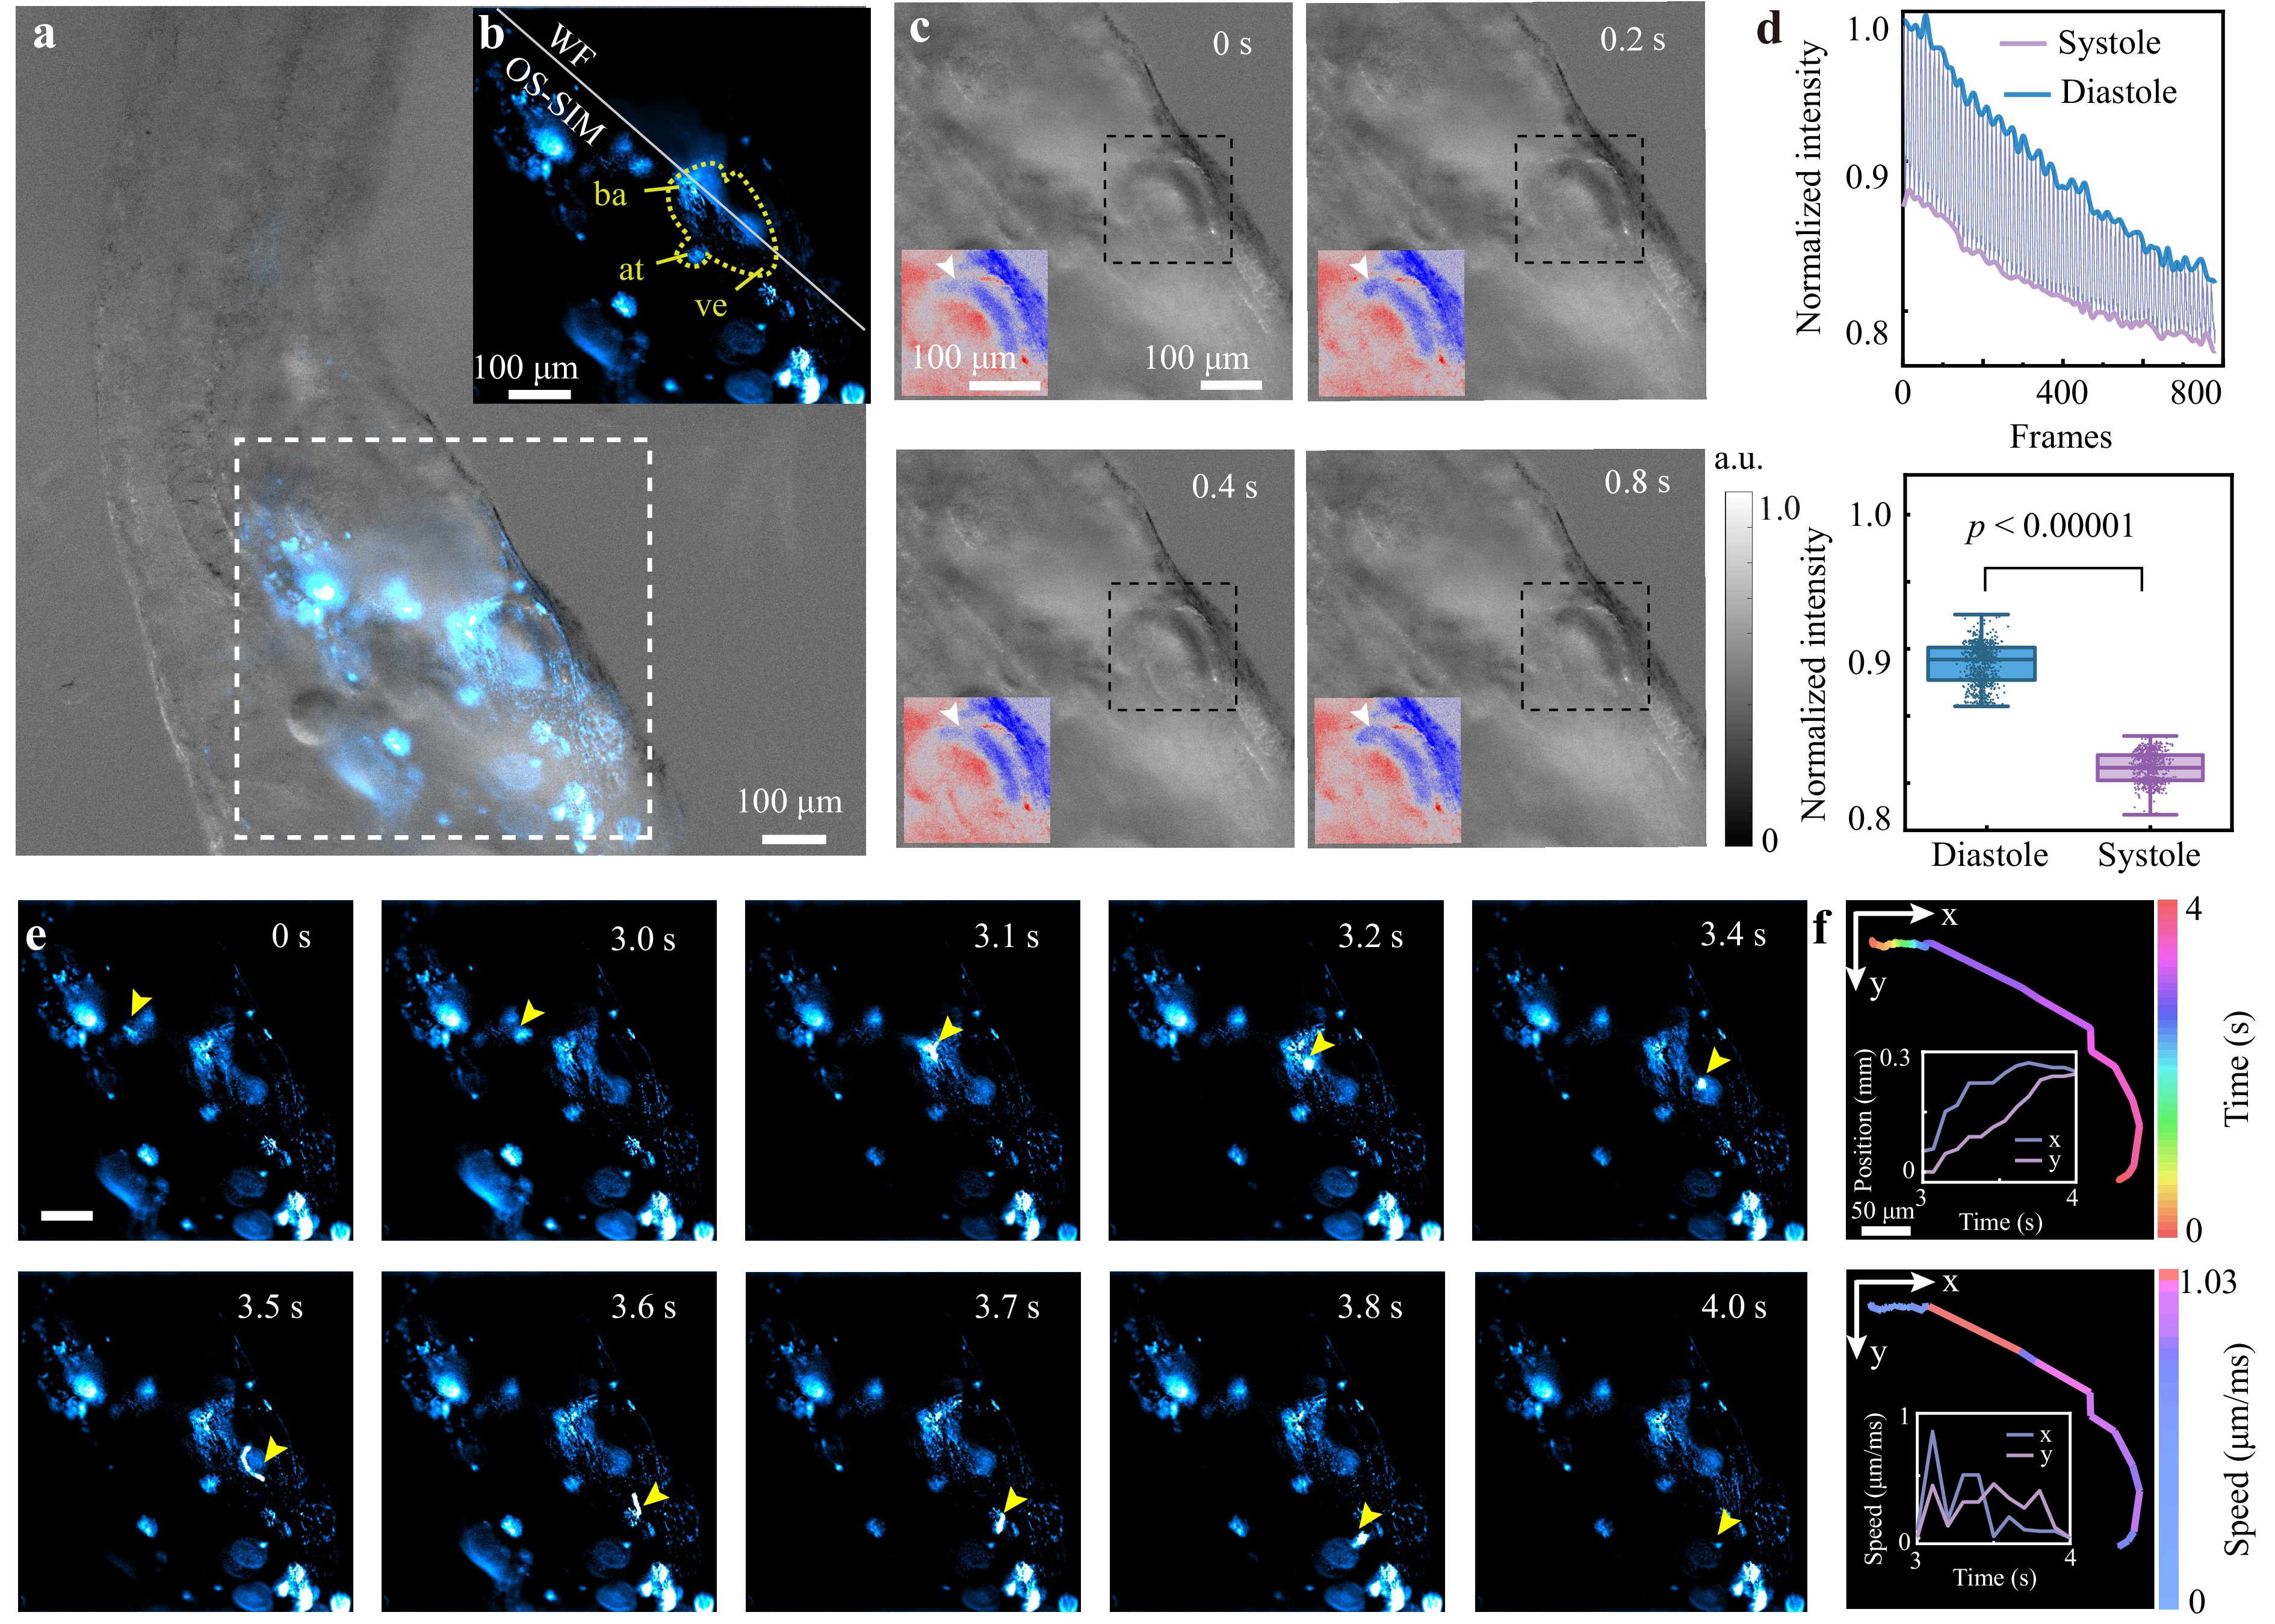
Fig. 5 Multimodal heart rate monitoring and neutrophil tracking in zebrafish using a 10×/0.30 NA objective lens. a fDPC image of zebrafish. b WF and OS-SIM images within the white dashed box in a, reflecting the structure of the heart. ba: arterial bulb, at: atrium, ve: ventricle. c fDPC images of zebrafish at different time points reflect changes in heartbeat. d (Top) Change in fluorescence intensity in the cardiac region over time. (Bottom) Significant difference in intensity distribution between diastole and systole after photobleaching correction. e Observation of neutrophil movement in zebrafish using fluorescence intensity distribution images captured by OS-SIM. The yellow arrows indicate the tracked neutrophils. f Statistical analysis of neutrophil movement trajectories and movement speed. The emission centre wavelength is 610 nm.
Beyond cardiac dynamics, the MFPM platform enables the effective investigation of neutrophil migration, which is a critical process in innate immunity. Neutrophils can rapidly respond to changes in the tissue microenvironment43, and their dysfunction is closely associated with various inflammation-related diseases and deficiencies in innate immune defense44, which makes the study of their migratory behaviour important. In zebrafish larvae, neutrophils predominantly reside within tissues, providing a valuable in vivo model for investigating their migration dynamics and functional responses in the tissue context. By leveraging the OS-SIM mode in the fluorescence module of the MFPM system, which offers excellent background suppression capabilities, we achieved precise tracking of neutrophil recruitment and damage response dynamics, which were previously challenging to capture using conventional microscopy.
Neutrophil recruitment to the sites of tissue injury typically proceeds in three phases: an initial chemotactic response by individual neutrophils to local damage signals, followed by an amplified migratory wave from distal tissues, ultimately culminating in the collective accumulation of neutrophils at the injury site45. However, the intrinsic thickness of the zebrafish larvae introduces a substantial out-of-focus background. To overcome this challenge and enable the accurate tracking of neutrophils, we employed the OS-SIM mode in MFPM. This approach enabled us to resolve neutrophil dynamics in real-time within live specimens. In the fluorescence image shown in Fig. 5e, cells exhibiting a higher fluorescence intensity correspond to labelled neutrophils. Within the observed 4 s timeframe, the neutrophils exhibited rapid migration behaviour, with fluorescence signals displaying irregular spatial distributions over time, forming elongated or arc-like trailing shapes along the migration path. These dynamic morphological features are consistent with known neutrophil behaviour, which requires flexible deformation of the cell body and nucleus to quickly migrate through very narrow endothelial channels to enter tissues43,46. In addition, the movement trajectory of the neutrophils can be quickly restored by cell tracking, as shown in Fig. 5f, which provides the spatial distribution and pathological conditions of biological tissues. Quantitative analysis revealed that, compared with its initial position at 0 s, the neutrophil reached a maximum displacement of 0.23 mm and an instantaneous peak velocity of 1.03 μm/ms. The maximum component velocities in the x and y directions were 0.92 and 0.46 μm/ms, respectively. At 4 s, a rapid decrease in neutrophil volume was observed, suggesting that the cells entered the injury site to participate in subsequent tissue repair and pathogen clearance.
Currently, the precise kinetic mechanisms governing the extravascular migration of neutrophils toward sites of tissue injury remain incompletely understood43. To address this knowledge gap, our MFPM system provides a unique multimodal decision-support capability. By dynamically switching to DPC imaging during neutrophil tracking experiments, researchers can perform real-time physiological state assessments of zebrafish hosts. When a large number of neutrophils undergo directional migration, DPC imaging of the suspected target region enables the instantaneous evaluation of potential inflammatory or pathological changes through quantitative phase signatures. On-demand correlative imaging is an effective technique for identifying occult tissue injury or infection sites that may not yet exhibit overt fluorescence markers. To further demonstrate the ability of the system to capture dynamic quantitative phase variations, we conducted phase monitoring of the L929 cell death dynamics using DPC imaging (Fig. S16). For more detailed information, please refer to Supplementary Note 8.
-
In this paper, we propose an integrated multimodal fluorescence-phase microscopy (MFPM) system that is capable of fluorescence, polarisation, and phase imaging from the same sample region. The system achieves multimodal capabilities through a unified hardware implementation and computationally efficient reconstruction algorithms, including OS-SIM, SR-SIM, fluorescence polarisation resolving, fDPC, and qDPC imaging. Compared to existing multimodal systems47–50, this system features lower hardware complexity47,50, no additional image registration, and fewer original images47,49. To further enhance the imaging performance, we implemented frame-reduction and background removal strategies, as well as a fluorescence polarisation orientation-resolving algorithm for resolving fluorescence polarisation orientations, enabling access to richer biological information. Experimental validation across diverse biological specimens of varying scales confirmed the broad applicability of MFPM and demonstrated its potential for comprehensive multiscale biological investigations. In U2OS cells, MFPM resolved global cellular topography, SR actin structures, and polarisation-resolved orientation mapping, thereby achieving multidimensional characterisation. For pathological samples, high-throughput screening of DPC imaging, combined with fluorescence intensity analysis and cell nucleus quantitative statistics, has enabled a quantitative auxiliary diagnostic method to distinguish cervicitis from cervical cancer. During the imaging of zebrafish larvae, heart rate metrics were quantitatively assessed via fluorescence and phase verification, whereas the migration of neutrophils was dynamically tracked, with further analysis of their morphological changes and migration speed. The paradigm of high-throughput DPC screening followed by targeted fluorescence observation is expected to become a prominent trend in future imaging applications. This integrated system and workflow offers a flexible, efficient, and information-rich solution for advanced biological and biomedical research, enabling multidimensional data acquisition within a single platform.
Although the current implementations have achieved high-quality fluorescence and phase reconstruction, future improvements will further enhance automation and scalability. For instance, combining deep learning with physical knowledge can yield ultrafast noise-robust image reconstruction51. More accurate physical modeling52 or 3D extensions53 can improve the phase retrieval in thick tissues. Meanwhile, virtual staining54,55 from phase images can reduce the reliance on labelling and phototoxicity56,57. Crucially, the capability of MFPM to rapidly screen large fields and validate targets at high resolution lays the foundation for intelligent event-triggered imaging, enabling real-time, selective capture of dynamic biological processes9,58. Its common-path design ensures compatibility with 3D volumetric imaging59. By combining GPU acceleration and systematic optimisation of the algorithm, the reconstruction speed is expected to be further improved in future work, thereby significantly enhancing the overall capabilities of the system. These features make the MFPM a promising and scalable solution for next-generation automated and intelligent bioimaging.
-
This work was supported by the National Natural Science Foundation of China (62025501 to P. X., 62335008 and 62405010 to M. L., 624B2009 to R. C.), Major Basic Research Project of the Natural Science Foundation of Shandong Province (ZR2024ZD27 to X. S. and P. X.), and the National Key R&D Program of China (2022YFC3401100 to P. X.).
Versatile biological imaging enabled by multimodal fluorescence-phase microscopy
- Light: Advanced Manufacturing , Article number: 42 (2026)
- Received: 22 September 2025
- Revised: 09 January 2026
- Accepted: 12 January 2026 Published online: 13 May 2026
doi: https://doi.org/10.37188/lam.2026.042
Abstract: High-resolution, high-throughput, and minimally invasive imaging is in increasing demand in modern biomedical research. However, conventional single-modality optical microscopy often fails to satisfy these requirements. In this paper, we present a highly integrated multimodal fluorescence-phase microscopy (MFPM) system. By leveraging illumination pattern encoding, a unified wide-field detection configuration, and an integrated computational algorithm, MFPM achieves five imaging modes: optical-sectioning structured illumination microscopy (OS-SIM), super-resolution structured illumination microscopy (SR-SIM), polarisation dipole analysis, fast differential phase contrast (fDPC), and quantitative differential phase contrast (qDPC) imaging. By incorporating dark channel prior-based background removal, MFPM achieves improved imaging depth, whereas the frame-reduction strategy enables a higher imaging speed. Consequently, only ten raw frames are required to reconstruct multidimensional information. This integrated platform enables co-registered multimodal imaging for diverse biomedical applications, including the subcellular visualisation of U2OS cells, quantitative auxiliary diagnosis of pathological tissue sections, and analysis of zebrafish heartbeats. With its compact design and multidimensional imaging capabilities, MFPM offers a unified solution for structural and functional imaging. Its scalability toward intelligent event-triggered imaging, and virtual staining integration makes it a promising platform for next-generation automated biomedical imaging.
Research Summary
Biomedical imaging: Multimodal microscopy enables information-rich imaging
Capturing biological processes across large fields of view while maintaining high resolution and low photodamage remains a major challenge for single-modality microscopy. Peng Xi, Meiqi Li and colleagues at Peking University report a multimodal fluorescence-phase microscopy (MFPM) platform that integrates fluorescence and phase imaging within a single compact system. By combining structured illumination microscopy (SIM) with differential phase contrast (DPC) in a unified wide-field detection path, the microscopy reconstructs five imaging modes from only ten raw frames, enabling fast and information-rich acquisition. The authors demonstrate the system’s versatility by resolving cellular structures, performing quantitative analysis to distinguish malignant cervical tissue, and monitoring heart dynamics and immune-cell migration in live zebrafish. This scalable design provides a flexible solution for high-content biological imaging and future automated microscopy.
Rights and permissions
Open Access This article is licensed under a Creative Commons Attribution 4.0 International License, which permits use, sharing, adaptation, distribution and reproduction in any medium or format, as long as you give appropriate credit to the original author(s) and the source, provide a link to the Creative Commons license, and indicate if changes were made. The images or other third party material in this article are included in the article′s Creative Commons license, unless indicated otherwise in a credit line to the material. If material is not included in the article′s Creative Commons license and your intended use is not permitted by statutory regulation or exceeds the permitted use, you will need to obtain permission directly from the copyright holder. To view a copy of this license, visit http://creativecommons.org/licenses/by/4.0/.

 DownLoad: