


-
Precise visualisation and quantification of the intrinsic physical features of diverse analytes with a high sensitivity are crucial in chemistry, life sciences, and physics to elucidate the underlying mechanisms, as well as in advanced manufacturing technologies to monitor and enhance the production quality. Over the past decades, surface plasmon resonance microscopy (SPRM) has emerged as a powerful imaging platform for analyte detection and label-free characterisation1. SPRM serves as a spatially resolved evanescent sensing technique based on surface plasmon resonance (SPR), which refers to the collective oscillations of free electrons at a metal-dielectric interface induced by electromagnetic wave coupling2. SPR excitation converts incident photons into the generated propagating surface plasmon polariton (SPP)3, causing large complex reflectance changes. The signal shift is very sensitive to changes in refractive index (RI) or thickness near the metal/dielectric interface (the detailed mathematical derivation of the SPR sensing principle is provided in Supplementary Information 1). This enables SPRM with an excellent capability for label-free and high-sensitivity detection of chemical and biological reactions at the surface, which are always accompanied by variations in RI or thickness. Since the introduction of SPRM in 19874, this type of evanescent sensing and imaging platform has been extensively applied in single-molecular5/single-cell analysis6, biological sensing7,8, dynamic electrochemical reaction detection9, and photocatalytic activity monitoring10. SPRM can be constructed with either a prism coupler11 or an objective with a high numerical aperture12. Objective-coupled SPRM achieves a superior lateral resolution and aberration-free imaging, outperforming prism-coupled configurations for nanoscale target characterisation. There have been numerous reports on four SPRM schemes involving the measurement of intensity13 or phase14 variations and resonance shifts in angle15 or wavelength16. The intensity detection approach is less sensitive, whereas the angle and wavelength interrogation methods are typically costly and necessitate complex data processing. Phase detection methods deliver a superior sensitivity with respect to the other three methods due to drastic phase responses under SPR17. SPR phase interrogation theoretically enables RI measurement with an ultrahigh sensitivity of approximately 10−8 RIU. However, such values were predicted based on fundamental phase measurement limits and have not been experimentally realised18–20.
In order to exploit the complementary nature of intensity and phase detection mechanisms, surface plasmon resonance holographic microscopy (SPRHM) was developed to acquire intensity and phase images simultaneously by measuring the complex amplitude of reflected light using digital holographic microscopy (DHM)21. Compared with intensity-only SPRM, SPRHM offers a better throughput capacity by providing a quantitative access to both phase and intensity22. This enables SPRHM to extract quantitative properties of analytes with higher measurement sensitivity and accuracy and even demodulate two or more physical characteristics simultaneously23,24. Additionally, the numerical refocusing capability of DHM allows SPRHM to increase the data utility significantly and even enable volumetric reconstruction25.
Early SPRHM setups employed two-arm interferometers14,26, suffering from measurement instability from thermal/mechanical drift in the separated object and reference arms. Zhang et al. subsequently discussed the common-path off-axis DHM configuration that intrinsically compensates environmental disturbances with an enhanced stability27. Based on this methodology, a compact SPRHM with a common-path interference configuration was proposed by merely incorporating a Wollaston prism into the fundamental SPRM structure28. Benefiting from the noninvasiveness, label-free process, wide field, high throughput, and high sensitivity, common-path objective-coupled SPRHM has been employed to characterise the thickness of two-dimensional (2D) materials28, measure the cell-substrate adhesion gap29, investigate the response of biological specimens to optical force stimuli30, demodulate the cytoplasm RI and cell-substrate distance simultaneously23, and dynamically monitor the evolution of cellular states under different external stimulations31. Nevertheless, existing SPRHM techniques are still limited in addressing the growing need for a higher measurement sensitivity.
In this study, we propose a Ag–Au bilayer SPR excitation configuration with an optimised layer thicknesses to achieve dynamic RI monitoring with a measurement resolution of 2.58 × 10⁻⁷ RIU during ethanol-water mixture evaporation, significantly surpassing the experimental sensitivity (10−4 RIU20) of conventional SPR sensing techniques. Furthermore, we introduce an angle-scanning thickness demodulation workflow, enabling an atomic-scale thickness profiling with a resolution of 0.56 nm on a graphene terrace specimen, achieving an accuracy comparable to that of atomic force microscopy (AFM). Moreover, current SPRHM implementations suffer from the following limitations. (1) The use of independent mounts for each optical element makes the setup susceptible to element-specific drift and vibration, which inherently compromises the measurement accuracy and critically limits the performance in ultrasensitive applications. (2) High cleanliness and vibration isolation are demanded, which are rarely achievable outside specialised laboratories. To further improve the measurement stability and system simplicity, we developed a SPR holographic microscope to offer an easy-to-implement and cost-effective solution that significantly enhances the adaptability of SPRHM. As the first product-ready SPR holographic microscope bridging laboratory innovation and industrial applications, the prototype is expected to have a key role in biological research, nanomaterial inspection, and electrochemical studies.
-
To further advance the RI measurement sensitivity, we implemented an optimised Ag–Au bilayer SPR excitation configuration in our microscope platform. The thicknesses of the Ag and Au layers were computationally optimised with the custom algorithm. The optimised Ag–Au bilayer SPR excitation configuration could simultaneously achieve a high measurement sensitivity and long-term deployment stability, which neither the Ag nor the Au monolayer can provide alone. This strategy leads to an ultrahigh RI measurement resolution of 10−7 RIU. To the best of our knowledge, this is the first demonstration of the theoretical limit in a practical SPR sensor. Furthermore, the flat bilayer configuration eliminates nanofabrication barriers without compromising the performance.
We construct a four-layer SPR excitation configuration consisting of coverslip–Ag-layer–Au-layer–dielectric sample, as shown in Fig. 1a. The Ag layer induces an enhanced RI measurement sensitivity due to the superior SPR excitation efficiency, while the overlying Au layer prevents Ag film oxidation and ensures chemical stability and biocompatibility. With known dielectric constants εp, εAg, and εAu (denotes the dielectric constant of the coverslip, Ag-layer, and Au-layer, respectively) and the initial sample RI ns as the baseline for calculation, we optimise the layer thicknesses of Ag and Au, dAg and dAu, to provide an ultrahigh RI measurement sensitivity. The layer thickness optimisation algorithm proceeds as follows.
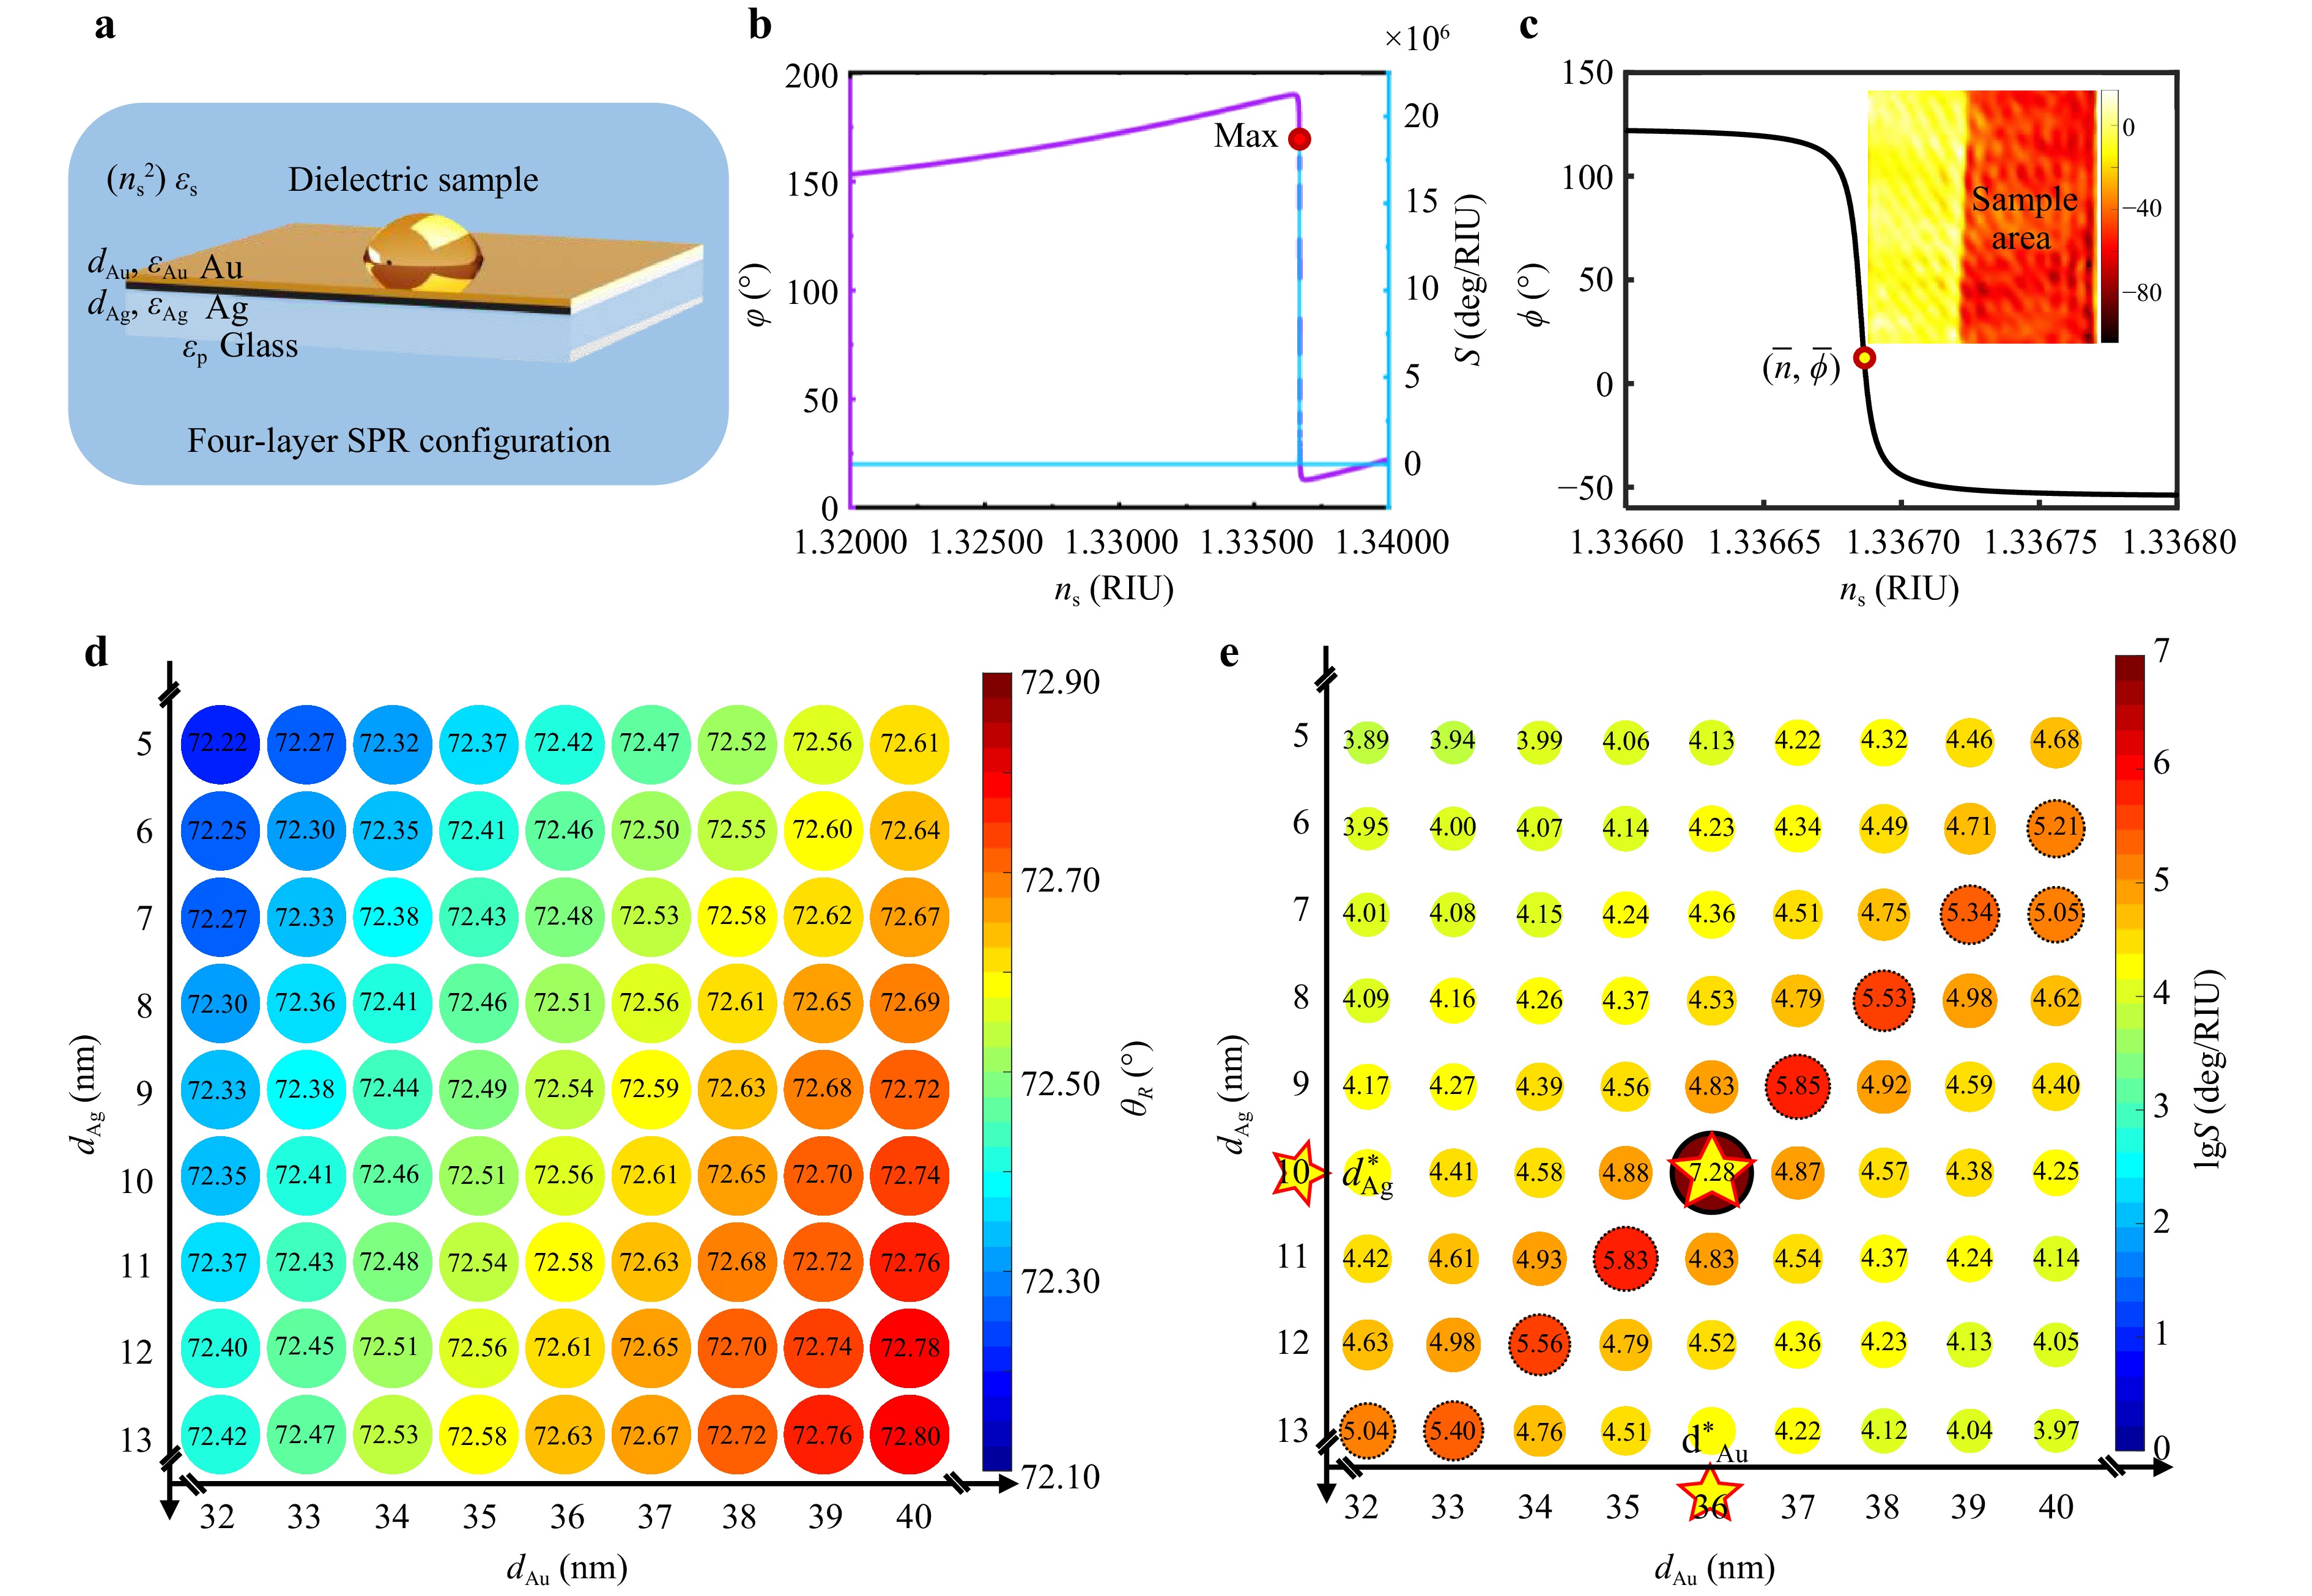
Fig. 1 Ag–Au bilayer SPR excitation configuration and layer thickness optimisation algorithm. a Schematic of the four-layer SPR excitation configuration. b Definition of RI measurement sensitivity S: Max|∂φ/∂ns|. The purple line shows the reflection phase shift (φ) vs sample RI (ns), while the blue indicates the first-order derivative |∂φ/∂ns|. c RI demodulation curve of reflection phase shift difference ϕ vs ns. The inset shows a representative reconstructed phase image. d, e SPR resonance angles and S (logarithmic scale) for different Ag–Au layer thicknesses. The optimal layer thicknesses of Ag and Au correspond to the maximum S.
Step 1: The curve of reflection phase shift φ versus sample RI ns under SPR conditions is calculated using the Fresnel formula. The RI measurement sensitivity S is defined as the maximum value of |∂φ/∂ns|, derived from the first derivative of this curve (Fig. 1b).
Step 2: The thicknesses of Ag and Au layers are scanned from 1 to 50 nm with increments of 1 nm, and the angular-dependent reflectance spectra are calculated using the Fresnel formula. The resonance angle θR at minimum reflectance for each thickness combination is then extracted (Fig. 1d).
Step 3: S is calculated for each thickness combination while the corresponding θR is set as the incidence angle. The optimal layer thicknesses d*Ag and d*Au corresponding to maximum S are determined from the sensitivity map (Fig. 1e). θR for this optimal bilayer is denoted as θ*R.
Step 4: With optimised parameters d*Ag, d*Au, and θ*R, φ versus ns is calculated using the Fresnel formula for two cases, where the dielectric sample to be measured and air are treated as the fourth layer of the SPR excitation configuration. The RI demodulation curve is then defined as the reflection phase shift difference ϕ (φsample–φair) versus ns (Fig. 1c).
The above optimisation procedure is conducted through numerical simulations. After identification of the optimal layer thicknesses, the corresponding Ag–Au bilayer SPR excitation configuration is subsequently fabricated.
We validated the performance of the designed SPR excitation configuration by monitoring micro-RI changes of evaporating ethanol-water mixtures with various mass concentrations. For the 8.0 wt% mixture (initial RI = 1.3367 at 632.8 nm, interpolated from RI data for aqueous solutions in a chemical handbook32), the thickness optimisation algorithm yielded a Ag–Au bilayer with thicknesses of 10 and 36 nm, respectively. The optimised metal bilayer was deposited on top of a cleaned coverslip via electron-beam evaporation and integrated into the SPR holographic microscope. This optimised Ag–Au bilayer SPR excitation configuration remains effective for dielectric media with comparable RIs, e.g. mixtures with similar mass concentrations. To validate this robustness, we selected two analogous ethanol-water mixtures with similar mass concentrations (7.5 and 8.4 wt%) for a comparative verification. Using the double-exposure method, we measured time-varying ϕ during the volatilisation of mixtures. The ϕ data underwent an additional correction operation (Supplementary Information 2) and were converted to RI values (at 632.8 nm) using the demodulation curve, as shown in Fig. 2.
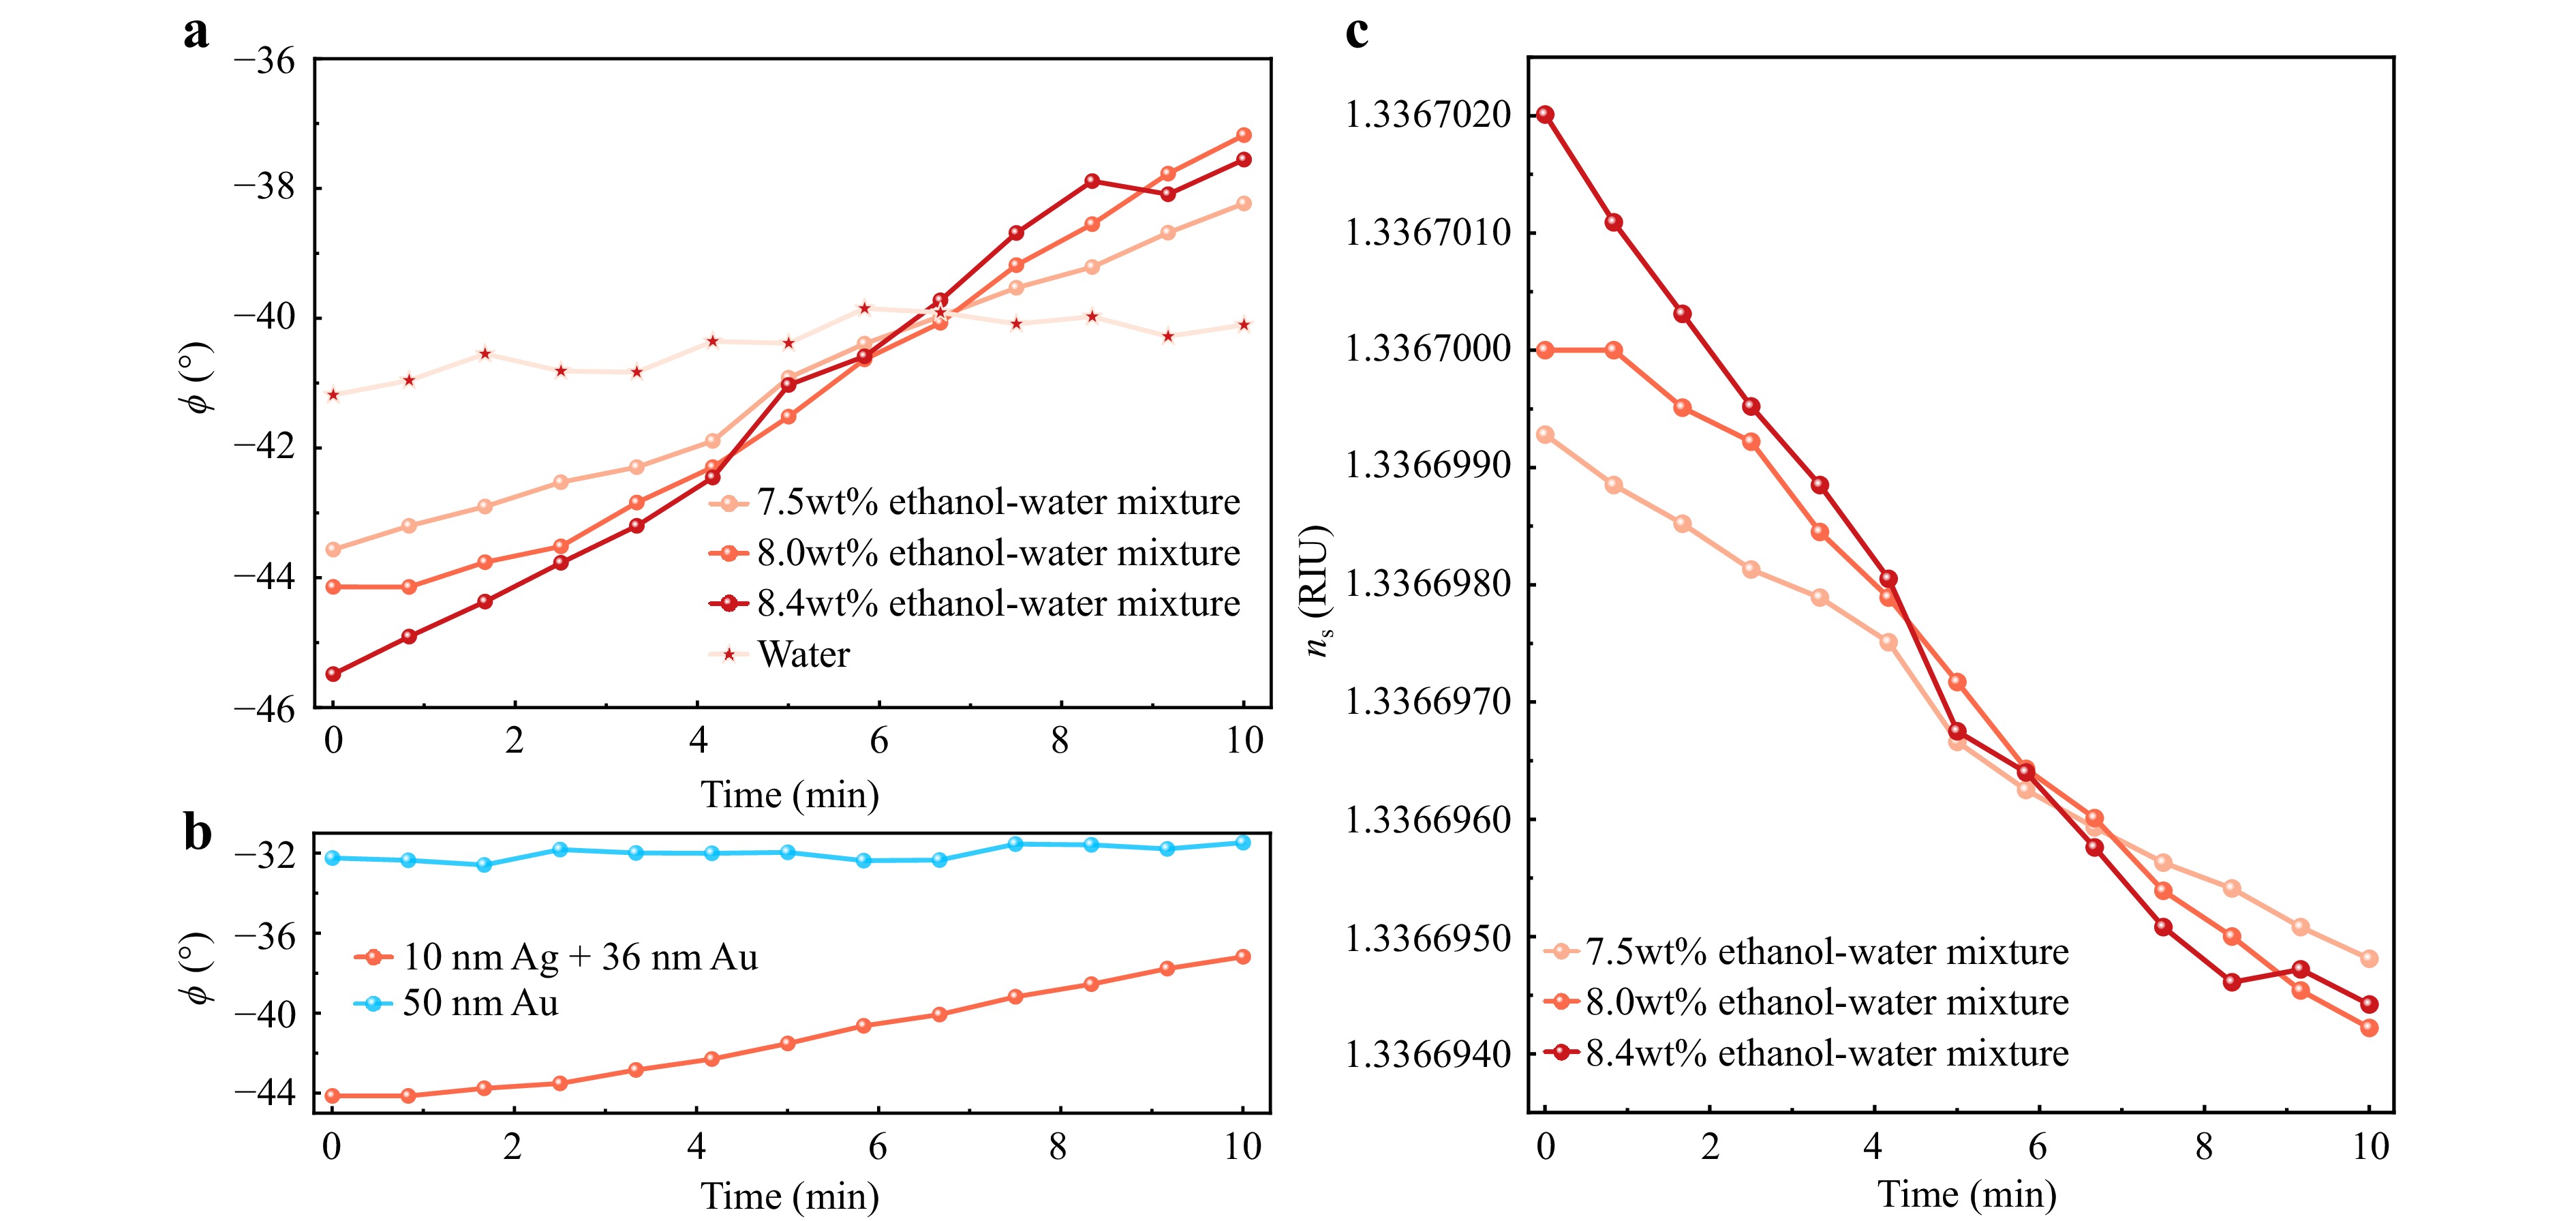
Fig. 2 Measurement results of ethanol-water mixtures obtained using the microscope. a Reflection phase shift difference ϕ variation with time for ethanol-water mixtures with mass concentrations of 7.5, 8.0, and 8.4 wt%, and pure water. b Comparison of ϕ variations during the volatilisation of the 8.0 wt% mixture between the standard 50 nm Au and optimised Ag (10 nm)–Au (36 nm) bilayer SPR excitation configuration. The optimised Ag–Au bilayer exhibits a nine-fold enhancement in the variation in ϕ compared to that obtained by using the standard Au layer. c Demodulated small RI (at 632.8 nm) changes over time for ethanol-water mixtures with mass concentrations of 7.5, 8.0, and 8.4 wt%.
As shown in Fig. 2a, ϕ exhibited a significant monotonic increase over time, contrasting with the pure water's stable fluctuations around a baseline value. This divergence stemmed from the ethanol volatilisation-driven RI reduction, which induced the increase in ϕ. Conversely, the pure water maintained a constant RI, resulting in ϕ stability. To demonstrate the ultrahigh sensitivity of our Ag–Au bilayer SPR excitation configuration, we compared its ϕ dynamics during the 8.0 wt% mixture volatilisation against that obtained by using a standard single Au layer SPR excitation configuration (Fig. 2b). The optimised metal bilayer exhibited Δϕ = 6.96° versus 0.77° for the single Au layer, achieving a nine-fold enhancement. Fig. 2c quantifies the time-resolved RI reduction in ethanol-water mixtures with varying mass concentrations. All concentrations exhibited a monotonic RI decrease due to the ethanol volatilisation. For validation, a secondary concentration series (3.5, 4.0, 4.6 wt%) was measured with 4.0 wt% as the baseline (Supplementary Information 3); the results revealed a similar trend. Notably, sporadic RI increases (7.7% of data points) correlated with phase measurement fluctuations (σ = 0.59°, Supplementary Information 4), likely induced by camera readout perturbations.
Table 1 summarises key measurement metrics derived from our experiments. The results indicate that higher mass concentrations of the ethanol-water mixtures lead to larger reflection phase shift difference changes Δϕ and larger net RI changes Δns over identical durations, correlating with accelerated RI reduction rates. By computing the differential RI between adjacent timepoints and averaging across all measurements, we achieve a consistent RI measurement resolution of 10−7 RIU across all six trials. The optimal resolution reaches 2.58 × 10⁻⁷ RIU. The RI measurement sensitivity S = Δϕ/Δns was calculated by the measured Δϕ–Δns pairs. For the 8.0 wt% mixture, the theoretical and experimental S values were 1.90 × 10⁷ deg/RIU and 1.24 × 10⁶ deg/RIU, respectively. This discrepancy stems from the limited dynamic range (8 bit) of the charge-coupled device (CCD), constraining the phase measurements and capping S of the current platform at ~106 deg/RIU. For the 4.0 wt% mixture, the theoretical S was 2.32 × 10⁶ deg/RIU, which was within the platform limits and consistent with the experimental value of 1.71 × 10⁶ deg/RIU. The conventional 50 nm Au layer achieved S of only ~104 deg/RIU. The determination of the optimal thicknesses of the Ag–Au bilayer via our computational optimisation algorithm requires a priori knowledge of the dielectric medium's initial RI (or its approximate range). This constraint establishes our method to be ideal for ultrahigh-sensitivity RI monitoring in dynamic processes, particularly those involving continuous concentration changes. Nevertheless, a fundamental limitation arises if the RI change exceeds the inherently constrained dynamic range of the proposed SPR excitation configuration, beyond which the accurate RI retrieval fails. Notably, the RI dynamic range of the proposed SPR excitation configuration is limited to approximately 10−6 RIU, as indicated by Δns, which is significantly narrower than that achievable with conventional angular or wavelength interrogation schemes (>0.1 RIU)17. This restriction originates from the fundamental trade-off between the realisation of an ultrahigh sensitivity and maintenance of a wide dynamic range in RI sensing systems.
SPR excitation configuration Mass concentrations (wt%) Δϕ (deg) Ratio of Δϕ Δns (RIU) Resolution (RIU) S (deg/RIU) 10 nm Ag + 36 nm Au 7.5 5.33 / 4.47 × 10⁻⁶ 3.73 × 10⁻⁷ 1.22 × 10⁶ 8.0 6.96 9.0 5.78 × 10⁻⁶ 4.82 × 10⁻⁷ Theory 1.90 × 10⁷ Experiment 1.24 × 10⁶ 8.4 7.93 / 7.59 × 10⁻⁶ 6.33 × 10⁻⁷ 1.20 × 10⁶ 0.0 (Water) 1.08 / / / / 48 nm Ag + 3 nm Au 3.5 5.52 / 3.25 × 10⁻⁶ 2.58 × 10⁻⁷ 1.71 × 10⁶ 4.0 6.89 2.6 4.04 × 10⁻⁶ 3.37 × 10⁻⁷ Theory 2.32 × 10⁷ Experiment 1.71 × 10⁶ 4.6 9.90 / 5.81 × 10⁻⁶ 4.84 × 10⁻⁷ 1.62 × 10⁶ 0.0 (Water) 0.50 / / / / 50 nm Au 4.0 2.61 / / / 2.23 × 10⁴ 8.0 0.77 / / / 2.15 × 10⁴ Table 1. Quantitative comparison of measurement metrics for ethanol–water mixtures with different mass concentrations.
Fig. 3 quantifies the evaporation kinetics of the ethanol-water mixtures. We establish a linear relationship between the RI reduction rate dns/dt (RIU/min) and ethanol mass concentration M (wt%): dns/dt = aM + b. The linear regression yields coefficients a' = 3.43 × 10⁻⁷ and a'' = 2.35 × 10⁻⁷ for the two groups of mixtures, showing no significant difference. This consistency arises because both groups share identical solute-solvent interactions (ethanol-water), exhibiting equivalent evaporation kinetics under the same experimental conditions.
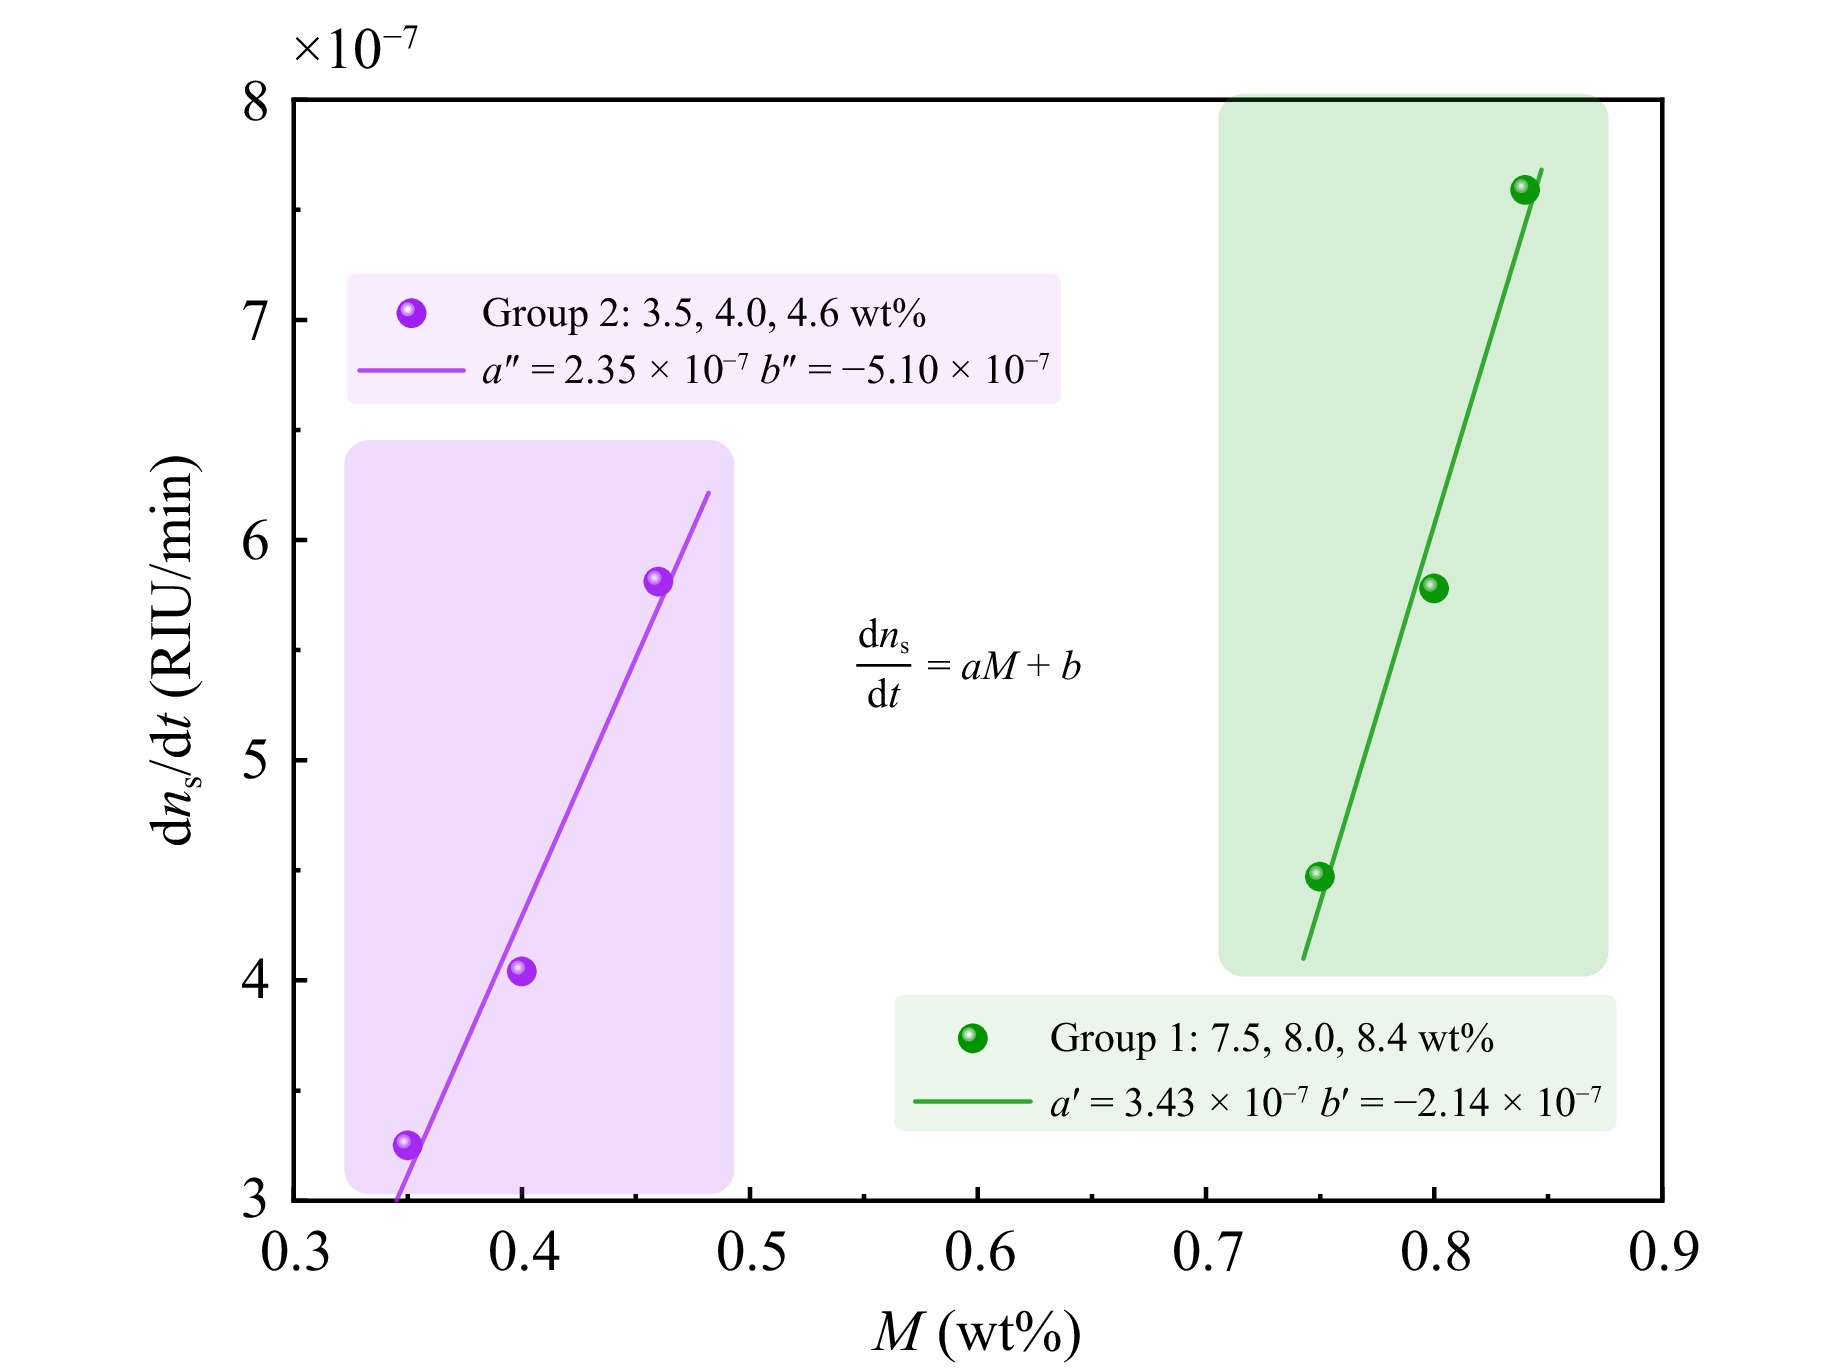
Fig. 3 Evaporation kinetics modelling of ethanol-water mixtures.
-
To circumvent the technical challenge of a low measurement throughput and establish a novel paradigm for 2D material metrology, we deploy an angle-scanning thickness demodulation workflow on our SPR holographic microscope. The approach enables a rapid, wide-field, and contact-free thickness profiling of 2D materials with a high sensitivity and subnanometre accuracy of 0.56 nm, demonstrated on a graphene terrace and cross-validated with AFM. In addition, it offers an improved measurement throughput without the need for prior empirical calibration.
First, we model a five-layer SPR excitation configuration of glass–Cr-film–Au-layer–2D-material–dielectric (Fig. 4a). According to the Fresnel formula, the reflection phase shift φ becomes exclusively dependent on the 2D material thickness d4 when the wavelength and incidence angle of the illumination light beam, dielectric constants, and thicknesses of the layers in the SPR excitation configuration are fixed. As SPR generates an extreme phase sensitivity to small variations in the specimen's physical parameters, incidence angle scanning is necessary to identify the resonance angle θSPR for different areas of the inhomogeneous specimen. The angular interrogation is accomplished by adjusting the lateral displacement of the motorised vertical translation stage of the microscope, and a θ-dependent hologram sequence is recorded simultaneously. By extracting the intensity variation of a fixed pixel across the image sequence, the reflectivity is obtained, and θSPR is identified at minimum reflectivity (Fig. 4b). Once θSPR is determined, it is set as an incidence angle. The Fresnel formula is employed to calculate φair and φwater versus d4 for air and water as the fifth dielectric layer, respectively. The thickness demodulation curve is then defined as the reflection phase shift difference ϕ (φair–φwater) against d4, as shown in Fig. 4c. Furthermore, pixelwise thickness demodulation is performed on the reconstructed phase distribution derived from the hologram recorded precisely at θSPR. A statistical analysis of the thickness map yields a histogram that undergoes Gaussian fitting, thus enabling precise determination of the geometric thickness of 2D materials with nanoscale accuracy.
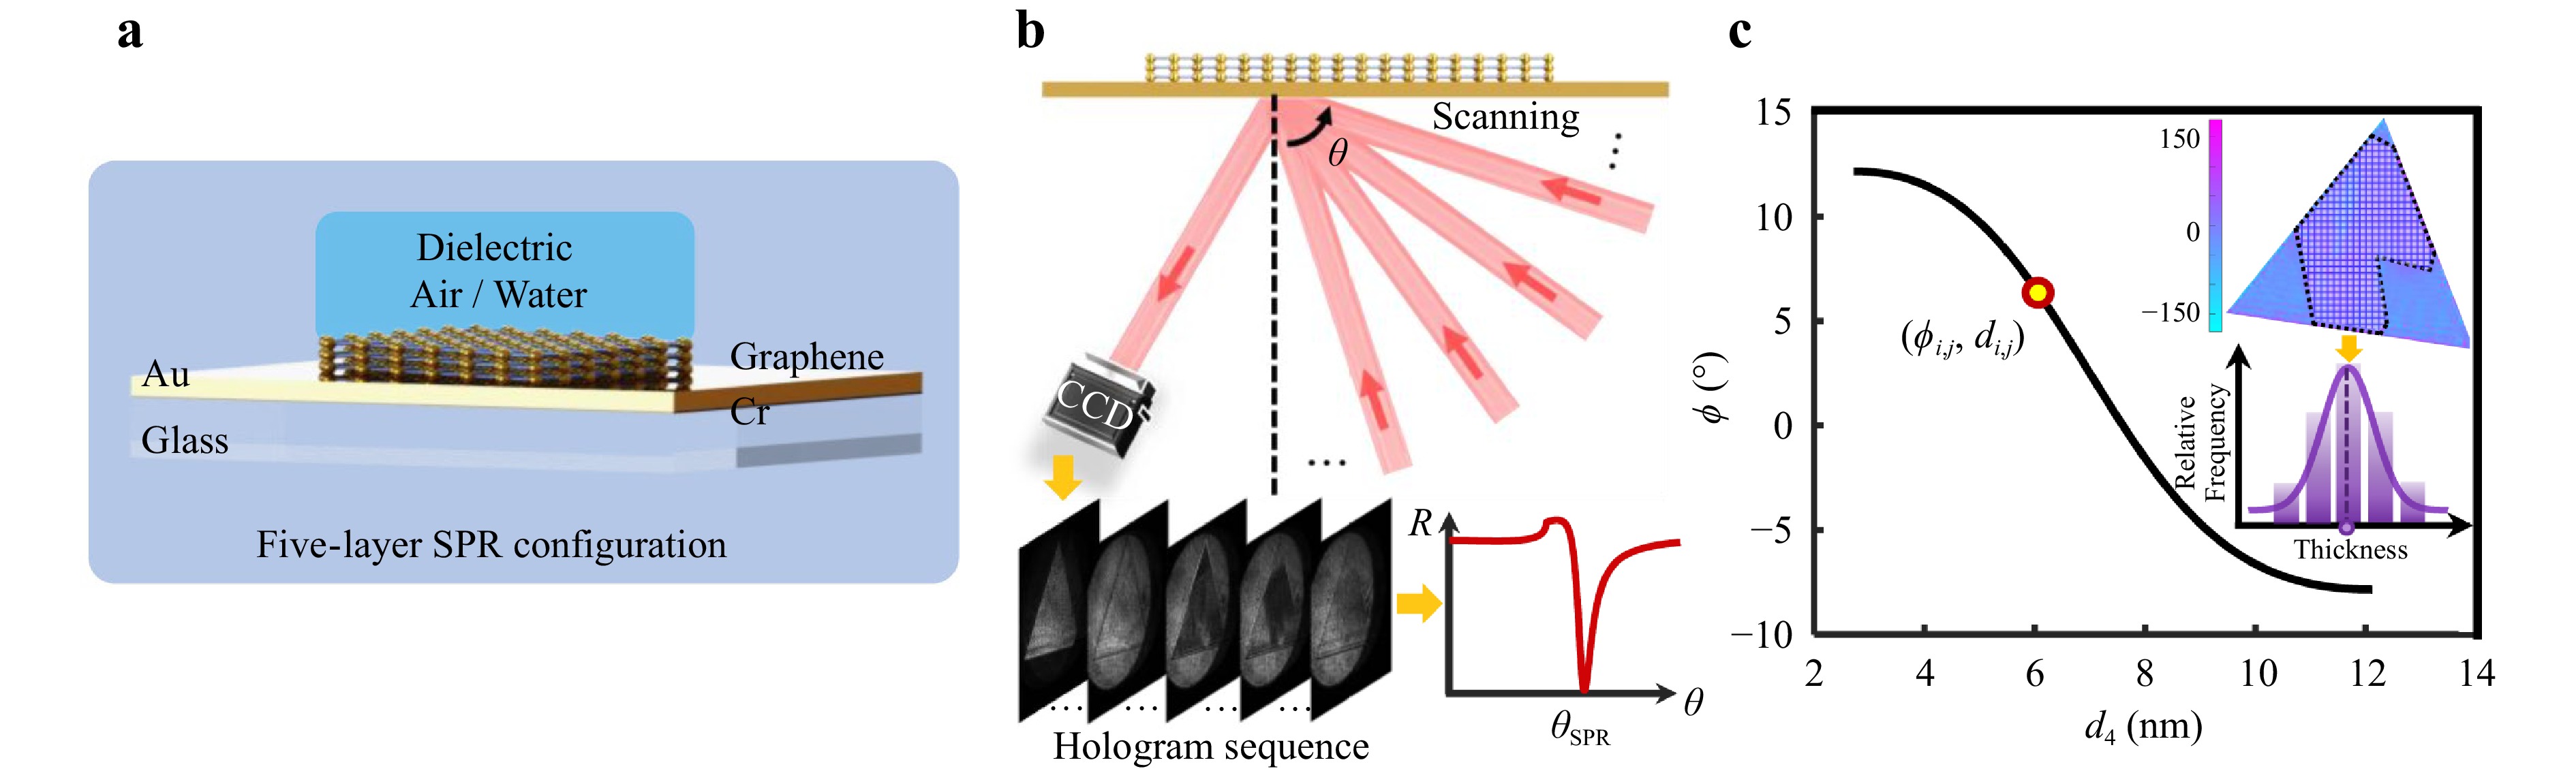
Fig. 4 Angle-scanning thickness demodulation workflow. a Construction of a five-layer SPR excitation configuration: glass–Cr–Au–graphene–dielectric (air or water). b Recording of hologram sequences followed by angular interrogation and identification of the resonance angle at the minimum reflectivity. c Calculation of the thickness demodulation curve (reflection phase shift difference ϕ vs 2D material thickness d4). The inset shows a reconstructed SPR phase image of graphene. The thickness is determined via pixelwise demodulation and Gaussian fitting.
To evaluate the accuracy of the proposed workflow for thickness profiling of 2D materials, we performed tests on a graphene terrace specimen fabricated via mechanical exfoliation. Prior to the transfer, a 1 nm chromium adhesion layer and 50 nm gold film were deposited onto a cleaned glass coverslip by electron-beam evaporation. The bright-field microscope image in Fig. 5a shows the graphene specimen comprising three distinct step areas of varying thickness. Cross validation was first conducted using a commercial AFM, which characterised the same areas and established reference thicknesses of 5.70, 6.28, and 7.92 nm (Fig. 5b). In the SPR excitation configuration, the model parameters were set as εglass = 2.2955, εCr = −1.1305 + 20.818i, εAu = −11.740 + 1.2611i, and εdielectric = 1.0/1.7734 (air or water), based on the values reported by Polyanskiy33. The dielectric constant of graphene was set to εgraphene = 7.6805 + 6.8922i, according to Bruna and Borini34. The illumination wavelength was fixed at 632.8 nm. The microscope's motorised incidence angle scanning mode was employed to determine θSPR for the three step areas. The measurement results were 45.45°, 45.73°, and 46.58° for the areas of 5.70, 6.28, and 7.92 nm, respectively. Subsequent calculations of the thickness demodulation curves based on these values, combined with pixelwise demodulation and Gaussian fitting of the measured phase distributions, yielded thickness measurement values of 5.44, 6.00, and 7.62 nm (Fig. 5c). These results show an excellent agreement with the AFM results, with absolute errors below 0.30 nm. This difference could be attributed to the fabrication quality of the metallic layers and roughness of the substrate. To further evaluate the thickness profiling resolution, step-height differences between adjacent areas were compared. AFM measurement results indicated differences of 0.58 nm (between areas I and II) and 1.64 nm (between areas II and III), while our method resolved these to be 0.56 and 1.62 nm, respectively, yielding absolute errors of only 0.02 nm. These results verify the feasibility of the proposed demodulation workflow and confirm its subnanometre accuracy in 2D material thickness profiling with a resolution of 0.56 nm, establishing the SPR holographic microscope as a viable alternative tool for nanoscale 2D material metrology. Notably, the proposed method is inherently suited for investigation of thin-film properties rather than thick samples, owing to the limited penetration depth of SPP (200 to 450 nm in the dielectric side in our SPR configuration). In addition, the demodulation workflow requires scanning of the incidence angle to determine θSPR, a process that typically lasts several seconds. Consequently, the method is not intended for applications involving rapid thickness variations, such as real-time monitoring of the in-situ growth of 2D materials.
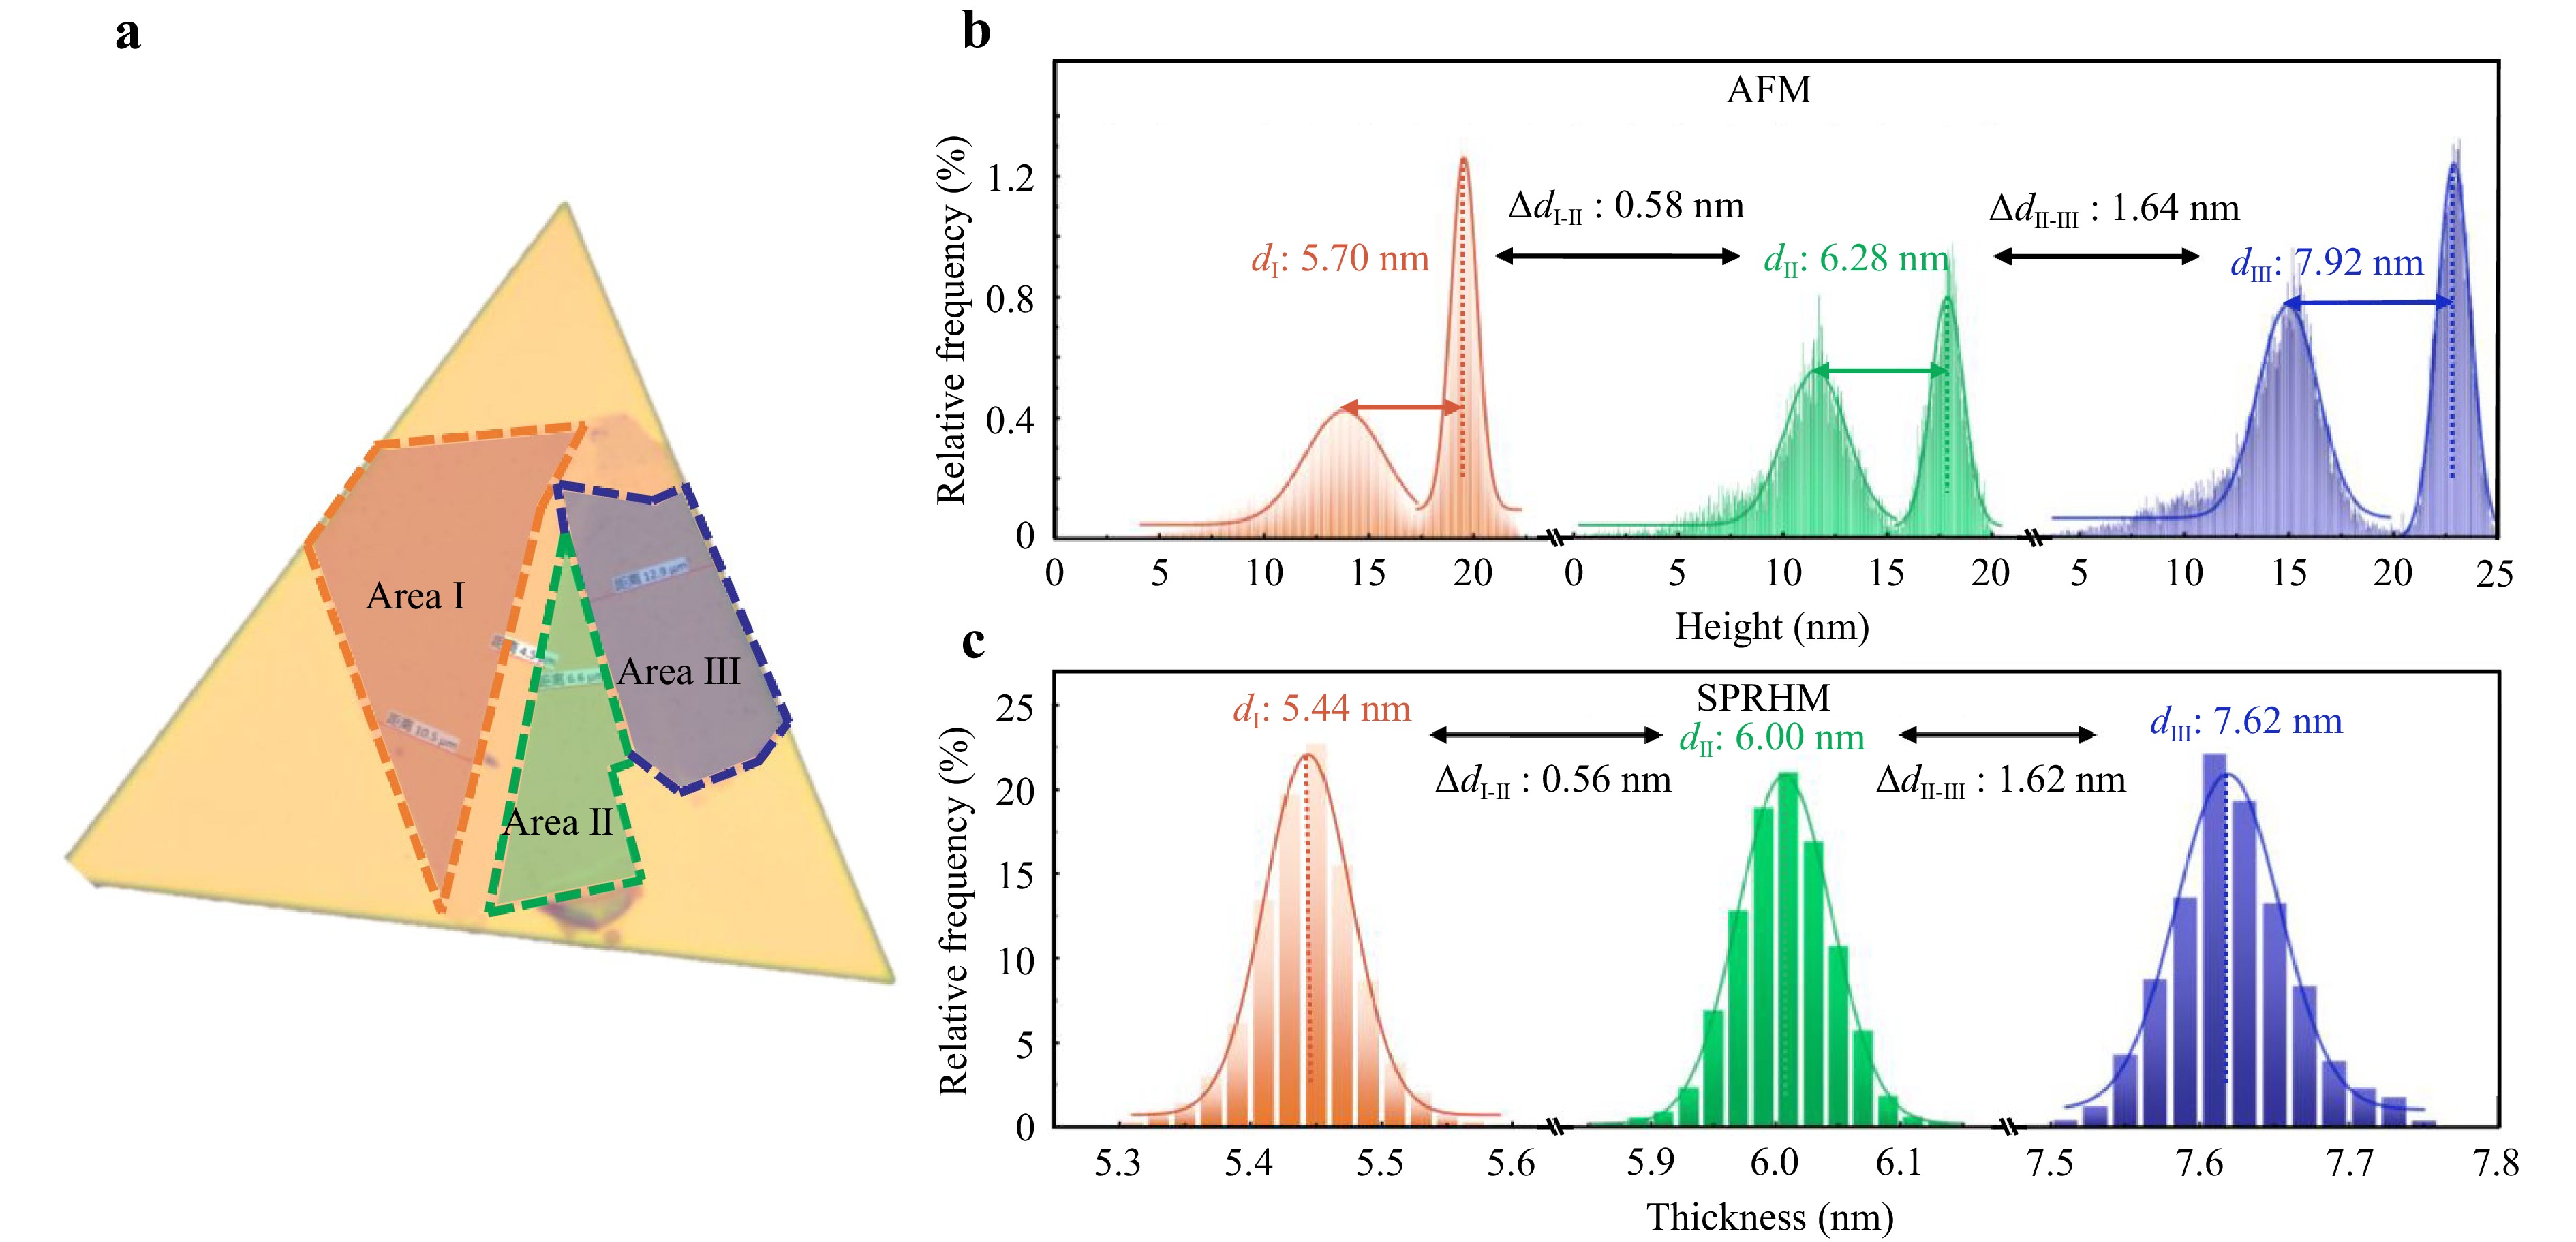
Fig. 5 Geometric thickness profiling of the graphene terrace. a Bright-field microscope image of the graphene specimen on the Au substrate. Different colours indicate areas of varying thickness. b Geometric thickness histogram in three steps obtained from AFM measurements with Gaussian fitting results. The AFM thickness quantification via height difference generates bimodal histograms, where peak separations directly yield the graphene–substrate height offset. c Geometric thickness histogram in three steps obtained from measurements by the SPR holographic microscope with Gaussian fitting results.
-
The optical structure of the common-path objective-coupled SPR holographic microscope is shown in Fig. 6a28. A linearly polarised laser beam with a wavelength of 632.8 nm is coupled into an optical fibre. The output beam from the fibre is expanded and then collimated as a plane wave using a negative lens (NL) followed by a collimating lens (CL). The collimated laser beam subsequently passes through a focusing lens (FL), polariser 1 (P1), and plate beamsplitter (BS), converging onto the back focal plane of a microobjective (MO). The MO outputs a plane wave, providing a wide-field illumination for the SPR excitation configuration. The light beam reflected from the metal interface is collected by the same MO. The reflected beam traverses the BS and passes through a tube lens (TL), Wollaston prism (WP), and polariser 2 (P2) in turn to generate off-axis holograms. Finally, the resulting hologram is recorded by a CCD camera (see details in Supplementary Information 5). P1 is oriented along the 45° direction to modulate the polarisation state of the incident light beam. By longitudinally moving the fibre, NL, CL, FL, and P1 assembly as a single unit via a motorised translation stage in the direction indicated by the arrow in Fig. 6a, a lateral position offset is introduced between the beam centre and optical axis of the MO. Consequently, the light beam emerging from the MO impinges on the metal–dielectric interface at an oblique angle.
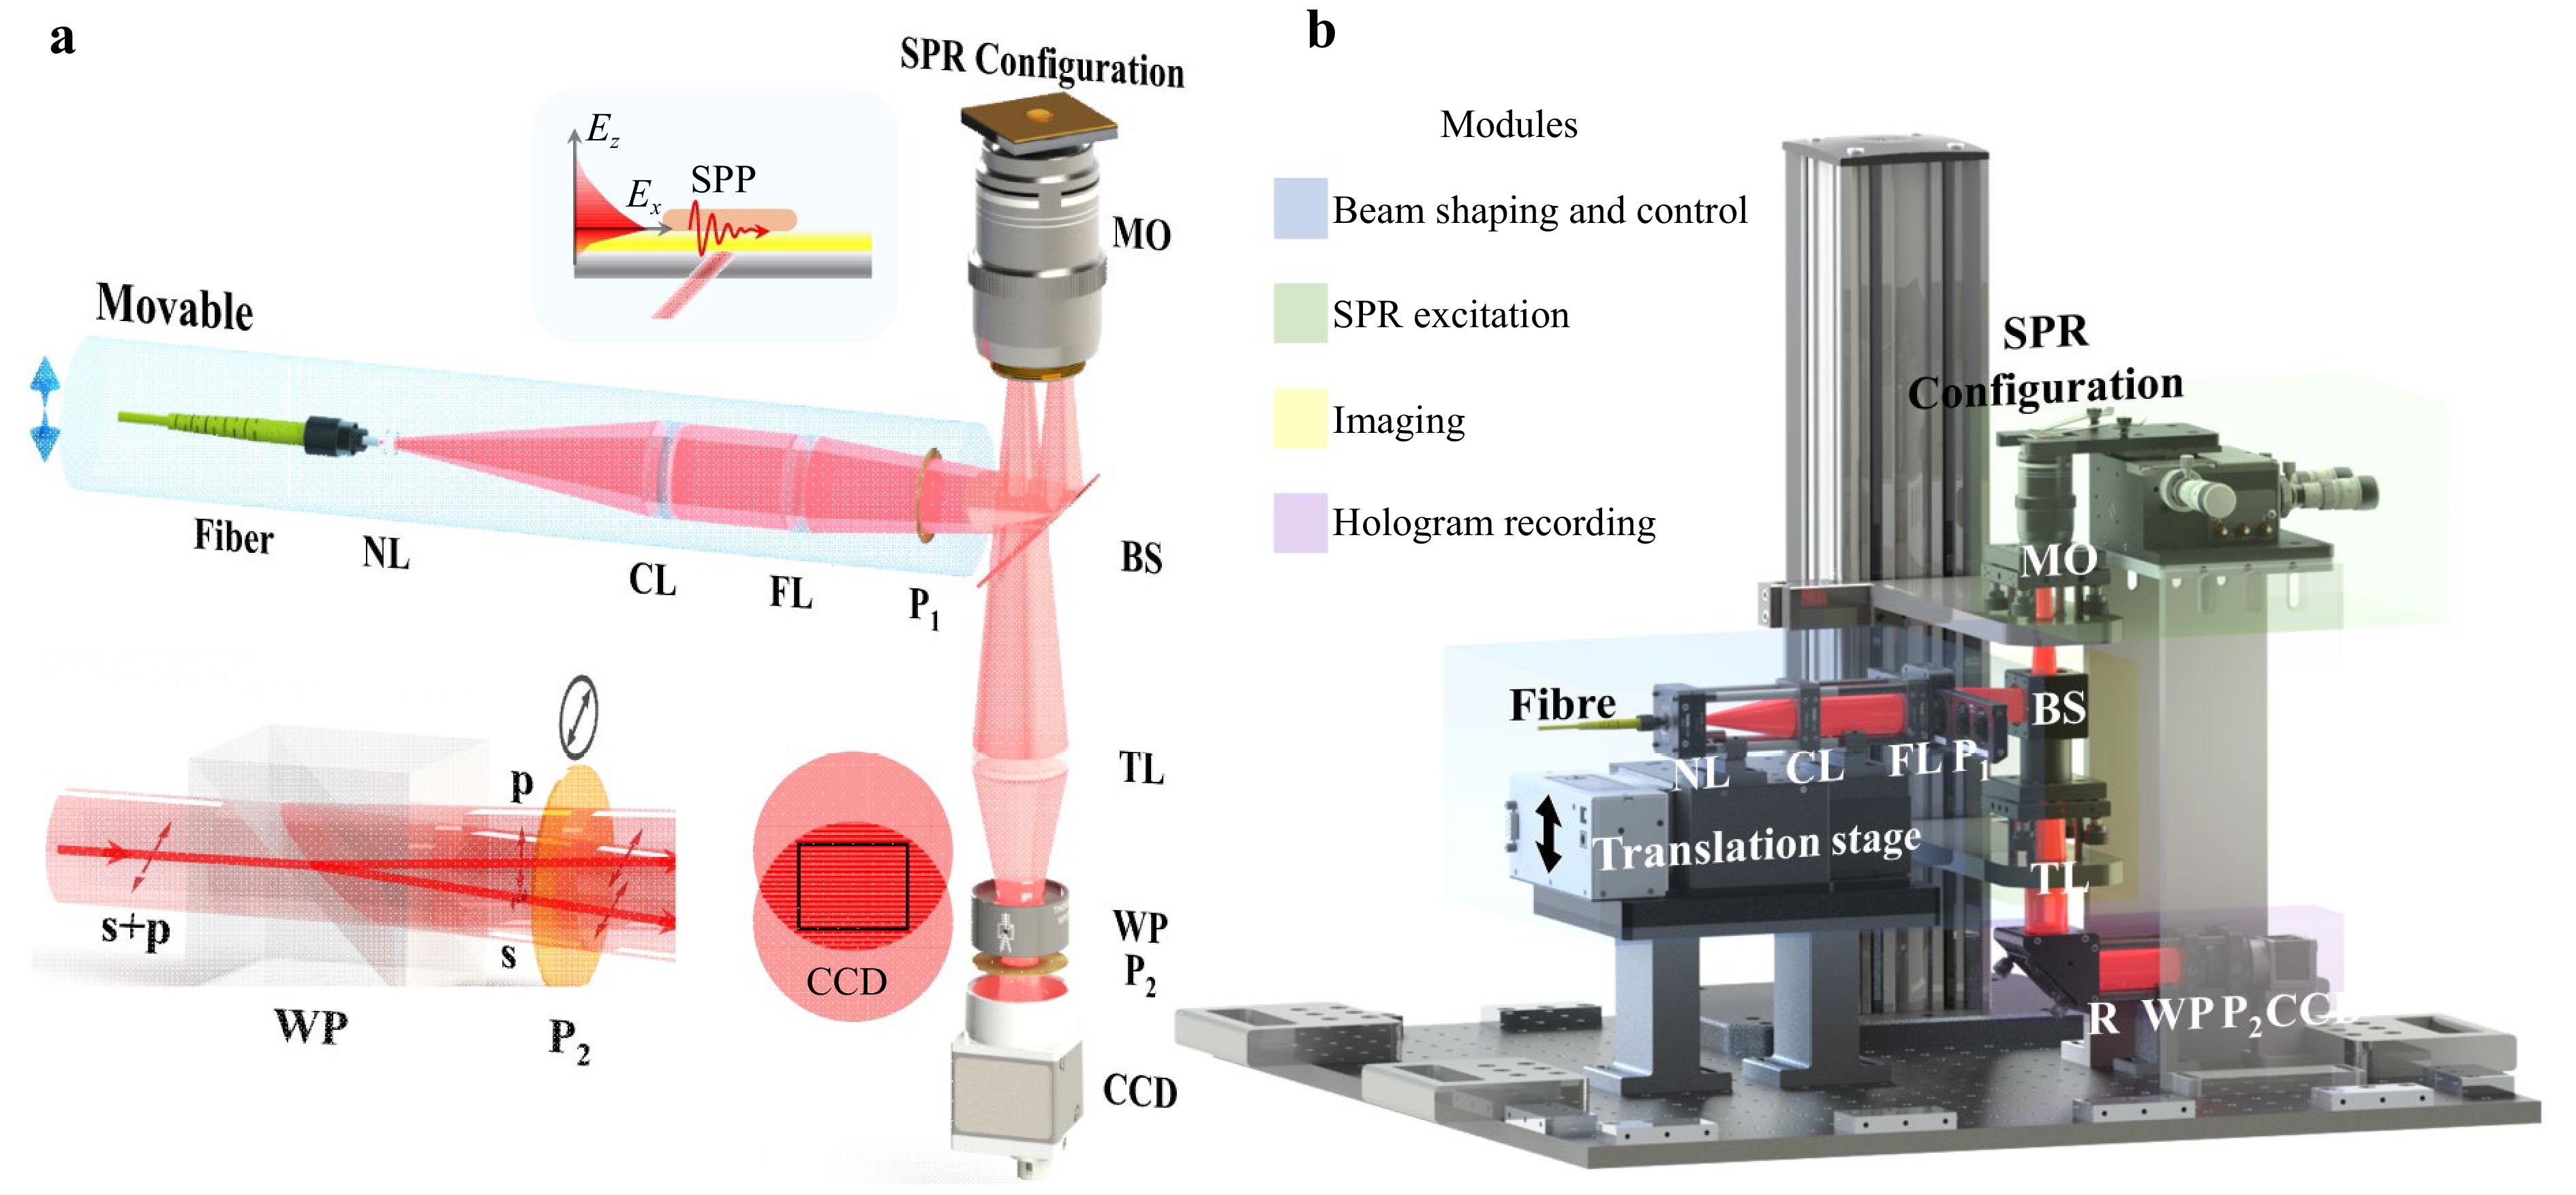
Fig. 6 Structure of the common-path objective-coupled SPR holographic microscope. a Schematic of the optical structure. The top inset schematically depicts the SPP excitation and corresponding distribution of the evanescent electric field. The bottom inset describes the working principle of the hologram recording module. b Opto-mechanical structure design with four modules.
The opto-mechanical design, depicted in Fig. 6b, is modularised into four functional modules: beam shaping and control, SPR excitation, imaging, and hologram recording. Further details regarding the composition and functionality of the modules are presented in Supplementary Information 6. All modules are rigidly coupled to an optical breadboard with vibration-isolation tables. The modular opto-mechanical design enhances the system compactness while facilitating component replacement and upgrades. The use of standardised mechanical parts minimises cumulative assembly tolerances, leading to a significantly improved optical axis alignment precision. Strategically positioned vibration-isolation tables decouple critical modules from environmental disturbances, ensuring measurement stability. Finally, the entire microscope is carefully housed. The fully sealed enclosure substantially relaxes experimental environmental constraints and enables a robust deployment in nonlaboratory settings, thereby expanding potential application scenarios beyond conventional laboratory confines. Beyond the inherent advantages of SPRHM, the proposed versatile microscope features minimal opto-mechanical complexity, operational simplicity, and exceptional measurement stability to enable diverse applications. The assembly of the SPR holographic microscope and its key features are detailed in Supplementary Information 7.
-
For RI measurements, SPR-based sensors have been widely investigated due to their distinct advantages of high sensitivity to RI and label-free detection capabilities. These attributes have enabled diverse applications spanning biomedical diagnostics35, food safety control36, and environmental monitoring37. Conventional SPR sensor platforms typically employ angular38 or wavelength39 interrogation schemes; however, they face inherent limitations including a restricted sensitivity and reliance on a sophisticated optical instrumentation. Consequently, advanced SPR excitation configurations have emerged for enhancing the RI measurement performance and simplifying systems, including a multicore-flat-fibre-incorporated structure40, graphene-based architecture exploiting hybrid circular/triangular resonators41, and metal-insulator-metal waveguides with maze-type cavities42. Although current excitation configurations achieve an improved sensitivity, rapid response, and miniaturisation, their reliance on complex nanofabrication processes incurs prohibitive costs.
The intrinsic properties of 2D materials, including the electrical conductivity, optical absorption, and mechanical strength, exhibit strong thickness dependences43. Moreover, critical physics phenomena such as interlayer coupling44 and quantum confinement effects45 require an atomic-level thickness precision. Thus, metrology tools with a high accuracy and high measurement throughput serve as a foundational metric (‘ruler’) for 2D material research, bridging fundamental properties with device applications while directly enabling performance breakthroughs. Various metrology techniques have been applied in the characterisation of 2D materials, such as AFM46, scanning electron microscopy (SEM)47, Raman spectroscopy48, and ellipsometry49. AFM and SEM offer a subnanometre precision but pose a potential damage risk to the specimen. In addition, the point-scanning approach suffers from a low throughput. Raman spectroscopy provides thickness-sensitive fingerprints but relies on empirical databases with a limited generalisability, and the measurement speed is rather low. Although ellipsometry provides noncontact thickness mapping of 2D materials, its reliance on wavelength or illumination angle scanning and high complexity in model fitting can potentially constrain the measurement throughput.
In this study, we present a Ag–Au bilayer SPR sensor incorporating a thickness optimisation algorithm to significantly enhance the practical RI measurement sensitivity. In addition, an angle-scanning thickness demodulation workflow implemented on our SPR holographic microscope enables high-throughput thickness profiling of 2D materials without requiring a prior empirical calibration. We further provide an explanation for the achieved ultrahigh sensitivity. The enhanced RI sensitivity originates from three key physical mechanisms. (i) An optimised Ag–Au bilayer SPR excitation configuration is employed to maximise the RI measurement sensitivity S. (ii) The integration of DHM with SPRM enables phase-based SPR sensing, providing a higher sensitivity than conventional intensity-based approaches. (iii) The implementation of the common-path interferometry geometry, along with the comprehensive mechanical stabilisation (vibration-isolation tables and sealed enclosure), effectively suppresses perturbations from mechanical vibrations and air turbulence. This substantially reduces the phase measurement noise and allows the ultrahigh measurement sensitivity to be realised in practice. The enhanced thickness profiling resolution is enabled by the latter two mechanisms, i.e. phase-based SPR sensing and common-path interferometric noise suppression, combined with pixelwise thickness demodulation. Despite the efforts using the high-stability opto-mechanical design and robust demodulation algorithm to suppress the phase measurement noise, the photon shot noise has a dominant role in limiting the current measurement sensitivity, indicating that a state-of-the-art detector could further enhance sensitivity.
-
We introduced an optimised Ag–Au bilayer SPR excitation configuration and proprietary thickness demodulation workflow to achieve an ultrahigh-sensitivity measurement with respect to both RI and thickness. Rigorous experimental validations confirmed the ability to monitor RI variations of ethanol-water evaporation dynamics with a resolution of 2.58 × 10⁻⁷ RIU, as well as to perform accurate thickness profiling of a graphene specimen with a step height of 0.56 nm. Based on these advanced methods, we engineered a versatile SPR holographic microscope characterised by minimal opto-mechanical complexity, operational simplicity, and exceptional stability. The integrated motorised angular scanning mechanism enables flexible data acquisition, leading to an enhanced information throughput. As the SPR holographic microscope prototype bridges laboratory verification and practical applications, this technique establishes a new platform for noninvasive, label-free, wide-field, and high-throughput detection with an ultrahigh sensitivity. We anticipate progressive impacts across biological research, in situ nanomaterial inspection, and electrochemical studies.
-
This study was supported by National Natural Science Foundation of China (Grant Nos. 61927810, 62005219, and 62405246).
Refractive index and thickness measurements with ultrahigh sensitivity via versatile surface plasmon resonance holographic microscope
- Light: Advanced Manufacturing , Article number: 56 (2026)
- Received: 06 February 2026
- Revised: 02 April 2026
- Accepted: 03 April 2026 Published online: 03 April 2026
doi: https://doi.org/10.37188/lam.2026.056
Abstract: Employing optical microscopy for visualisation and quantification of dielectric analytes in the near-field area has been a persistent objective, connecting nanoscale dynamics with macroscopic phenomena. Surface plasmon resonance holographic microscopy (SPRHM) leverages evanescent-field interactions and digital holography to enable label-free wide-field quantitative intensity and phase imaging of the near-field area, emerging as a flexible optical tool for high-throughput visualisation and characterization of chemical reactions. However, current SPRHM demodulation methods remain insufficient to meet the growing demand for a higher measurement sensitivity. Here, we introduce an optimised Ag–Au bilayer SPR excitation configuration and angle-scanning thickness demodulation workflow, designed to achieve ultrahigh-sensitivity Refractive index (RI) and thickness measurements, respectively. Experiment results demonstrate the superior performance of the proposed methods: monitoring of RI variations of ethanol-water evaporation dynamics with a resolution of 2.58 × 10⁻⁷ RIU and thickness profiling of a graphene terrace specimen with a step-height accuracy of 0.56 nm. Integrated with these advanced methods, we present a versatile SPR holographic microscope prototype that features minimal opto-mechanical complexity, and exceptional stability, enabling unprecedented observations of biomolecular interactions, nanomaterial optics, electrochemical dynamic processes, etc.
Research Summary
Micro/nano metrology: Ultrasensitive plasmonic holographic microscope
A plasmonic metrology platform enables noninvasive, label-free, ultrahigh-sensitivity measurement of refractive index (RI) and thickness profiling of two-dimensional (2D) materials. Precise quantification of the RI and thickness is fundamental in basic research and serves as a critical ‘ruler’ in advanced manufacturing, acting as a bridge between macroscopic interactions and nanoscale dynamics. Jianlin Zhao from China’s Northwestern Polytechnical University and colleagues now report a versatile surface plasmon resonance holographic microscope. By integrating an optimised Ag–Au bilayer plasmonic excitation configuration and dedicated thickness demodulation workflow, the team demonstrated that the microscope can achieve a RI measurement resolution of 2.58 × 10⁻⁷ RIU and perform subnanometre thickness profiling with 0.56 nm resolution. This platform promises progressive impacts across biological research, in situ nanomaterial inspection, and electrochemical studies.
Rights and permissions
Open Access This article is licensed under a Creative Commons Attribution 4.0 International License, which permits use, sharing, adaptation, distribution and reproduction in any medium or format, as long as you give appropriate credit to the original author(s) and the source, provide a link to the Creative Commons license, and indicate if changes were made. The images or other third party material in this article are included in the article′s Creative Commons license, unless indicated otherwise in a credit line to the material. If material is not included in the article′s Creative Commons license and your intended use is not permitted by statutory regulation or exceeds the permitted use, you will need to obtain permission directly from the copyright holder. To view a copy of this license, visit http://creativecommons.org/licenses/by/4.0/.

 DownLoad: