




-
Refractive index (RI) imaging is typically related to morphology, density, stress, and chemical composition, making it an essential technique in several fields1,2. RI imaging renders subcellular organelles with high contrast and in a label-free manner3–7, demonstrating its immense application potential in fields such as histopathology8,9, hematology10–13, microbiology14, cell biology15,16, and nanotechnology17. Meanwhile, RI imaging has been one of the single most important optical characterisation techniques in material science18, and a versatile technique for defect inspection in the industry19.
Thus far, several RI measurement techniques have been proposed. The first laboratory instrument to accurately measure the RI of liquids was developed in 1874 by Ernst Abbe, who used the law of refraction20. A critical angle-based method was also employed for RI measurement21. Further, ellipsometry was used as a convenient and accurate technique for measuring the thickness and refractive indexes of very thin films on solid surfaces and for the measurement of optical constants of reflecting surfaces22,23. Meanwhile, interferometry was utilised for RI detection24,25. In this method, the RI difference Δn was estimated from the phase difference Δϕ = 2π × Δn × L/λ with a pre-known propagation length L.
Depth-resolved three-dimensional (3D) RI imaging is essential for obtaining more precise morphological information, including nuclear shape, dry mass, and nuclear-to-cytoplasm volume ratio. To this end, two classes of 3D RI imaging techniques have been reported: entitled RI tomography based on back filtered projection (BFP)26–29 and optical diffraction tomography (ODT)30–36. Both techniques can be used to acquire 3D RI distribution of volumetric samples by mapping their spectrum in 3D from measured multiple two-dimensional optical fields.
BFP-based RI tomography is similar to X-ray computed tomography (CT). This technique assumes phase measurement to be an integration of RI along the projection direction, ignoring the optical diffraction effect. Thus, the applications of this method are limited to small sample RI variations over the wavelength scale. In contrast, ODT considers the diffraction effect during the 3D RI reconstruction, and it is more accurate for samples that are considerably thicker than the depth of field of the imaging systems.
The theoretical framework for reconstructing the 3D refractive index distribution of a weakly scattering object was first established in the seminal work of Emil Wolf in 196937, and further interpreted by Dändliker and Weiss in 197038. This framework is based on the first-order Born approximation and Fourier diffraction theorem, which forms the foundation of ODT. The proposed Fourier diffraction theorem can determine how the 3D RI distribution of a weakly scattering object can be reconstructed from scattered fields measured under varying illumination angles. However, this elegant theory is limited to the theoretical level because of the lack of stable coherent sources, high-sensitivity digital detectors, and powerful computational resources. ODT experienced an experimental renaissance after the 1970s owing to the invention and maturation of lasers, charge coupled device/complementary metal-oxide semiconductor cameras, and computer technologies. The first experimental demonstration of this theoretical framework was implemented using interferometric approaches by A. Fercher et al. in 197939.
Between 2006 and 2007, two research groups independently reported early ODT systems for the 3D RI imaging of cells29,40. Although the feasibility of ODT was validated by pioneering works, their initial implementations faced numerous challenges. For example, these systems extensively relied on mechanical movements such as sample rotation or illumination scanning with galvanometer mirrors (GMs)41, resulting in instability and speed bottlenecks. Further, procedures such as sample rotation were potentially invasive to live cells. Thus, these early approaches, which either ignored optical diffraction or assumed weak scattering of samples, contradicted the physical basis of real samples and severely limited reconstruction accuracy.
To overcome the bottlenecks of initial systems, ODT entered a period of rapid development characterised by innovations in hardware. The introduction of programmable optical elements such as spatial light modulators (SLMs)42–44, digital micromirror devices (DMDs)45–47, and other high-speed beam steering devices48 enabled purely electronic control of the laser focus, replacing slow and unstable mechanical scanning. Concurrently, the advent of advanced light sources such as super-continuum lasers1,49 provided broader excitation spectra, enhancing multiplexing capabilities. These hardware innovations, combined with fast cameras50 and graphics-processing units for parallel computing51, significantly boosted the imaging speed and stability of the ODT, endowing it with the capability to capture rapid dynamic processes in living tissue. The quest for higher fidelity in 3D RI reconstruction has driven a remarkable evolution in algorithmic strategies. The Rytov approximation model was introduced in 200935, and it accounted for diffraction effects in ODT reconstruction, significantly enhancing imaging resolution and fidelity. Subsequently, the research focus shifted towards solving the “missing cone” problem, which is an artifact that arises from the physical limitations of the optical system such as its numerical aperture (NA).
Early approaches moved from diffraction-agnostic models to physics-based reconstruction using classical regularisation methods, such as total variation52,53, which imposed generic mathematical priors to constrain the solution. Although these methods were effective to an extent, they often struggled to preserve fine biological details. This limitation led to the development of more advanced deconvolution algorithms to better model the imaging process while remaining constrained by “general mathematical constraints”. However, the most significant leap could be attributed to the recent emergence of data-driven approaches, particularly deep learning, which represents a fundamental shift from imposing generic mathematical constraints to learning specific, powerful structural priors directly from data. Deep learning revolutionised ODT across the entire imaging and analysis pipeline.
For artifact removal and resolution enhancement, neural networks such as U-Nets and generative adversarial networks have become the state-of-the-art to solve the “missing cone” problem by learning what cells are supposed to look like, achieving near-isotropic resolution, and generating reconstructions of unprecedented realism54,55. Meanwhile, deep learning directly infers the 3D RI map from the raw measured holograms in an end-to-end manner56. Deep learning automates the final step of biological inquiry through quantitative downstream analysis, performing high-accuracy segmentation of organelles (e.g. nucleus, lipid droplets) and classification of cell phenotypes directly from the label-free tomograms, which helps unlock the potential for high-throughput quantitative biology57,58.
Thus, 3D RI imaging has elevated into a powerful platform after adapting advanced hardware and intelligent, data-driven algorithms. It has been acting as a quantitative, label-free, 3D imaging technique with high spatiotemporal resolution. The principles, instruments, and applications of optical tomography (OT) and ODT are presented in this review to promote the dissemination of the 3D RI imaging techniques and enhance their accessibility and utility in practical research fields. Further, a detailed analysis of the instrumental requirements and performance characteristics of 3D RI imaging systems is provided. Finally, perspectives on future developments and potential applications are discussed.
-
Based on the principles of X-ray CT, 3D RI imaging via the Fourier slicing theorem (FST) is performed by retrieving transmittance wavefronts (via holography or single-beam phase retrieval approaches) and filling a 3D spectrum with the spectra of the wavefront projections, as shown in Fig. 1.
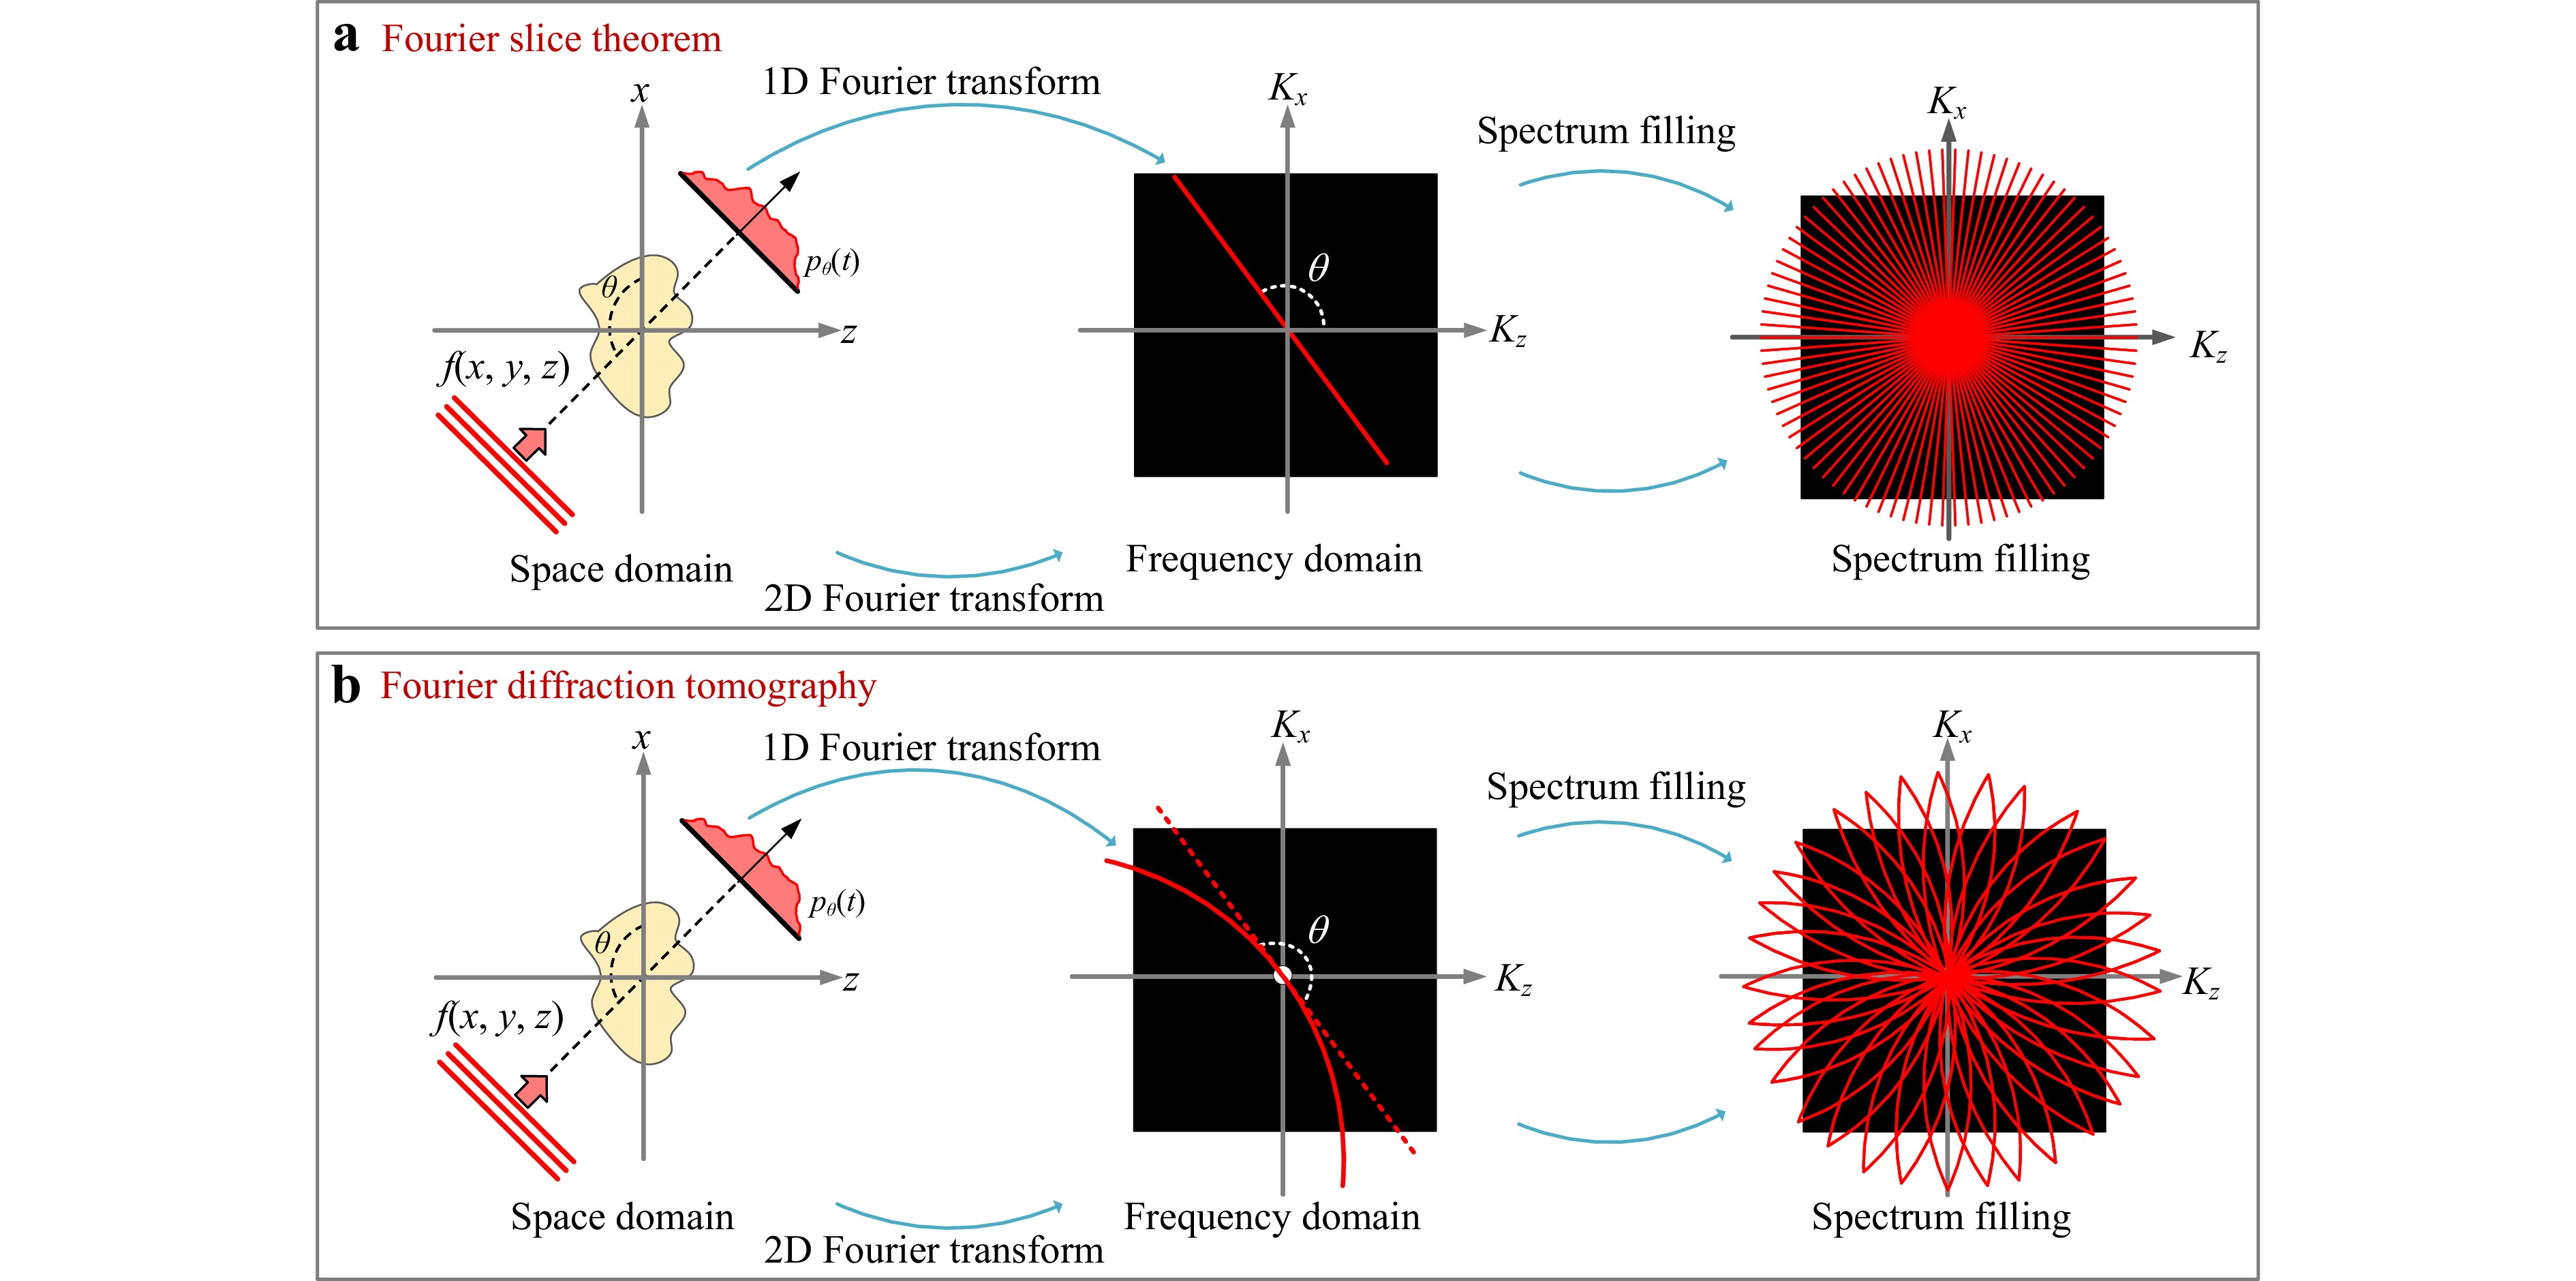
Fig. 1 Principle and workflow of 3D RI imaging via Fourier slicing theorem or Fourier diffraction tomography. a 3D RI imaging via Fourier slicing theorem. b 3D RI imaging via Fourier diffraction tomography.
FST26, first proposed by Bracewell, relates the two-dimensional (2D) wavefront projection of a 3D sample along an arbitrary direction to a slice of the spectrum of the 3D RI distribution perpendicular to the projection. Assuming that the illumination rotation is around the y-axis, the 3D spectrum of the 3D RI can then be filled using the spectra of 2D projections along different azimuthal angles θ:
$$ \hat{F}({k}_{x}\cos \theta ,{k}_{y},{k}_{x}\sin \theta )=\frac{\lambda }{2\pi }{\hat{U}}_{\theta }({k}_{x},{k}_{y},{\bf \textit z}=0) $$ (1) Subsequently, the 3D RI difference Δn(x, y, z) of the tested sample above the background/immersion medium related to the synthesised $ \hat{F}({K}_{x},{K}_{y},{K}_{\textit z}) $ (where $ {K}_{x},{K}_{y}, $ and ${K}_{\textit z} $ represent the coordinates in the sample-orientated spectrum domain) can be obtained using different wavefront projections.
$$\begin{split} \Delta n(x,y,{\textit z})=\;&\sum \limits_{\theta }\frac{\lambda }{2\pi }\int \limits_{0}^{\mathrm{\infty }}{\hat{U}}_{\theta }({k}_{x},{k}_{y}\text{,}{\textit z}=0)\\&\cdot {k}_{x}\exp [i2\pi {k}_{\mathrm{x}}(x\cos \theta +y\cos \theta )]d{k}_{x} \end{split}$$ (2) In practical implementation, spectrum filters such as Ram-Lak, Shepp-Logan, and Hamming filters are multiplied to kx in Eq. 2. In these implementations, Eq. 2 is calculated via filtered back projection (FBP).
-
Diffraction tomography (DT) is a new method for obtaining the quantitative reconstructions of a 3D RI map showing the internal structure of 3D weakly scattering objects from a series of two-dimensional scattered fields measured at different angles59,60. Compared to Fourier projection-slice theorem, DT considers the diffraction of a light field when propagating through a thick sample.
Wolf37 proposed the original DT theory, which governs a plane wave U(r) when passing through a specimen. For this plane wave, the incident field Ui(r) and scattered field Us(r) are regulated by
$$ \left({\nabla }^{2}+{k}_{0}{}^{2}n_{m}^{2}\right){U}_{s}(\boldsymbol{r})=F(\boldsymbol{r})U(\boldsymbol{r}) $$ (3) where k0 = 2π/λ0, nm, λ0, U(r) = Ui(r) + Us(r), F(r) = −(2π/λ0)2[n2(r) – $ n_{m}^{2} $], and n(r) represent the wave number, RI of the immersion medium, illumination wavelength in free space, total light field, scattering potential function, and complex RI of the specimen, respectively. Wolf introduced the first-order Born approximation that assumes the scattered field Us(r) is considerably weaker than the incident field Ui(r), i.e. Us(r)<<Ui(r). Then, the scattered wave at the image plane (z = 0) is related to the scattering potential61
$$ F(\boldsymbol{k}-{\boldsymbol{k}}_{0})=\frac{i{k}_{z}}{\pi }{U}_{s}({\boldsymbol{k}}_{\text{T}}{,}\;{\textit z}=0) $$ (4) where k0 represents the 3D illumination wavevector with |k0| = nmk0. The 3D illumination wavevector is determined by its 2D counterpart k0 = (k0,T, k0,z) with $ {k}_{0,{\textit z}}=\sqrt{{\left({n}_{m}{k}_{0}\right)}^{2}-|{k}_{0,\mathrm{T}}{|}^{2}} $. F(k) and Us(kT, z = 0) represent the 3D and 2D Fourier transforms of F(r) and Us(r), respectively, where kT = (kx, ky) represents the transverse spatial frequency vector. k = (kT, kz) represents the 3D spatial-frequency vector under the constraint $ {k}_{z}=\sqrt{{\left({n}_{m}{k}_{0}\right)}^{2}-|{k}_{\mathrm{T}}{|}^{2}} $. Then, Eq. 4 can be rewritten as
$$ F(\boldsymbol{k})=\frac{i({k}_{\textit z}+{k}_{0\mathbf{,}{\textit z}})}{\pi }{U}_{s}({\boldsymbol{k}}_{\mathrm{T}}+{\boldsymbol{k}}_{0{,}{\rm T}},{\textit z}=0) $$ (5) Both Born and Rytov approximations were used to relate Us(kT + k0,T, z = 0) to light fields measured at different illumination angles62. The first-order Born approximation is valid when the total optical phase delay induced by the specimen is less than π/263. In contrast, the Rytov approximation is independent of the specimen size; however, it is limited by the phase gradient. The Rytov approximation demonstrates superior RI reconstruction performance37,64. Under the first-Rytov approximation60, Us(kT + k0,T, z = 0) = FT{ln[U(rT)/Ui(rT)]} with FT{ } representing the 2D Fourier transform operator, and U(rT) representing the total field transmitted through the sample under the illumination wavevector k0. Hence, different regions of F(k) (i.e. the 3D spatial frequency spectrum of Δn(x, y, z)) can be obtained by measuring the total field U(rT) for various k0 (i.e. at various illumination angles of the incident wave). After F(k) is calculated by filling with projected 2D spectra of ln[U/Ui], an inverse Fourier transform provides the estimate for F(r). Then, the 3D RI can be solved easily using the relation F(r) = −(2π/λ0)2 × [n2(r) − $ n_{m}^{2} $]. In the implementation, the incident fields Ui(r), which propagate unperturbed in free space, must be measured to calculate the complex phase ln[U/Ui]65. This is realised by capturing the projections of the measurement volume without any object; these projections are referred to as background information.
Fig. 2 illustrates the fundamental principle and operational workflow of 3D RI imaging. The comprehensive pipeline includes three phases: data acquisition, 3D RI reconstruction, and physical parameter prediction. As depicted in Fig. 2a, the data acquisition phase involves sequentially changing the illumination to measure scattered fields in different directions. This is achieved through three modalities: illumination scanning relative to a stationary sample, sample rotation against a fixed illumination beam, and a hybrid method that combines both strategies to maximise the coverage of the frequency support (k-space).
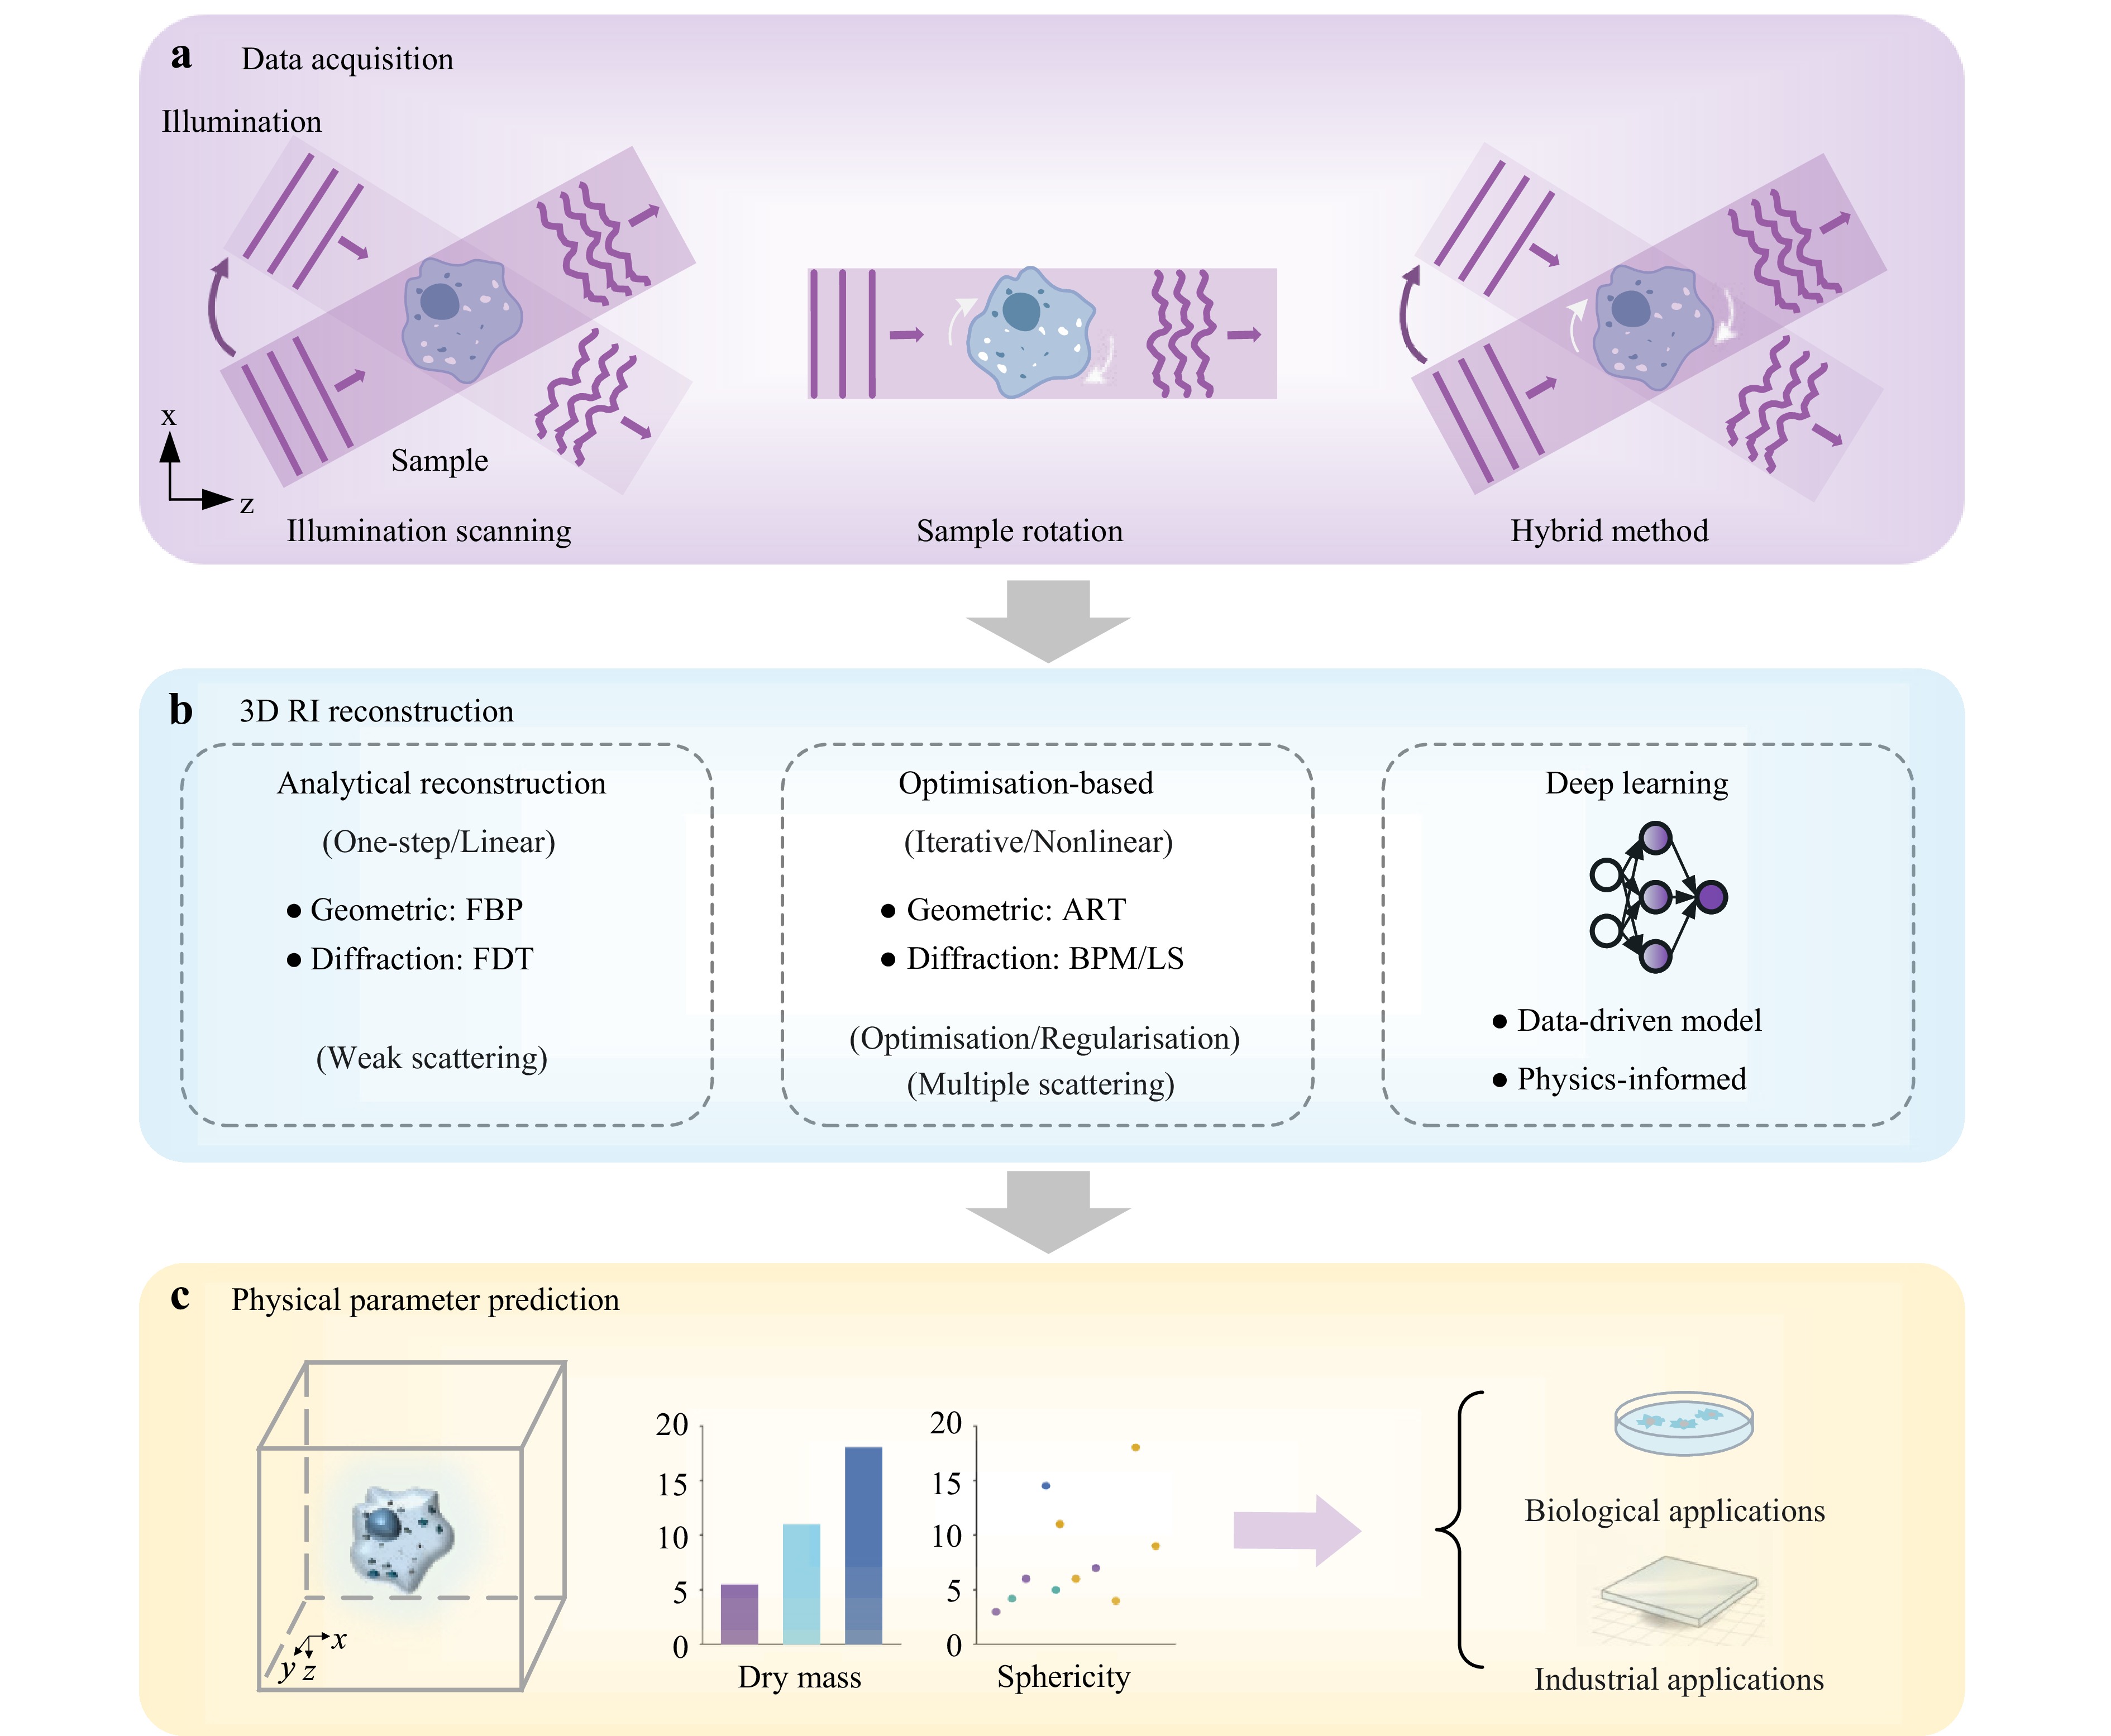
Fig. 2 Schematic overview of 3D RI imaging and reconstruction pipeline. The workflow is structured into three stages: a Data acquisition employing illumination scanning, sample rotation, or hybrid strategies to capture multiview projections. b Reconstruction algorithms to retrieve the 3D RI distribution through geometric optics approaches (e.g. filtered back projection and algebraic reconstruction technique), diffraction-based models (e.g. Fourier diffraction theorem and beam propagation method), or emerging deep learning frameworks. c Further analysis and quantification of physical parameters such as dry mass and sphericity for specific applications.
Following data acquisition, the 3D RI reconstruction phase includes processing the raw images to retrieve the 3D RI distribution, as shown in Fig. 2b. The reconstruction strategies generally fall into three primary classes:
Analytical reconstruction: 3D RI distribution can be reconstructed in an analytical manner using 2D wavefronts measured at different directions. The analytical approach is split into two subclasses depending on whether the diffraction of the sample is considered:
1) Geometric Optics: FBP is used to reconstruct the 3D RI image by smearing the filtered projections along straight lines. Despite being computationally efficient, the geometric optics approach inherently neglects diffraction phenomena, limiting its standalone utility to initialisation. More sophisticated reconstruction can be achieved using more comprehensive reconstruction frameworks based on regularisation roles.
2) Diffraction Models: To rigorously address the wave nature of light, the Fourier diffraction theorem (FDT) forms the cornerstone of high-resolution ODT. FDT maps the 2D Fourier spectrum of the scattered field onto spherical shells (Ewald spheres) in the 3D frequency domain for synthesising the object function. FDT is cost-effective; however, it is predicated on weak scattering assumptions (i.e. first-order Born or Rytov approximations), which restrict its applicability to individual cells. Many biological specimens such as dense clusters of cancer cells exhibit high RI contrast and large optical path-length differences (OPDs). Such significant multiple scattering fails the analytical reconstruction approaches.
Optimisation-based approaches: Advanced optimisation-based approaches incorporating nonlinear forward models have been developed to extend ODT to multiple-scattering samples66,67. These methods simulate complex wave propagation using solvers such as beam propagation method (BPM), wave propagation method68, or Lippmann-Schwinger (LS) equation69,70. These algorithms model light propagation through the entire sample volume, accounting for multiple scattering effects such as diffraction and refraction. For example, algebraic reconstruction techniques (ART) solves a 3D RI distribution under the rectilinear propagation assumption by iteratively solving a system of linear equations minimising the error between calculated and measured projections71. Alternatively, the multi-slice beam-propagation (MSBP) model utilises an iterative optimisation to reconstruct the 3D RI of thick biological samples even from intensity-only measurements72, significantly broadening the utility of ODT. MSBP-based 3D RI imaging is conducted as follows:
1) Capture multiple measurements Il(r) of the object at varying illumination angles; the illumination vector is denoted by $ {\boldsymbol{k}}_{0}^{l} $.
2) Simulate the intensity of the transmitting beam through the sample under the illumination wave $ y_{0}^{l}(r) = \mathit{\exp } (j{\boldsymbol k}_{0}^{l}\cdot {\boldsymbol r}) $ using the MSBP forward model, which yields Gl{n(r3D)}.
3) Estimate the 3D RI of the sample by minimising the difference between the measured amplitude (square-root of intensity14) and those expected via the forward model.
$$ \hat{n}({\boldsymbol{r}}_{3D})=\arg \underset{n({\boldsymbol{r}}_{3D})}{\min }{\sum \limits_{l=1}^{L}\sum \limits_{\boldsymbol{r}}^{}\left| \sqrt{{I}^{l}(\boldsymbol{r})}-\left| {G}^{l}\left\{n({\boldsymbol{r}}_{3D})\right\}\right| \right| }^{2} $$ (6) where r3D = (r, k) represents a 3D spatial position vector; n(r3D) = nk(r), k = 1, 2, 3, …, N. The nonlinear operator Gl{·} represents the forward model operation that predicts the 2D light field measured when illuminating n(r3D) with the incident electric-field $ y_{0}^{l}(\boldsymbol{r}) $, as described by Eq. 6 and (2). $ \hat{n}({r}_{3D}) $ is a complex-valued quantity, where the real and imaginary components provide information about the refraction and absorption properties of the object, respectively. The 3D RI of the sample can be reconstructed by solving the least-squares minimisation framework in Eq. 6 via an iterative approach.
This approach can reconstruct 3D RI using only intensity images, and therefore, it can be implemented with a cost-effective and simple optical hardware system. The utilisation of the MSBP forward model enables reconstructing 3D RI of thick samples such as densely packed clusters of cells or multicellular organisms. However, this approach uses iteration-based optimisation instead of an analytical solution to reconstruct 3D RI; therefore, it has higher computational requirements than that of the standard ODT. These optimisation methods can be time-consuming and trapped in local minima, especially for objects that introduce large OPDs.
Hybrid strategies combining analytical solutions with iterative optimisation have emerged as solutions to overcome the slow convergence and local minima of such purely iterative approaches73. Adaptive calibration frameworks74 can computationally correct for systematic errors occurring in iterative models such as MSBP. Meanwhile, optimisation-based approaches can be enhanced by adopting regularisation techniques such as 3D total variation75–77, which enforce piecewise smoothness by minimising the gradient magnitude. These algorithms effectively mitigate reconstruction artifacts and address the ill-posed nature of the inverse problem. Gradient-based methods with accelerated convergence such as the fast iterative shrinkage-thresholding algorithm have been introduced as optimisation approaches for handling handle efficiently high-dimensional data78.
Deep Learning: Recently, deep neural networks (DNNs) have emerged as a powerful paradigm to solve the inverse scattering problem, particularly under ill-posed conditions. Fundamentally, these methods seek to approximate the complex nonlinear inverse operator using a parameterised nonlinear mapping fw. The reconstruction process can be expressed as
$$ \hat{n}(\boldsymbol{r})={f}_{\boldsymbol{w}}({\boldsymbol{Y}}_{meas}) $$ (7) where Ymeas and w represent the input measurements (e.g. scattered fields or intensity patterns) and network parameters (weights and biases) optimised during training. As illustrated in Fig. 2b, deep learning approaches in ODT can be categorised into data-driven and physics-informed models. The data-driven models are trained in a supervised manner using large datasets of paired measurements and ground-truth labels. Once trained, these networks can regress the 3D RI distribution from raw data, enabling real-time reconstruction with high computational efficiency. Conversely, physics-informed networks (or physics-driven models) integrate governing physical laws such as the Helmholtz equation or FDT directly into the network architecture or loss function. This strategy reduces the reliance on massive labelled datasets and ensures that outputs satisfy physical consistency. These learning-based frameworks significantly enhance image quality by leveraging the non-linear fitting capability of DNNs, effectively resolving the “missing cone” problem and mitigating artifacts caused by noise or limited angular coverage.
Despite its advantages, deep learning-based 3D RI reconstruction faces significant challenges in generalisation and interpretability. Data-driven models trained on specific datasets often suffer from prediction degradation when applied to samples with different RI distribution types. To overcome this limitation, physics-informed networks are increasingly adopted, and they comprise two levels of physical integration. The first level incorporates physical knowledge as a soft constraint by adding a physics-based regularisation term to the loss function, which guides the network toward physically-allowed solutions during training79,80. The network remains a “black box” with limited interpretability. The second level is the physics-unrolled network, which directly mirrors the physical reconstruction process by explicitly embedding a physical forward model such as the beam propagation method into network architecture81. This design ensures that each intermediate feature map corresponds to a physically meaningful quantity such as the scattered field at a specific iteration, enhancing both generalisation and interpretability.
Selecting an appropriate reconstruction strategy based on sample properties and imaging requirements is essential for achieving high-fidelity 3D RI reconstruction. A comparison of different types of 3D RI reconstruction approaches is summarised in Table 1. Once a high-fidelity 3D RI distribution is reconstructed, key morphological and biochemical parameters can be extracted to characterise the tested sample, as indicated in Fig. 2c. For example, this 3D tomogram enables the quantitative analysis of dry mass, stress, and sphericity, facilitating applications ranging from single-cell profiling to material inspection.
Category Applicable sample Speed Key advantages Key limitations Geometric optics Large scale and non-diffractive Very fast Simple and analytical Ignore diffraction and low spatial resolution Diffraction models Thin and weakly diffractive Fast Simple and analytical Not suited for strong scattering Optimisation-based Thick diffractive Slow High accuracy Computationally intensive Deep learning Thick and strongly diffractive Real-time (inference) and very slow (training) Real-time (inference), end-to-end mapping, and overcoming hardware limitations Limited generalisability and weak physical interpretability Table 1. Systematic comparison of 3D RI reconstruction algorithms
-
A critical requirement for high-fidelity 3D reconstruction is data acquisition that guarantees sufficient spectrum coverage of the spatial frequencies of the sample. The data acquisition for 3D RI imaging includes two core modules: an illumination modulation unit for diversifying the angular interrogation, and a quantitative phase imaging (QPI) unit for recording the scattered complex optical fields. A typical experimental setup is conceptually illustrated in Fig. 3a, f, and k.
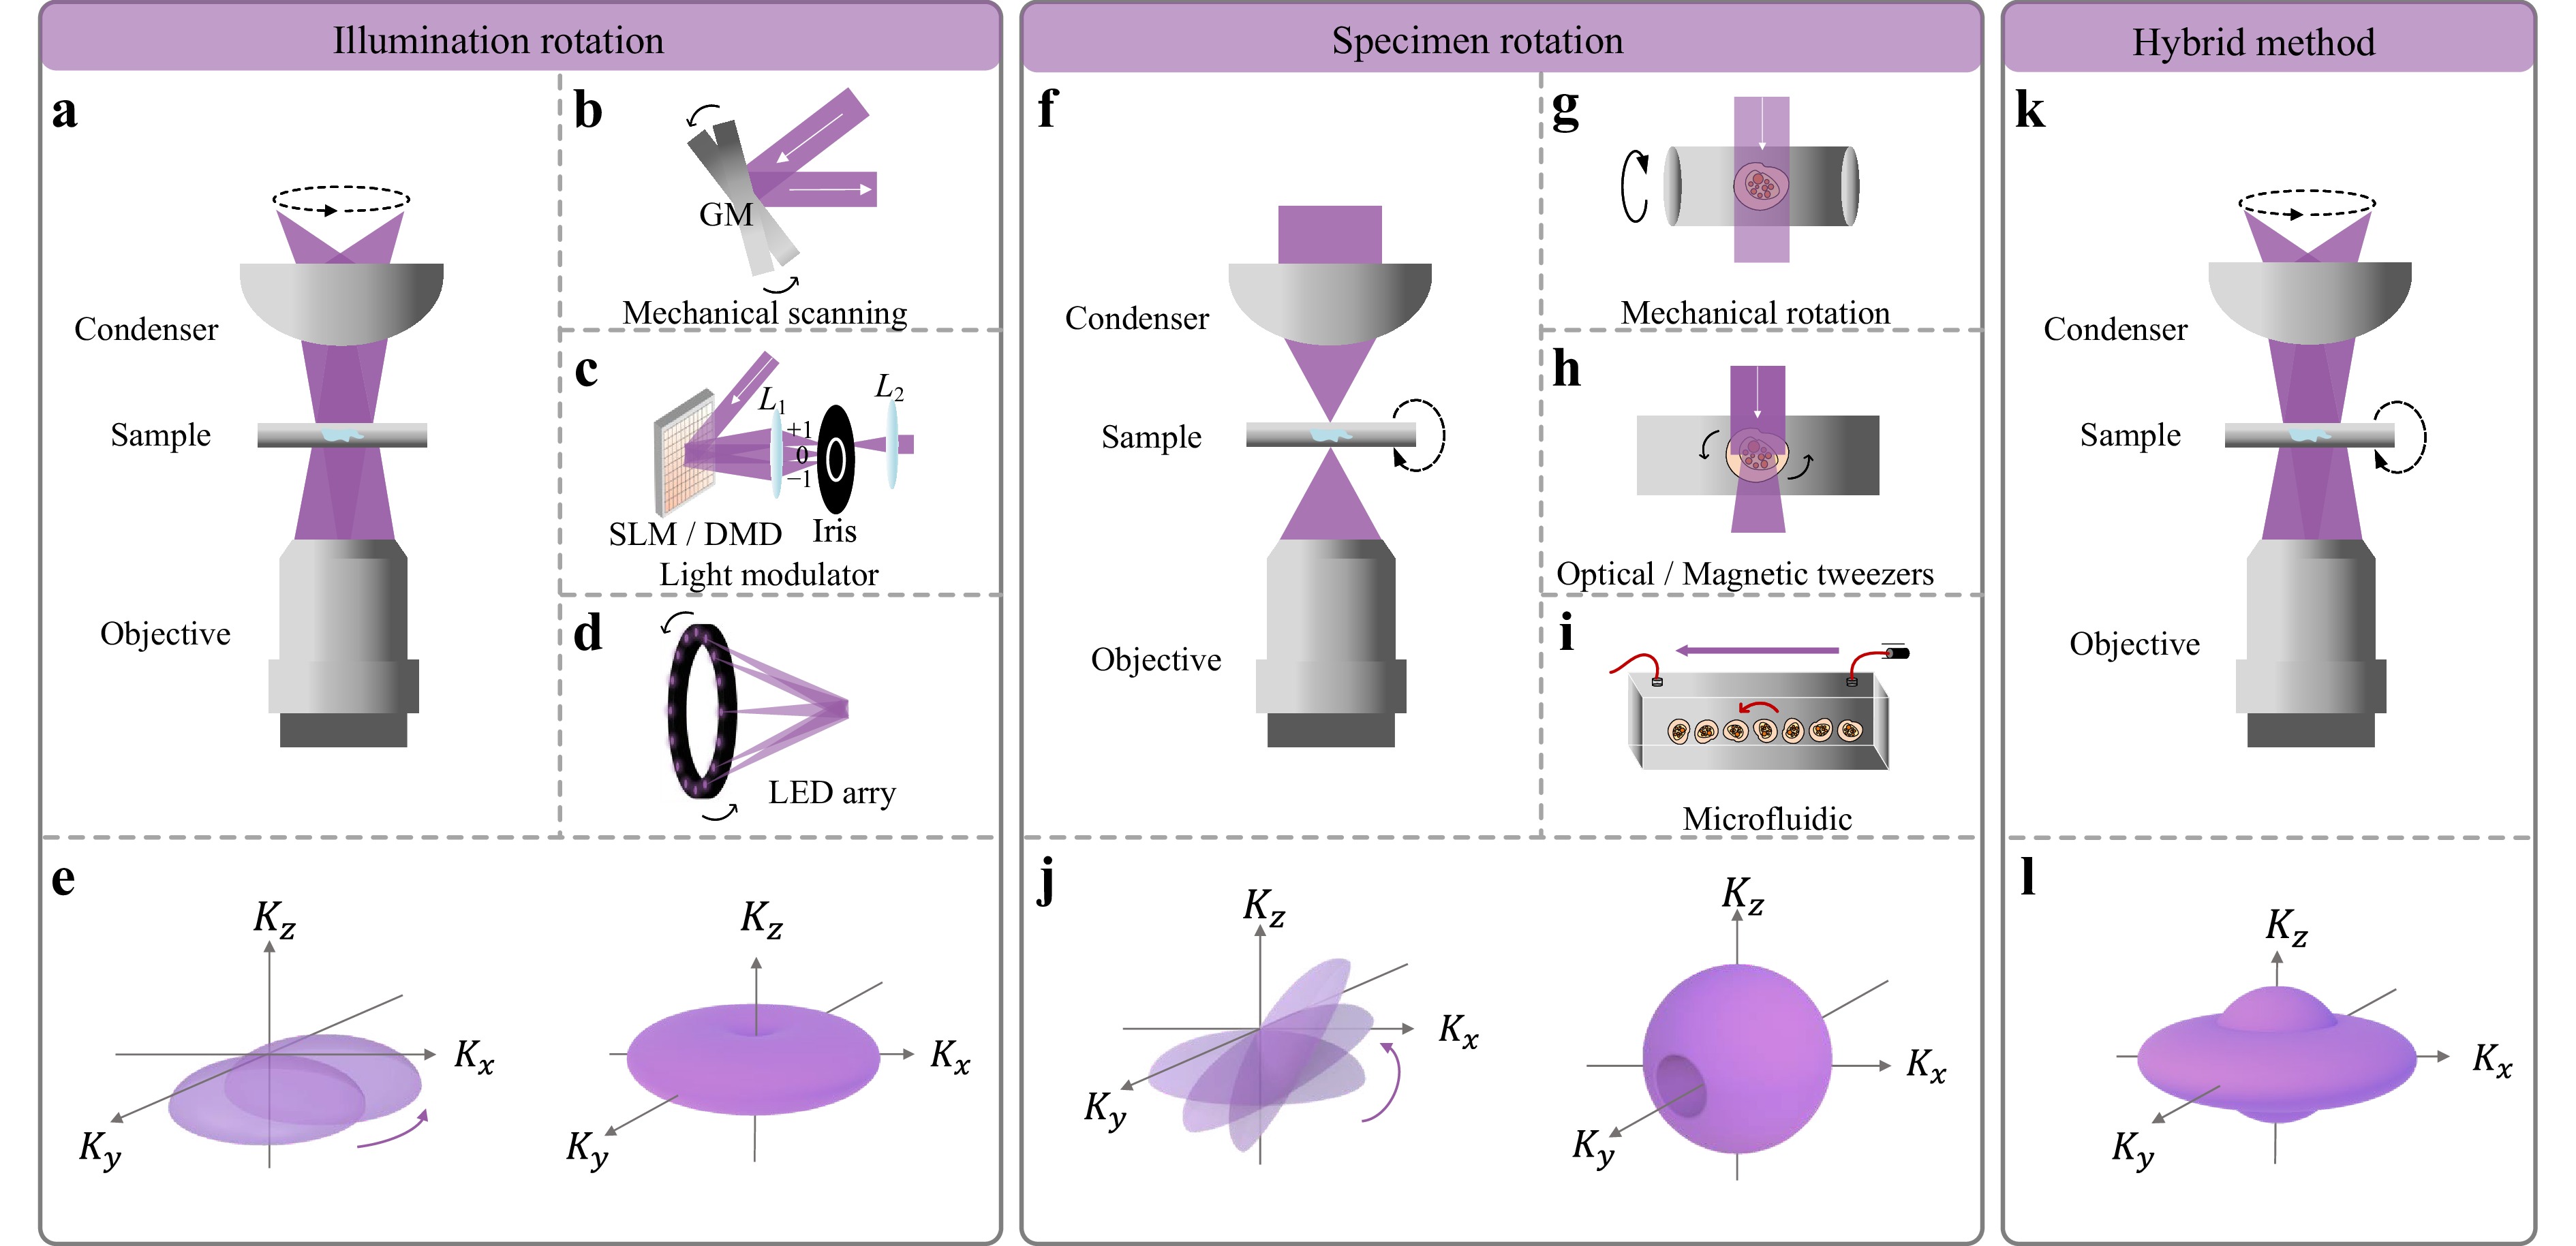
Fig. 3 Fundamental data acquisition strategies for 3D RI imaging. a-e Illumination rotation. a Overall schematic of illumination rotation with a stationary sample. The illumination is rotated using b galvanometer mirrors, c light modulators (SLM/DMD), or d programmable LED arrays. e Frequency support accumulation and resultant Ewald spheres featuring a “missing cone”. f-j Specimen rotation. f Overall schematic of sample rotation with fixed illumination. A sample is rotated via g microcapillary rotation, h optical tweezers, and i microfluidic flow. j Isotropic frequency support effectively eliminates the axial missing cone. k-l Hybrid method. k Configuration combining beam scanning and specimen rotation. l Extended frequency support merging both coverages for maximal resolution.
-
Illumination modulation techniques used to synthesise 3D RI distributions are fundamentally categorised into three approaches: illumination rotation, specimen rotation, and the hybrid method.
-
Illumination rotation (IR) is the most commonly used approach in 3D RI imaging because of its implementation simplicity and minimal specimen perturbation, which is schematically illustrated in Fig. 3a. Various hardware strategies are employed to achieve the required angular scanning. Initially, GMs are employed to control the illumination angle by tilting mirrors located at a conjugate plane of the sample (Fig. 3b). Despite their advantage of high energy efficiency, GMs suffer from a few drawbacks such as the introduction of mechanical instability such as position jitters and nonlinear positioning errors. Further, the rotational surfaces of a dual-axis GM cannot be perfectly conjugated to the sample plane simultaneously, and therefore, this potentially introduces phase distortions.
With advancements in light modulation, SLMs and DMDs have become widely used as beam controllers (Fig. 3c)82,83. Digital modulators (SLMs/DMDs) at the conjugate plane generate plane waves with the desired directions by displaying holograms or binary patterns. These systems offer high stability because they contain no moving parts84. SLMs can actively correct wavefront distortions and enable advanced modes such as airy-beam tomography85; however, they are limited by liquid crystal response times. DMDs offer ultrafast refresh speeds but are restricted to binary amplitude modulation. Alternatively, programmable light-emitting diode (LED) arrays serve as a cost-effective solution (Fig. 3d)86. The specimen is illuminated from specific directions by sequentially activating LEDs. The partially coherent nature of LED light effectively reduces speckle noise; however, it requires compatible QPI algorithms. Recently, it was reported that kilohertz-rate tomography was achieved using DMDs based illumination strategy7.
The fundamental principle of illumination rotation based ODT is extending the frequency support of the imaging system. As illustrated in the frequency diagrams in Fig. 3e, under single-angle illumination, only a portion of the spectrum of the sample corresponding to an “information cap” of the Ewald sphere is captured. Data from all illumination angles are synthesised to reconstruct the full 3D information. Continuously rotating the illumination beams around the optical axis causes the corresponding information cap to rotate in the frequency domain. This process stitches all acquired “caps” together, forming a “doughnut”-shape. The frequency support of the system, particularly in the transverse plane (kx − ky), which becomes twice that of conventional on-axis illumination (e.g. standard digital holographic microscopy (DHM)). Consequently, the spatial lateral resolution of ODT is doubled87. The frequency support $\varGamma^{\rm{IR}} $ for 3D RI imaging with illumination rotation is given by88
$$ \mathit{\Gamma }_{\textit{x,y}}^{\text{IR}}=\frac{4n\text{sin}\theta }{\lambda }\mathbf{,}\;\;\mathit{\Gamma }_{\textit z}^{\text{IR}}=\frac{2n(1-\text{cos}\theta )}{\lambda } $$ (8) In contrast, the frequency support for traditional DHM with the normal illumination is given by88
$$ \mathit{\Gamma }_{\textit{x,y}}^{\text{DHM}}=\frac{2n\text{sin}\theta }{\lambda }\mathbf{,}\;\;\mathit{\Gamma }_{\textit z}^{\text{DHM}}=\frac{n(1-\text{cos}\theta )}{\lambda }$$ (9) where nsinθ represents the numerical aperture (NA) of the imaging objective. Despite the lateral resolution enhancement, a clear void exists along the central kz-axis of the synthesised 3D OTF, as indicated in Fig. 3e. This phenomenon, referred to as the “missing cone” problem, arises because the limited NA of the objective prevents the collection of high-angle scattered light. The missing cone results in the loss of low-frequency axial information, which leads to anisotropic resolution where the imaging quality along the optical axis is inferior to that in the transverse plane.
-
3D RI imaging based on specimen rotation (SR) has been extensively explored to mitigate the inherent resolution anisotropy and the “missing cone” problem associated with illumination scanning. In this mode, the sample is rotated 360° relative to a fixed illumination beam, which enables full angular interrogation (Fig. 3f). The specimen rotation can be conducted using the following three methods:
Mechanical Rotation: Conventional approaches utilise a motorised rotary microcapillary (Fig. 3g) or a precision syringe needle to mechanically hold and rotate the specimen16,89–91.
Optical/Magnetic Tweezers: Optical/magnetic tweezers (Fig. 3h) can be employed to trap and rotate single cells in suspension to avoid mechanical contact, thereby offering a sterile manipulation environment92–94.
Microfluidic Flow: Flow-cytometry-alike strategies have been proposed to address the low throughput of single-cell manipulation (Fig. 3i). These methods exploit hydrodynamically induced random tumbling of cells within microfluidic channels, which enables high-throughput 3D analysis without active scanning mechanisms95. Although the rotation angles in these flowing systems are initially unknown, they can be precisely retrieved a priori through computational wavefront analysis-such as exploiting the “biolens effect” for homogeneous cells (e.g. RBCs) or phase-map symmetry for complex structures.
Unlike the illumination rotation mode, specimen rotation approach theoretically captures the full range of viewing angles, as depicted in Fig. 3j. In the frequency domain, this process synthesises a quasi-isotropic spectrum support that approximates a sphere (“ball” shape) besides the “missing apple core”96,97:
$$ \mathit{\Gamma }_{\textit{y}}^{\text{SR}}=\mathit{\Gamma }_{\textit{z}}^{\text{SR}}=\frac{4n\text{sin}(\theta /2)}{\lambda }\mathbf{,}\;\;\mathit{\Gamma }_{x}^{\text{SR}}=\frac{2\mathrm{n}\textit{sin}\theta }{\lambda } $$ (10) The specimen rotation approach offers isotropy; however, its maximum achievable spatial resolution is practically lower than that of the illumination rotation mode that benefits the synthetic aperture effect. In addition, there are two additional limitations:
1) Optical Constraints: The physical requirement for rotation mechanics (e.g. capillaries) necessitates long-working-distance objectives, which inherently possess lower NA. The cutoff frequency is proportional to the NA, which restricts the finest resolvable details.
2) Sample Stability: Mechanical rotation can introduce perturbations or deformation to soft biological cells, and this can lead to reconstruction artifacts. Optical tweezers mitigate mechanical stress, despite being unsuitable for adherent cells.
-
Both illumination and specimen rotation strategies have a significantly expanded 3D frequency spectrum; however, the extensions are along different directions. The “missing cone” of IR is aligned along the optical axis (kz), while the “missing apple core” of SR is oriented along the rotation axis (kx or ky). Combining the two to achieve the theoretical limit of isotropic resolution is natural. As conceptualised theoretically97 and illustrated in Fig. 3k, simultaneously modulating the illumination angle and specimen orientation enables filling these orthogonal frequency voids98–100.
As depicted in the frequency diagram in Fig. 3l, combining full-angle specimen rotation with circular beam scanning effectively merges the “doughnut” and “ball” OTFs. This synthesis results in a maximally filled frequency support, which is often described as a “UFO” shape or an expanded sphere, yielding a resolution that surpasses conventional holographic or transmission microscopy in all three dimensions (x, y, z). The frequency support for a hybrid system combining full-angle SR with circular IR is given by88,96
$$ \mathit{\Gamma }_{x}^{\text{Int}}=\mathit{\Gamma }_{y}^{\text{Int}}=\frac{4n\text{sin}\theta }{\lambda }\mathbf{,}\;\;\mathit{\Gamma }_{\textit z}^{\text{Int}}=\frac{2\mathrm{n}\textit{sin}\theta }{\lambda } $$ (11) If the system incorporates multiaxis specimen rotation alongside full illumination scanning, the OTF evolves into an even larger sphere with a radius equivalent to the extended lateral cut-off of the IR mode88.
$$ \mathit{\Gamma }_{x}^{\text{iso}}=\mathit{\Gamma }_{y}^{\text{iso}}=\mathit{\Gamma }_{\textit z}^{\text{iso}}=\frac{4\mathrm{n}\textit{sin}\theta }{\lambda } $$ (12) However, this “ultimate” resolution has a trade-off with temporal resolution. The acquisition process is inherently time-consuming because of multidimensional scanning, and the complex mechanical manipulation (e.g. dual-axis rotation within a capillary) poses significant challenges to system stability and sample viability. In addition, wavelength scanning has been utilised to probe different frequency shells101–103. However, wavelength variation provides insufficient frequency coverage for high-resolution tomography and is most effective when used as a supplementary degree of freedom alongside angular scanning104.
An alternative 3D RI imaging technique is 3D deconvolution microscopy105,106, which is referred to as partially coherent optical diffraction tomography. In this method, the 3D refractive index distribution of a sample is obtained by deconvolution from a through-focus intensity image stack107. The stack can be obtained by mechanically moving the sample or objective or by using an electrically tuneable lens. The 3D RI distribution can be obtained by deconvolution calculation of intensity patterns measured at different axial planes105,108 because the recorded intensity distribution can be expressed as the convolution of the scattering potential of the sample with a point-spread function under the first-order Born approximation. This approach provides a straightforward method for data acquisition; however, it inherently suffers from limited axial resolution compared with tomographic methods. Recently, improvements have been reported using low-coherence sources or advanced deconvolution algorithms109–111.
-
Various QPI techniques have been employed to retrieve the phase of transmitted light field at each angle, as summarised in Fig. 4. These strategies can be broadly categorised into three classes: interference-based, refraction-based, and diffraction-based QPI. The key advantages, disadvantages, and typical biological applications of these strategies are summarised in Table 2.
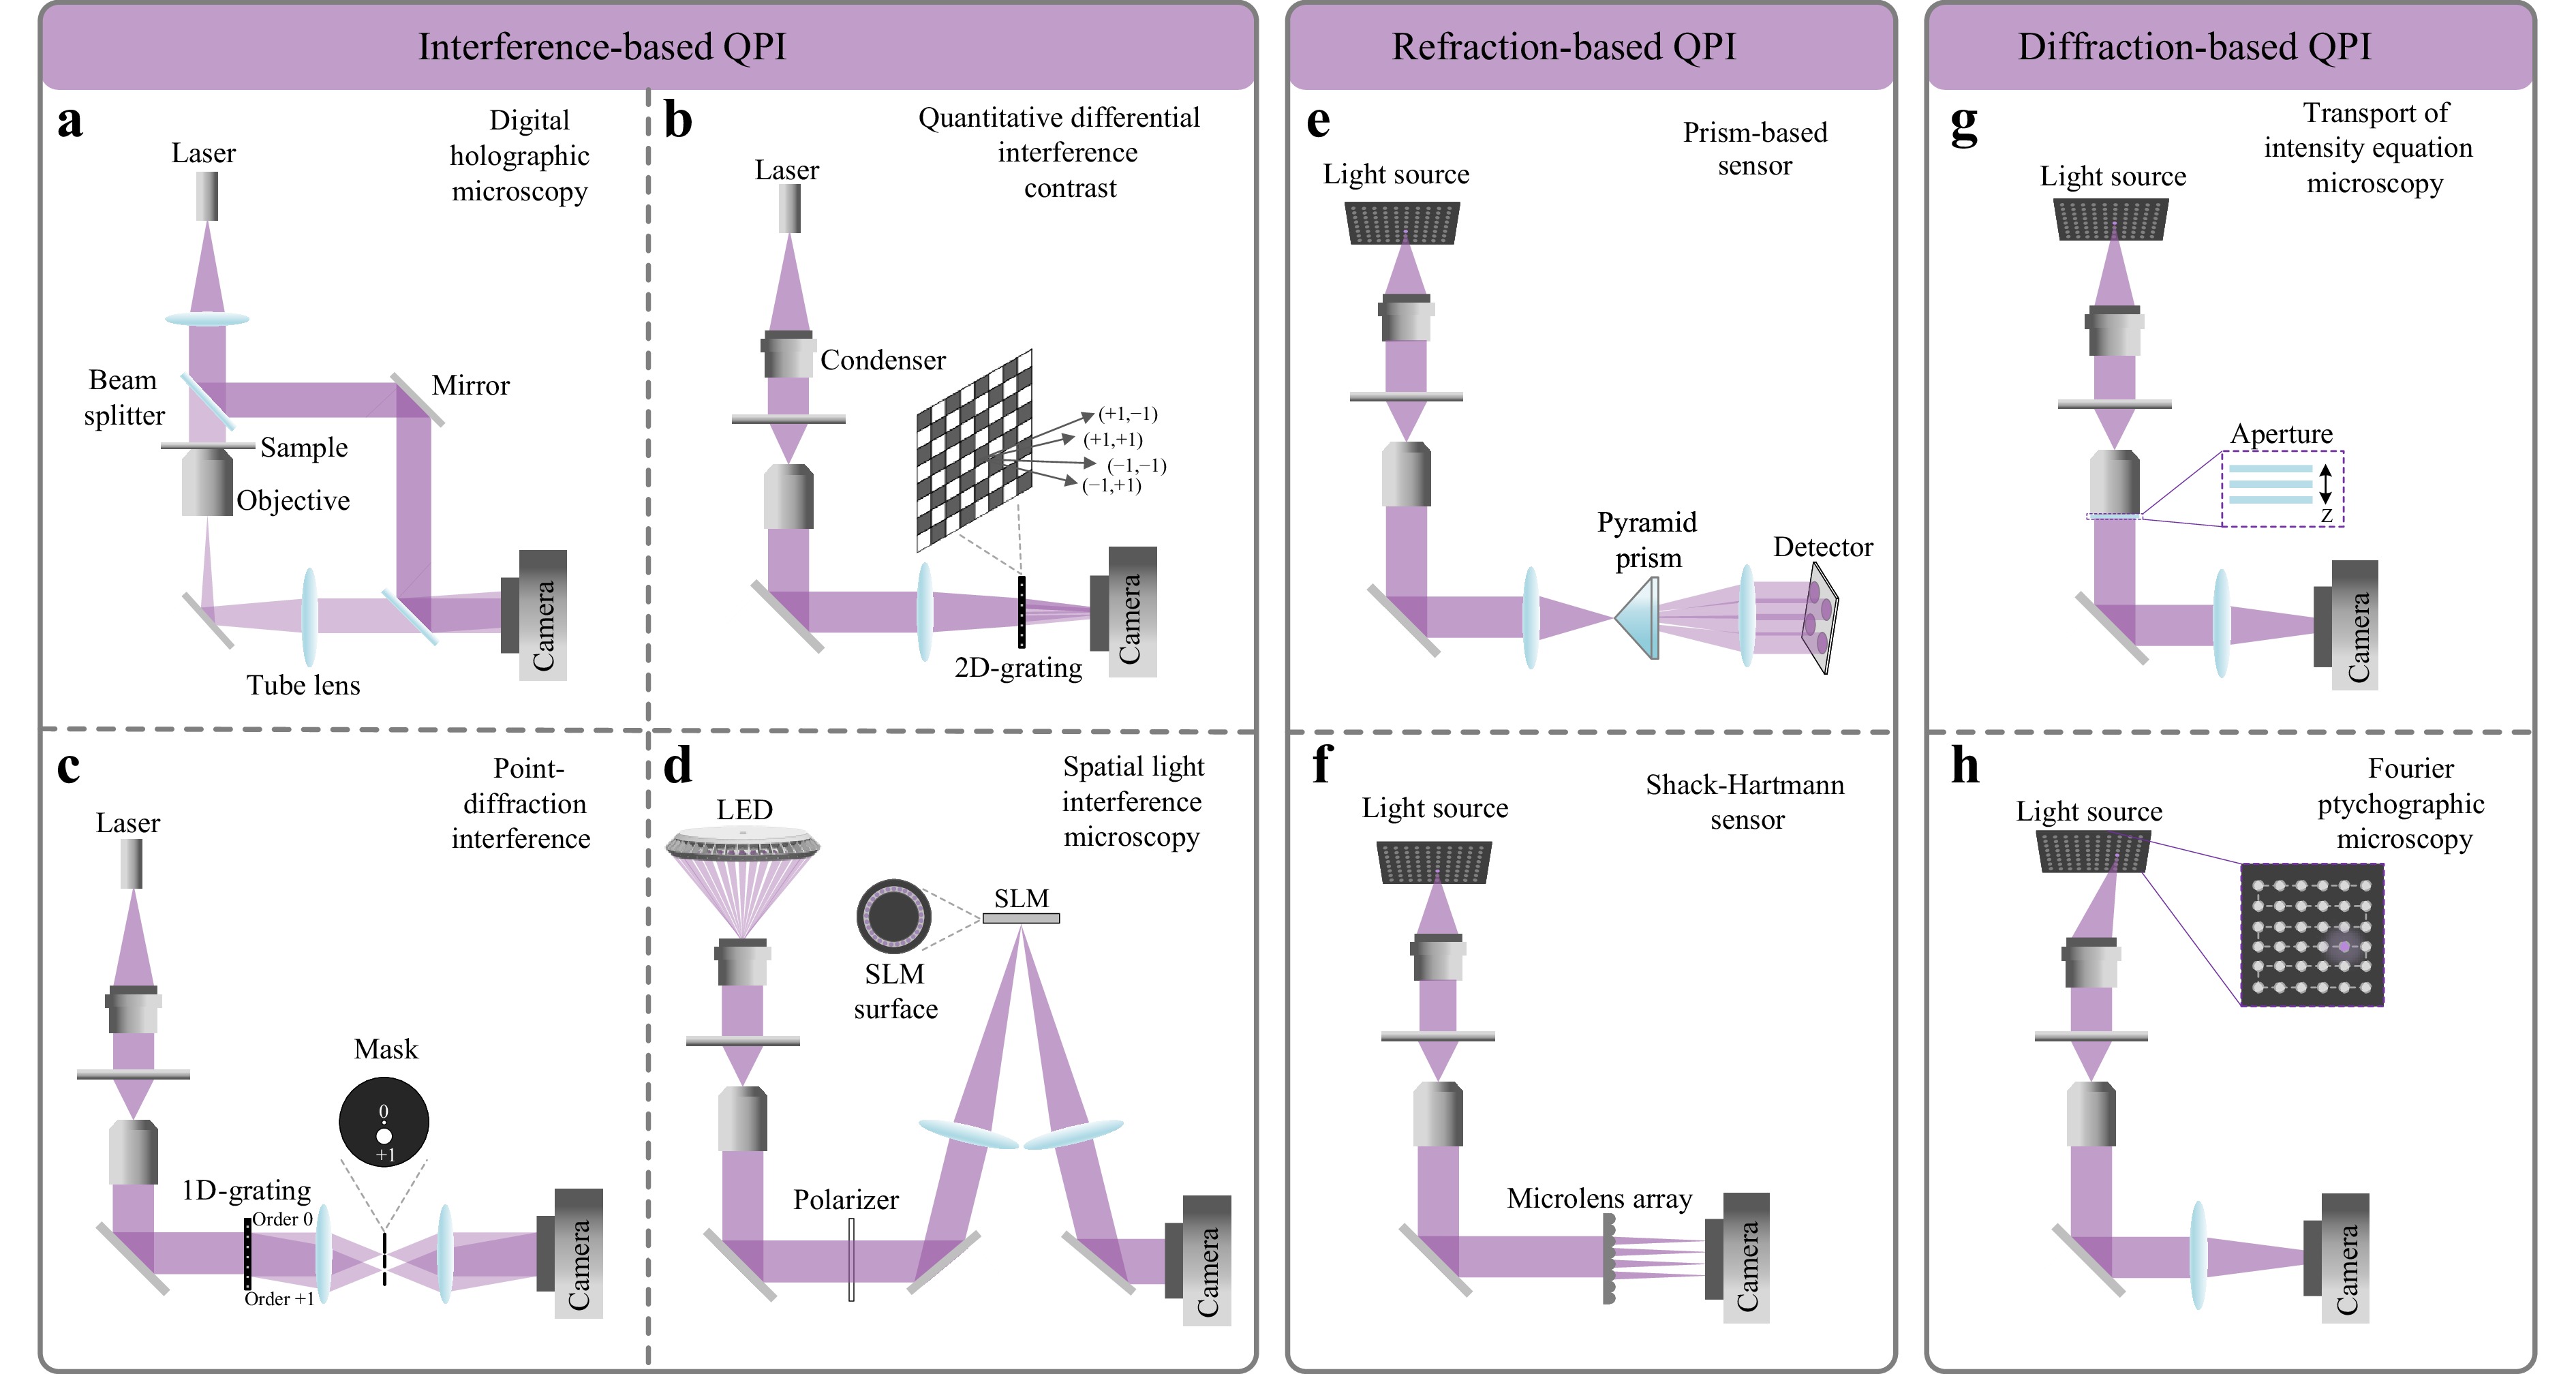
Fig. 4 Overview of QPI strategies. a-d Interference-based QPI. a Digital holographic microscopy with a Mach-Zehnder configuration. b Quantitative differential interference contrast microscopy using a 2D-grating. c Point-diffraction interference based QPI. d Spatial light interference microscopy employing an SLM for phase modulation. e-f Refraction-based QPI. e Pyramid wavefront sensor. f Shack-Hartmann wavefront sensor utilising a microlens array. g-h Diffraction-based QPI. g Transport of intensity equation based QPI. h Fourier ptychographic microscopy.
Category Technique Resolution Sensitivity Complexity Speed Advantages Disadvantages Interference-based DHM,
Point-diffractionHigh,
up to diff-limitVery high Complex Acq: real-time
Recon: fastAnalytical,
fastVibration sensitive, coherent artifacts qDIC,
SLIMModerate Moderate Simple Acq: fast
Recon: fastHighly stable,
easy integrationNot suited for stair-alike phase samples Refraction-based Shack-Hartmann, Prism Low Low Simple Acq: real-time
Recon: fastIncoherent light, extremely fast Low spatial resolution Diffraction-based TIE High Moderate Simple Acq: fast
Recon: fastSimple setup Not suited for stair-alike phase samples FPM High,
up to diff-limitModerate Moderate Acq: slow
Recon: slowLarge FOV,
high-resolutionSlow DHM, digital holographic microscopy; qDIC, quantitative differential interference contrast microscopy; SLIM, spatial light interference microscopy; TIE, transport of intensity equation; FPM, Fourier ptychographic microscopy Table 2. Comparison of typical QPI techniques
Interference-based methods (Fig. 4a-d) remain the gold standard for phase accuracy. The most widely adopted configuration is DHM (Fig. 4a), typically using a Mach-Zehnder setup112,113. Other interferometric variations include quantitative differential interference contrast114,115 (Fig. 4b), which introduces shearing interference via a 2D grating, point-diffraction interference116 (Fig. 4c), and spatial light interference microscopy (SLIM, Fig. 4d) utilising liquid crystal modulation117–119. Interference-based approaches have led to successful commercialisation; for example, 3D IR imaging systems from Nanolive120 and Tomocube121 predominantly utilise the illumination scanning strategy combined with DHM (Fig. 4a) to ensure high-throughput live-cell analysis.
Alternatively, refraction-based methods Fig. 4e, f function as wavefront sensors, directly measuring phase gradients. Representative techniques include a pyramid sensor (Fig. 4e) or a Shack-Hartmann sensor (Fig. 4f), which samples the wavefront slope using a microlens array. Despite being effective for adaptive optics, their integration into ODT is less common compared with other modalities. However, these wavefront sensors significantly simplify the setup and boost the stability of ODT122.
The third type of phase retrieval approaches is diffraction-based approaches. These approaches Fig. 4g, h record intensity patterns as the illumination angle, or the defocusing distance is varied. The phase distributions can be calculated from the recorded intensity images. Early iterative phase retrieval methods such as the Gerchberg-Saxton algorithm and its error-reduction variants123,124 were employed to recover missing phase distributions from recorded intensity images using an iterative process and enforcing physical constraints such as non-negativity or support constraints in the spatial and Fourier domains125. Intensity diffraction tomography (IDT)126 is a representative of diffraction-based 3D RI imaging approaches. The IDT acquires phase distributions by recording intensity patterns (Fig. 4g) and using the transport of intensity equation. Another representative is Fourier ptychographic microscopy (Fig. 4h), which synthesises a large NA using angular diversity127–132. 3D RI imaging was achieved by combining sequential LED illumination with the transport of intensity equation133. This configuration significantly enhances system stability and compactness while avoiding coherent noise. This method has demonstrated the capability to achieve high-resolution 3D imaging (206 nm laterally and 520 nm axially) of live cells, offering a powerful, robust alternative to traditional interferometric ODT133.
-
3D RI imaging has been widely employed for the investigation of internal structures and dynamic processes within diverse, transparent specimens across various disciplines as it is a powerful, label-free, and quantitative imaging modality. In this section, we review the diverse applications of 3D RI imaging in two domains: Biological applications and nonbiological applications (material science and industrial inspection), focusing on nondestructive imaging and precision metrology.
-
Unlike traditional methods that rely on exogenous contrast agents or sample preparation, quantitative 3D RI imaging enables the label-free classification of different cell types and cell sorting, as well as the monitoring of cellular morphology changes in pathological conditions134. Therefore, in the biomedical field, QPI serves as one of the mainstreaming techniques for achieving high-precision 3D refractive index imaging in a label-free and quantitative manner135. Biological specimens such as cells and tissues are transparent “phase objects” that exhibit low contrast under conventional intensity-based microscopy. ODT enables the quantitative 3D visualisation of biological structures and precise measurement of physiological parameters, including morphological, mechanical, and chemical properties (e.g. dry mass density and protein concentration).
First, ODT enables 3D RI imaging at the single-cell level136,137. Fig. 5 illustrates the typical ODT workflow for reconstructing the 3D RI distribution of an individual RBC138. Red blood cells (RBCs) represent an ideal model for single-cell analysis because of their functional importance in oxygen transport and their intrinsic correlation with various haematological disorders139. The process begins with capturing a series of 2D quantitative phase images (Fig. 5b) when illuminating the RBC from various incident angles using an interferometric setup (Fig. 5a). Based on FDT, these 2D complex optical fields are mapped onto Ewald spheres in the 3D Fourier space (Fig. 5c). Iterative non-negative constraint algorithms are applied to fill the 3D frequency support for addressing the missing cone problem inherent in limited-angle tomography (Fig. 5d). Subsequently, an inverse Fourier transform yields the final 3D RI tomogram (Fig. 5e), clearly revealing the characteristic biconcave discocyte shape of a healthy RBC. Utilising these RI tomograms, various haematological disorders can be analysed based on morphological and biochemical alterations.
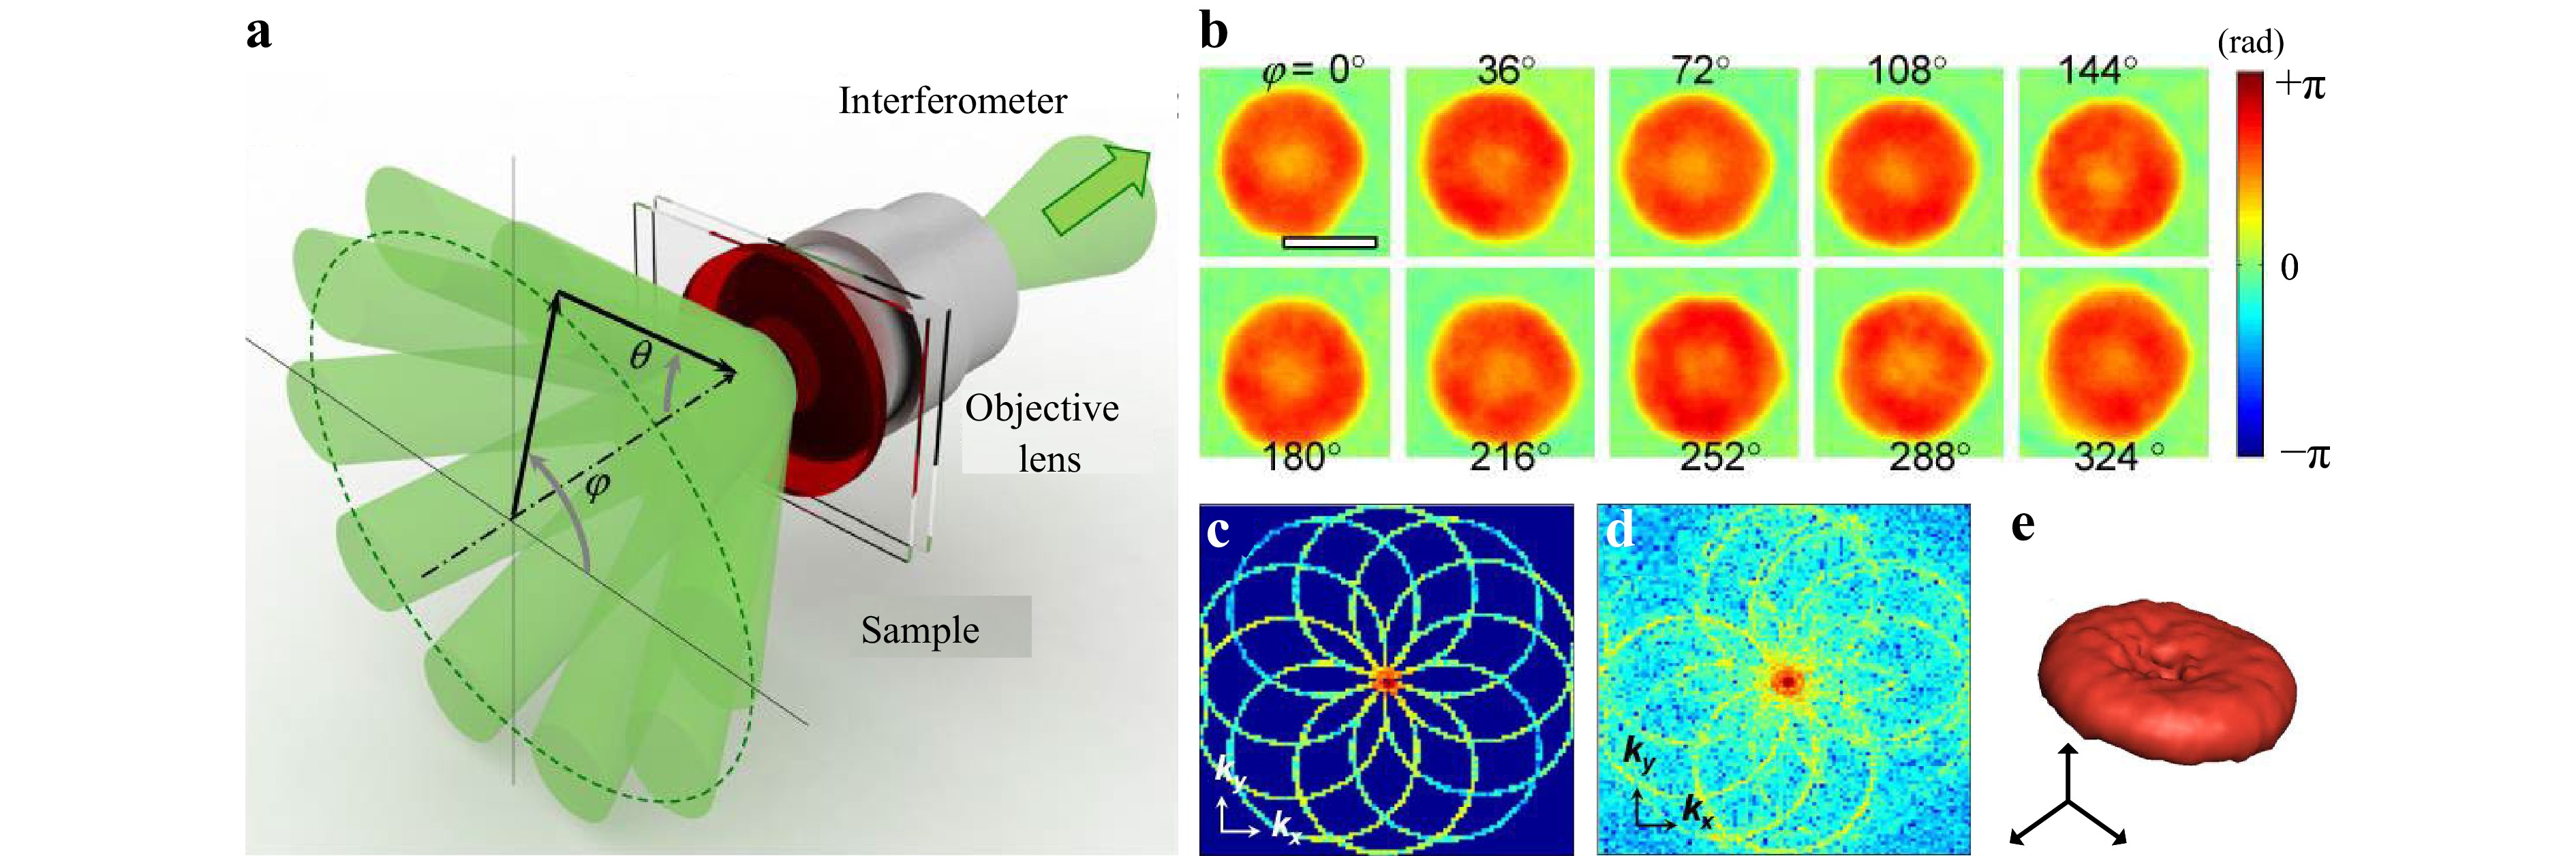
Fig. 5 3D RI imaging of biological cells using ODT. a Experimental configuration for illuminating the sample with varying incident angles (θ, ϕ). b Retrieved quantitative phase images of a representative red blood cell at ten distinct azimuthal angles. c Mapping the 2D Fourier spectra from the measured fields into the 3D Fourier space (Ewald spheres) based on diffraction theory. d The filled 3D frequency spectrum is obtained after applying an iterative non-negativity constraint algorithm to compensate for missing information. e The final reconstructed 3D RI distribution of the RBC rendered after 3D inverse Fourier transform. Scale bar in b: 5 μm; Adapted from Ref. 138.
1) Iron deficiency anaemia: Characterised by a marked reduction in cell volume and haemoglobin (Hb) content.
2) High reticulocyte count: Identified by significantly increased mean volume, indicative of immature RBCs.
3) Hereditary spherocytosis: Distinguished by the loss of the biconcave shape, presenting a spherical morphology.
The ODT data enables the rigorous quantitative classification of these conditions by correlating derived morphological metrics (e.g. volume and sphericity) with biochemical parameters (e.g. Hb concentration), thereby offering a promising avenue for label-free automated diagnosis136.
Second, the utility of ODT has been extended to intricate subcellular organelles in complex eukaryotic cells. As illustrated in Fig. 6a, ODT with adaptive optics (AO) is applied to the visualisation of multiple subcellular organelles in 3D RI tomogram of HeLa cells126. Magnified sections at various axial depths (Fig. 6b-d) clearly resolve different subcellular details, including lipid droplets, nucleoli, mitochondria, and filopodia. Further, Fig. 6e, f highlights the indispensable role of AO in longitudinal studies, i.e. compensating for time-varying aberrations and focus drift. However, a major challenge in the label-free imaging of complex cells is specificity, identifying which organelle corresponds to a specific high-RI region. Fig. 6g, h addresses this challenge by incorporating ODT with the fluorescent imaging of structured illumination microscopy (SIM)140. This hybrid system (Fig. 6g) enables the simultaneous acquisition of 3D RI distributions and super-resolution fluorescence images, which enables the correlative analysis of subcellular structures. As demonstrated in live COS-7 cells (Fig. 6h), this multimodal capability is crucial for organelle identification. The high-RI structures observed in the label-free ODT channel (centre) show precise colocalisation with mitochondria labelled by Mito-Tracker Green in the SIM channel (left). This validation confirms that ODT can effectively resolve intricate organelles such as mitochondria based on their intrinsic RI contrast. Such correlative imaging bridges the gap between morphological information and molecular specificity, providing a comprehensive toolkit to study subcellular dynamics and organelle interactions in live cells without the phototoxicity associated with continuous fluorescence imaging. After training a neural network with ODT-fluorescent image pairs, it is possible to refer different sub-cellular organelles from a 3D ODT map141–144.
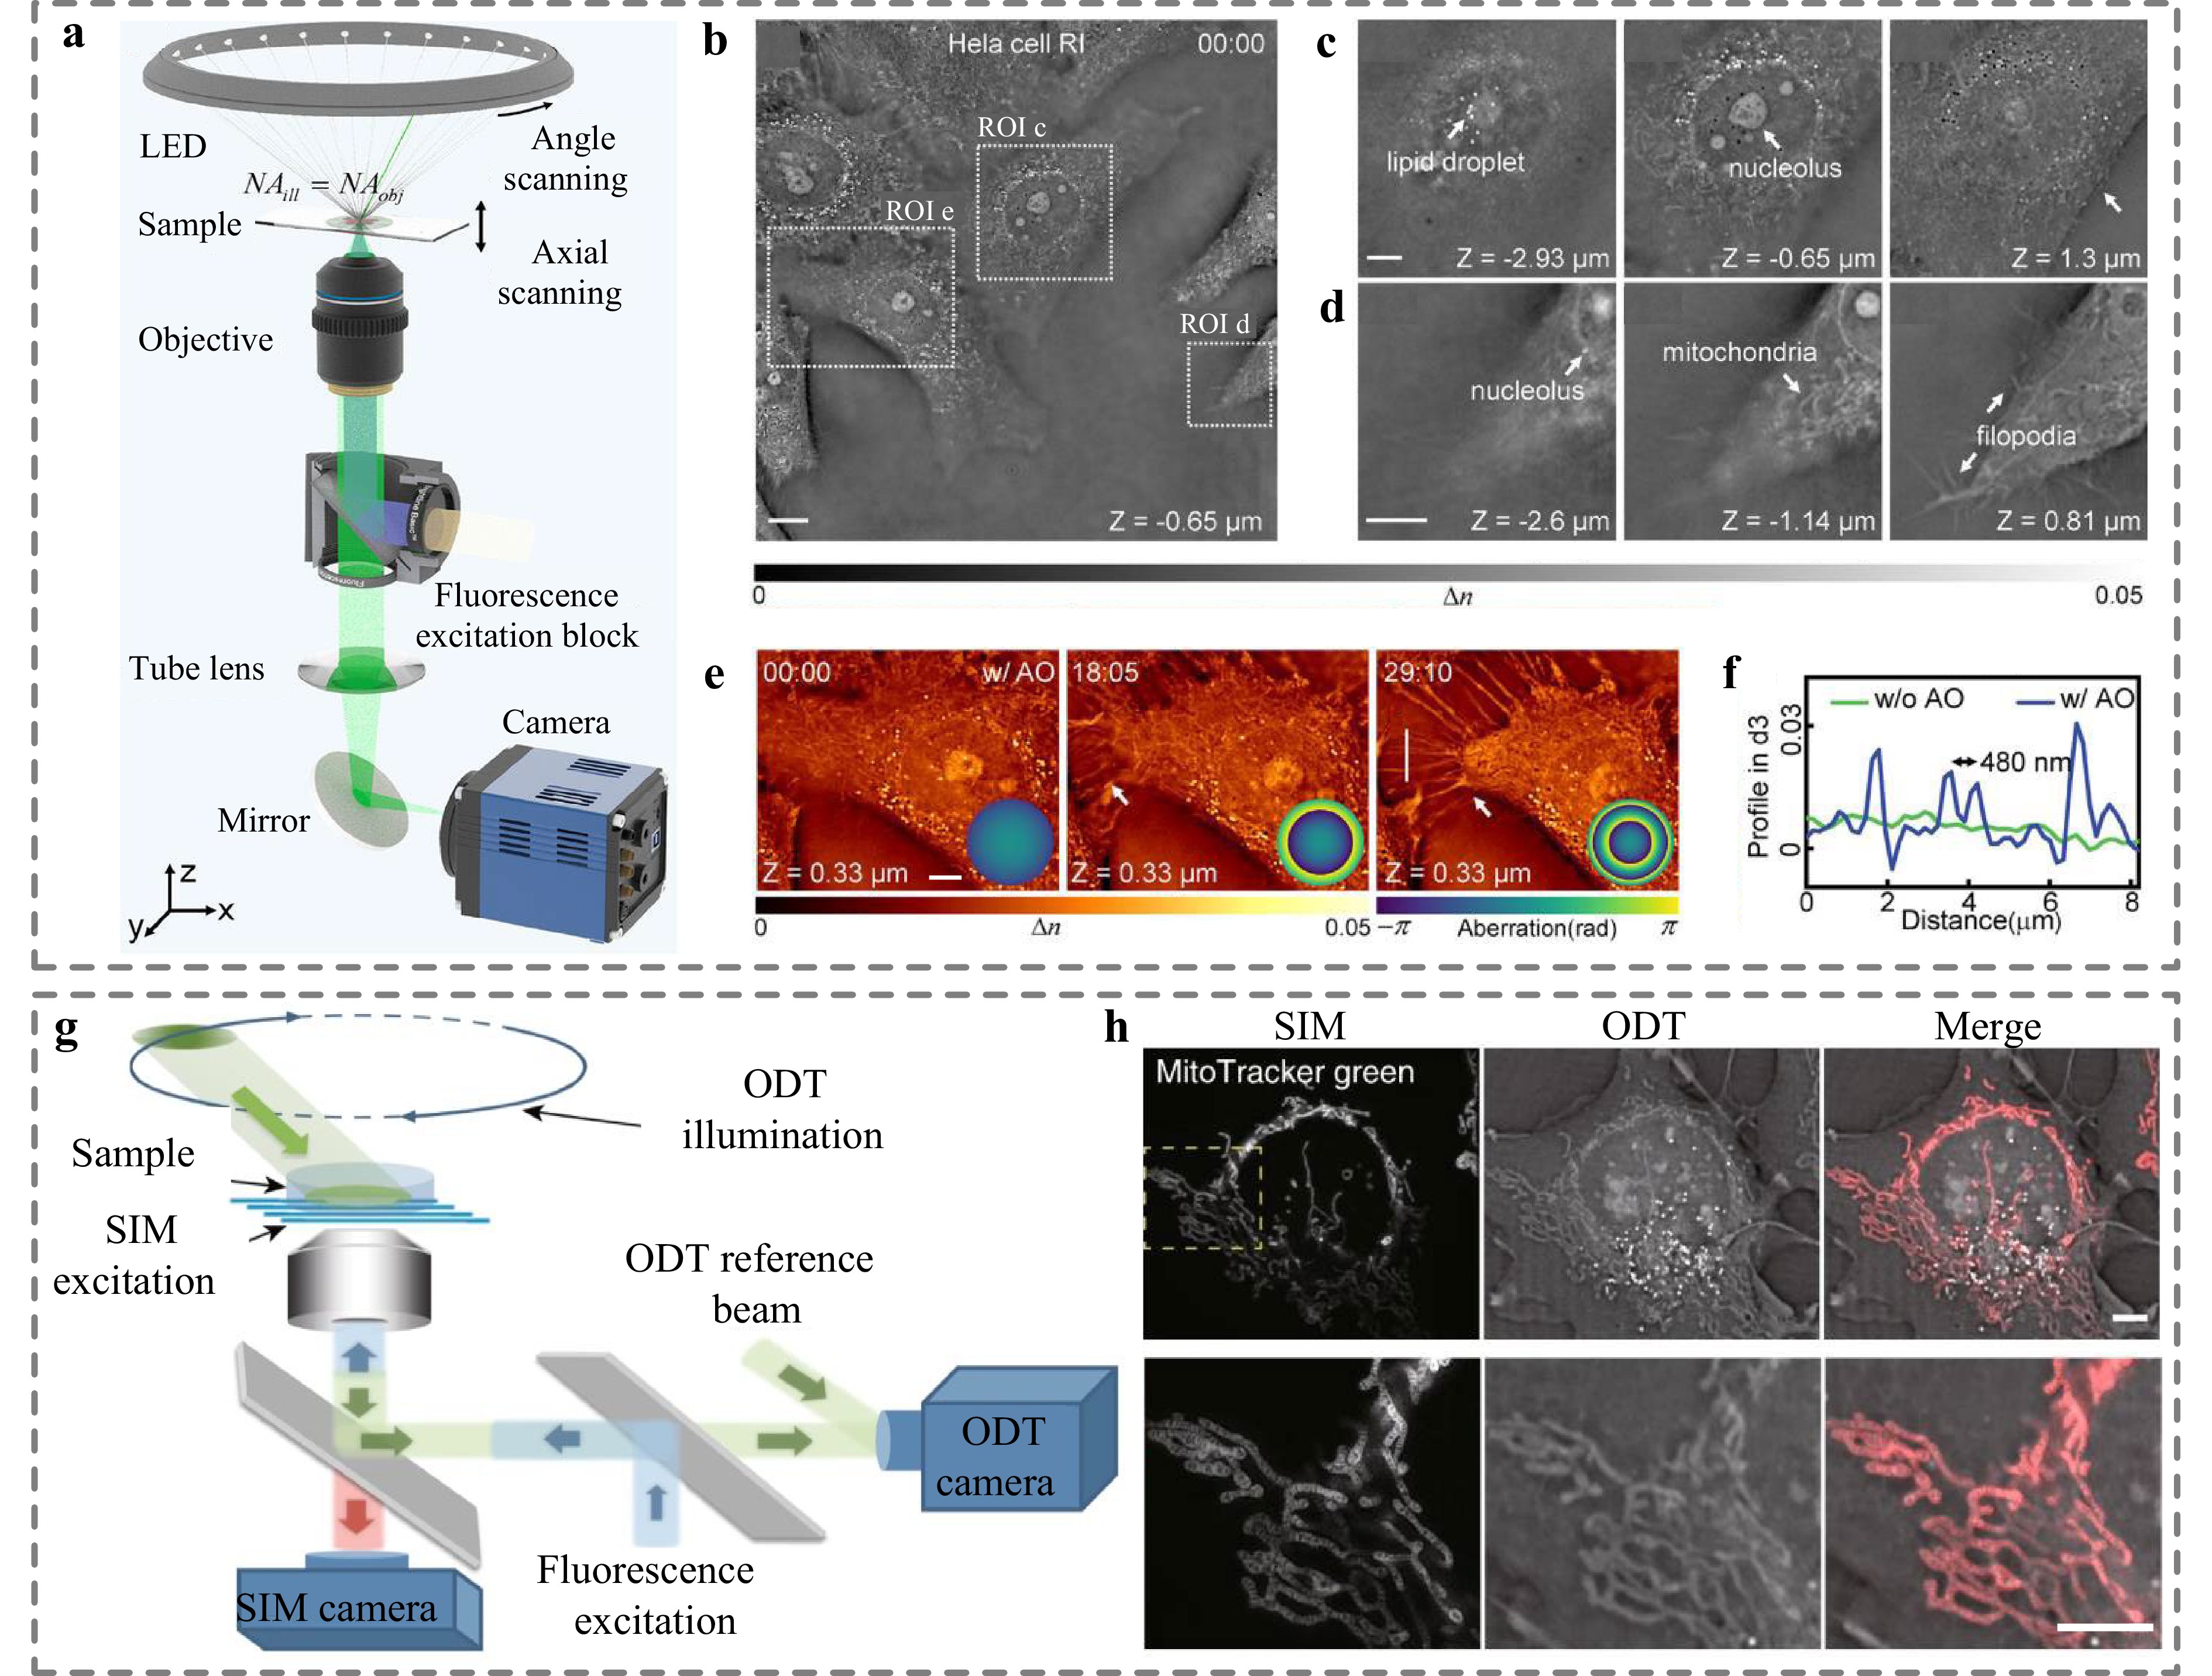
Fig. 6 3D RI imaging of subcellular organelles. a Schematic of the AO-FIDT setup. b Full-field RI slice of HeLa cells. c, d Magnified views of ROIs in b, revealing 3D subcellular structures (lipid droplets, nucleoli, mitochondria, and filopodia) at different depths. e Time-lapse monitoring of cell apoptosis with AO correction; insets show aberration patterns. f RI profiles comparing image quality with (blue) and without (green) AO. g Schematic of the dual-mode setup combining ODT and SIM. h Correlative imaging of mitochondria in live COS-7 cells. Top row: Full field-of-view images showing mitochondrial fluorescence (SIM), RI map (ODT), and their overlay. Bottom row: Counterparts of the magnified ROI (yellow box). Scale bars: 10 μm b and 5 μm c, d, e, h. (Panels a-f adapted from Ref. 126; panels g, h adapted from Ref. 140).
Third, ODT is increasingly applied to large-sized biosamples, such as organisms and tissues, which enable 3D histopathology without invasive sectioning or staining. This non-destructive capability preserves sample integrity, which is crucial for studying intricate developmental processes of an embryo. Beyond morphological structure, ODT can be extended to polarisation-sensitive imaging to probe molecular organisation, including the alignment of protein filaments. Fig. 7a-c demonstrate this capability using a polarisation camera setup (Fig. 7a)145. Although standard intensity imaging shows limited contrast, the reconstructed birefringence maps (Fig. 7b) reveal fine, periodic structures with high specificity. The orthogonal views (Fig. 7b) and stitched large field-of-view image (Fig. 7c) resolve the intricate internal alignment of fibres, wherein the polarisation property of the structures provides specific and functional insights. In addition, Fig. 7d-f display the volumetric reconstruction of a whole Caenorhabditis elegans (C. elegans) worm72,133. C. elegans is a fundamental model in developmental biology and neuroscience, which can be visualised in high resolution using ODT. The high-contrast 3D RI rendering (Fig. 7e) delineates internal anatomical structures, such as the pharynx, gut, and gonad arms over a large volume. Detailed lateral RI slices of the head region at various depths (Fig. 7f) reveal the internal organ layout. This capability enables the detailed assessment of morphological phenotypes in a label-free manner, facilitating developmental studies.
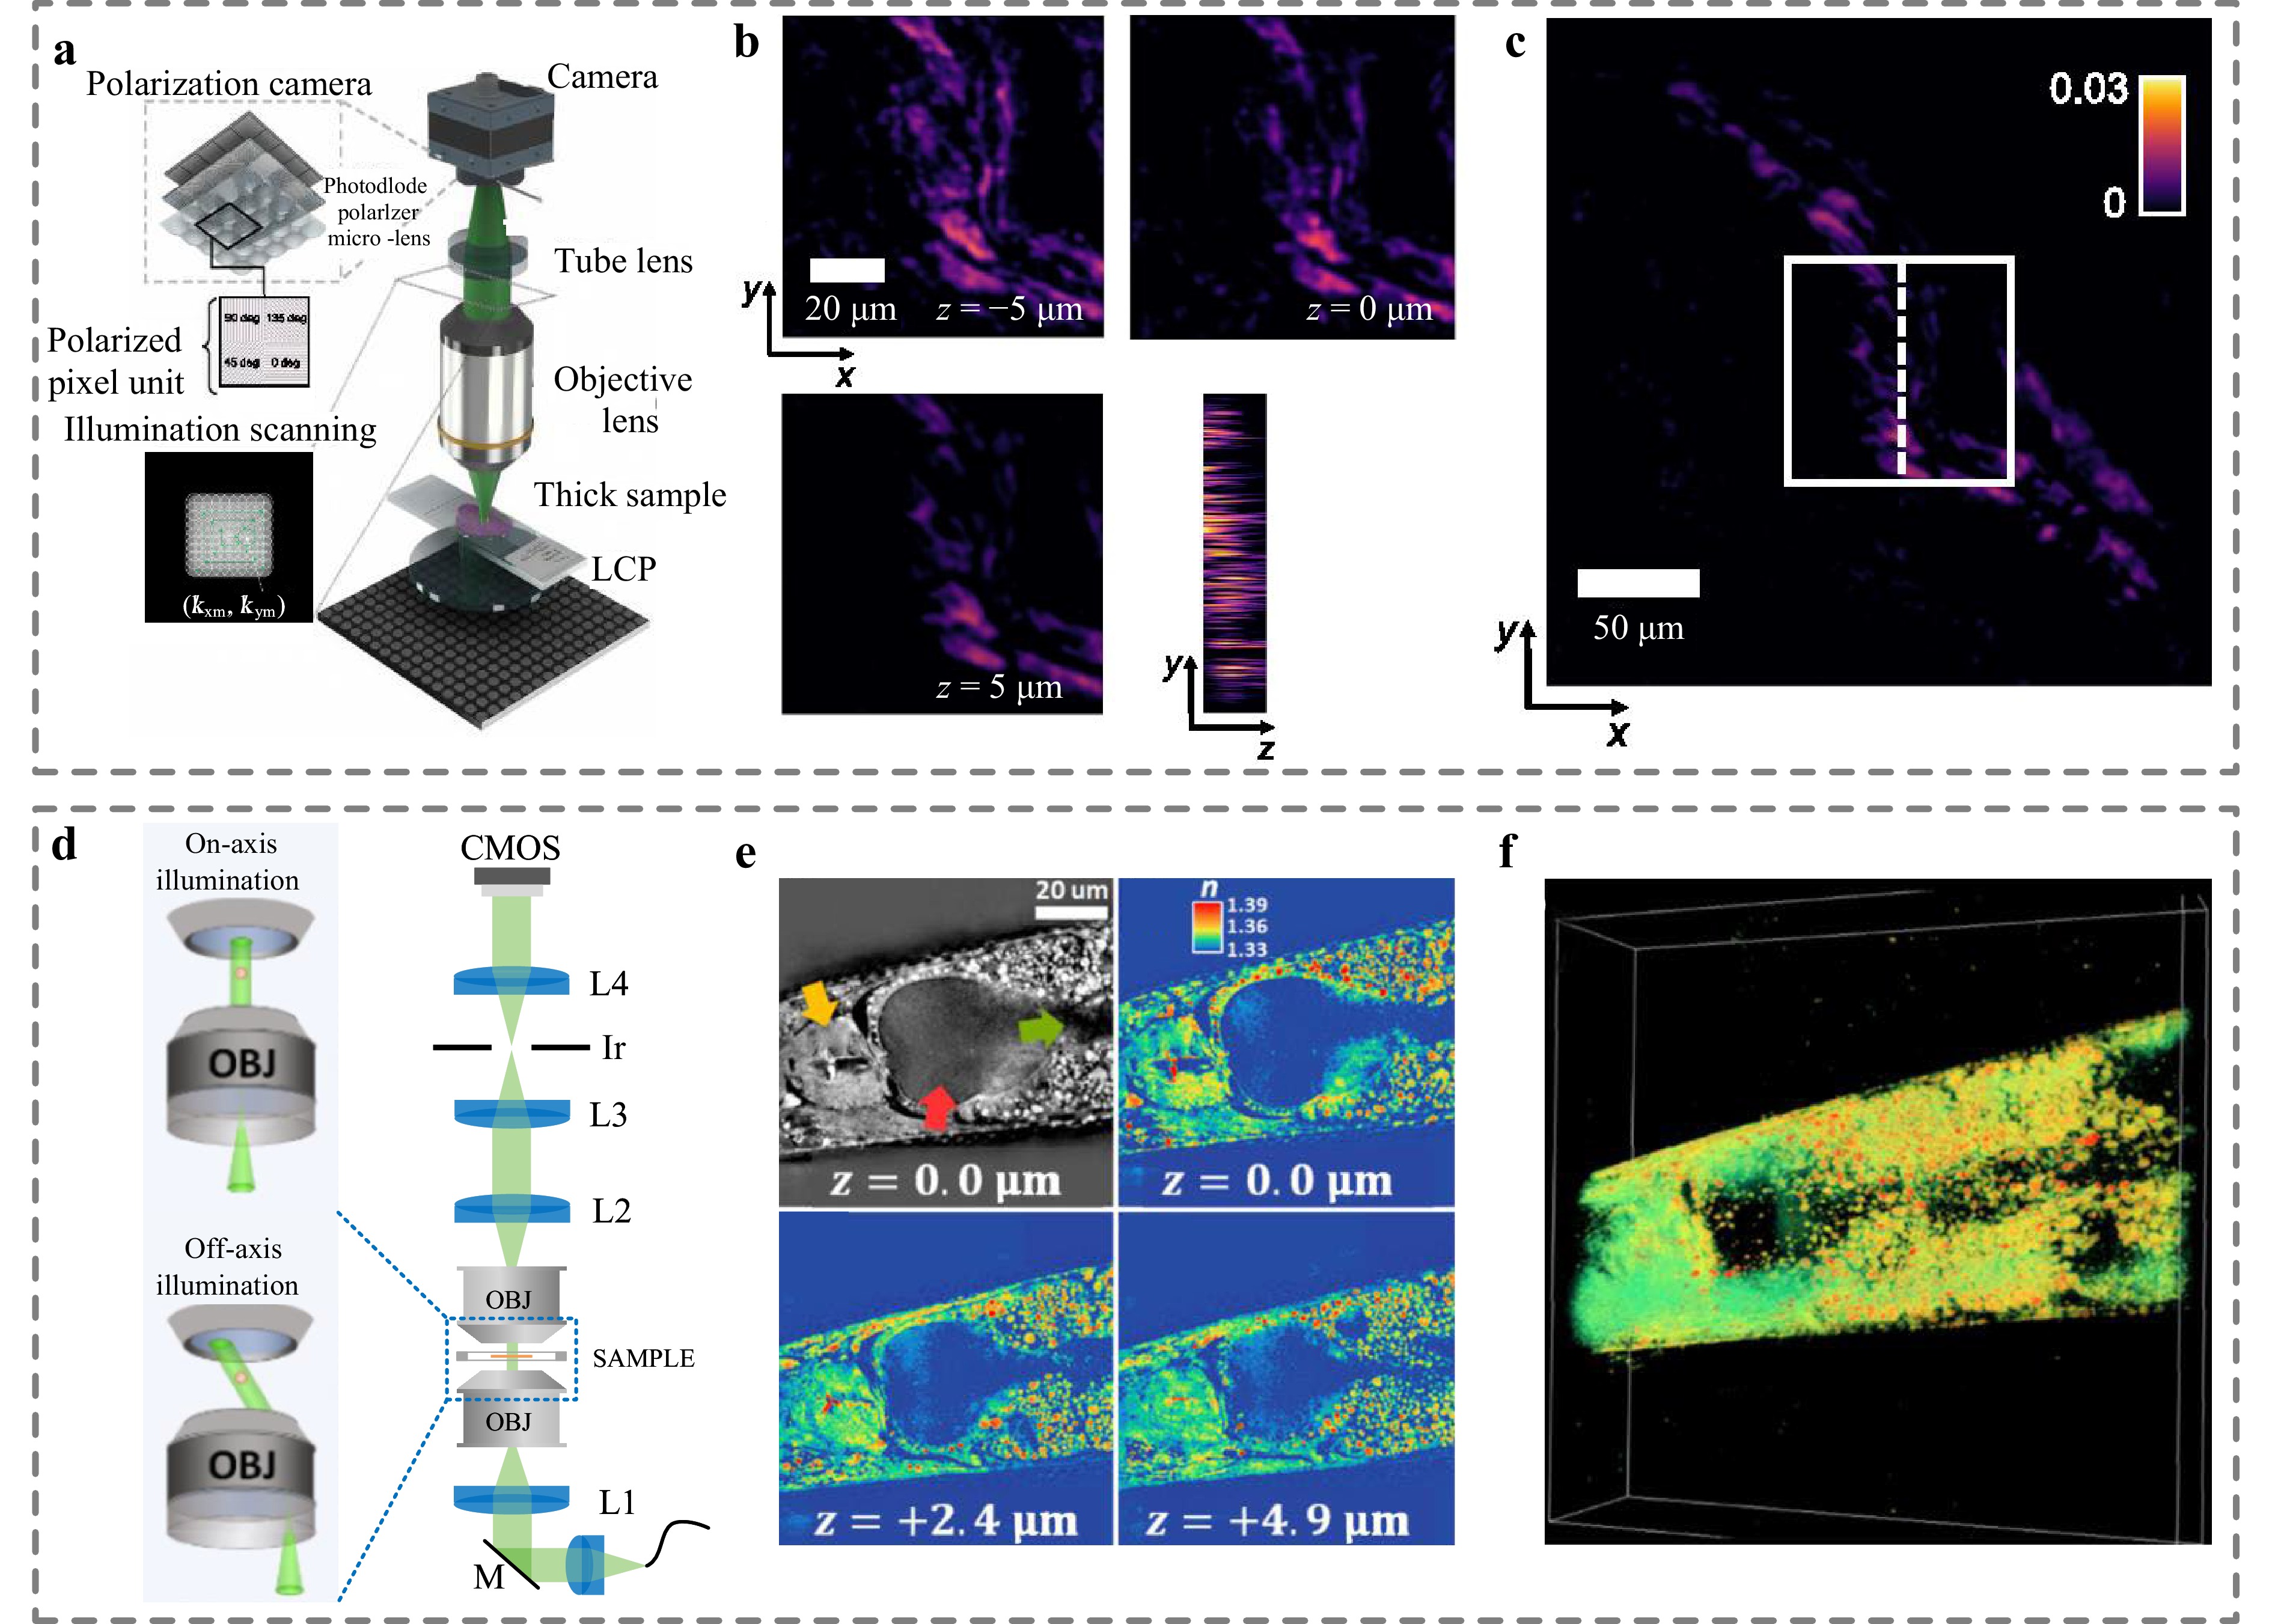
Fig. 7 3D RI imaging of large-scale tissues and organisms. a-c Polarisation-sensitive ODT. a Polarisation ODT setup. b Reconstructed birefringence maps at different depths. c Stitched large-field birefringence image. d-f 3D RI imaging of C. elegans. d Optical setup. e Lateral RI slices of the head region at various depths. f 3D RI map rendering internal anatomy. (Panels a-c adapted from Ref. 145; d-f adapted from Ref. 72).
-
3D RI distribution is transformative for material science and industrial inspection34,92. 3D RI distribution is directly linked to the functions of many materials and devices such as optical fibres, microlenses, and polymer microparticles. Conventional characterisation techniques such as scanning electron microscopy or atomic force microscopy are limited to surface topology and often require complex sample preparation. In contrast, ODT offers a non-destructive manner to screen internal defects, density inhomogeneities, and 3D structural integrity.
3D RI imaging was employed for the high-precision characterisation of optical fibres as a fundamental optical element in optical communications. As illustrated in Fig. 8a-c, Fan et al. proposed an iterative ODT approach (iODT) to accurately measure the RI profiles of fibres. The 3D RI distribution of optical fibres were obtained using the interferometric setup shown in Fig. 8a and an iterative reconstruction algorithm146. The comparison in Fig. 8b clearly shows that iODT suppresses artifacts and distortions present in CT and standard ODT results. The quantitative accuracy is further verified by cross-sectional profiles in Fig. 8c, demonstrating sub-wavelength resolution and precise RI value retrieval.
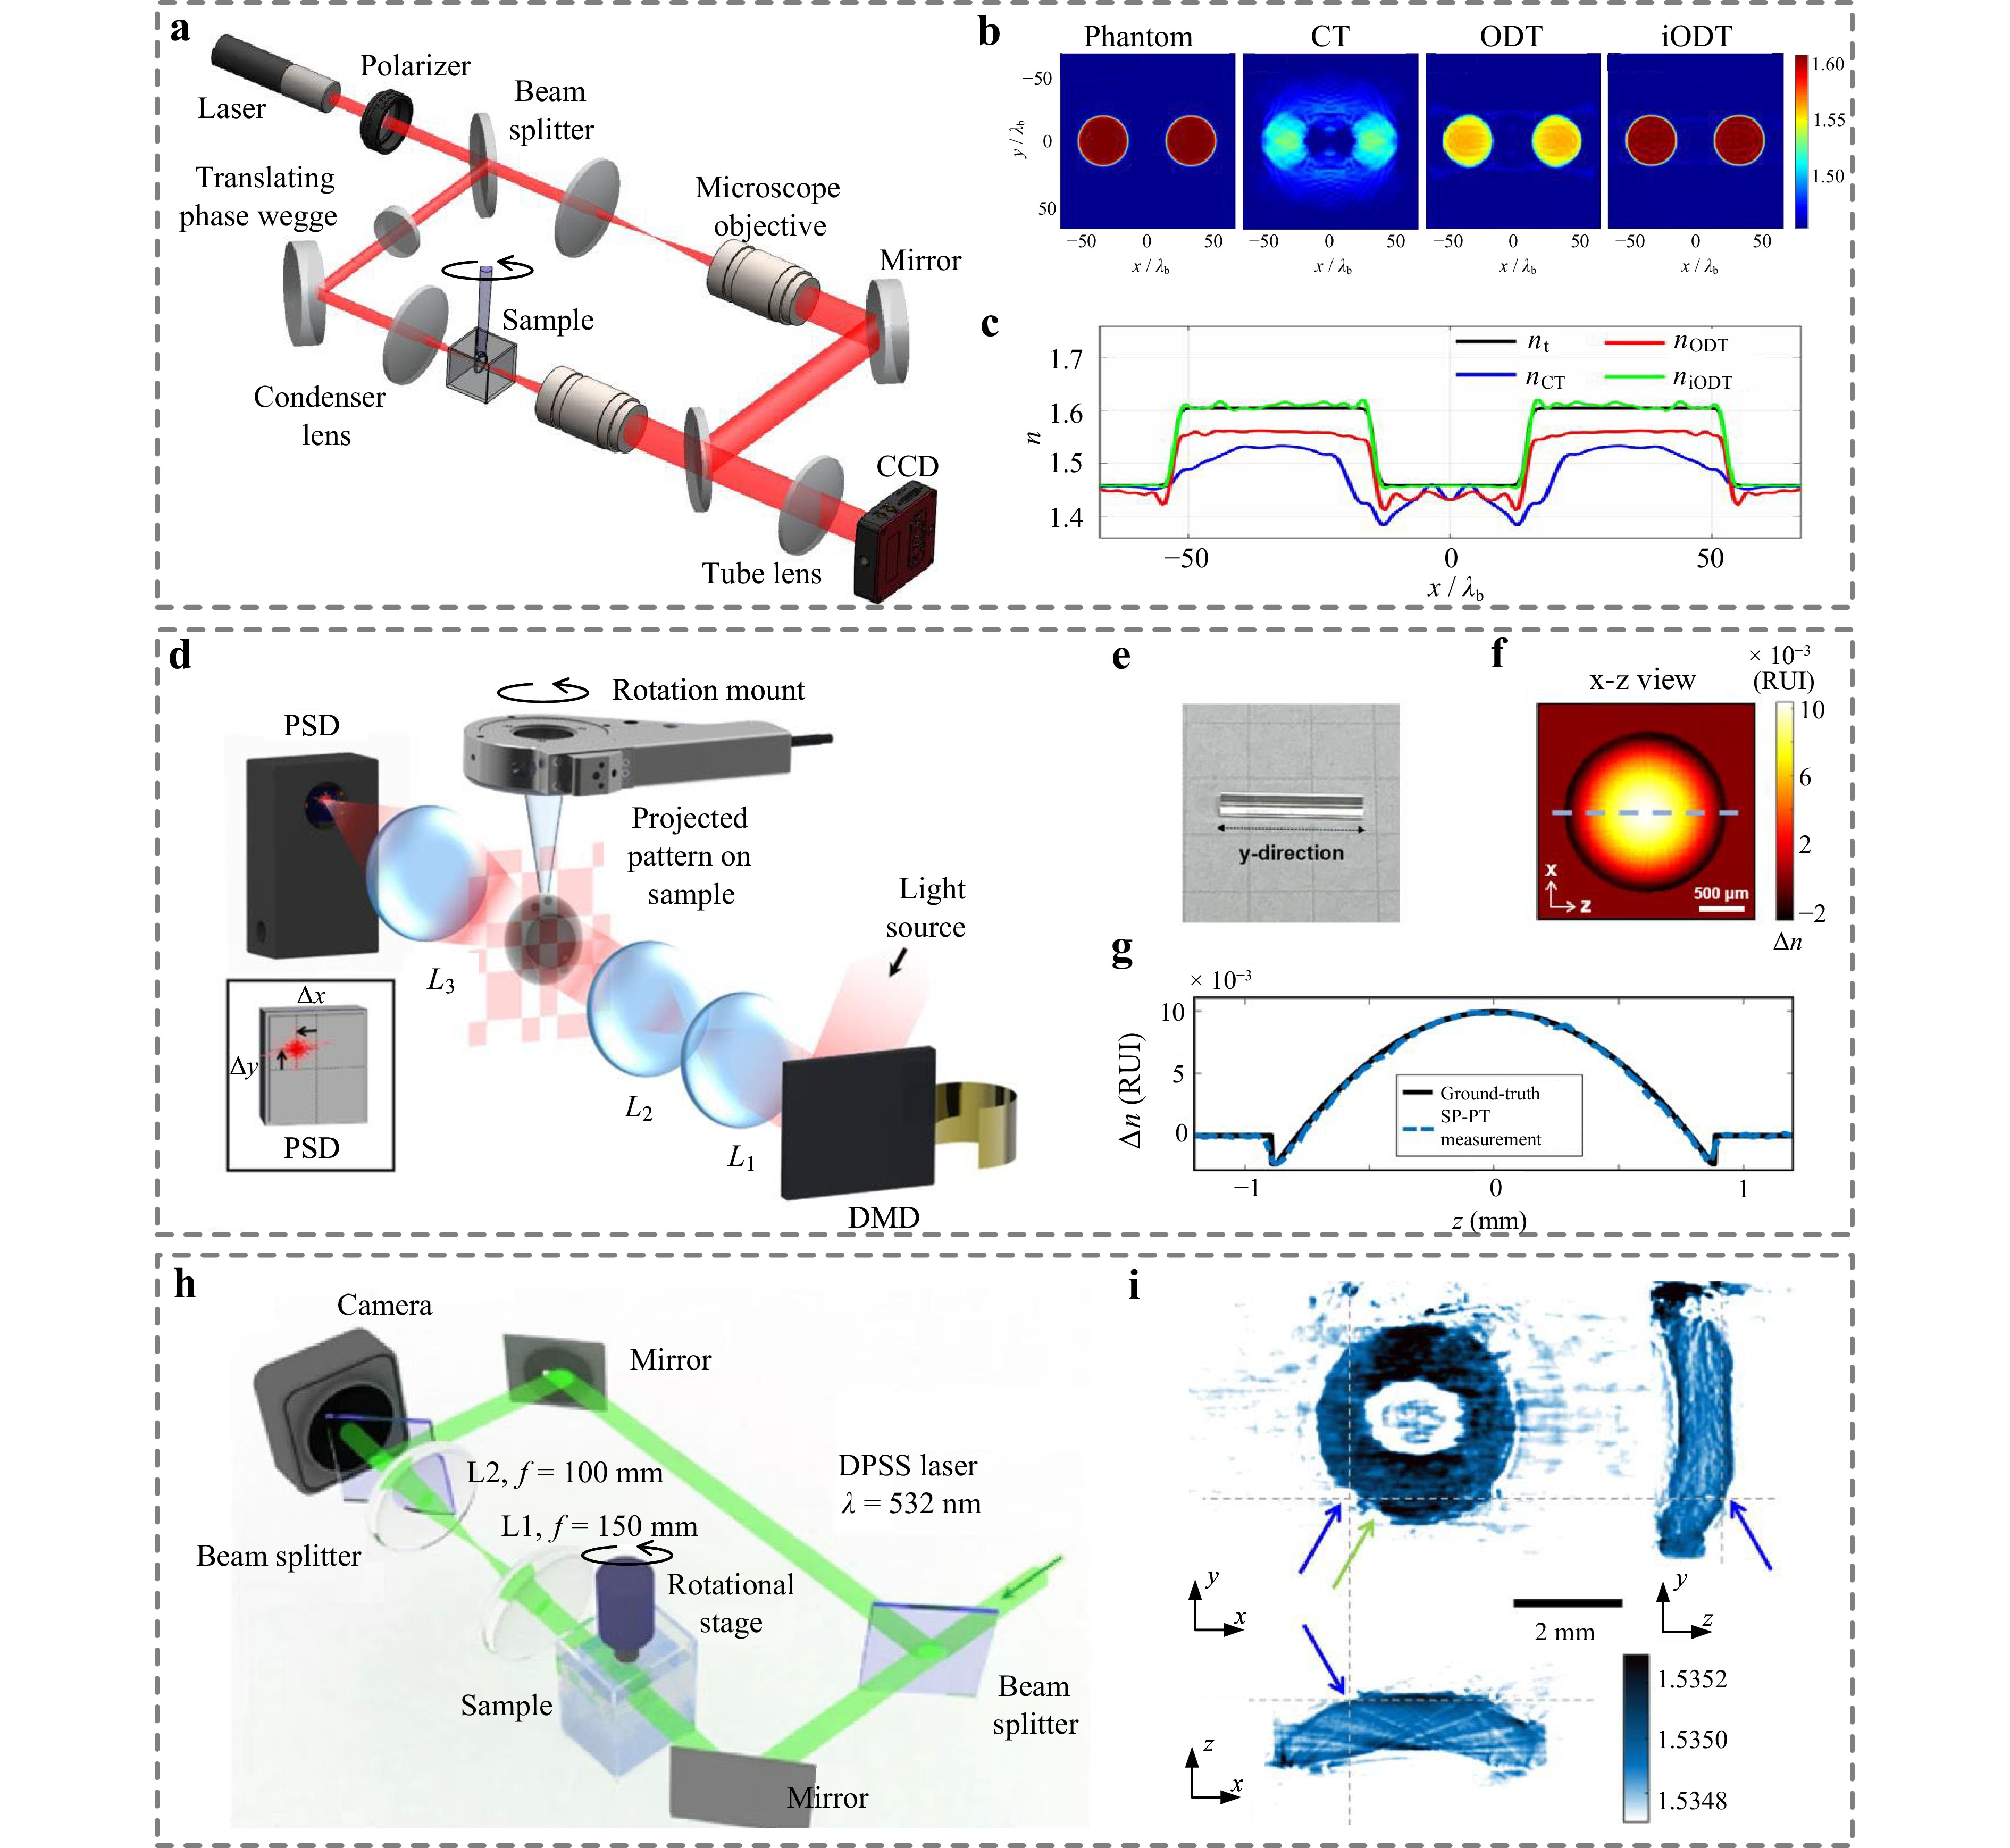
Fig. 8 3D RI imaging of nonbiological samples for optical metrology and material characterisation. a-c Refractive index profiling of optical fibres using iterative optical diffraction tomography (iODT). a Schematic of the interferometric imaging setup. b Reconstructed RI distributions of a two-core fibre phantom comparing the ground truth with results from CT, conventional ODT, and iODT. c Cross-sectional RI profiles demonstrating the quantitative accuracy and artifact suppression of the iODT algorithm. d-g 3D RI imaging of a gradient-index (GRIN) lens using single-pixel photometric tomography (SP-PT). d Schematic of the SP-PT system. e Photograph of the cylindrical GRIN lens. f Reconstructed (x-z) cross-sectional RI map revealing the internal parabolic distribution. g Quantitative comparison between the measured RI profile and ground truth. h, i 3D RI imaging of optical elements. h Experimental setup of ODT with sample rotation. i Orthogonal RI cross-sections (x-y, x-z, y-z) of a plastic lens, identifying laser-ablated defects (arrows) via local RI discontinuities. (Panels a-c adapted from Ref. 146; d-g adapted from Ref. 147; h, i adapted with permission from Ref. 148 © Optical Society of America).
3D RI imaging was employed for measuring lenses, which are the common optical components in building blocks of cameras, binoculars, and microscopes. A single-pixel photometric tomography was employed to profile the 3D RI of a gradient-index (GRIN) lens147, as shown in Fig. 8d-g. Using a DMD for spatial modulation and position-sensitive detector (Fig. 8d), the system reconstructs the 3D RI distribution of the cylindrical GRIN lens (Fig. 8e). The resulting x-z cross-sectional map (Fig. 8f) reveals the characteristic parabolic RI distribution inside the lens. As shown in the quantitative profile (Fig. 8g), the measured RI values align closely with the ground truth, verifying the capability of the ODT for high-precision optical inspection. ODT with sample rotation (Fig. 8h) was applied for the quality inspection of surface and internal defects in a large-scale plastic lens. As illustrated in Fig. 8i, laser-ablated defects on the surface of a plastic lens are clearly identified in orthogonal RI cross-sections (x-y, x-z, and y-z)148. Local discontinuities in the RI map provide high-contrast visualisation of the damage, which may be difficult to quantify using standard transmission microscopy.
In addition, conventional ODT faces a challenge in phase unwrapping when inspecting macroscale, dense samples with sharp gradients. Gradient optical diffraction tomography (GODT) was proposed to address this issue. GODT acquires phase gradients rather than the phase distributions of transmitted waves149. GODT bypasses phase-gradient integration bottlenecks and is therefore considered a highly promising tool for the optical metrology of thick and densely structured industrial materials.
Collectively, the above demonstrations establish ODT as a powerful non-destructive testing technique for industrial metrology, boosting the fabrication precision and structural integrity of next-generation micro-optical devices.
-
Measuring 3D RI maps plays a pivotal role in deciphering the pathophysiology of live cells and the structural integrity of industrial materials41,150–153. As a powerful label-free quantitative imaging technique, OT and ODT have evolved significantly, bridging the gap between qualitative microscopy and quantitative metrology. In this review, we summarised the fundamental principles, hardware configurations, and reconstruction algorithms of 3D RI imaging. Active illumination schemes utilising GMs, DMDs, SLMs, or programmable LED arrays emerged as the dominant configurations for 3D RI imaging because of their high speed and high repeatability. Illumination rotation-based 3D RI imaging offers a high transverse resolution, despite suffering from the “missing cone” problem, which results in anisotropic axial resolution. Conversely, sample-rotation OT/ODT achieves quasi-isotropic resolution but at the cost of acquisition speed and system complexity.
The future evolution of OT/ODT lies in the synergy between advanced hardware and intelligent computation.
Straightforward reconstruction algorithms enable 3D RI reconstruction in an analytical manner based on first-order Born or Rytov approximations. However, these algorithms require many/redundant illumination directions to fill the 3D spectrum of scattering potentials. Iterative approaches (e.g. deep learning) are proposed to tackle the above limitation, reshaping the 3D RI imaging field. As highlighted in recent developments, AI-driven approaches (e.g. implicit neural representations) not only effectively fill the “missing frequency” cones to suppress artifacts but also enable high-fidelity reconstruction from sparse data, significantly improving the temporal resolution for dynamic biological events154–160.
Despite these successes, several technical challenges remain:
1) Laser-based coherent systems often suffer from speckle noise and parasitic interference, which degrade image sensitivity. A growing trend to address this is using partially coherent light sources such as LEDs, or computational de-speckling algorithms.
2) The small depth of field and rigorous single-scattering assumptions limit the imaging of thick, multiple-scattering samples (e.g. tissues and embryos). Emerging multilayer scattering models and beam-propagation methods are developed to extend the depth capabilities of OT/ODT for mesoscopic imaging161–164.
The integration of OT/ODT with other modalities marks a new frontier for the future. Researchers can now achieve molecular specificity alongside morphological quantification by combining OT/ODT with fluorescence microscopy140 or Raman spectroscopy165. Moreover, polarisation-sensitive OT/ODT has opened new avenues for characterising anisotropic materials, extracting intrinsic properties such as local birefringence and orientation in muscle fibres and industrial polymers166–168. Beyond biology, OT/ODT is proving to be an irreplaceable tool in industrial metrology, enabling the non-destructive inspection of micro-optical elements and additive manufactured parts.
As these hardware and software innovations converge, OT/ODT is poised to transition from a specialised research tool to a standard instrument for diverse biomedical and industrial applications.
-
This research is supported by Scientific Research Innovation Capability Support Project for Young Faculty (ZYGXQNJSKYCXNLZCXM-123); National Natural Science Foundation of China (62575230, 62505242, 62335018, 12504392); Key Research and Development Program of Shaanxi Province (2024GH-ZDXM-05); Natural Science Foundation of Shaanxi Province (2025JC-YBQN-819, 2025JC-YBMS-695); China Postdoctoral Science Foundation (2024M762528); Fundamental Research Funds of the Central Universities (QTZX25067, ZYTS25127, ZYTS25133, XJSJ25008); and Xidian University Specially Funded Project for Interdisciplinary Exploration (TZJH2024040).
Optical diffraction tomography for 3D refractive index imaging: Techniques and applications
- Light: Advanced Manufacturing , Article number: 77 (2026)
- Received: 06 January 2026
- Revised: 24 April 2026
- Accepted: 27 April 2026 Published online: 28 April 2026
doi: https://doi.org/10.37188/lam.2026.077
Abstract: Refractive index (RI) is related to the physical parameters of a sample including morphology and tension. Consequently, three-dimensional RI imaging is critical for many fields. Three-dimensional (3D) RI imaging can be realised by recording transmittance wavefronts of a sample at different illumination angles and using the Fourier slicing or Fourier diffraction theorem to reconstruct the 3D RI image. Currently, advanced label-free 3D RI imaging techniques such as optical tomography and optical diffraction tomography have been increasingly utilised in many fields and demonstrated promising results. To further promote the application of 3D RI imaging technology, this paper provides an overview of the basic principles, experimental implementations, and applications of 3D RI imaging techniques. Further, the performance and characteristics of 3D RI imaging techniques with different illumination strategies and different reconstruction algorithms are compared, and the current trends and future perspectives are discussed. We hope that this review serves as a comprehensive guide to 3D RI imaging for both microscopists and biologists.
Research Summary
Optical tomography: 3D RI imaging approaches for transparent samples
3D refractive index (RI) imaging is of great importance in many fields, since RI is related to the morphology, tension, and other physical parameters of a sample. Optical tomography (OT) and optical diffraction tomography (ODT) have been increasingly employed to achieve 3D RI imaging. The researchers from Xidian University and Nanjing University of Science and Technology provide a comprehensive review on the techniques of 3D RI imaging, including the basic principles, experimental implementations, and their applications. The performance and characteristics of 3D RI imaging techniques with different illumination strategies and different reconstruction algorithms are compared and discussed. This review serves as a Hitchhiker’s Guide to 3D RI imaging for microscopists and biologists alike.
Rights and permissions
Open Access This article is licensed under a Creative Commons Attribution 4.0 International License, which permits use, sharing, adaptation, distribution and reproduction in any medium or format, as long as you give appropriate credit to the original author(s) and the source, provide a link to the Creative Commons license, and indicate if changes were made. The images or other third party material in this article are included in the article′s Creative Commons license, unless indicated otherwise in a credit line to the material. If material is not included in the article′s Creative Commons license and your intended use is not permitted by statutory regulation or exceeds the permitted use, you will need to obtain permission directly from the copyright holder. To view a copy of this license, visit http://creativecommons.org/licenses/by/4.0/.

 DownLoad: