




-
High-power laser components play a crucial role in key applications such as industrial precision processing, free-space quantum communication, and inertial confinement fusion1–3. The high-reflection (HR) coatings used in these components primarily enhance the laser transmission efficiency and enable precise laser control. Absorption is a critical metric for evaluating the optical performance of HR coatings, particularly in high-power laser applications, as it determines the lifespan and operational stability of the equipment4.
HR mirrors are typically constructed by stacking high-refractive index (H) and low-refractive index (L) materials5. SiO2 is an almost irreplaceable L material owing to its extremely low absorption across the ultraviolet to near-infrared spectrum. Commonly used H materials include metal oxides, such as HfO2, Ta2O5, and Nb2O5. Among these, Ta2O5 is an excellent HR coating material owing to its relatively high refractive index, broad bandwidth, and favourable cost-effectiveness6. Chen et al.7 deposited Ta2O5-based HR films using a dual-source ion-beam sputtering (IBS) system. After annealing at 673 K, these films exhibited low absorption of 1.2 part per million (ppm) at 1,064 nm, playing a crucial role in enhancing the performance of high-energy lasers and high-precision optical systems. Current research predominantly attributes mirror absorption to H materials5. A promising approach to further reduce the absorption of these materials involves the use of composite films. Elements such as Ti, Zr, W, Co, Hf, and Si can be introduced as dopants into H layers to modulate the structure and absorption properties8,9. The Laboratoire des Matériaux Avancés(LMA, Lyon, France) reported IBS-fabricated Ti-doped Ta2O5 mirrors exhibiting an absorption of 0.21 ppm, as measured by photothermal deflection, which have been deployed in gravitational wave detectors10.
Currently, most HR films with extremely low absorption are prepared using IBS8,10–12. Films produced by this method exhibit smooth, dense surfaces; however, IBS deposition systems are costly, and only a handful of laboratories can afford large-scale coating systems. Furthermore, the deposition efficiency of IBS is relatively low, resulting in extended processing times for the HR films13. In contrast, electron beam ion-assisted deposition (EB-IAD) offers significant advantages for large-scale batch production of laser component coating owing to its relatively low cost and high efficiency14. Nevertheless, reports on the use of this method to fabricate ultralow-absorption films remain scarce. Therefore, investigating the absorption mechanism of these films, summarising patterns for reducing their absorption, and integrating these insights with the EB-IAD method holds promise for more efficient production of ultralow-absorption thin films. Furthermore, previous studies have suggested that oxygen vacancies may be the primary cause of absorption in metal oxides, although structural factors may also play a role15–17. However, these effects remain unexplored. Specifically, the relationship between the film composition, microstructure, and absorption at different annealing temperatures warrants further investigation.
Therefore, this study investigates the mechanism by which annealing affects the optical absorption of TiO2-Ta2O5 coated HR mirrors, focusing on the relationship between the chemical composition, microstructure, and absorption at different temperatures. Specifically, classical molecular dynamics (MD) simulations and ab initio calculations were employed to describe the structural relaxation states and optical property changes during annealing from a microscopic perspective, thereby validating and explaining the experimental findings.
-
The TiO2-Ta2O5 HR coatings were deposited on super-polished fused silica substrates (JGS1, China) with a diameter of 25.4 mm and a thickness of 2.5 mm. Prior to deposition, the substrates were ultrasonically cleaned and thoroughly rinsed with deionised water (18.2 MΩ·cm). The films were deposited using an EB-IAD system (OPTORUN, Japan OTFC-1300, Optorun Co., Ltd., Japan). The system can process more than 20 substrates in a single deposition run. In this study, all the substrates were coated during the same deposition run to eliminate batch-to-batch variations and ensure high comparability among the samples. The deposition was performed at the substrate temperature of 523 K and chamber base pressure of 1 × 10⁻⁴ Pa under an Ar/O2 mixed atmosphere, where Ar served as the working gas and O2 as the reactive gas for complete oxidation. Ionic oxygen generated by a radio frequency ion source was employed for assisted deposition at 1,000 V and 1,100 mA current.
The film structure comprised substrate/(HL)^17 H/air, where H represents TiO2-Ta2O5 containing mass fraction $ C_{\rm{TiO}_{2}}^{wt} $ of approximately 10% TiO2 with quarter wavelength optical thickness (QWOT), and the L is SiO2 with QWOT. The corresponding designed physical thicknesses of the H and L layers were approximately 127 nm and 183 nm, respectively. In this study, an HR mirror was designed with a high-index QWOT termination layer. It should be noted that, in practical coating designs, two QWOT capping layers are often employed to enhance the stability of the mirror against environmental influences, particularly under high-power laser irradiation. In typical applications, the additional outermost layer is subjected to very high electric field intensities and, depending on the material quality, may contribute to an increase in the overall absorption of the coating system. The present work is not intended to develop a fully electric field-optimised coating design. Instead, a structurally simple and experimentally reproducible coating architecture was adopted to systematically investigate the annealing-induced evolution of the absorption and microstructure, particularly within the H layers.
Ta2O5 and Ti3O5 granules with particle sizes of 1−3 mm and a purity of 99.99% were used as the source materials for the H layer. Quartz rings (SiO2, 99.99%) were used as the source material for the L layer. All these evaporation materials were supplied by Zhongchengda Applied Materials Co., Ltd. (APG, China).The specific doping configurations and monitoring procedures were established in a previous study17. The coating annealing process was performed in a muffle furnace under air atmosphere, with temperature changes following a programmed control sequence. The target holding temperatures for annealing were set at 473–873 K, with intervals of 100 K each. The annealing process involved heating from room temperature (~300 K) to the target temperature, holding for 10 h, and then cooling to room temperature. Both heating and cooling rates were maintained at 100 K/h.
Transmittance of all samples was measured using a Lambda 750S UV-Vis-NIR spectrophotometer with an accuracy of ±0.0006 A. Weak absorption of the coatings before and after annealing was characterised using the photothermal lens method. The measurement procedure and uncertainty analysis followed the standard GB/T 44605-2024 and previously reported methodologies18. A 1,064 nm pump beam with a power of 4 W was used to induce the thermal response, and a 632 nm He–Ne laser served as the probe beam. For each sample, measurements were performed at three locations: one at the centre and two at half of the sample radius. Two repeated measurements were performed at each location. Film composition was characterised using X-ray photoelectron spectroscopy (XPS) with an AlKα excitation source (hµ = 1,486.6 eV) on a Thermo K-Alpha instrument (Thermo Fisher Scientific, Waltham, MA, USA). The analysis chamber vacuum level was maintained at 5 × 10⁻⁹ mbar. Testing employed a passing energy of 50 eV with 0.1 eV increments, utilising the C 1s = 284.80 eV binding energy as the calibration standard for charge correction19. The binding energy uncertainty was estimated to be ±0.1 eV, considering the instrumental energy resolution and charge correction. All spectra were processed and fitted using Avantage software (Thermo Fisher Scientific). Grazing-incidence X-ray diffraction (GIXRD) characterisation of the films was performed using an Empyrean XRD instrument (Malvern Panalytical B.V., Almelo, the Netherlands) to observe crystallisation phenomena at an incidence angle of 0.5°. The surface topography of the films was determined using atomic force microscopy (AFM; NanoWizard Sense+, Bruker Nano GmbH, Berlin, Germany) integrated with a ZEISS LSM 900 confocal laser scanning microscope (Carl Zeiss Microscopy GmbH, Jena, Germany) over a 20 μm × 20 μm scanning area. Each sample was tested at three distinct surface locations to confirm homogeneity. The bonding changes during coating annealing were characterised using Fourier transform infrared (FTIR) and Raman spectroscopy. Single-point reflectance maps of the films were obtained using a Nicolet iS50 iN10 FTIR spectrometer (Thermo Fisher Scientific, Waltham, MA, USA). Raman spectra of the HR mirrors were recorded before and after annealing using a LabRAM Odyssey Raman spectrometer(HORIBA France SAS, Palaiseau, France) equipped with a 532 nm laser.
-
The structural evolution of amorphous TiO2-Ta2O5 was investigated using classical MD simulations performed using the LAMMPS package developed by Sandia National Laboratories20. The interatomic interactions among the Ta, O, and Ti atoms were described using the Morse-BKS (M-BKS) potential developed by Trinastic et al.21. The M-BKS potential is based on the original BKS potential, with an additional Morse term introduced to account for the covalent contributions of Ta-O and Ti-O bonds. The total interaction energy can be expressed as follows:
$$ \text{Φ}_{ij}^{M-BKS}=\frac{{q}_{i}{q}_{j}}{{r}_{ij}}+{A}_{ij}{e}^{\left(\frac{-{r}_{ij}}{{\rho }_{ij}}\right)}-\frac{{C}_{ij}}{{{{r}_{ij}}}^{6}}+{D}_{ij}{(1-{{e}^{(-{{a}_{ij}}({{r}_{ij}}-{{r}_{e}}))}})}^{2} $$ (1) where $ \text{Φ}_{ij}^{M-BKS} $ denotes the total interaction energy between atoms $ i $ and $ j $, $ {{q}_{i}{q}_{j}}/{{r}_{ij}} $ represents the Coulomb interaction, $ {q}_{i} $ and $ {q}_{j} $ denote partial charge transfer between the atoms, $ {A}_{ij}{e}^{\left({-{r}_{ij}}/{{\rho }_{ij}}\right)} $ denotes the Pauli repulsion energy, ${{C}_{ij}}/{{{{r}_{ij}}}^{6}} $ denotes the attractive van der Waals interaction, and $ {D}_{ij}{(1-{{e}^{(-{{a}_{ij}}({{r}_{ij}}-{{r}_{e}}))}})}^{2} $ represents the covalent bond. For Ti-O bonds, a stronger covalent Ti-Ostrong interaction was selected, as it better describes the sputtered amorphous TiO2.
In this study, all potential parameters were adopted directly from Ref. 21, without further modification or refitting. The reported parameters include the partial atomic charges and Morse coefficients determined by the authors by fitting the crystalline lattice constants, elastic properties, and amorphous radial distribution functions (RDFs). The transferability of this potential to both crystalline and amorphous oxide systems has been validated in Ref. 21. Therefore, it provides a physically consistent framework for modelling the annealing-induced structural evolution in the present TiO2-Ta2O5 system.
Three TiO2-Ta2O5 systems containing 12.5% Ti were employed for MD simulations, with large (7,920 atoms), medium (1,760 atoms), and small (220 atoms) model sizes. As illustrated in Fig. 1, all the models were derived from the expansion of the same amorphous unit cell, following previously reported procedures17. Ti atoms were randomly substituted, and the corresponding number of oxygen atoms was removed to maintain chemical stoichiometry. The original cells were expanded into 1 × 1 × 2, 2 × 2 × 4, and 4 × 3 × 6 super-cells.
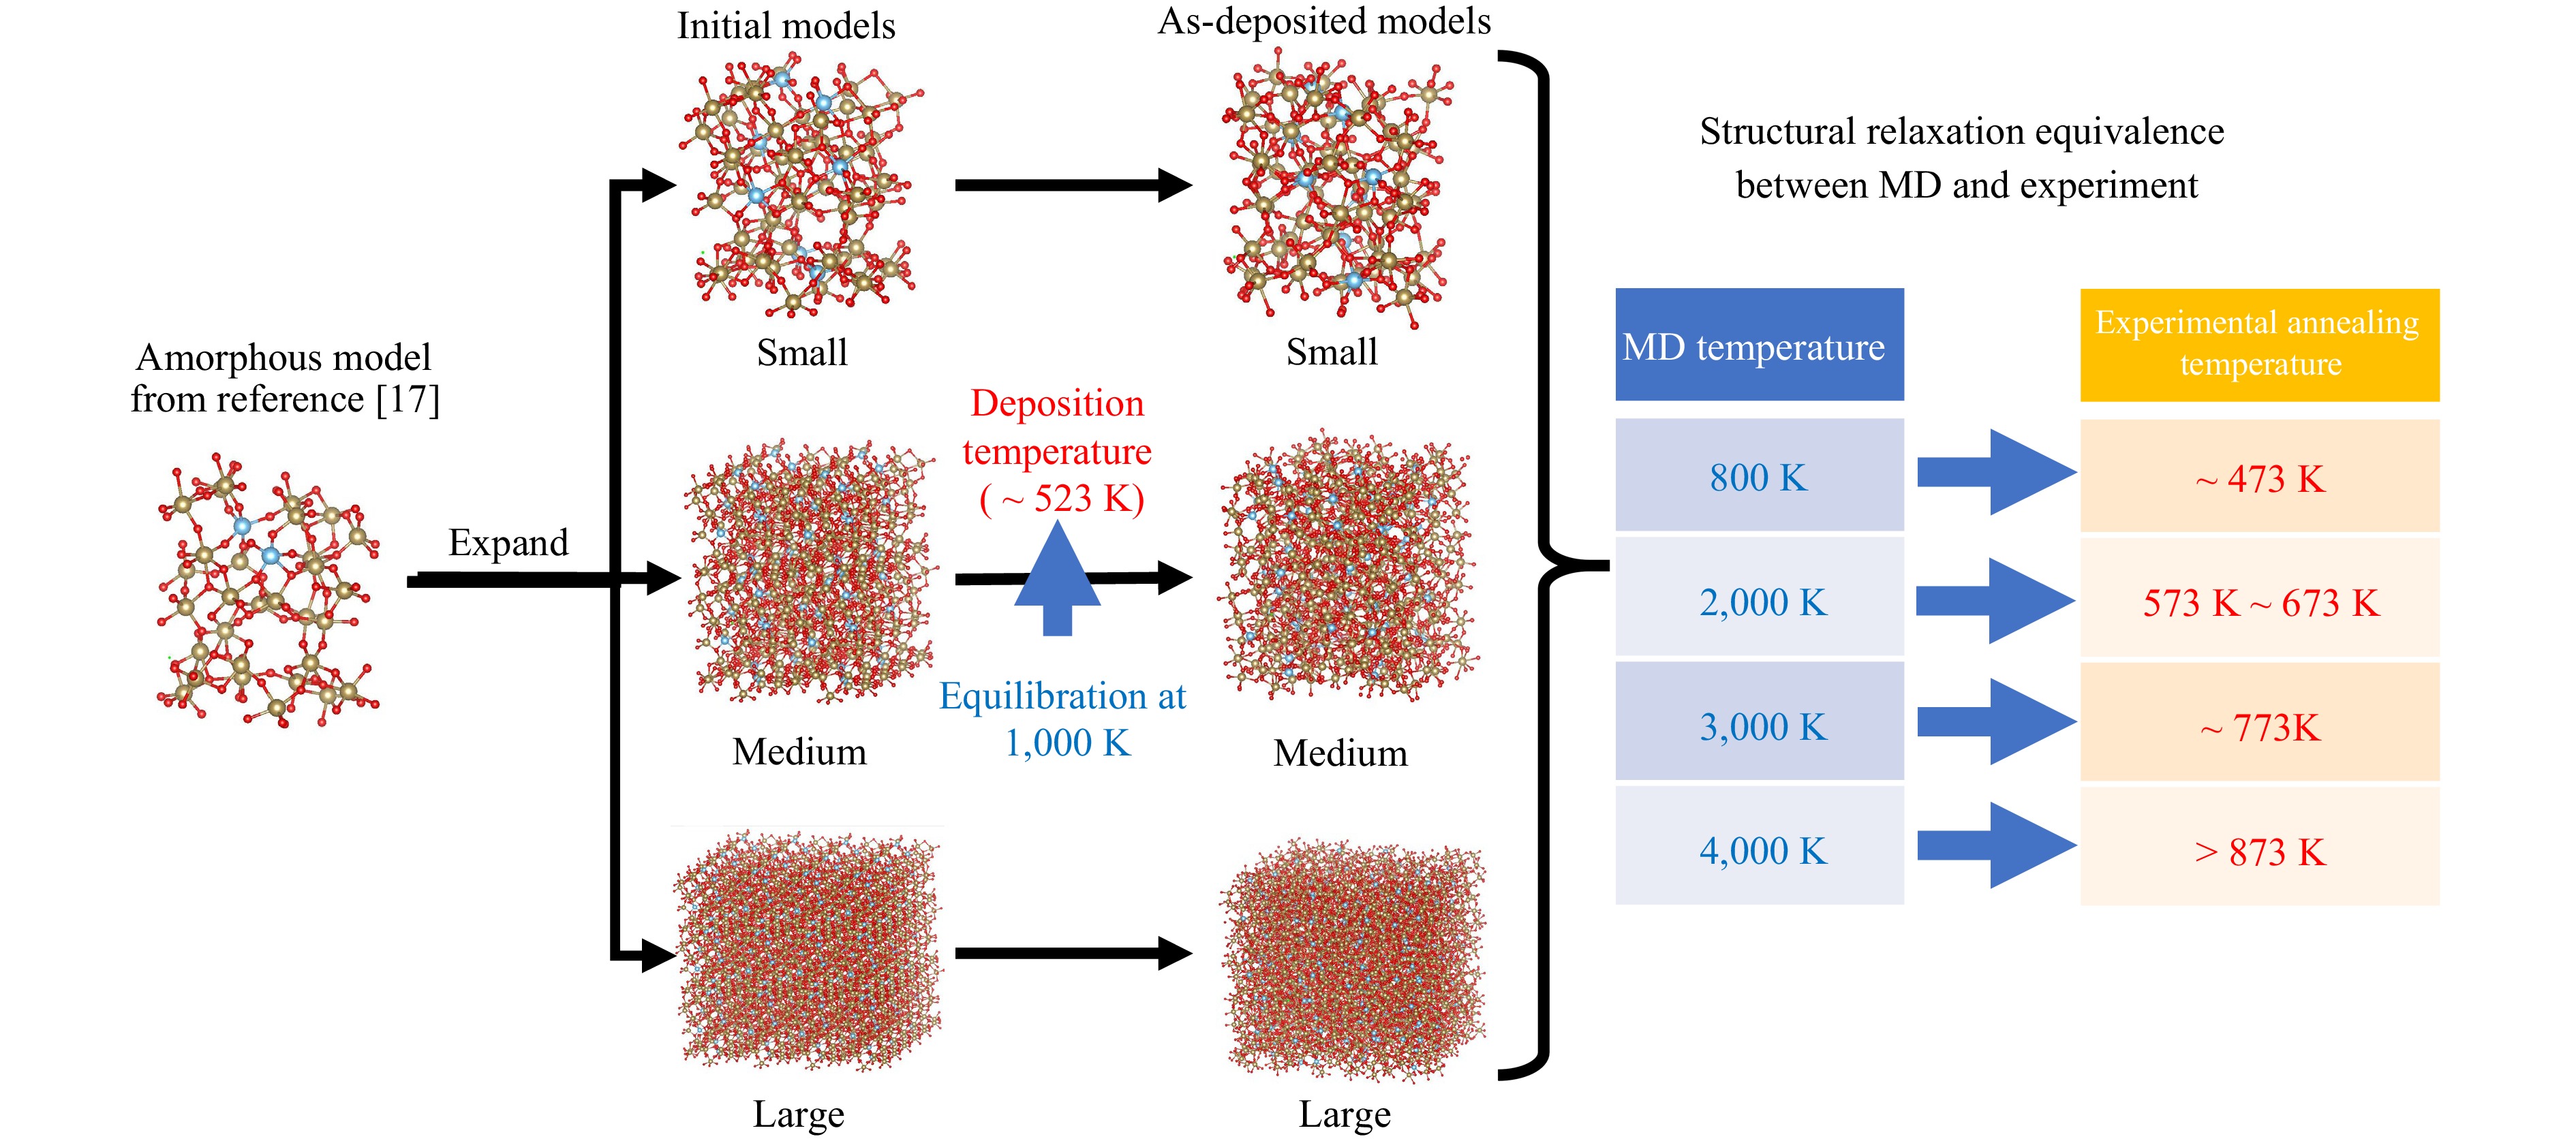
Fig. 1 Construction procedure of the annealed models. All structures were expanded from the same amorphous unit cell following Ref. 17, with random Ti substitution and stoichiometric O adjustment. A 1,000 K annealing-quenching procedure was applied to obtain a relaxation state equivalent to the as-deposited structure. The same protocol was used for annealed models, and equivalence was assessed based on structural relaxation rather than absolute temperature.
All the MD simulations were performed using a Nosé–Hoover thermostat with a time step of 1 fs under periodic boundary conditions. The initial amorphous structures were generated using a thermal annealing-quenching procedure. Because the starting configuration already exhibited a certain degree of structural disorder, a target temperature of 1,000 K was employed to eliminate residual structural memory and promote network rearrangement. The specific procedure was as follows. The system was first equilibrated at 300 K for 50 ps under the NVT ensemble (canonical ensemble; constant number of particles, volume, and temperature). It was then heated from 300 K to 1,000 K under the NPT ensemble (isothermal–isobaric ensemble; constant number of particles, pressure, and temperature) for over 35 ps. Subsequently, equilibration was conducted at 1,000 K for more than 50 ps under NVT conditions. The system was then quenched at 300 K using the NPT ensemble for periods exceeding 35 ps. Finally, an additional 50 ps equilibration under the NVE ensemble (microcanonical ensemble; constant number of particles, volume, and energy) was performed to stabilise the energy. The resulting configuration was used as an as-deposited model.
Annealing simulations were subsequently performed on this structure following the same protocol, with the target temperatures set to 800, 2,000, 3,000, and 4,000 K. Heating and cooling were conducted in 300 K increments at a rate of 20 K/ps. The structures equilibrated at 300 K under the NVE ensemble were selected as the final annealing models. For each target temperature, five independent simulations with different random initial seeds were performed to ensure the statistical reliability.
It should be emphasised that the thermostat temperatures employed in the simulations were not intended to establish a direct one-to-one correspondence with experimental annealing temperatures. In MD simulations, temperature serves as an accelerated sampling parameter that enables structural rearrangements within accessible computational timescales. Because of the intrinsic limitation of MD simulations in the picosecond–nanosecond regime, elevated target temperatures are commonly adopted to overcome kinetic barriers during the construction and relaxation of amorphous structures22,23. Therefore, the equivalence between the simulation and experiment was evaluated based on the degree of structural relaxation (e.g. stabilisation of the density and radial distribution functions) rather than the absolute temperature value. This approach has been widely employed in simulations of amorphous oxides and glassy systems24,25.
The electronic structure and absorption properties of the small models were calculated by density functional theory (DFT) using the Vienna ab initio simulation package (VASP)26. The Ta, O, and Ti atoms used projected augmented wave (PAW) pseudopotentials with valence electron configurations of 5p65d36s2, 2s22p4, and 3s23p64s13d3, respectively. Structural relaxation and self-consistent calculations employed the Perdew-Burke-Ernzerhof generalised gradient approximation to describe the exchange-correlation functional27. Spin polarisation was included to account for possible defect-induced localised states in the doped or oxygen-deficient configurations. The convergence threshold for electronic structure iterations was set at 10−5 eV. Atomic forces converged to within 0.02 eV/Å, with the cutoff energy increased to 520 eV. Because the system comprises 220 atoms, only the Γ point is sampled during structural relaxation. The k-point sampling for self-consistent calculation increased to 2 × 2 × 2. The Heyd-Ernzerhof-Scuseria (HSE06) hybrid functional was used to calculate the electronic structure and optical properties, yielding relatively accurate results28. Due to its high computational demands, k-point sampling for these calculations also utilises the Γ point.
The linear optical properties of the system can be obtained from the frequency-dependent complex dielectric function $ \varepsilon \left(\omega \right) $.
$$ \varepsilon \left(\omega \right)={\varepsilon }_{1}\left(\omega \right)+ i{\varepsilon }_{2}\left(\omega \right) $$ (2) where $ {\varepsilon }_{1}\left(\omega \right) $ and $ {\varepsilon }_{2}\left(\omega \right) $ represent the real and imaginary parts of the dielectric function, respectively, and $ \omega $ denotes the photon frequency. The formula for the imaginary part $ {\varepsilon }_{2}\left(\omega \right) $ of the dielectric function is
$$ {\varepsilon }_{2}\left(\omega \right)=\frac{4{{\text{π}}}^{2}{e}^{2}}{\text{Ω}}\underset{q\rightarrow 0}{\lim } \frac{1}{{q}^{2}}\times \sum2{w}_{\text{k}}\delta ({E}_{c}-{E}_{v}-\omega ){|\left\langle c|\text{e}\cdot \text{q}|v\right\rangle |}^{2} $$ (3) where $ \left\langle c|\text{e}\cdot \text{q}|v\right\rangle $ represents the integral optical transition from the valence state (v) to the conduction state (c), where e denotes the polarisation direction of the photon and $ \text{q} $ is the electron momentum operator. Integration over $ \text{q} $ is performed by summing over $ \text{k} $ specific points, each assigned a weighting factor $ {w}_{\text{k}} $. The real part $ {\varepsilon }_{1}\left(\omega \right) $ of the dielectric function can be determined using the Kramers-Kronig relations29.
$$ {\varepsilon }_{1}\left(\omega \right)=1+\frac{2}{{\text{π}}}P\int\nolimits_{0}^{\infty }\frac{{\varepsilon }_{2}(\omega ')\omega '}{{\omega '}^{2}-{\omega }^{2}+i\eta }d\omega ' $$ (4) where $ P $ denotes the principal value, and $ \eta $ represents the complex shift parameter. The frequency-dependent extinction coefficient $ k\left(\omega \right) $ can be calculated from the real $ {\varepsilon }_{1}\left(\omega \right) $ and imaginary $ {\varepsilon }_{2}\left(\omega \right) $ parts as follows:
$$ k\left(\omega \right)={\left(\frac{\sqrt{\varepsilon _{1}^{2}+\varepsilon _{2}^{2}}-{\varepsilon }_{1}}{2}\right)}^{\frac{1}{2}} $$ (5) -
The spectral responses of the HR mirrors before and after annealing are shown in Fig. 2. At approximately 1,064 nm, the transmittance of all the samples dropped below 0.1%, rendering the effect of annealing on this wavelength band nearly undetectable. Beyond this wavelength range, the spectra of the films exhibited distinct trends as the annealing temperature increased.
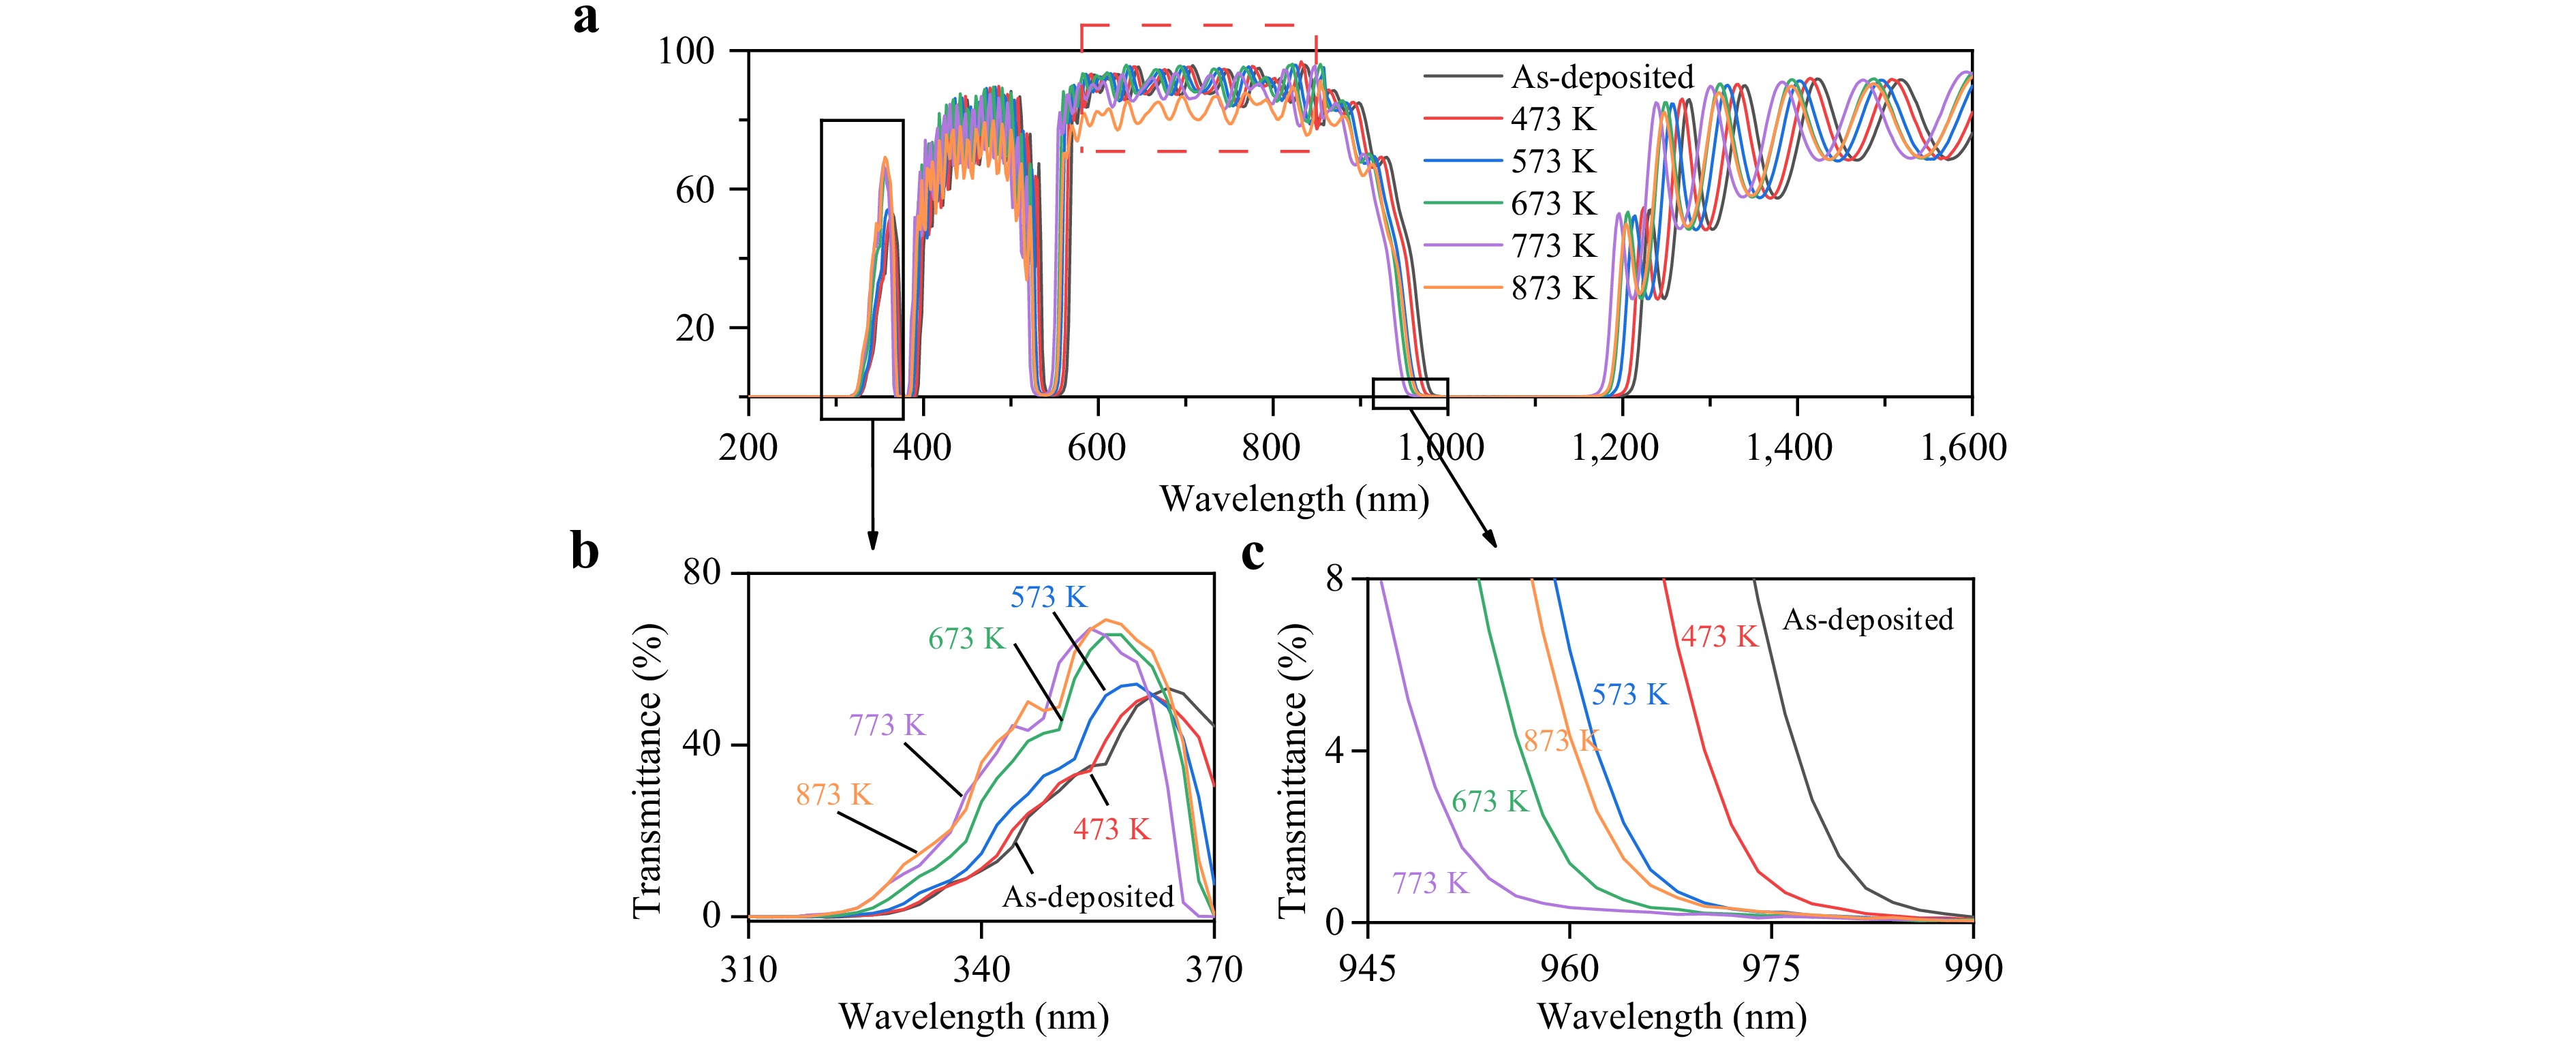
Fig. 2 Transmission spectra of HR mirrors for as-deposited state and after annealing at different temperatures. a Transmission spectra in the range of 200–1,600 nm. The red dashed box highlights the 600–900 nm band showing significant transmittance changes, where the purple curve (annealed at 773 K) exhibits a relatively minor decrease in transmittance, whereas the orange curve (annealed at 873 K) shows a pronounced decrease. Localised magnification of the transmission spectra in the b 310–370 nm and c 945–990 nm ranges.
As shown in Fig. 2a, the transmittance of the mirror annealed at 773 K decreases near 600–900 nm, a trend that becomes more pronounced at 873 K annealing. AFM results in the next section reveal significant surface roughening on films annealed at ≥773 K. This introduces additional scattering losses, thereby reducing the measured transmittance30,31. Therefore, the observed decrease in transmittance in the 600–900 nm range is likely associated with enhanced scattering induced by high-temperature annealing. Nevertheless, direct scattering measurements are required to confirm this contribution quantitatively.
In the ultraviolet region (Fig. 2b), compared to the as-deposited sample, the cutoff edge of the annealed films tended to become steeper, indicating a reduction in the Urbach tail width. The film annealed at 473 K exhibits no significant change in the tail width, which may be attributed to lower annealing temperature than the deposition temperature (523 K). Under lower annealing conditions, the rearrangement of the atomic structures and stress release within the film remain limited. In contrast, films annealed at 573–673 K exhibit a significantly narrower Urbach tail width. At higher annealing temperatures (773–873 K), the trend of Urbach tail reduction weakens, even showing slight rebound. Some studies have suggested that the Urbach tail width reflects the O vacancy defect density and degree of disorder in the internal structure of the film32. A lower defect density indicates a more ordered film, resulting in a narrower tail. These results indicated that annealing may reduce the concentration of O vacancies in the film and enhance its structural order.
Additionally, Fig. 2c shows that the cutoff position near 980 nm in the sample spectra exhibits a characteristic evolution with the annealing temperature. From the as-deposited state to 773 K, the cutoff position progressively shifts toward shorter wavelengths. Previous studies have attributed this to changes in the effective optical thickness of the film, which is potentially linked to the material relaxation induced by annealing at lower temperatures33. At 873 K, the cutoff position ceases to shift further toward shorter wavelengths and instead returns to a position intermediate between the 473 and 573 K annealed samples. This indicated a change in the evolution mechanism of the film material at this temperature. Given that the transition and phase change temperatures of SiO2 in the L layer are significantly higher than those of TiO2-Ta2O5 in the H layer, combined with the previously described spectral changes across different bands, it can be inferred that under the 773–873 K heat treatment conditions, an evolution mechanism distinct from that observed during the low-to-medium temperature annealing stages may have emerged in the TiO2-Ta2O5 layer. Related issues are further discussed in subsequent sections.
The absorption of the thin films was measured at 1,064 nm using the photothermal lens method, and the results are shown in Fig. 3. The absorption of all films prior to thermal treatment ranged between 30 and 50 ppm. As the annealing temperature increased, the film absorption initially decreased and then increased. As the annealing temperature increased from 473 to 673 K, the film absorption decreased from approximately 8 ppm to 1.3 ppm. Similar trends have been reported in previous studies, indicating that annealing reduces film absorption by suppressing the O vacancies7,17. However, for annealing temperatures above 673 K, the film absorption sharply increased to several hundred ppm, exceeding 1,000 ppm at 873 K. Reports on such non-monotonic temperature-dependent changes in film absorption are relatively scarce. Lin et al.34 also reported non-monotonic changes in film absorption with temperature during annealing of HfO2 films. The mechanism underlying this abrupt shift in absorption after the high-temperature annealing warrants further investigation.
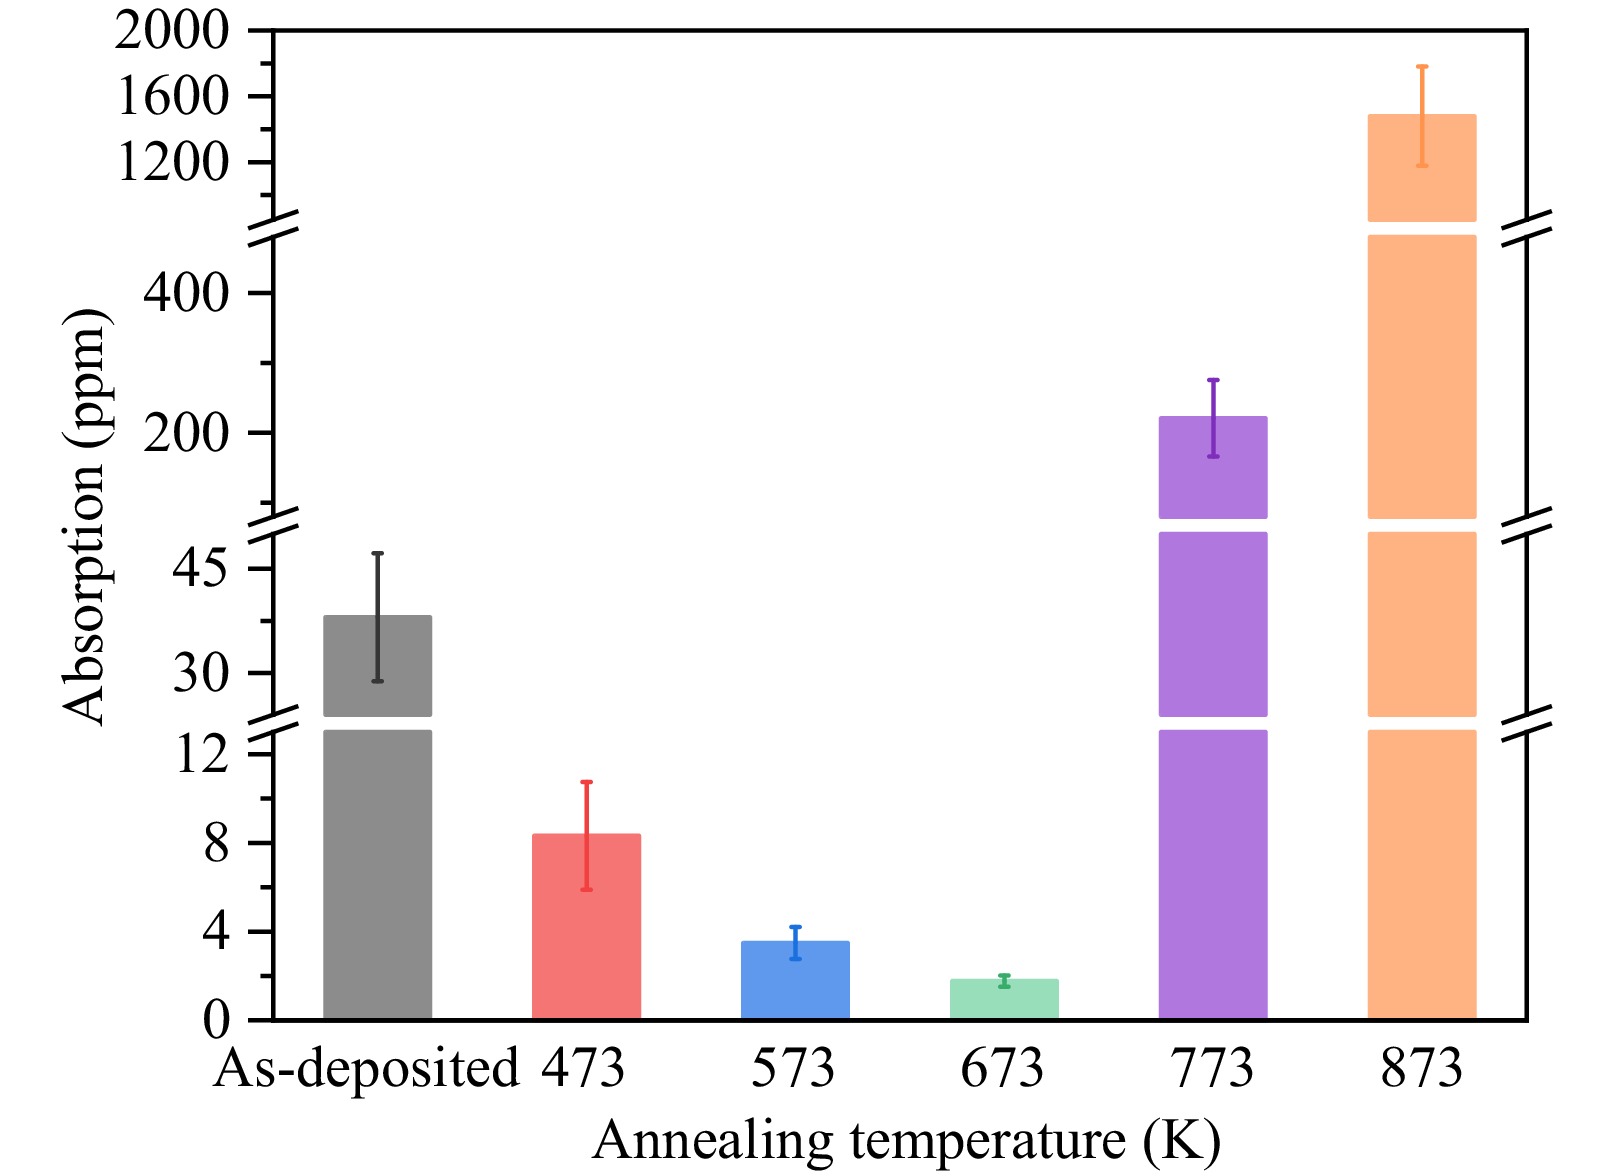
Fig. 3 Surface absorption at 1,064 nm for HR mirrors in as-deposited state and after annealing at different temperatures.
-
Subsequently, the as-deposited and annealed samples were structurally characterised. GIXRD was employed to collect structural information of the H layer surface. As shown in Fig. 4, both the as-deposited films and those annealed at all temperatures exhibit an amorphous state. This indicates that no significant annealing-induced crystallization occurred within the HR mirrors.
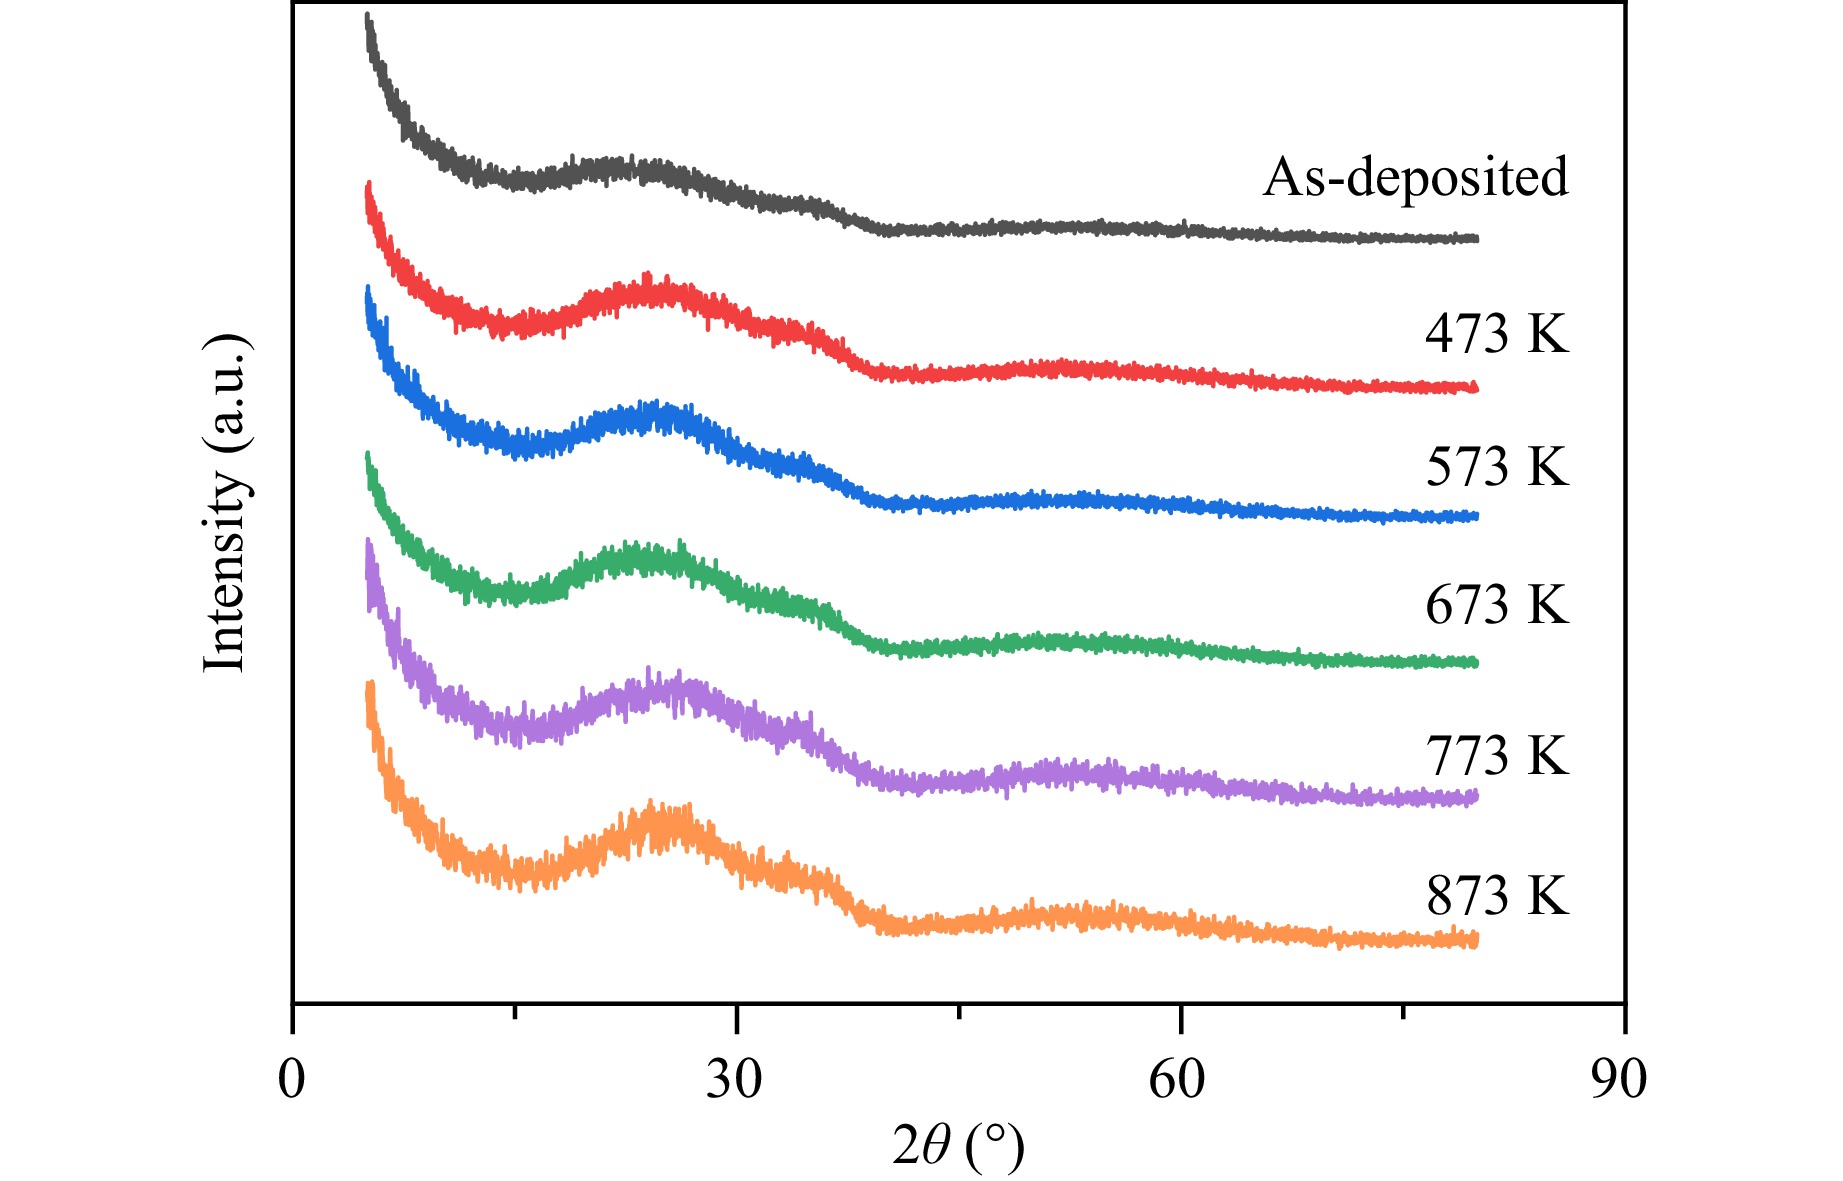
Fig. 4 GIXRD patterns of HR mirrors in as-deposited and annealed states.
AFM was used to characterise the evolution of film surface roughness. The surface topography of the as-deposited state and samples treated at ≤673 K was nearly identical, with no significant grain formation observed (Fig. 5a-d). The root-mean-square (RMS) roughness values determined from the topography images further indicate that films annealed at 573 and 673 K exhibit relatively lower RMS roughness (0.730 and 0.562 nm, respectively). This suggests that annealing at moderate-to-low temperatures does not compromise the surface flatness of the film and may even slightly improve the surface morphology.
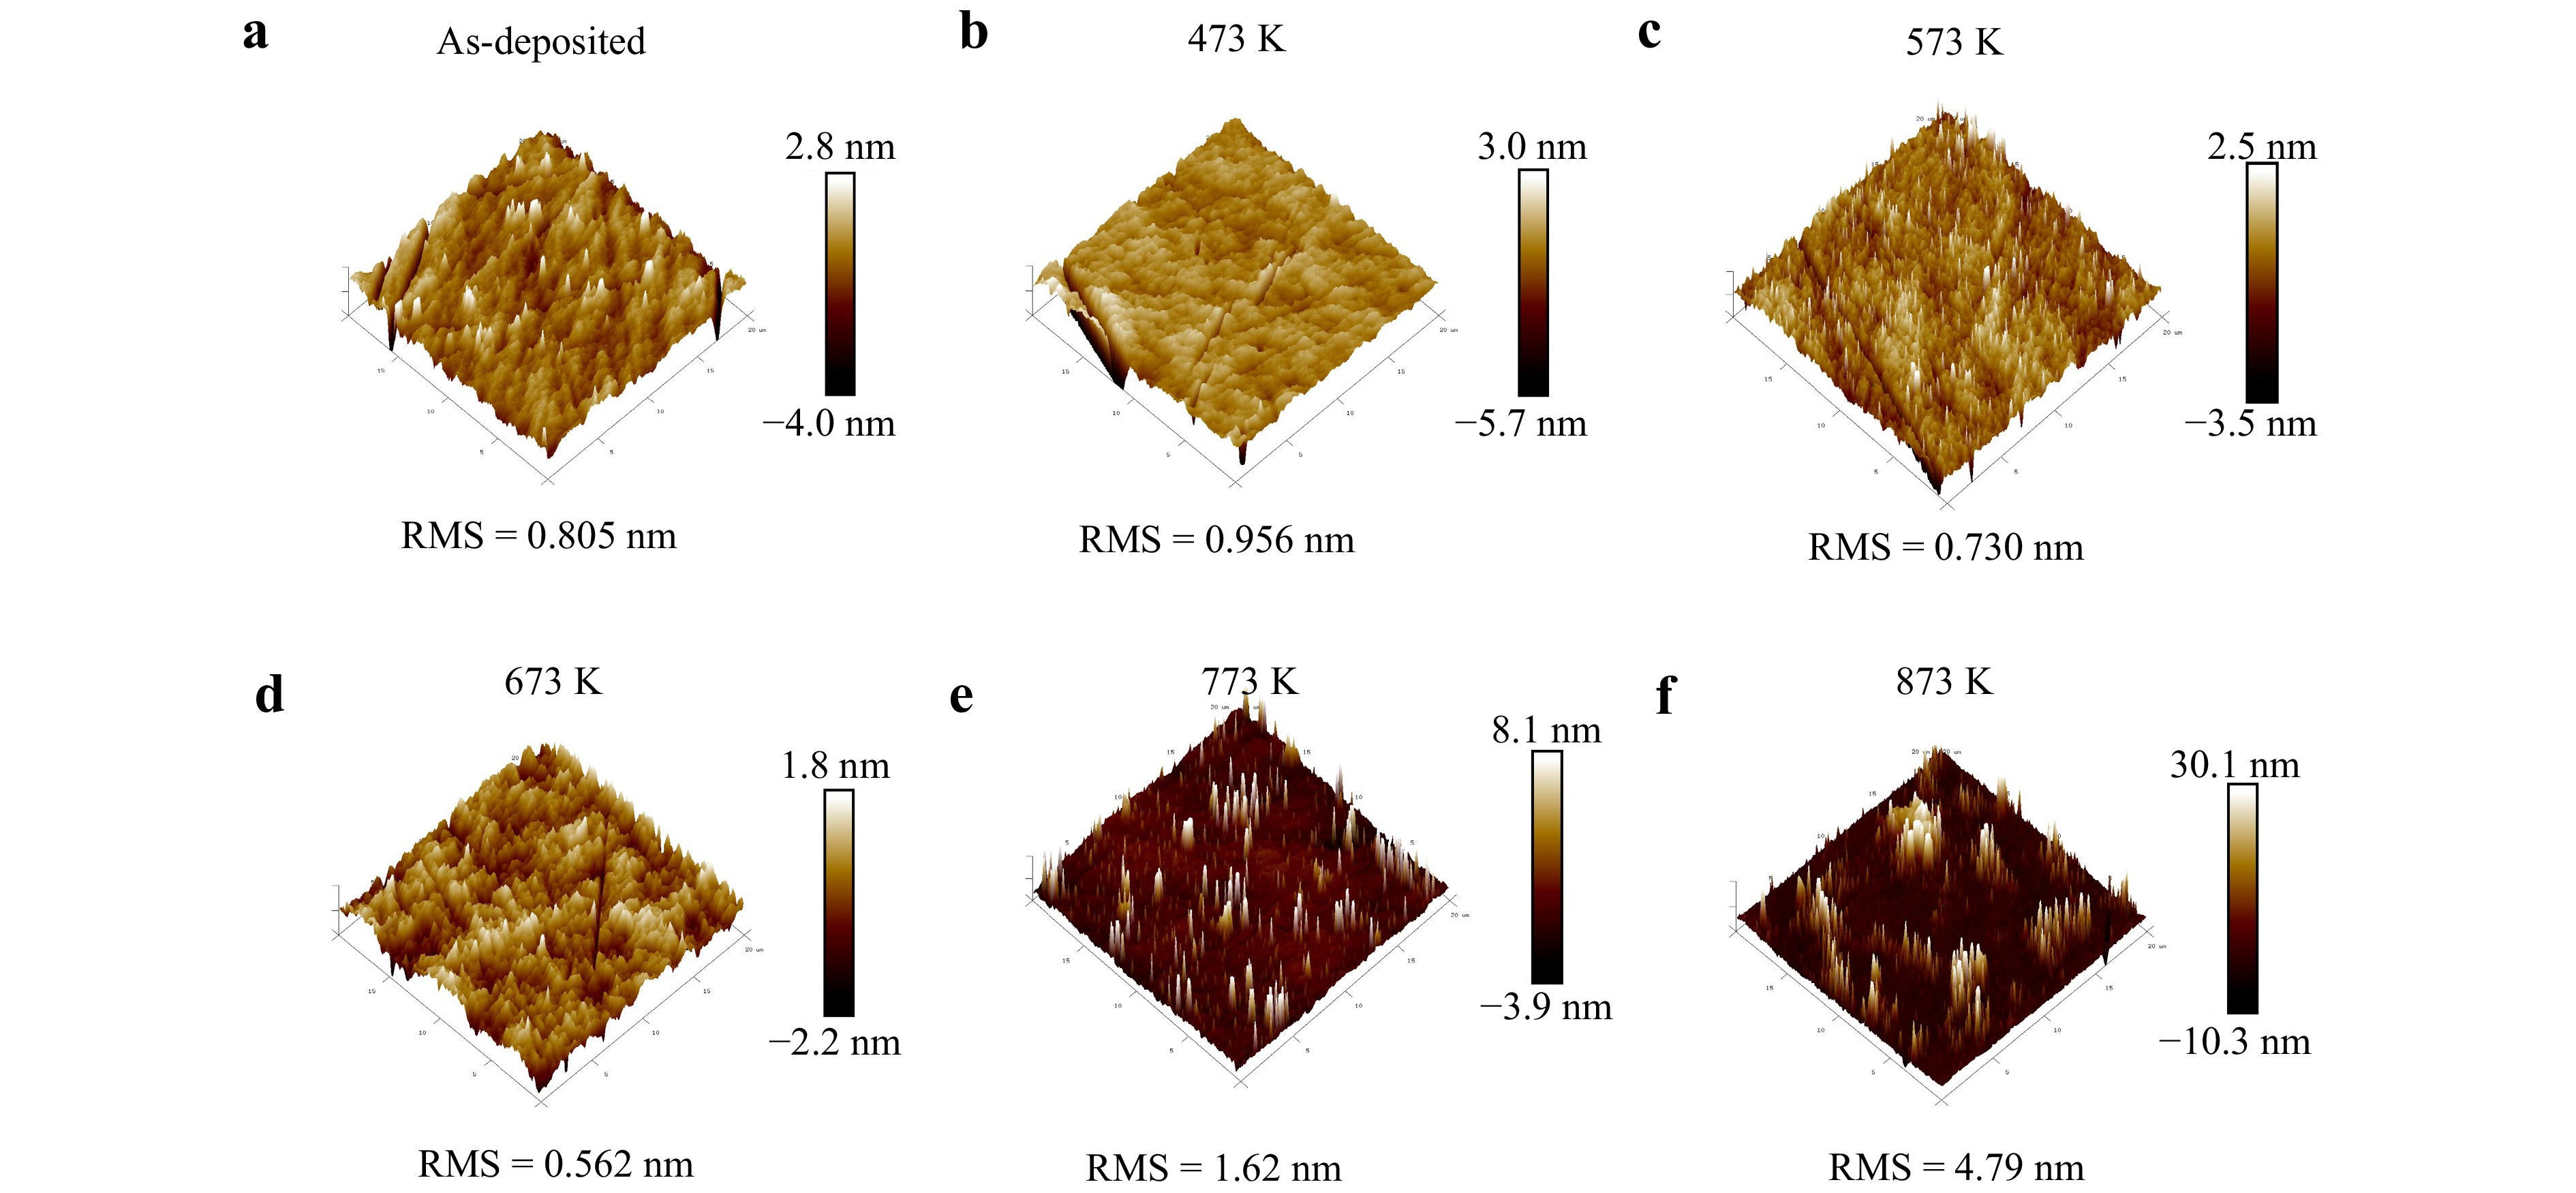
Fig. 5 Surface morphology and RMS roughness of the HR mirrors: a as-deposited and annealed at b 473, c 573, d 673, e 773, and f 873 K. The RMS roughness was determined by AFM.
However, the RMS values increased to 1.62 and 4.79 nm for the annealing temperatures of 773 and 873 K, respectively. Compared with Fig. 5a-d, Fig. 5e shows a small number of isolated spike-like protrusions. Considering the crystallisation temperature difference between Ta2O5 (~973 K) and TiO2 (~673 K), this phenomenon may be related to local ordering or initial crystallisation of the TiO2 component9,17. Further analysis of the sample annealed at 873 K (Fig. 5f) reveals an increased number of protrusions, along with some degree of aggregation and size enlargement. However, these protrusions remained spatially dispersed and failed to form continuous macroscopic crystalline domains. Their morphologies differ distinctly from the regular grain structures typically observed in polycrystalline films4,35. This indicates that even if locally ordered regions exist, their sizes and volume fractions remain limited. Under these conditions, the crystal domain size may fall below the critical threshold required for XRD detection, and the overall crystalline volume fraction may be insufficient to generate resolvable diffraction peaks. Therefore, the absence of distinct diffraction peaks in the GIXRD patterns (Fig. 4) is understandable.
-
The films were characterised in their as-deposited state and after annealing at 573 and 873 K to determine their composition. Based on XPS, the primary target was H-layer TiO2-Ta2O519. Fig. 6a-c display the XPS spectra of O in the tested samples. OI corresponds to lattice O, whereas OII and OIII typically involve hydroxyl and surface-adsorbed O36. The deconvolution results show that the relative contributions of the OⅡ and OⅢ components decreased after annealing, suggesting that annealing reduced hydroxyl- and surface-adsorption-related species on the film surface.
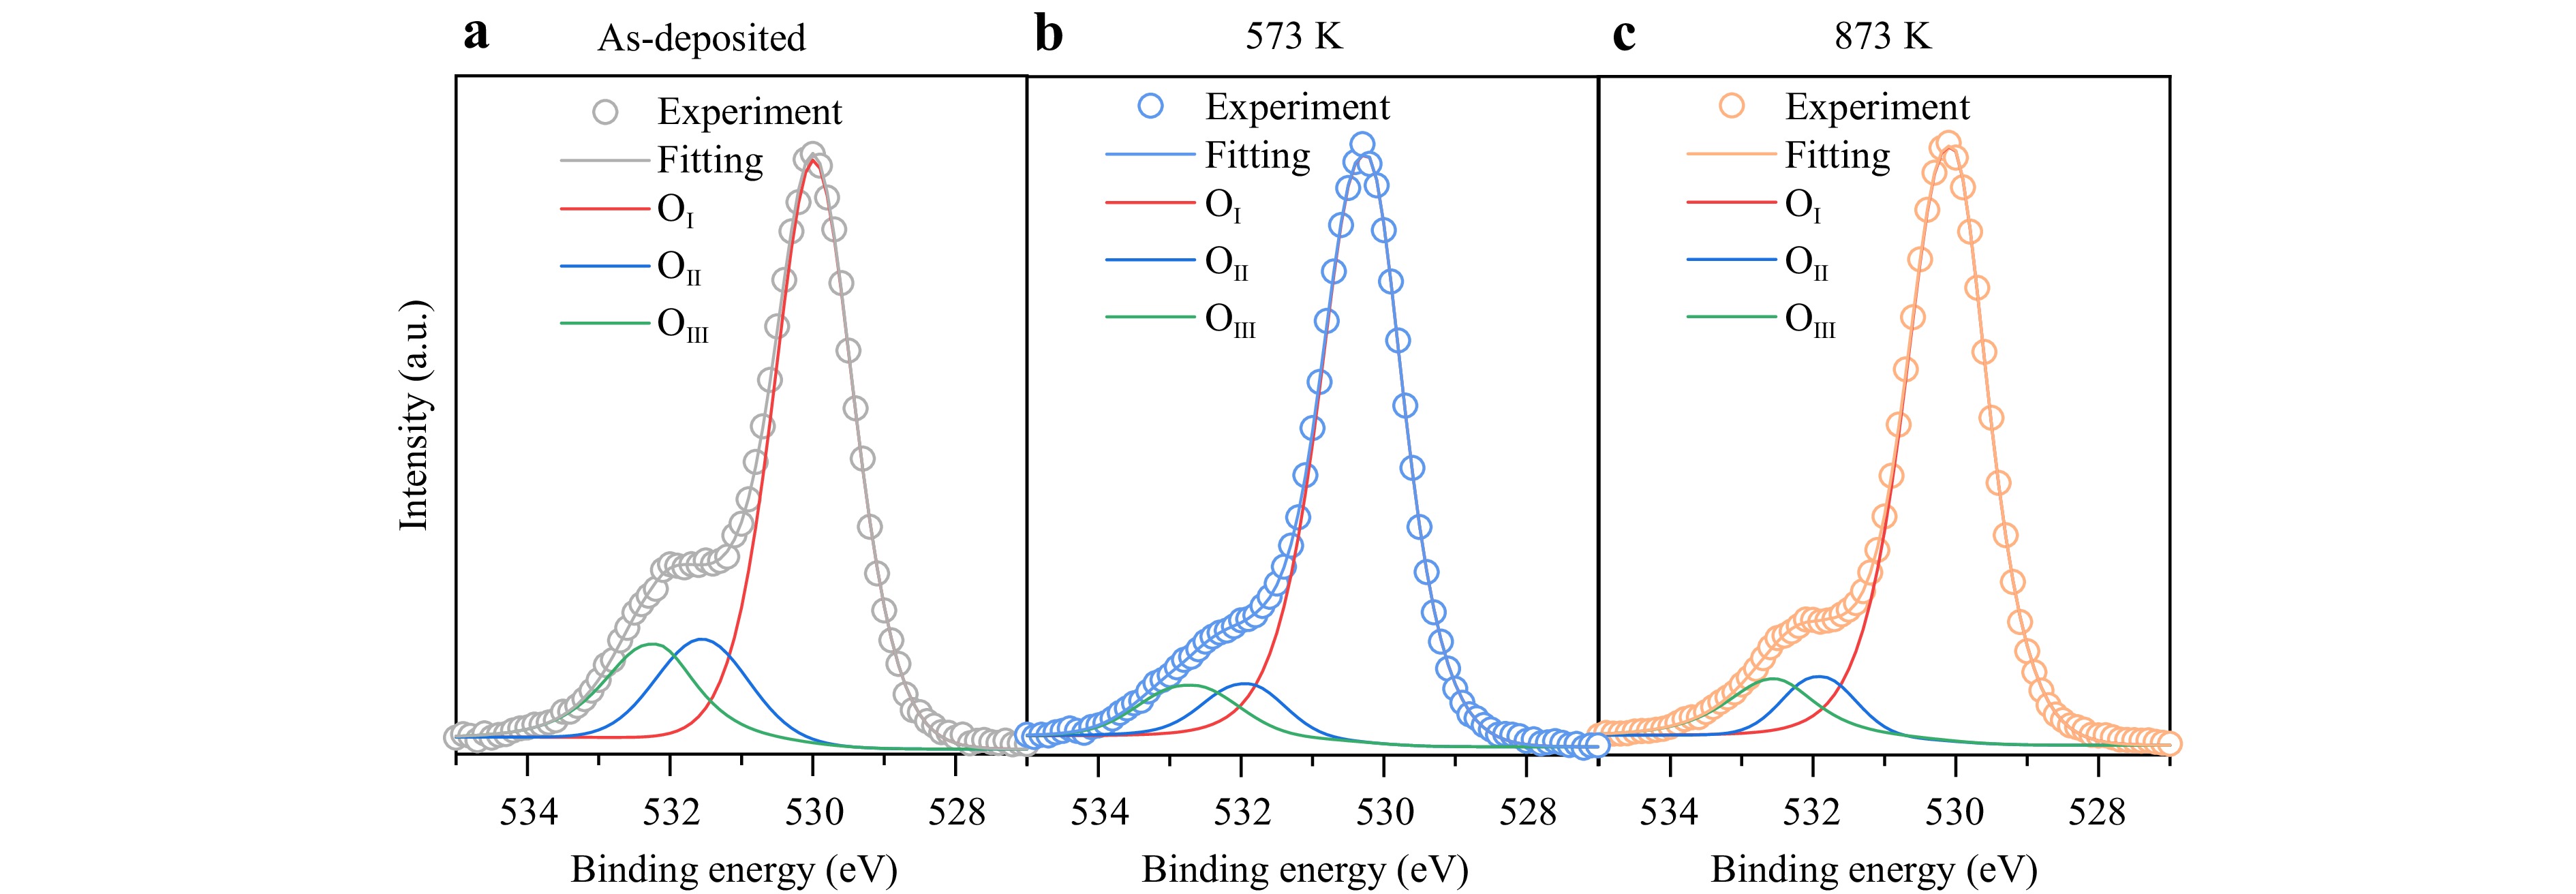
Fig. 6 Surface chemical observation of HR mirrors. XPS patterns of O: a as-deposited sample; sample annealed at b 573 and c 873 K. OI corresponds to lattice oxygen, OII and OIII typically involve hydroxyl and surface-adsorbed oxygen.
The atomic percentages of Ta, Ti, and O in Table 1 were obtained from the XPS analysis. The reported values were normalised to 100 at.%. Based on the above element content, the mass fraction of TiO2 ($ C_{{TiO}_{2}}^{wt} $) and the gain and loss of O in the film were calculated.
Ta (at.%) Ti (at.%) O (at.%) $ C_{{TiO}_{2}}^{wt} $ Om/Oc As deposited 26.0 6.8 67.2 8.6 0.85 573 K 23.6 7.1 69.4 9.7 0.95 873 K 23.1 7.3 69.6 10.3 0.96 Note: $ C_{{TiO}_{2}}^{wt} $ = mass fraction of TiO2; $ {O}_{m} $ and $ {O}_{c} $ are O (at.%), and theoretical O content calculated from the Ti (at. %) and Ta (at. %), assuming stoichiometric TiO2 and Ta2O5 formation. Table 1. XPS-based elemental ratio on the film surfaces.
For the estimation of $ C_{{TiO}_{2}}^{wt} $, Ti and Ta were treated as forming TiO2- and Ta2O5-equivalent compositions according to their stoichiometric O requirements. Let $ {C}_{Ti} $, $ {C}_{Ta} $, and $ {C}_{O} $denote Ti (at.%), Ta (at.%), and O (at.%) in Table 1, respectively.
The molar amounts of TiO2 and Ta2O5 are expressed as:
$$ {n}_{Ti{{O}_{2}}}={C}_{Ti} $$ (6) $$ {n}_{T{{a}_{2}}{{O}_{5}}}=\frac{{C}_{Ta}}{2} $$ (7) The corresponding masses are:
$$ {m}_{Ti{{O}_{2}}}={n}_{Ti{{O}_{2}}}\times {M}_{Ti{{O}_{2}}} $$ (8) $$ {m}_{T{{a}_{2}}{{O}_{5}}}={n}_{T{{a}_{2}}{{O}_{5}}}\times {M}_{T{{a}_{2}}{{O}_{5}}} $$ (9) where $ {M}_{Ti{{O}_{2}}} $and $ {M}_{T{{a}_{2}}{{O}_{5}}} $are the molar masses of TiO2 and Ta2O5, respectively.
Therefore $ C_{{TiO}_{2}}^{wt} $ is
$$ C_{{TiO}_{2}}^{wt}=\frac{{m}_{Ti{{O}_{2}}}}{{m}_{Ti{{O}_{2}}}+{m}_{T{{a}_{2}}{{O}_{5}}}}\times 100\% $$ (10) The results indicate that the TiO2 content in the H layer ranges from 8% to 10%. The slight variation in $ C_{{TiO}_{2}}^{wt} $ among samples may stem from differences in spatial distribution within the coating equipment.
The O stoichiometry was evaluated using the ratio $ {O}_{m}/{O}_{c} $, where
$ {O}_{m} $ is the O (at.%) and
$$ {O}_{m}={C}_{O} $$ (11) $ {O}_{c} $ is the theoretical O content calculated from the Ti (at.%) and Ta (at.%). Assuming stoichiometric TiO2 and Ta2O5 formation
$$ {O}_{c}=2{C}_{Ti}+\frac{5}{2}{C}_{Ta} $$ (12) The ratio $ {O}_{m}/{O}_{c} $ was used to assess deviations from ideal stoichiometry. A value close to one indicates a near-stoichiometric composition, whereas values below or above one suggest O deficiency or excess O, respectively. The $ {O}_{m}/{O}_{c} $ ratio of the as-deposited film was 0.85. After annealing at 573 and 873 K, the $ {O}_{m}/{O}_{c} $ ratios increased to 0.95 and 0.96, respectively. This indicates that annealing at lower temperatures can increase the O content of the film. This confirms the hypothesis that annealing effectively eliminates O vacancies. Notably, compared to samples annealed at 573 K, samples annealed at 873 K exhibited further increases in $ {O}_{m}/{O}_{c} $ ratios. However, as shown in Fig. 3, the absorption intensity increases, suggesting that the increased film absorption at higher temperatures may be less correlated with O vacancies.
Table 2 presents the XPS results for Ta, O, and Ti. For the film annealed at 573 K, the core levels of Ta 4f7/2, O 1s, and Ti 2p3/2 are located at 26.0, 530.2, and 458.5 eV, respectively. These values are close to the reported core levels of 26.0–26.4, 530.5, and 458.6 eV for the corresponding oxidation states36–38. The binding energies of the deposited state and the film treated at 873 K shifted toward lower energies relative to their actual positions in their respective standard XPS spectra. For the as-deposited sample, the mirror annealed at 573 K exhibited an increase in O content (higher $ {O}_{m}/{O}_{c} $), leading to a higher oxidation state of the system. Consequently, the observed increase in the binding energy can be attributed to changes in stoichiometry9,39. However, from 573 to 873 K, $ {O}_{m}/{O}_{c} $ for both is similar, and the O content remained almost unchanged. In the absence of significant compositional or valence state evolution, a consistent negative shift across elements is more likely to stem from changes in the surface potential or enhanced final-state relaxation, rather than from stoichiometric changes. This is in line with observations from XPS studies of charge transfer and binding energy shifts due to surface potential changes40–42. Similar binding-energy shifts related to differential charging have been reported for nonconductive oxide systems. Rahimi et al.42 demonstrated that changes in the charge distribution within a bilayer oxide structure can induce systematic shifts in the O 1s binding energy even in the absence of chemical state evolution. These shifts were attributed to variations in the surface potential and charge redistribution across the metal/oxide interface rather than compositional changes. In the present system, because no evident change in composition or oxidation state was detected between 573 and 873 K, the observed cross-element negative shift is therefore more reasonably associated with modifications in surface potential and final-state screening effects induced by structural evolution at elevated temperature.
Sample Ta (eV) O (eV) Ti (eV) Ta 4f7/2 O 1s Ti 2p3/2 As deposited 25.7 ± 0.1 530.0 ± 0.1 458.2 ± 0.1 573 K 26.0 ± 0.1 530.2 ± 0.1 458.5 ± 0.1 873 K 25.8 ± 0.1 530.1 ± 0.1 458.3 ± 0.1 Reference 26.0–26.4a 530.5b 458.6c References: a 36, 37, b 37, and c 38. Table 2. XPS Peak positions of Ta, O, and Ti.
-
FTIR spectroscopy can detect and quantify localised changes in the structural symmetry of a material. Fig. 7 shows the reflectance spectra of the substrate and samples before and after annealing. For comparison, the spectra of the as-deposited and annealed samples are presented in the same figure. In the low-frequency range (<1,500 cm−1), four characteristic spectral bands are observed for the fused quartz substrate at approximately 560, 795, 980, and 1,170 cm−1. These bands correlate with the vibrational modes of different types of Si–O–Si groups43. After deposition, most of these spectral features remained visible. Moreover, their positions and overall shapes showed only weak dependence on the annealing temperature. Given that the vibrational modes in this spectral range are primarily associated with Si–O–Si bonds, the FTIR response below 1,500 cm−1 is considered to be predominantly governed by the SiO2 (L) layer, whereas the contributions from the TiO2-Ta2O5 (H) layer are less pronounced in this region.
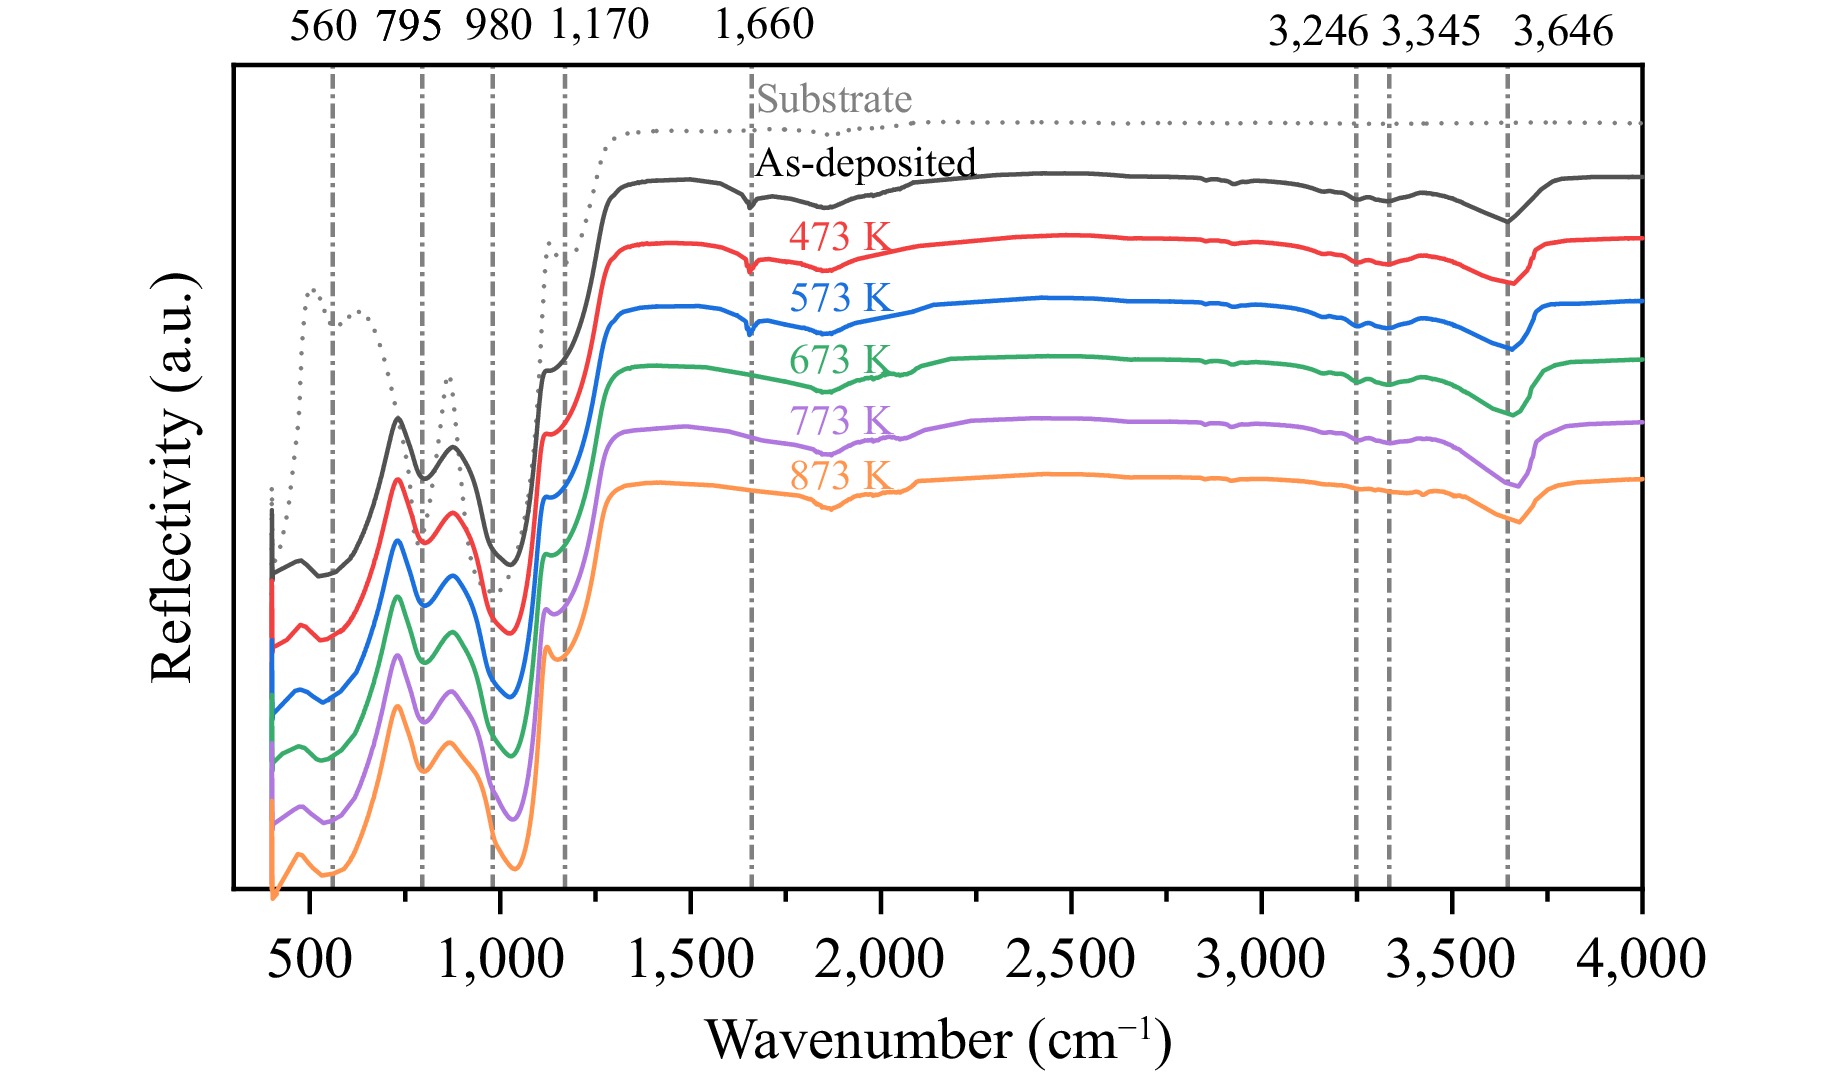
Fig. 7 FTIR spectra of HR mirrors in the as-deposited state and at different annealing temperatures. For comparison, the spectra of the deposited and annealed states are shown in the same figure.
Specifically, the spectral band at approximately 1,170 cm−1 in the substrate reflects the asymmetric stretching vibration of Si–O–Si44. This peak shifted toward lower frequencies after coating, indicating that deposited SiO2 exhibits a looser structure than the fused quartz substrate45. Furthermore, a slight blue shift occurs in this band with increasing annealing temperature, suggesting that the deposited silica gradually densifies during thermal treatment, making its structure more similar to that of the substrate.
In the high-frequency range (>1,500 cm−1), FTIR primarily reveals responses from various water and hydroxyl groups within the film. The substrate spectrum shows no discernible features at the characteristic positions of these bands, suggesting that its contribution to the observed water- and hydroxyl-related signals is limited. The spectral bands at approximately 3,650, 3,300, and 1,660 cm−1 in the film samples were primarily correlated with surface hydroxyl groups and various water-bound states46,47. In the annealed samples, the spectral band near 1,660 cm−1, assigned to the H–O–H bending vibration of adsorbed water, becomes barely discernible for annealing temperatures of 673 K and above. This suggests that adsorbed water molecules on the film surface are substantially reduced after high-temperature annealing. At an annealing temperature of 873 K, the spectral band near 3,200 cm−1 attributed to water complexes bound to the film surface largely disappears. This form of binding is more difficult to remove than adsorbed water; thus, a higher temperature is required to eliminate the bond. The broad band for 873 K annealed sample, located at 3,650 cm−1, is attributed to the O–H stretching vibration of surface hydroxyl groups. This vibration frequency correlated with the surface structure of the film, shifting toward higher frequencies with increasing annealing temperature. This indicated that the surface reconstruction process was accompanied by enhanced hydroxyl bonding. The FTIR spectral results demonstrated that annealing significantly influenced the bonding states of the water and hydroxyl groups within the film. However, the spectral differences between 673 and 773 K annealed samples are relatively minor, suggesting that water content is also unlikely to be the primary factor causing increased film absorption.
Raman spectroscopy can capture the vibrational modes of the chemical bonds in materials, reflecting changes in their microstructures. Fig. 8 shows the Raman spectra of the substrate along with the deposited coatings at different annealing temperatures. The spectra were normalized to the maximum intensity over the full spectral range. The axis break is used only to improve visual clarity. The fused quartz substrate exhibits characteristic Raman bands at 440, 490, 605, and 800 cm−1 within the 50–1,300 cm−1 range, demonstrating typical amorphous SiO2 features48. In contrast, most of these features were not observed in any of the mirror samples, indicating that the TiO2-Ta2O5 layer exhibited a higher Raman activity, effectively masking the Raman signals from the SiO2 in the substrate and the L layer.
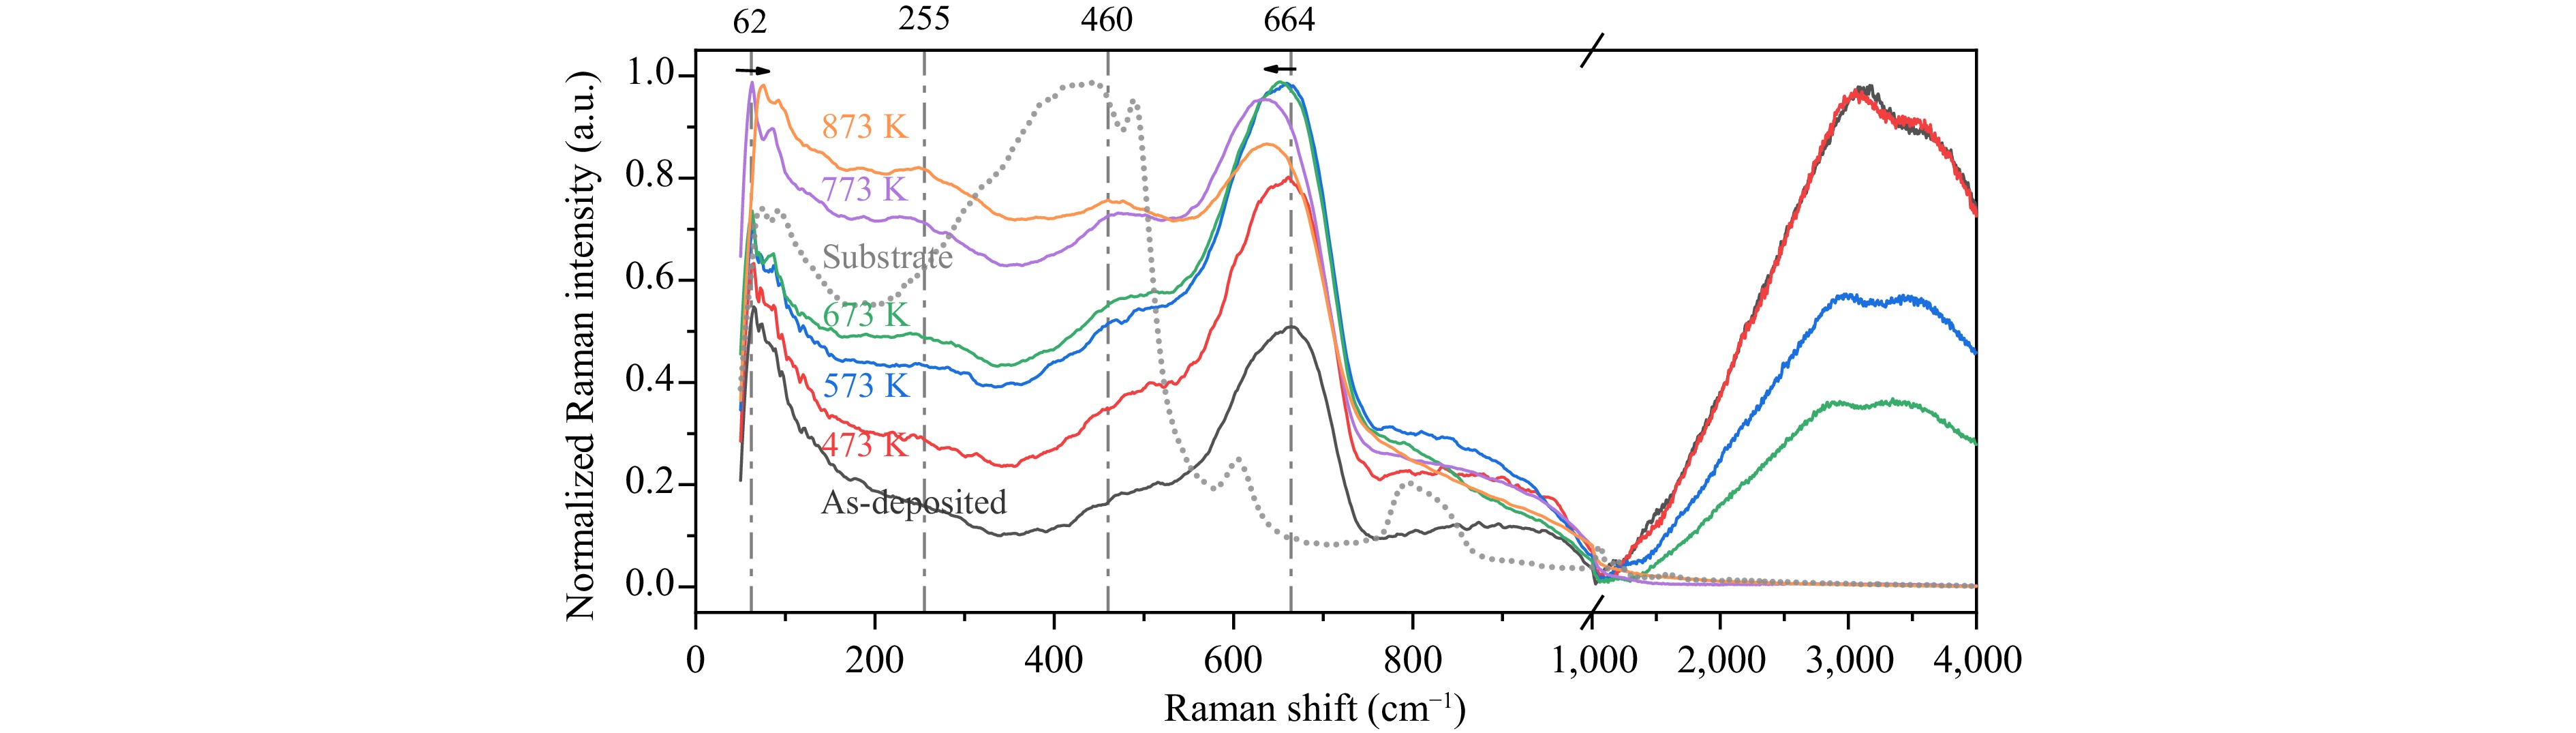
Fig. 8 Raman spectra of HR mirrors in the as-deposited state and at different annealing temperatures. The spectra were normalized to the maximum intensity over the full spectral range. The axis break is used only to improve visual clarity.
The left-hand region of Fig. 8 shows that the Raman response of the coating exhibits distinct variations across the 50–1,000 cm−1 range at different annealing temperatures. With increasing treatment temperature, the overall spectrum transitioned from a broadened to a sharpened profile.
The modes at approximately 255 and 460 cm−1 primarily originate from the vibrations of the O–Ta–O and O–Ti–O bonds and their coupled interactions49. These two vibrational modes gradually emerge and become more pronounced for annealing temperatures exceeding 573 K. Because the spectra were normalized over the full spectral range, the enhanced normalized intensity indicates an increased relative Raman contribution from these local bonding units. This suggests that the local Ta–O and Ti–O bonding environments become more distinct and that the short-range order in the H layer is improved with increasing annealing temperature. The spectral band at approximately 660 cm−1 primarily corresponds to symmetric Ta–O vibrations within the TaO6 octahedra50. Its shift toward lower Raman shifts with increasing annealing temperature may indicate a decrease in vibrational frequency, corresponding to an increase in the average Ta–O bond length51.
The band features <100 cm−1 are mainly associated with vibrational interactions between different polyhedral units within the structural network52. With increasing annealing temperature, the normalized intensity of this band increases, indicating an enhanced relative Raman contribution from inter-polyhedral vibrational modes. This suggests that the relative arrangement of polyhedral structural units becomes more stabilized and structurally defined, reflecting improved short- to intermediate-range ordering in the amorphous network. Notably, at 873 K, the band near 62 cm−1 shifts toward higher wavenumbers. Dobal et al.53 reported a similar blue shift of this band with increasing annealing temperature for TiO2-Ta2O5 ceramics, whereas no such shift was observed in annealed pure Ta2O5 ceramics. This comparison suggests that the 62 cm−1 mode likely reflects interactions between Ti–O and Ta–O polyhedra rather than vibrations among identical Ta–O polyhedra. The observed blue shift indicates a more compact arrangement between the TiO6 octahedra and Ta–O clusters, corresponding to a reduced average Ti–Ta distance.
In the amorphous TiO2-Ta2O5 network, the Ti and Ta atoms are predominantly interconnected through bridging O atoms. Therefore, the shortening of the average Ti–Ta distance together with the previously discussed increase in the average Ta–O bond length may collectively result in a reduction in the Ti–O bond length. These results suggest that with increasing annealing temperature, the Ti–O polyhedra may undergo contraction, whereas the Ta–O polyhedra evolve in the opposite direction, gradually developing preferential orientations. Such differential evolution may indicate the onset of partial phase segregation and enhanced structural distortion within the amorphous matrix.
Overall, these observations indicate that thermal treatment enhances the medium- and short-range structural orders of the films. The structure evolved from a highly disordered network toward microstructural ordering. This structural evolution was consistent with the trends observed in the AFM results.
The right-hand region of Fig. 8 displays the Raman spectrum in the 1,000–4,000 cm−1 range. The spectrum of the as-deposited sample exhibited a broad peak centred near 3,200 cm−1 and extending over a wide spectral range, indicating a strong fluorescence effect. According to previous studies, this fluorescence may have originated from impurity states within the amorphous structure54,55. As the annealing temperature increases, the normalized intensity of this fluorescence peak diminishes to varying degrees and essentially disappears at 773 K. Based on the previous test results, we speculated that the change in Raman fluorescence intensity may be related to alterations in the bonding form of Ti within the film. Considering the patterns observed in the lower Raman shift spectrum, the disappearance of the fluorescence may have resulted from the crystallisation transition and phase separation of the Ti–O groups.
For the as-deposited and low-temperature annealed films, two spectral bands remained in the fluorescence background, located at approximately 3,100 and 3,700 cm−1, reflecting crystalline water and surface-adsorbed water in the film, respectively56. As the annealing temperature increases, the normalized intensities of both bands gradually decrease, accompanied by a reduction in the Raman shift. This indicates a decrease in the water content within the film and the associated changes in the bond lengths of the relevant groups. At an annealing temperature of 773 K, both spectral bands disappear along with the fluorescence background.
The experimental results indicate that oxygen vacancies may be responsible for the absorption observed in the films annealed at lower temperatures. For films annealed at higher temperatures, the absorption likely originated from localised crystallisation and phase separation within the amorphous structure. The subsequent sections employ MD and DFT methods to further validate the evolution process and absorption mechanism.
-
To verify the reliability of the constructed models, the densities of all the configurations are summarised in Fig. 9. The 1,000 K model, which represents the as-deposited structure, was constructed and calculated only once; therefore, no error bars are provided for this case. By contrast, the annealed models were generated using five random initial seeds, and the reported densities correspond to the average values. The error bars indicate statistical fluctuations among these independent runs. The grey shaded region denotes the experimentally reported density range of TiO2-Ta2O5 (6.80–7.68 g·cm−3)24,57.
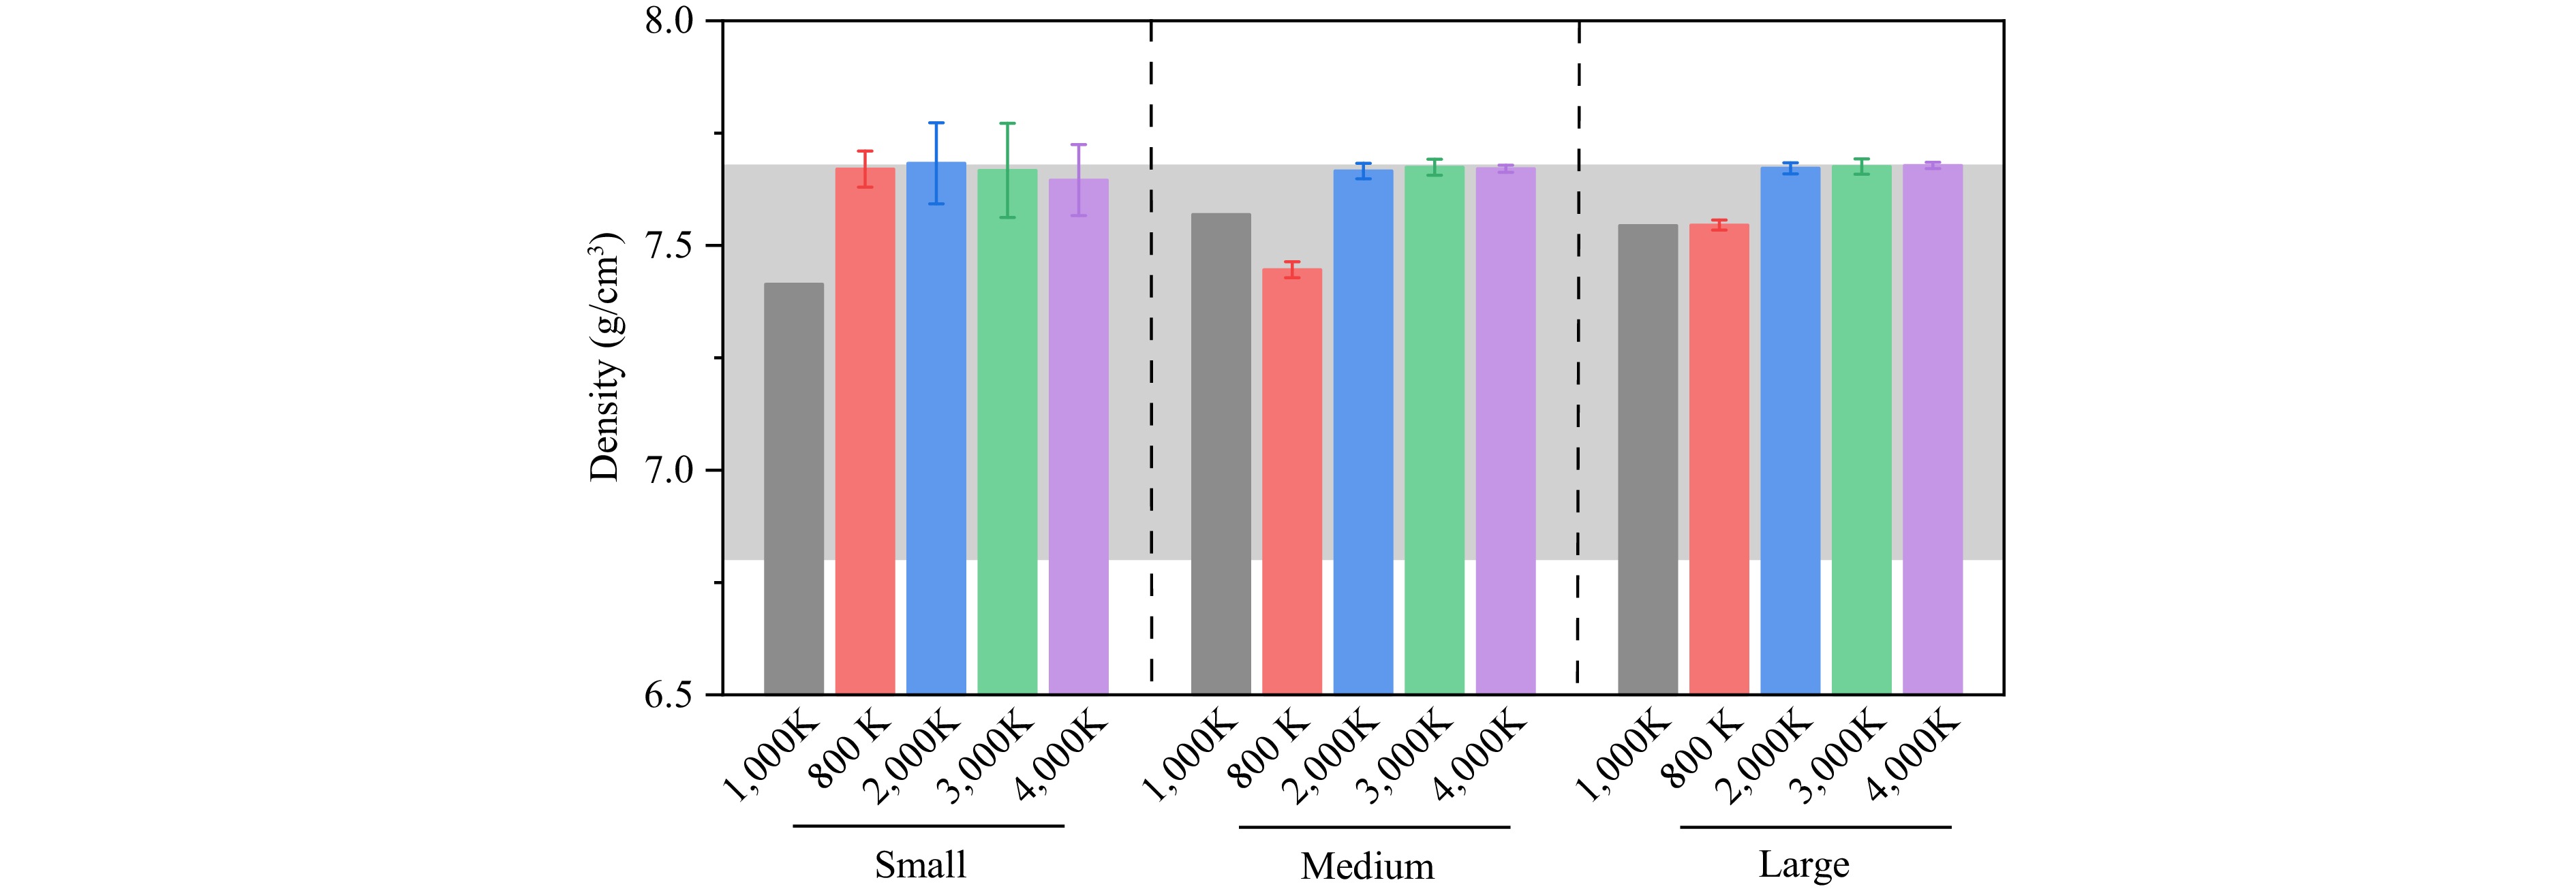
Fig. 9 Statistical summary of the densities of the MD models. The grey shaded region indicates the experimentally reported density range of TiO2-Ta2O5 (6.80–7.68 g·cm−3)24,57. The 1000 K model, which represents the as-deposited structure, was calculated only once. The annealed models were independently generated using five different random initial seeds, and the averaged densities were plotted; the error bars represent statistical variation among these runs.
It can be observed that most simulated densities fall within the experimental range, demonstrating the structural reliability of the constructed models. The relatively large fluctuations observed in the small models can be attributed to finite-size effects. Under NPT conditions, the relative magnitude of the volume fluctuations scales inversely with system size. Smaller systems containing fewer atoms and smaller volumes exhibited more pronounced volume fluctuations, leading to larger statistical variations in density. As the model size increased, these fluctuations were effectively averaged and the density values became more stable.
To further examine the local structural characteristics, the RDFs of all models were calculated. The RDF data presented in this study correspond to the time-averaged results over the last 25 ps of the equilibrated NVE trajectories, thereby minimising the influence of instantaneous thermal fluctuations.
Fig. 10 summarises the positions of the first coordination shell peaks for the Ta–O and Ti–O pairs in all models. Consistent with the density analysis, annealed models were independently generated using five random seeds, and the reported values represent the average peak positions with corresponding statistical variations.
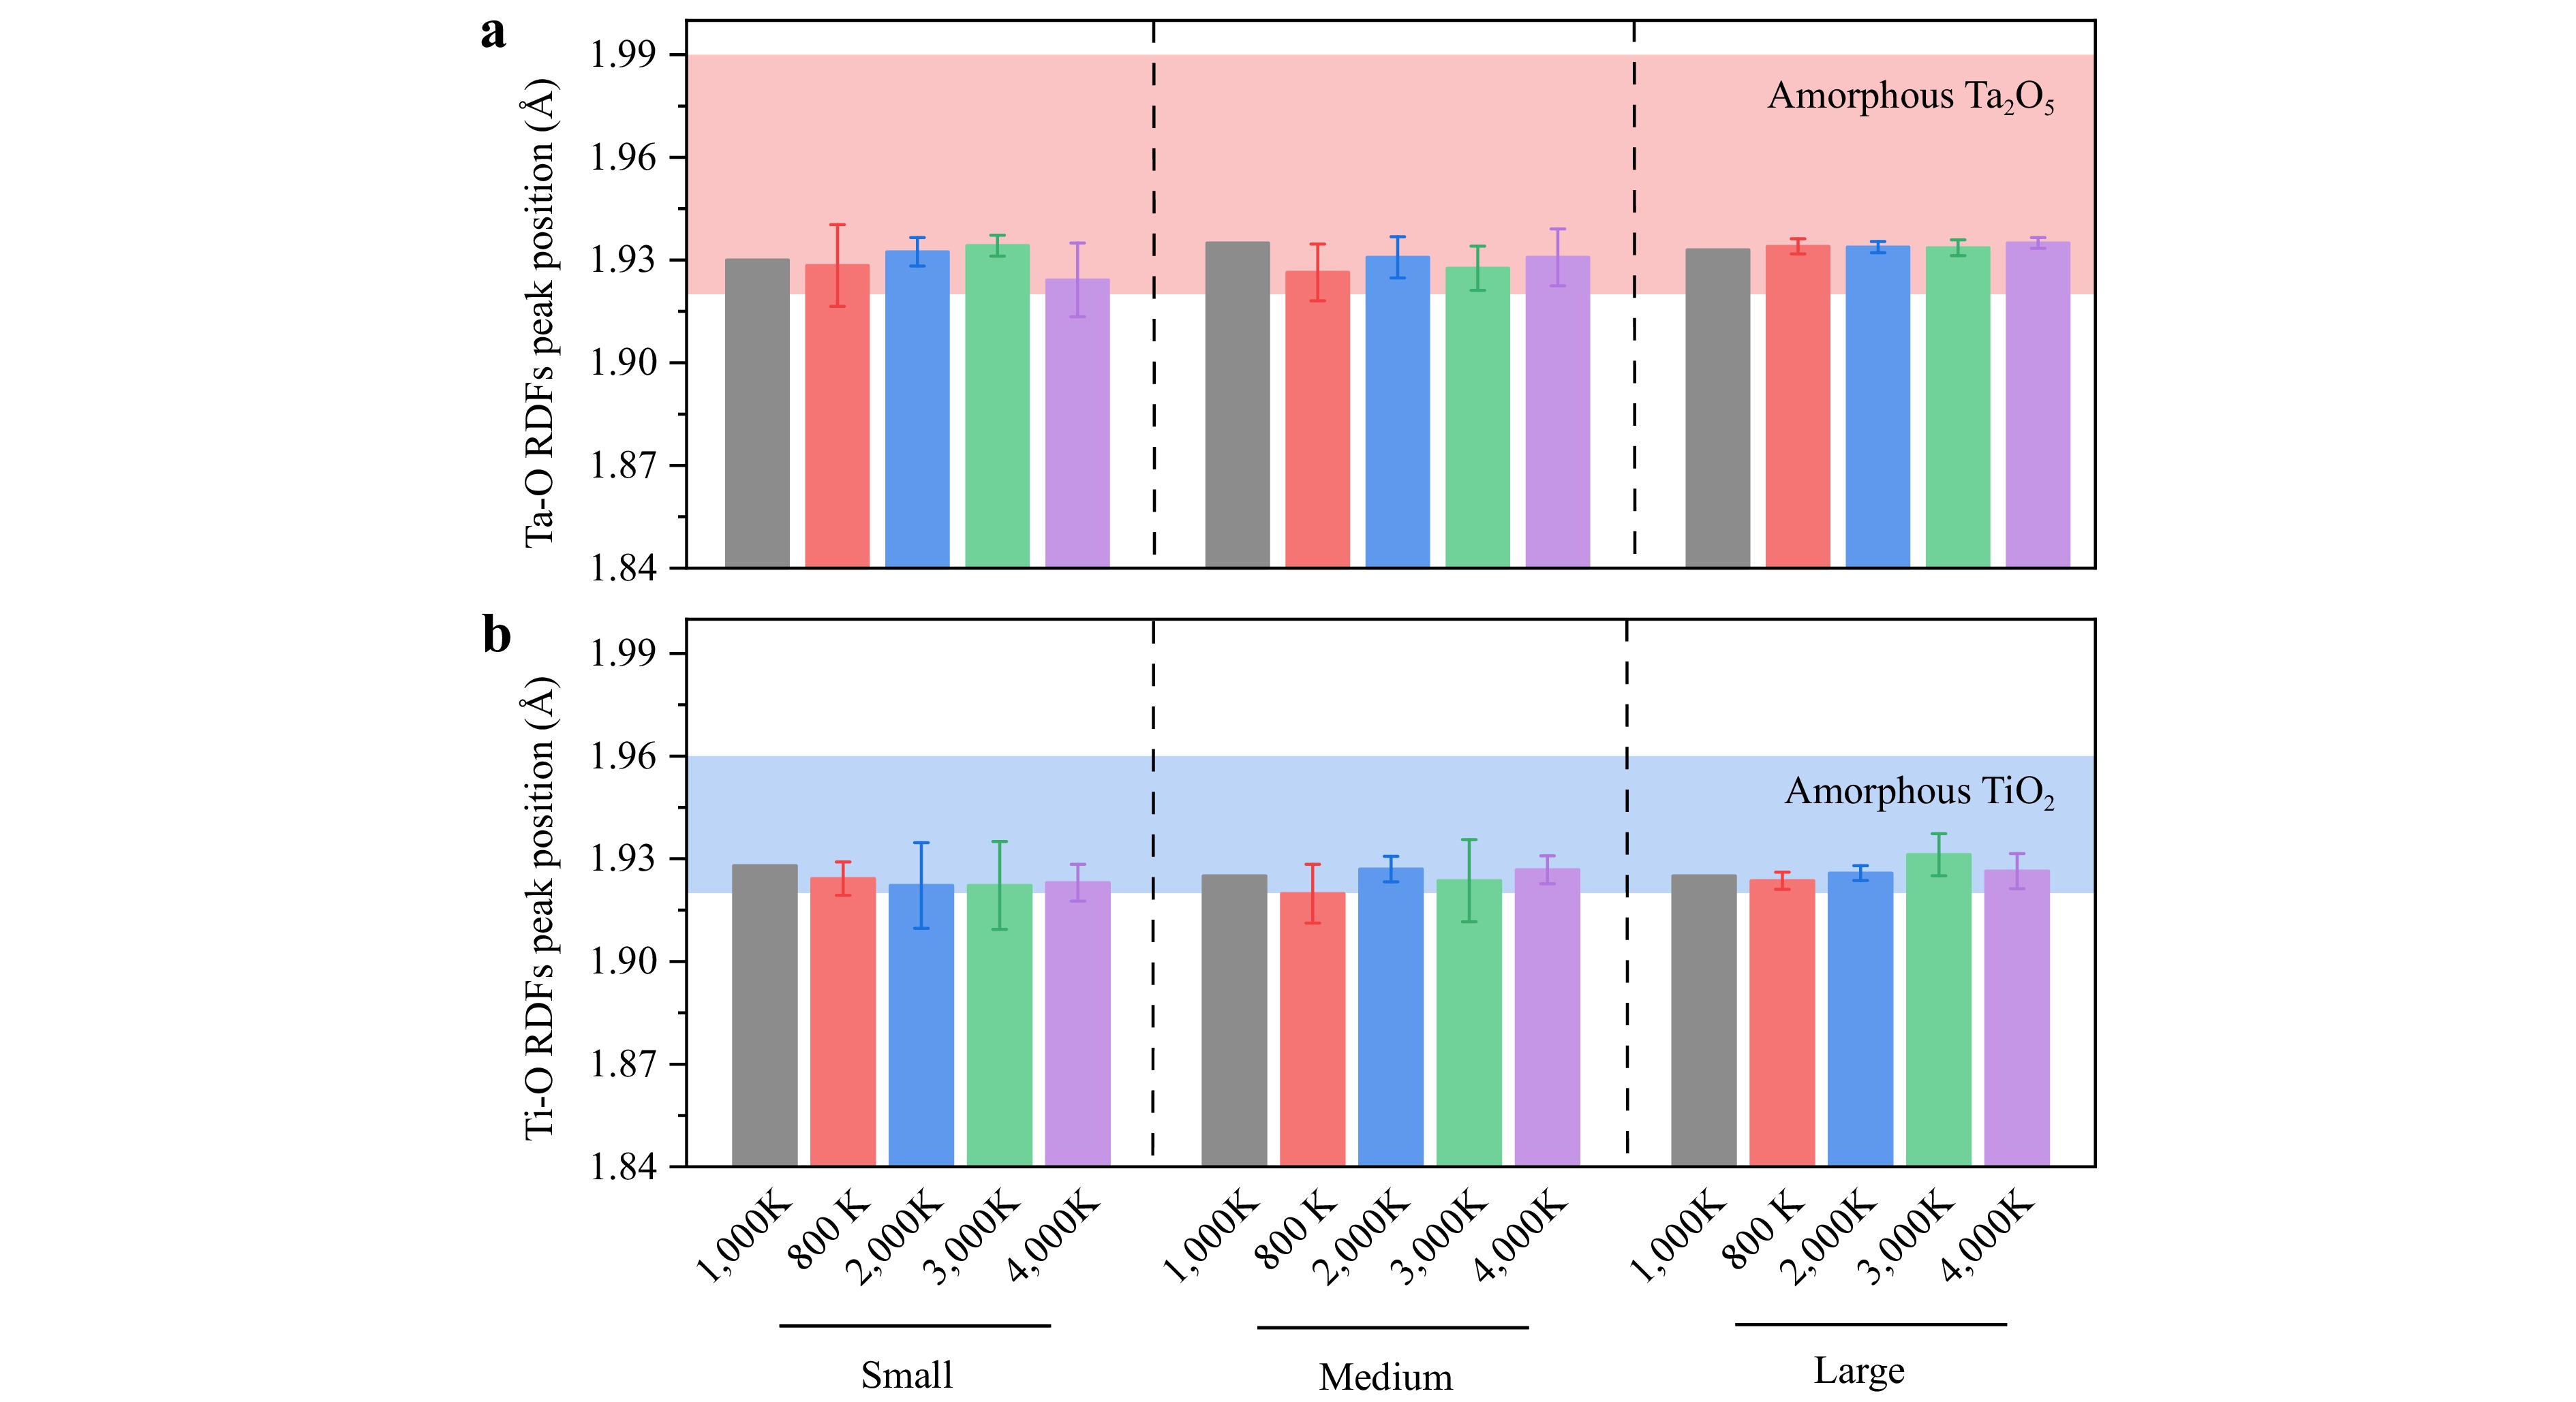
Fig. 10 Radial distribution function (RDF) analysis of all models. Annealed models were independently generated using five random initial seeds; the averaged peak positions with corresponding statistical variations are presented. a First-shell peak positions of the Ta–O RDF. The light red shaded region marks the reported bond-length range for amorphous Ta2O5 (1.92–1.99 Å)24,57. b First-shell peak positions of the Ti–O RDF. The light blue shaded region marks the reported bond-length range for amorphous TiO2 (1.92–1.96 Å)21,58.
As shown in Fig. 10a, the Ta–O bond lengths are mainly distributed within 1.92–1.94 Å, which lies within the experimentally reported range for amorphous Ta2O5 (1.92–1.99 Å)24,57. As shown in Fig. 10b, the Ti–O bond lengths are primarily located between 1.92–1.93 Å, also within the reported experimental range for amorphous TiO2 (1.92–1.96 Å)21,58, and are overall slightly shorter than the Ta–O bonds. These results indicated that the simulated models reproduced the expected local bonding environments.
To elucidate the evolution of Ti–O clusters during annealing, the normalized Ti–Ti RDFs, denoted as $ {G}_{Ti-Ti}(r) $, were analysed for the large models. Compared to the small (8 atoms) and medium (64 atoms) Ti models, the large model contained 288 Ti atoms, providing sufficient Ti–Ti pair statistics to ensure reliable RDF analysis.
As shown in Fig. 11, the as-deposited structure (1,000 K, black curve) exhibits two characteristic peaks at 3.12 (Peak A) and 3.57 Å (Peak B). Peak A was primarily associated with cyclic Ti–O–Ti bonding configurations, whereas Peak B was mainly attributed to more linear Ti–O–Ti linkages. These distinct peak positions reflect the different Ti–O–Ti connectivity types within the amorphous network. At 800 K (red curve), the intensities of Peak A and B remain nearly unchanged, whereas a slight increase in the intensity between the two peaks is observed, indicating limited local atomic rearrangements without significant structural reconstruction. At 2,000 K (blue curve), the intensity of Peak A increases markedly, suggesting enhanced short-range Ti–Ti correlations and the onset of Ti–O cluster aggregation and structural reorganisation. When the temperature reached 3,000 K (green curve), Peak B became significantly more pronounced, reflecting strengthened medium-range Ti–Ti correlations and further cluster growth. At the highest relaxation stage (4,000 K, purple curve), Peak B decreased slightly, whereas Peak A increased substantially, indicating a shift of the Ti–Ti correlations toward shorter distances. This behaviour indicates the evolution of relatively extended linear-like configurations toward more compact cyclic-like configurations. Overall, as the degree of structural relaxation increased, the Ti–O clusters progressively aggregated and tended to evolve into more compact cyclic configurations in highly relaxed states.
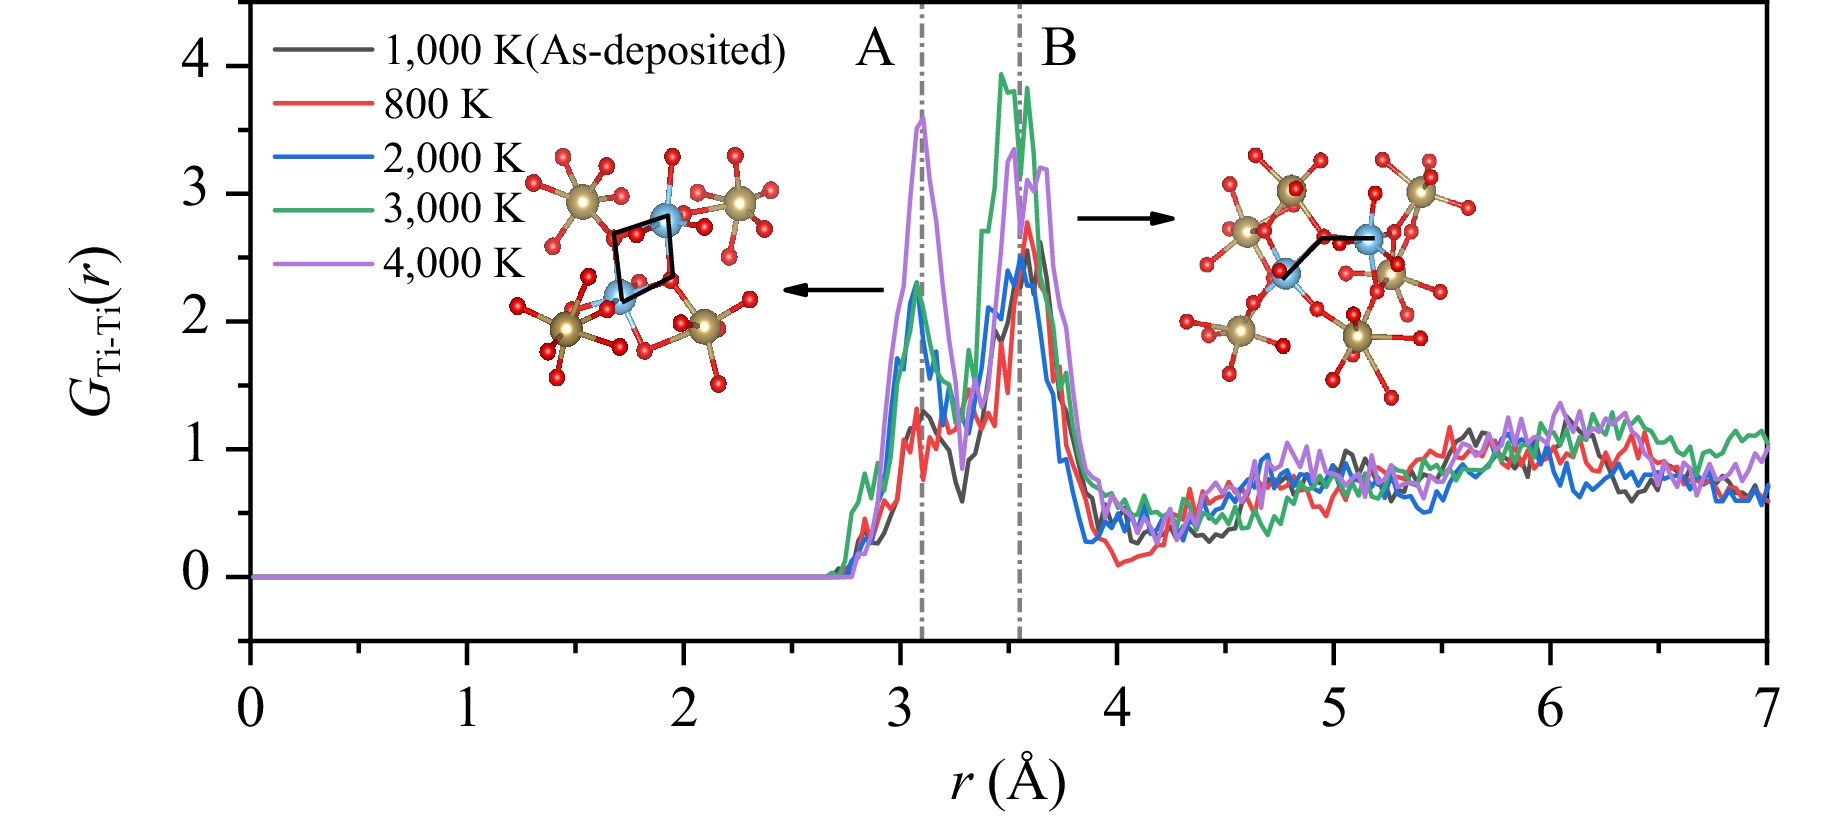
Fig. 11 Normalized Ti–Ti RDFs, $ {G}_{Ti-Ti}(r) $, of the large models as a function of interatomic distance $ r $. Peak A is primarily associated with cyclic Ti–O–Ti bonding configurations, whereas Peak B is mainly attributed to more linear Ti–O–Ti linkages.
To further quantify the aggregation behaviour of the Ti atoms, cluster statistics were performed for the medium and large models at different relaxation stages. The number of Ti clusters and Ti atoms within each cluster were analysed. An n-member cluster (nMC) was defined as a cluster containing n Ti atoms.
Fig. 12 shows the cluster statistics for different relaxation levels. In the early relaxation stage (800 K), the total number of clusters remained nearly unchanged compared to the as-deposited structure (1,000 K). The system was dominated by 2MCs and accompanied by only a small fraction of 3MCs, indicating that the Ti atoms mainly exhibited localised short-range associations. At 2,000 K, 4MCs began to emerge in both the medium and large models, suggesting enhanced Ti–Ti correlations and the onset of cluster growth. At higher relaxation level (3,000 and 4,000 K), the populations of 2MCs and 3MCs decreased slightly, whereas the number of 4MCs continued to increase. Meanwhile, larger clusters, such as 5MCs and clusters containing more than six Ti atoms, emerged and progressively grew in number. This behaviour indicated that smaller Ti clusters gradually merged and reorganised into larger aggregates during structural relaxation. The observed trend is consistent with the enhanced Ti–Ti correlations in the RDF analysis, further supporting progressive Ti aggregation and a tendency toward local Ti enrichment or phase-separation-like behaviour in highly relaxed states.
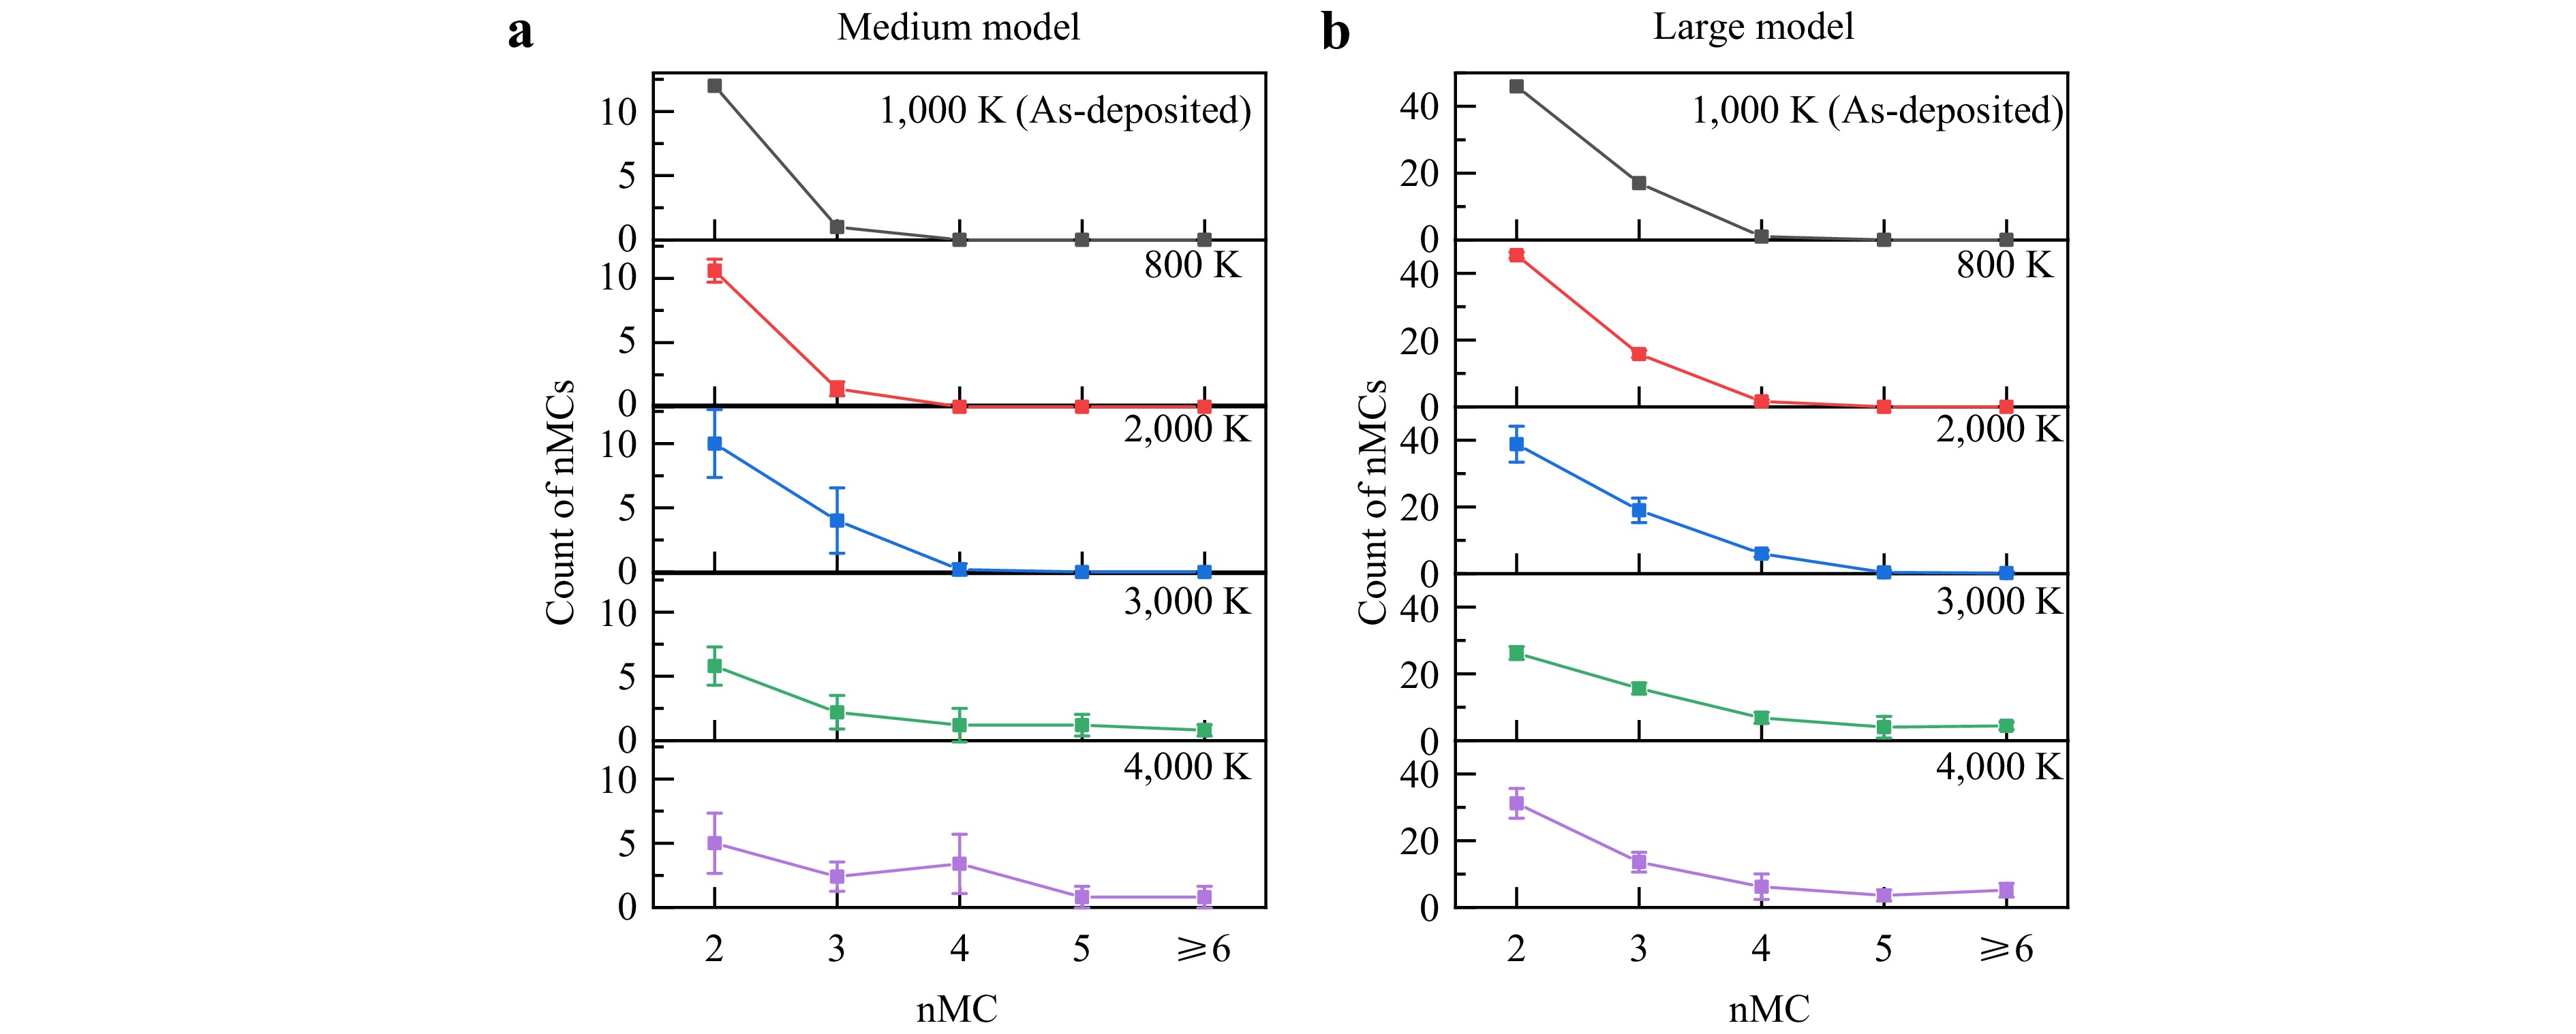
Fig. 12 Statistics on the number of Ti–O clusters and Ti atoms per cluster obtained at different target temperatures for a medium and b large models. Annealed models were independently generated using five random initial seeds. An n-member cluster (nMC) was defined as a cluster containing n Ti atoms.
During annealing, a subset of small models exhibited a clear tendency toward structural ordering. As small models are more sensitive to local structural rearrangements, representative configurations were selected to provide an effective description of the micro-regional structural evolution. Fig. 13 illustrates the structural changes in these models at different relaxation stages. At relatively low relaxation levels (Fig. 13a-c), the system maintained a largely disordered network structure. The 800 K configuration preserved most of the residual structural characteristics inherited from the as-deposited (1,000 K) state. Upon relaxation to 2,000 K, these residual features were largely eliminated, and the structure remained predominantly amorphous. When the relaxation level was increased to 3,000 K, as shown in Fig. 13d, a discernible tendency toward ordering emerged along a specific direction. Regular layered features are observable within the black dashed box, indicating the onset of localised structural ordering. At 4,000 K (Fig. 13e), the layered arrangement became more evident, and periodic features began to develop within the individual layers (highlighted by the green dashed circle). These characteristics exhibit similarities to λ-like orthorhombic structural motifs, although the overall structure remains partially disordered59.
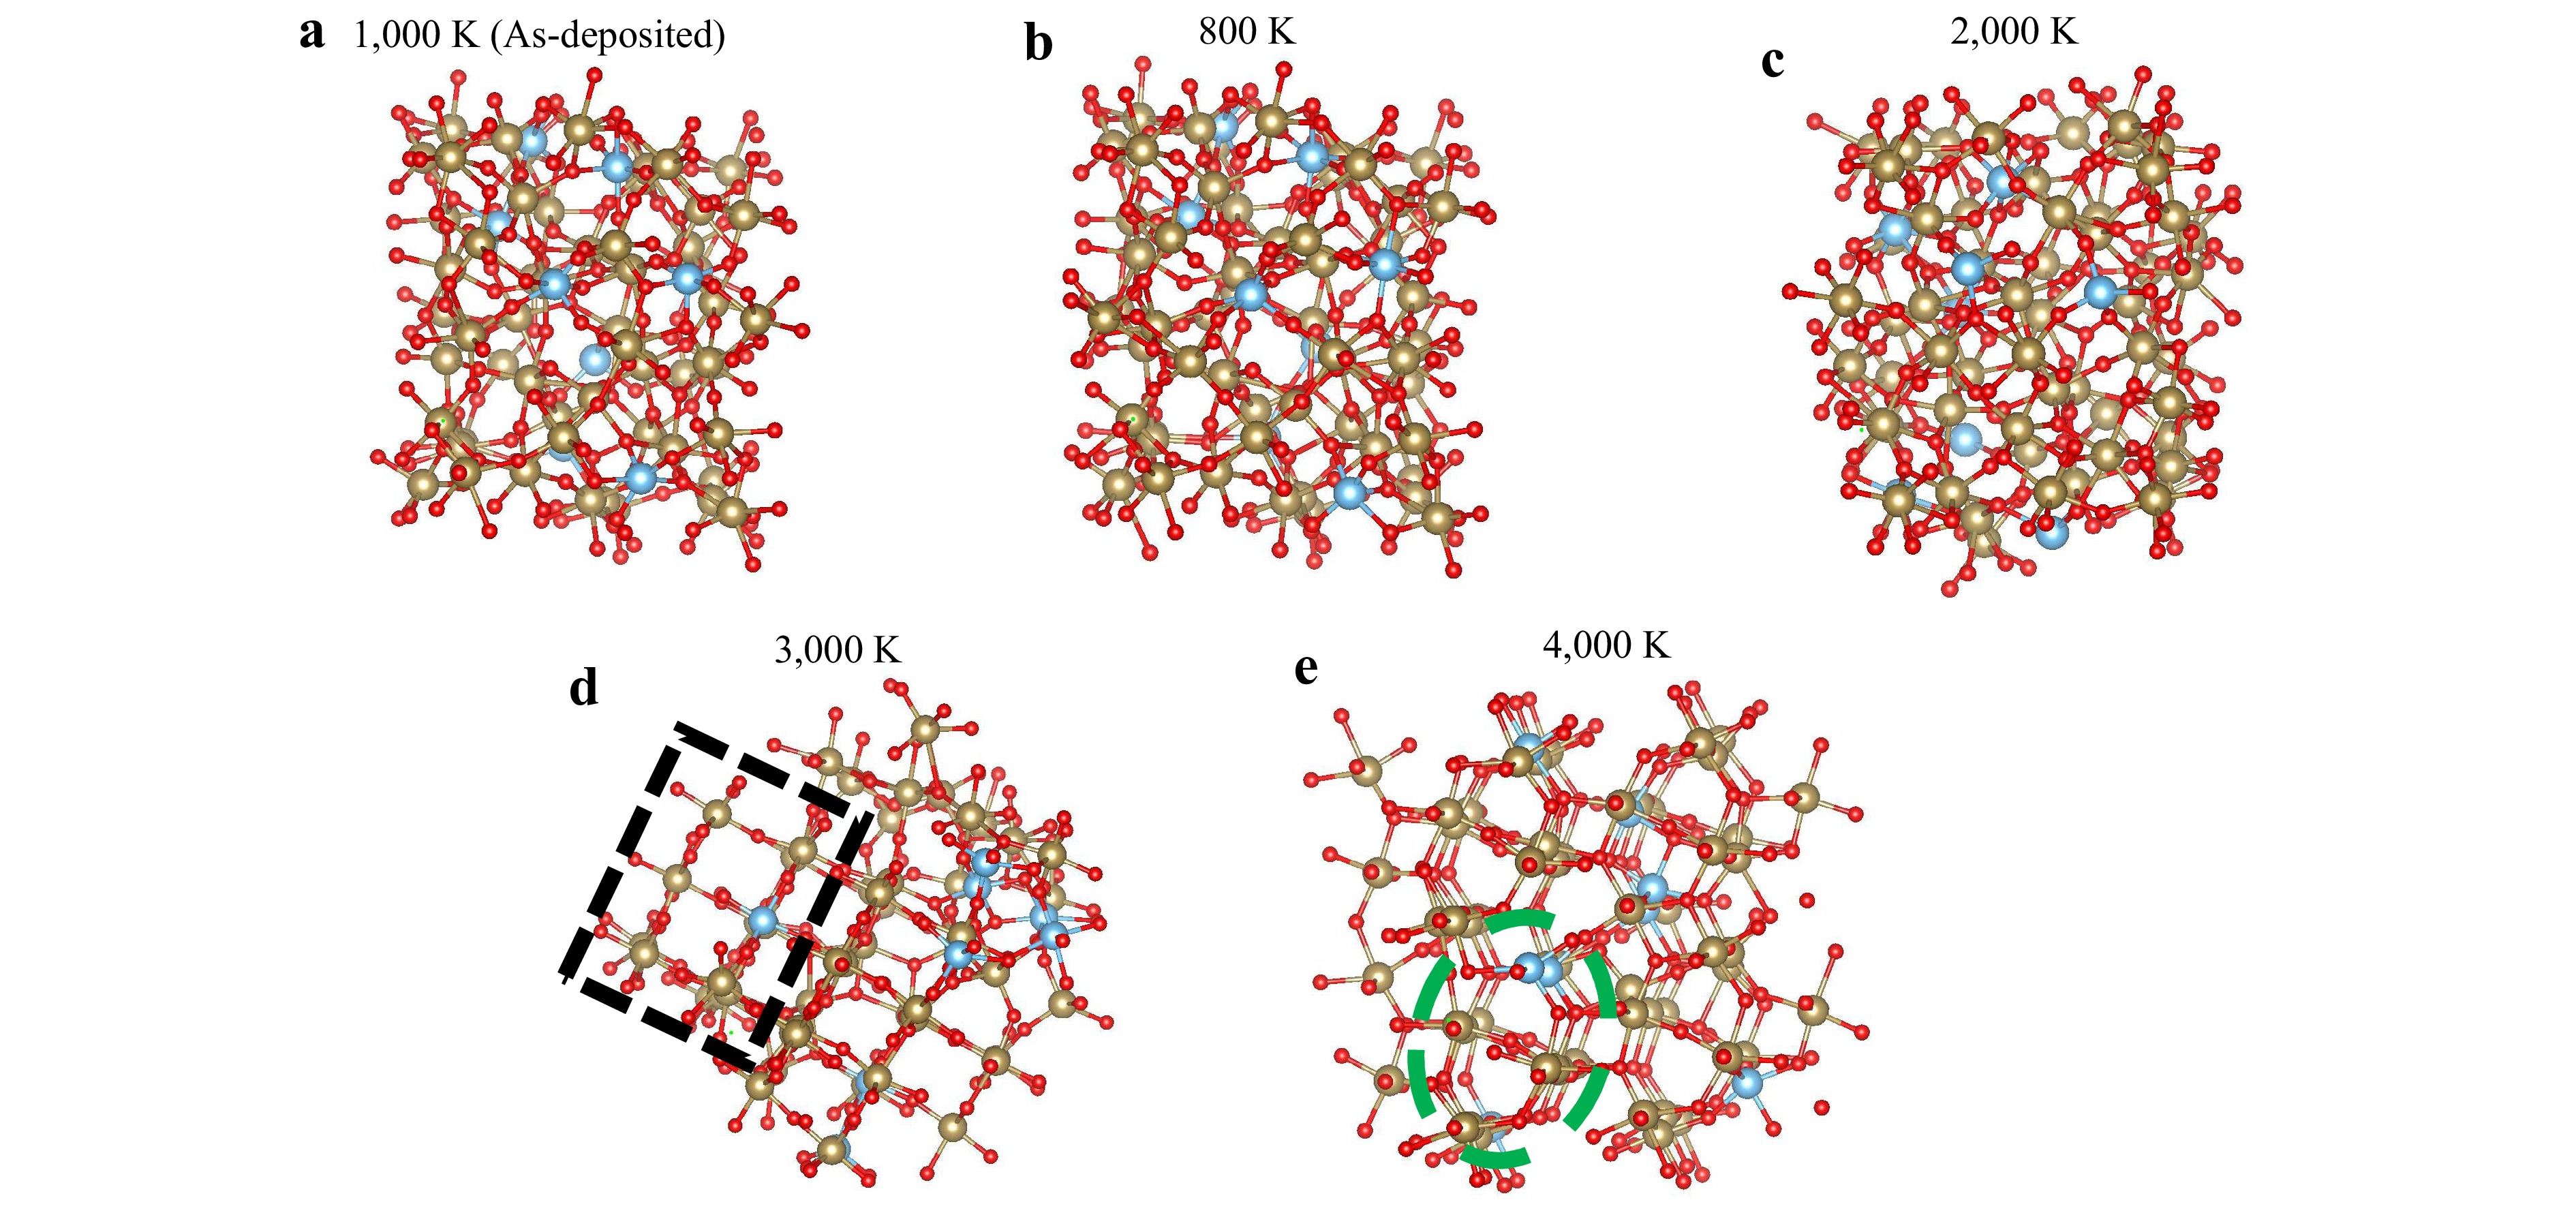
Fig. 13 Atomic structures of small models at different target temperatures (gold, red, and blue represent Ta, O, and Ti atoms, respectively): a 1,000 (as-deposited), b 800, c 2,000, d 3,000, and e 4,000 K. The area marked by the black dashed box in (d) exhibits regular layered characteristics; the area marked by the green dashed circle in (e) reveals regular periodic characteristics in the intra-layer structure.
To further quantify these structural changes, the RDFs of Ta–O, Ti–O, Ta–Ta, and O–O were calculated for small-sized models (Fig. 14). At low relaxation levels (Fig. 14a-c), the RDF curves retain typical amorphous features, which is consistent with the structural observations. For the 3,000 K configuration (Fig. 14d), additional features appeared in the range of 4–8 Å (black dashed circle), corresponding to enhanced second-shell correlations. This indicates an increase in the medium-range structural ordering. At the highest relaxation stage (4,000 K; Fig. 14e), the intensities of the RDF peaks increased to varying extents, suggesting further enhancement of the structural ordering. Moreover, near the first coordination distances of Ta–O (2.13 Å) and Ti–O (2.02 Å), the originally smooth RDF profiles begin to show slight inflection (red dashed circle). The emergence of such features suggests a redistribution of the bond-length populations, implying a tendency toward more well-defined local bond distances. This effect was more evident for Ta–O, whereas the Ti–O curve exhibited only a subtle inflection. This behaviour implies that the Ta–O and Ti–O polyhedral units undergo structural reorganisation to different extents during relaxation. Notably, the Ti–O first-shell peak becomes somewhat sharper than that of Ta–O, indicating a relatively more uniform local environment around the Ti atoms, which is consistent with the observations reported by Damart et al.24. These structural and RDF results suggest that, with increasing relaxation, localised ordering progressively develops within the amorphous TiO2-Ta2O5 system, and a crystallisation tendency may emerge under highly relaxed conditions. This trend is consistent with the morphological evolution observed in the AFM measurements and implies a possible tendency toward local phase separation at advanced relaxation stages.
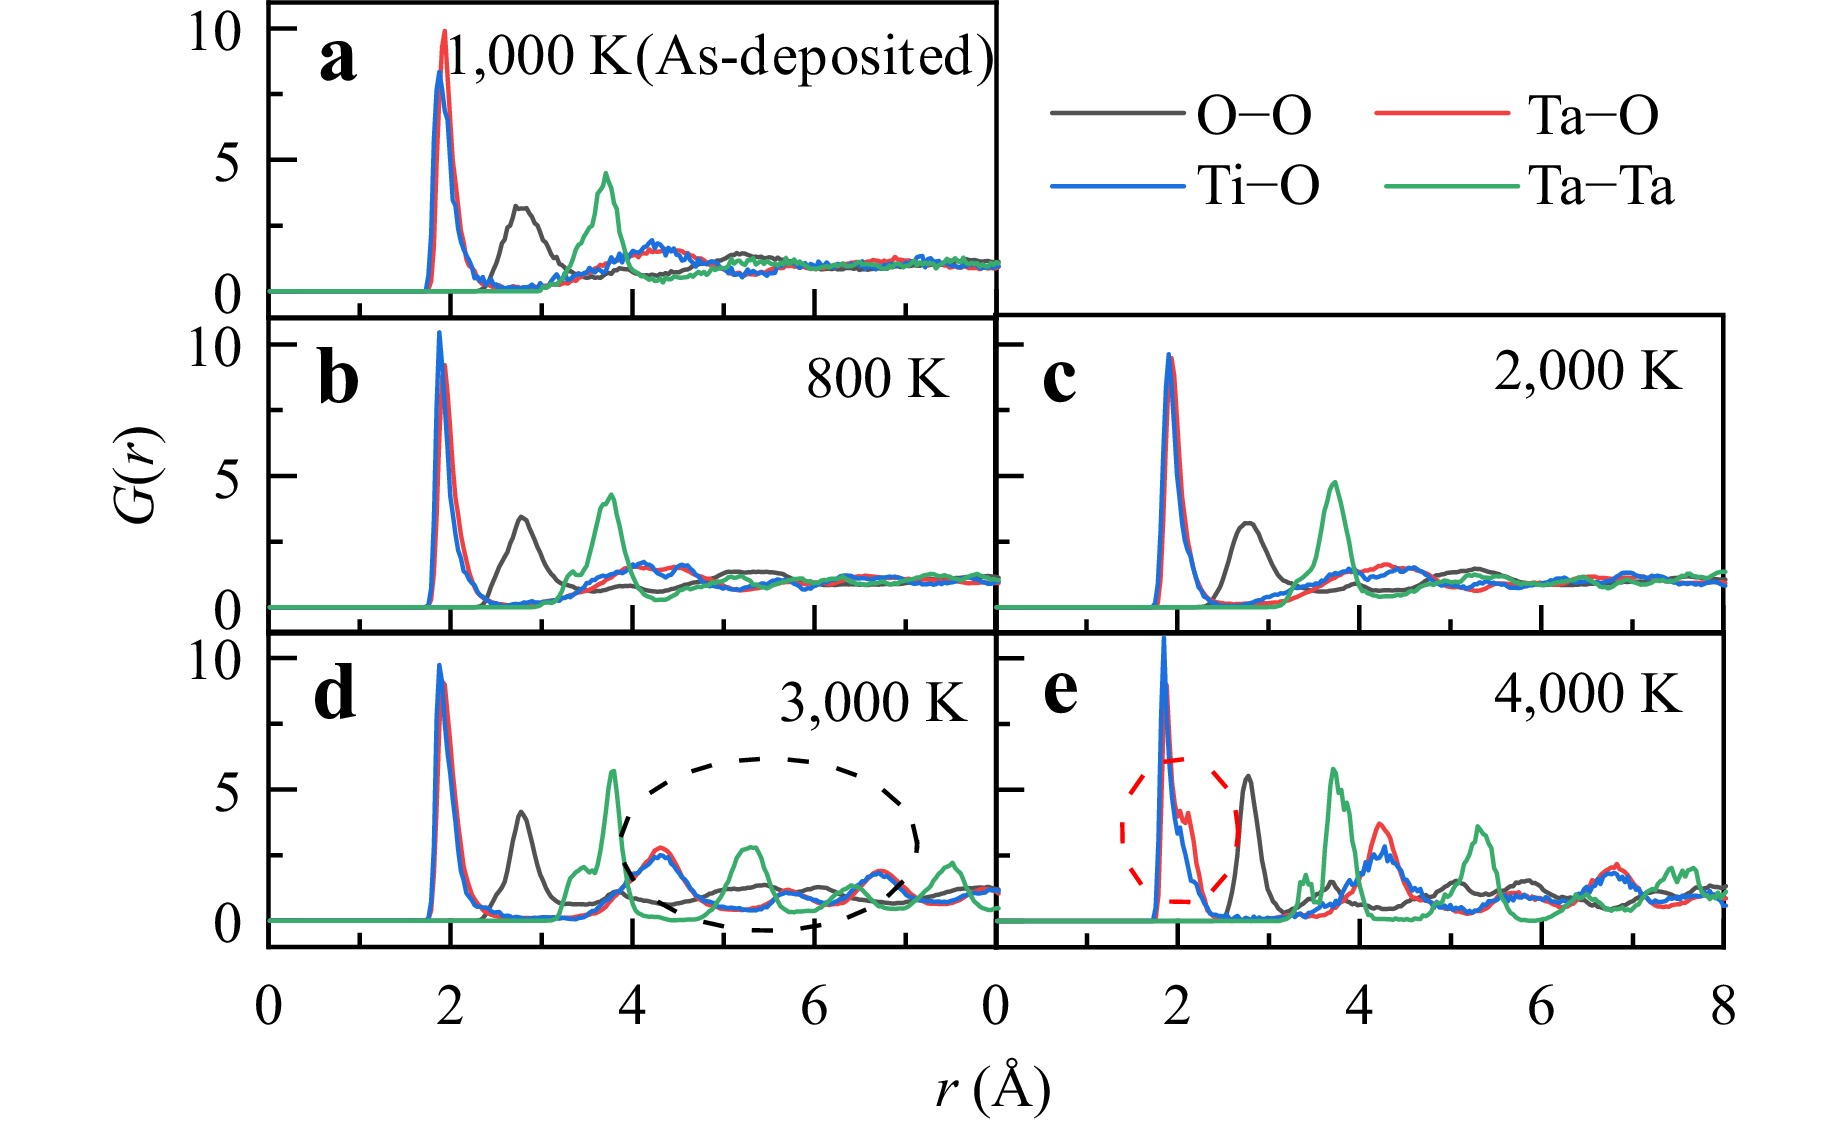
Fig. 14 RDFs of the small-sized models for O–O, Ta–O, Ti–O, and Ta–Ta pairs at different target temperatures: a 1000 (as-deposited); b 800; c 2,000; d 3,000, and e 4,000 K. The area marked by the black dashed circle in (d) indicate the emergence of second coordination shell features; the area marked by the red dashed circle in (e) indicate slight inflection in the Ta–O and Ti–O RDFs at 2.13 and 2.02 Å, respectively, departing from their previously smooth profiles.
-
To investigate the impact of the structural changes on the optical properties of TiO2-Ta2O5, the electronic structure and optical absorption of small models were studied using DFT. For the samples in the as-deposited state and those annealed at lower temperatures, no additional calculations were performed. This is because their atomic position changes are minimal, and previous studies using similar models have confirmed that the induced absorption is primarily attributed to oxygen vacancies, which are strongly composition-dependent rather than structure15,17,60.
For the samples annealed at higher temperatures, the electronic structures were calculated at 2,000, 3,000, and 4,000 K to obtain the density of states (DOS) for each element, and the results are shown in Fig. 15. Although spin-polarised calculations were performed to account for the possible defect-induced localised states, the total magnetic moment of the system was negligible, indicating that the Ti-doped Ta2O5 structure remained nonmagnetic. The apparent mirroring of the DOS along the x-axis arises from the standard spin-resolved representation (spin-up positive and spin-down negative) and does not indicate spin splitting.
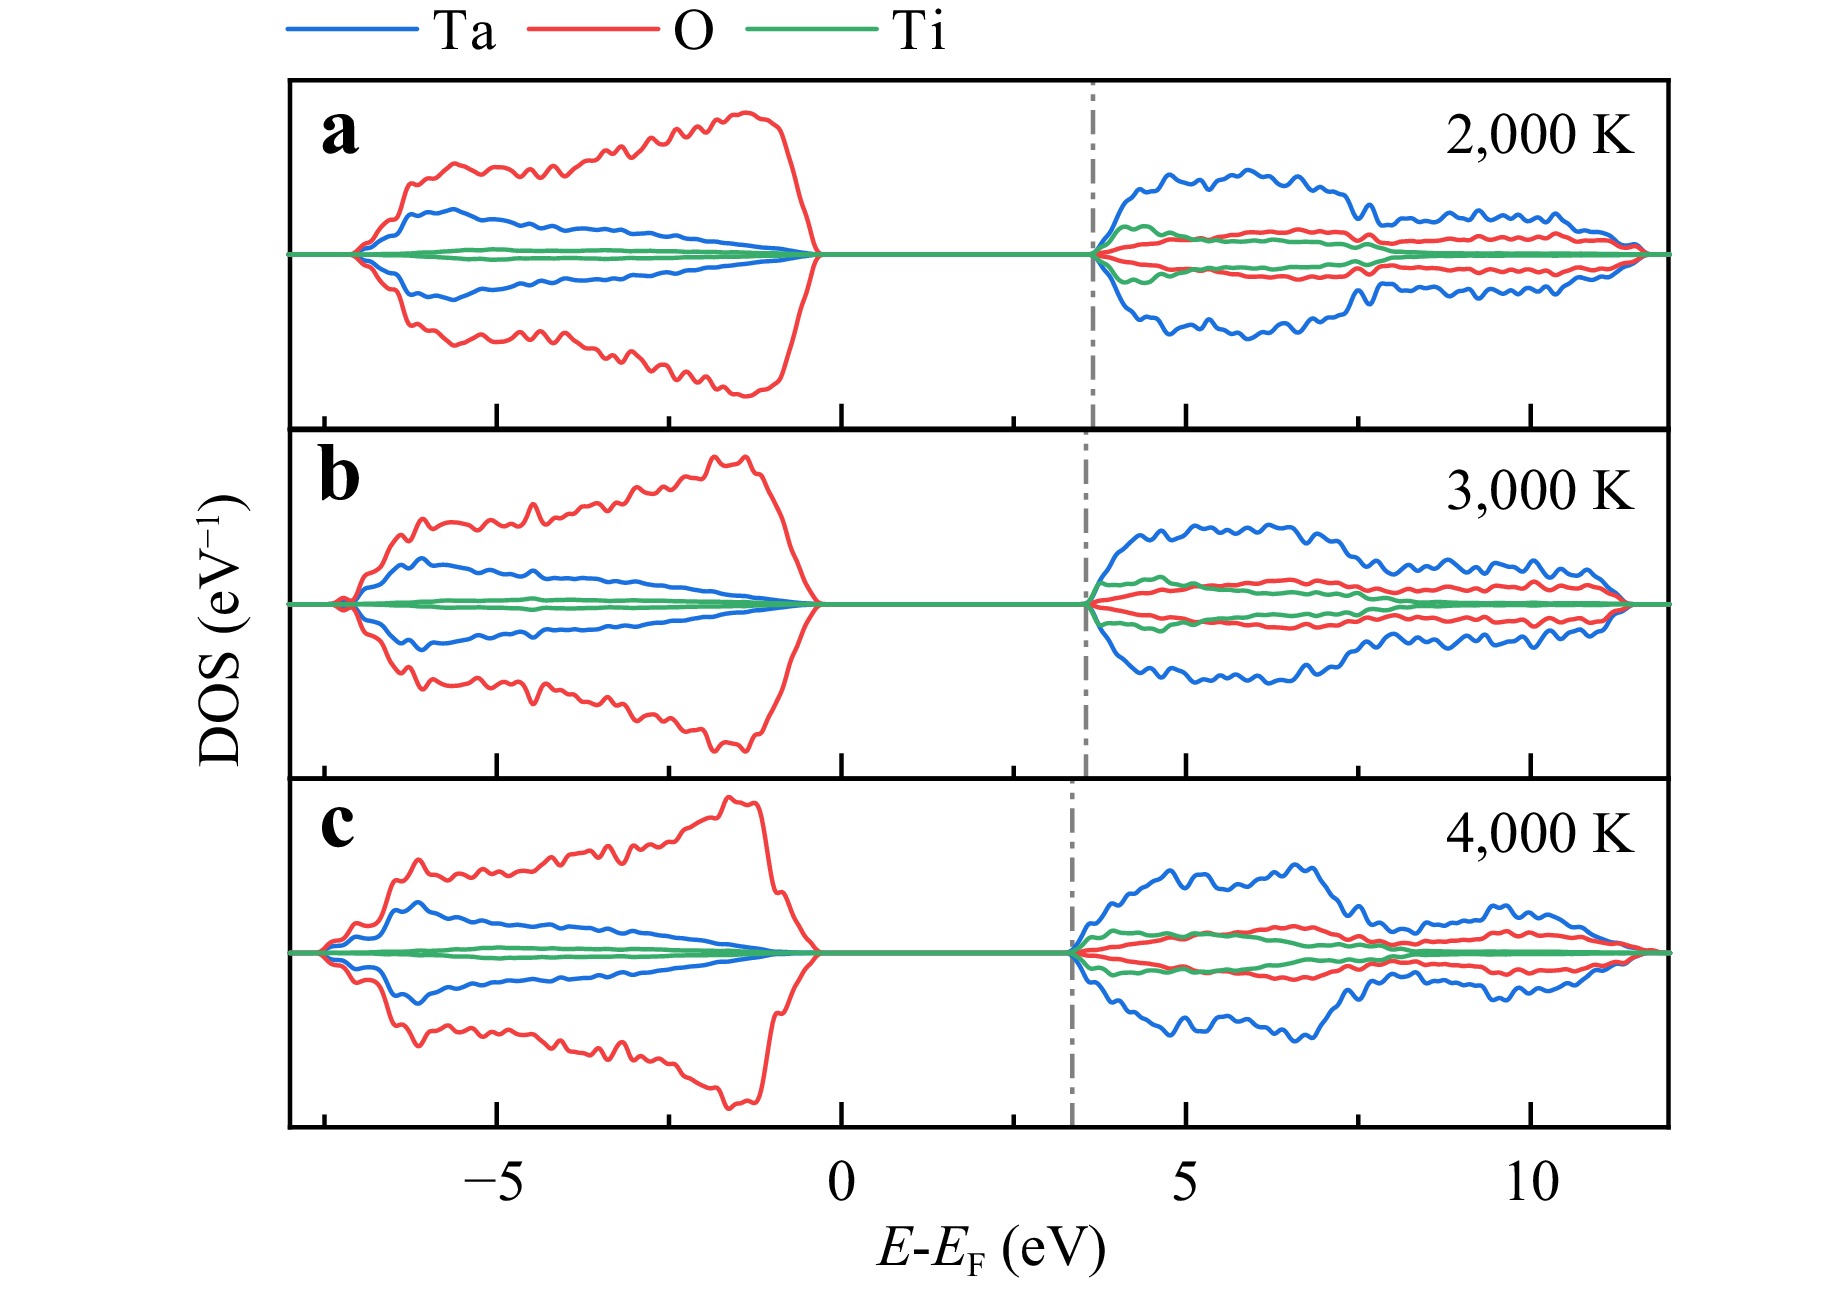
Fig. 15 Density of states (DOS) calculated using the HSE06 hybrid functional for the small models for annealed temperatures of a 2,000, b 3,000, and c 4,000 K. The total magnetic moment of the system was negligible, indicating that the TiO2-Ta2O5 structure remains nonmagnetic.
Strong hybridisation among the O 2p, Ta 5d, and Ti 3d orbitals was observed in both the valence and conduction bands. The valence band maximum (VBM) was predominantly contributed by the O 2p states, whereas the conduction band minimum (CBM) was mainly derived from the Ta 5d states. As the model closest to the crystalline structure, the 4,000 K system (Fig. 15c) exhibited more pronounced energy splitting than the 2,000 and 3,000 K systems. Particularly within the 4–11 eV range, the Ta 5d orbitals tended to split into t2g (3dxy, 3dxz, and 3dyz) and eg (3dx2−y2 and 3dz2) orbitals61. This indicated a tendency toward structural ordering. Concurrently, the band gap progressively narrows with increasing simulated temperature, decreasing from 3.89 eV (2,000 K) to 3.76 eV (3,000 K), and ultimately to 3.55 eV (4,000 K), as indicated by the grey dashed lines in Fig. 15. Combined with the structural evolution patterns observed in the MD simulations, this narrowing of the gap is likely attributable to structural anisotropy.
This conclusion was further confirmed by calculating the optical properties. Fig. 16 shows the extinction coefficient ($ k $) curves for the three models, with each plot showing the three directional components: XX, YY, and ZZ. In Fig. 16a, the curves for the system annealed at 2,000 K nearly overlap across all three directions within 0–6 eV, indicating that the amorphous structure is isotropic. In Fig. 16b, the three curves begin to diverge at approximately 4 eV, indicating increased anisotropy in the system. This phenomenon becomes even more pronounced (Fig. 16c), as the $ k $ curve in the XX direction shifts to the left and deflects upward. This shift may explain the increased absorption observed in films at higher temperatures. For the same model, the curve with the highest $ k $ within the 0–4 eV range among its three directional components was selected as representative and is displayed in Fig. 16d. The samples annealed at higher temperatures exhibited relatively higher $ k $. The DFT results indicated that with increasing structural ordering, the electronic structure progressively evolved toward TiO2-like characteristics, accompanied by enhanced anisotropy in the optical response. This trend suggests that structural ordering and local phase enrichment may modify the electronic transitions that contribute to absorption.
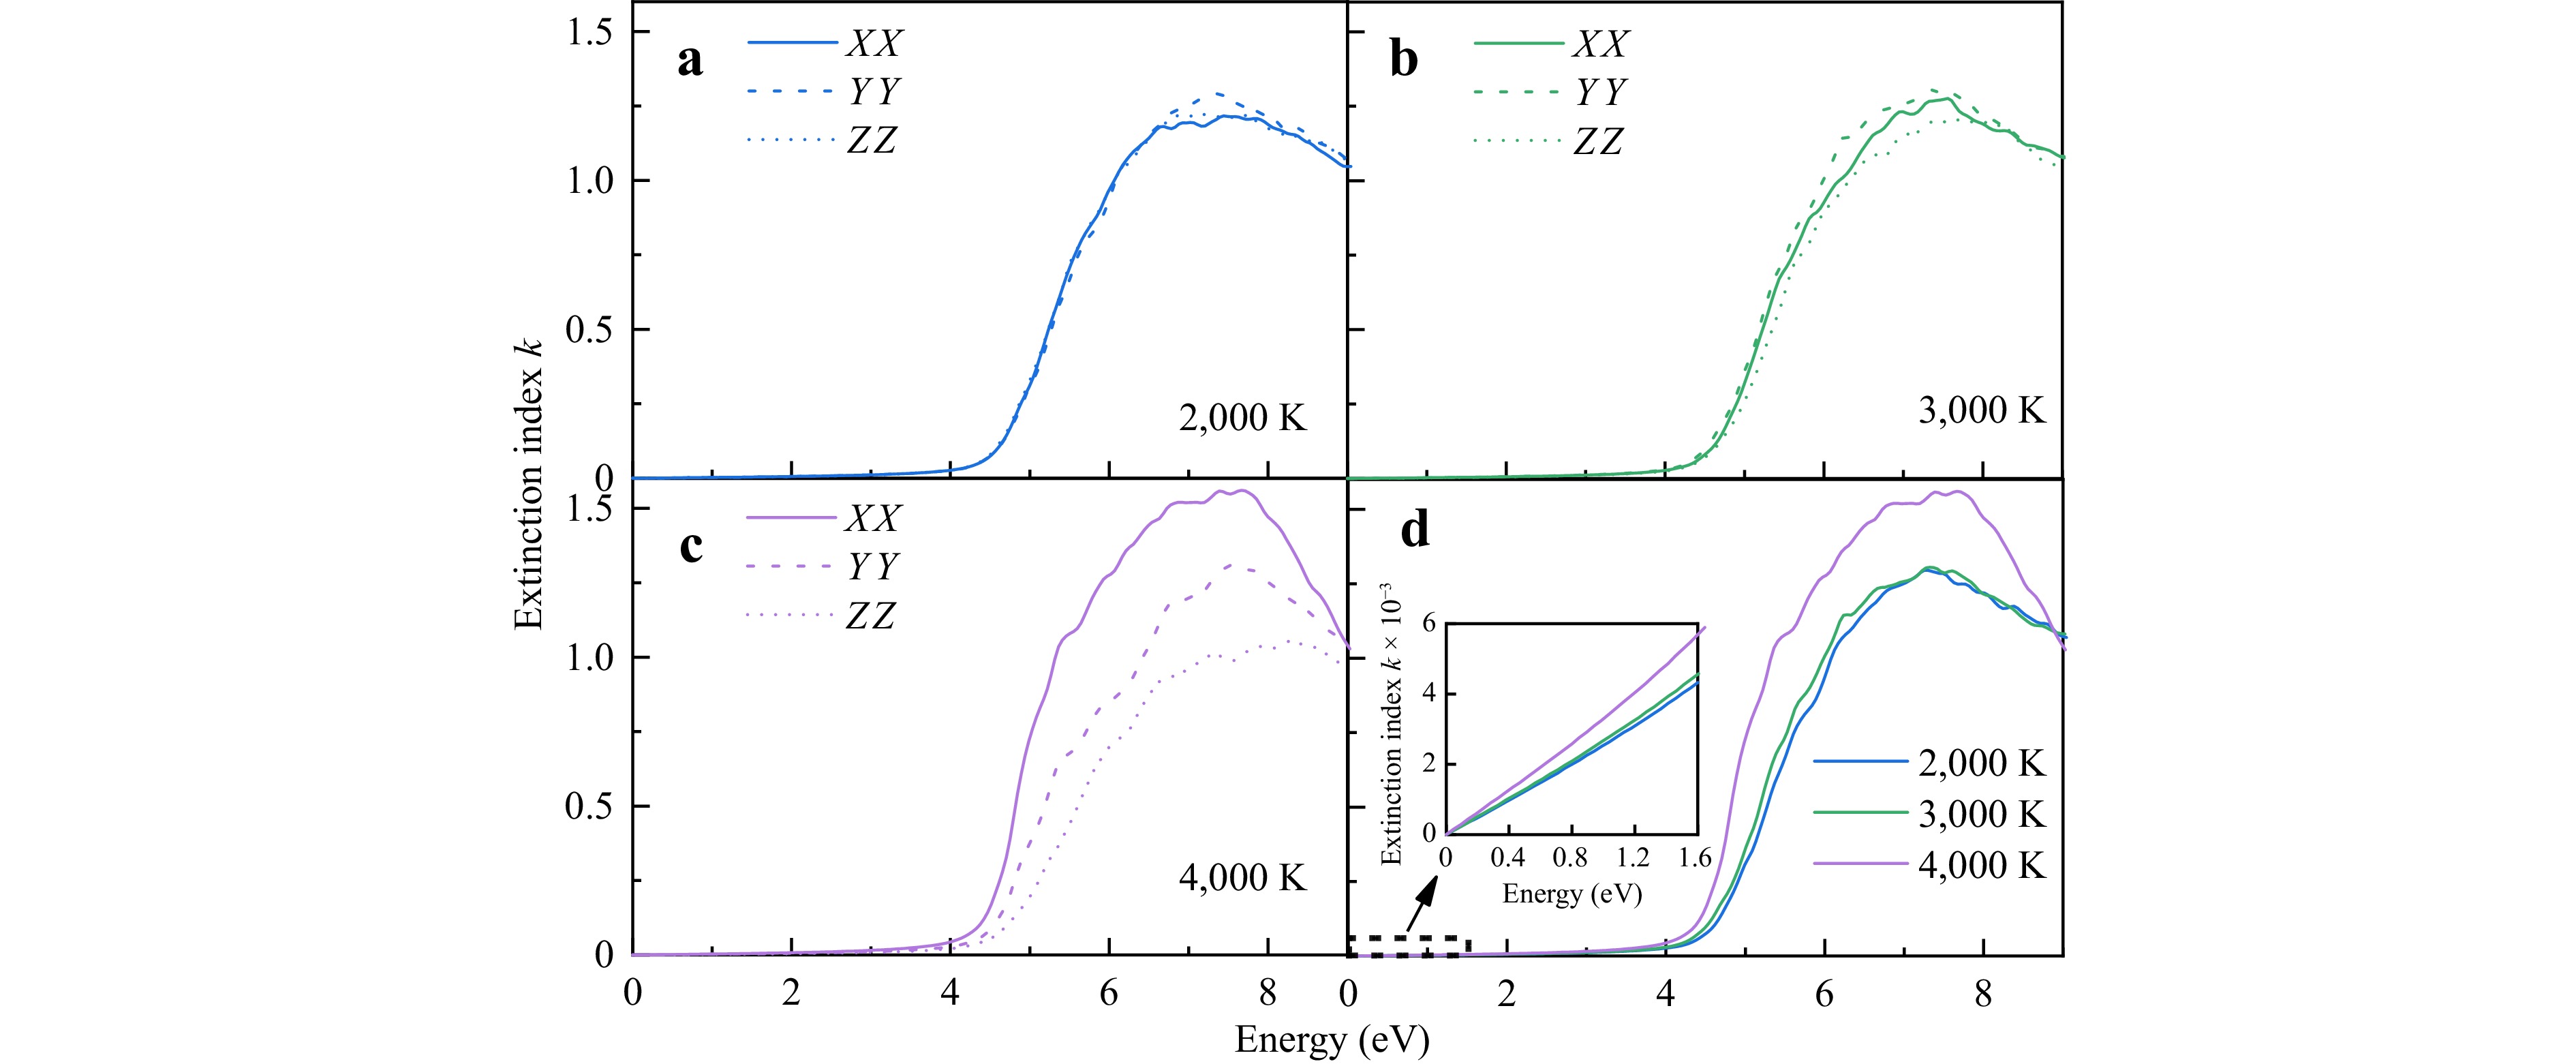
Fig. 16 Extinction coefficient $ k $ of the small models calculated using HSE06 hybrid functional. $ k $ components in three directions for a 2,000, b 3,000, and c 4,000 K models. d Comparison of $ k $ for these three models. For the same model, the curve with the highest $ k $ within the 0–4 eV range among its three directional components is selected as representative.
It is important to note that the experimentally measured optical absorption in multilayer coatings arises from multiple coupled factors, including structural ordering, defect states, compositional fluctuations, interface scattering, and microstructural inhomogeneities. The purpose of the first-principles calculations in this work was not to reproduce the absolute absorption magnitude, but to isolate and examine the intrinsic influence of structural ordering on the electronic structure and optical response of the TiO2-Ta2O5 system.
-
In this study, 1064 nm TiO2-Ta2O5 HR coatings prepared by the EB-IAD method were annealed at different temperatures (473–873 K). Annealing in air affected the absorption of TiO2-Ta2O5 films via compositional and structural factors. At lower temperatures, composition contributes more significantly to absorption; when annealing temperatures are 673 K or below, oxygen vacancy defects are the primary cause of film absorption. At higher temperatures, the structural effects dominate. Above 673 K annealing temperatures, film absorption increases sharply, likely due to small-scale crystallisation and phase separation within the amorphous TiO2-Ta2O5. MD simulations coupled with DFT validate this hypothesis. The simulations revealed that increasing the temperature promoted the ordering and aggregation of Ti–O clusters within the amorphous matrix, leading to bandgap narrowing and enhanced structural anisotropy, both of which contributed to increased optical absorption. This work investigated the absorption mechanism of composite laser films, linking the film composition, structural changes, and optical absorption properties. Combined with thermal treatment, the relatively low-cost and highly efficient EB-IAD method enabled the fabrication of TiO2-Ta2O5-based HR mirrors with absorption as low as 1.3 ppm, approaching the level of performance by IBS. This has significant implications for the large-scale mass production of ultralow-absorption optical devices.
-
This work was supported by the Zibo Key Research and Development Project (Grant No. 2020XCCG0106) and the Zibo Key Research and Development Project (Grant No. 2021SNPT0004).
Annealing-driven absorption mechanisms in TiO2-Ta2O5 high-reflection coatings
- Light: Advanced Manufacturing , Article number: 94 (2026)
- Received: 11 November 2025
- Revised: 05 June 2026
- Accepted: 05 June 2026 Published online: 13 October 2026
doi: https://doi.org/10.37188/lam.2026.094
Abstract: Optical absorption is a performance-limiting factor in high-power laser components. This paper reports the deposition of a series of TiO2-Ta2O5 high-reflection (HR) coatings for 1,064 nm wavelength using electron beam ion-assisted deposition (EB-IAD), followed by thermal annealing at temperatures ranging from 473 to 873 K. The experimental results indicated that the annealing temperature significantly influenced the absorption characteristics of the TiO2-Ta2O5 coatings. Unlike the conventional view that absorption is primarily governed by stoichiometry, this study reveals that although the oxygen vacancy concentration decreases with increasing annealing temperature, typically leading to reduced absorption, the absorption of the coating actually increases beyond a certain annealing temperature threshold. This indicates that factors other than the oxygen vacancies also influence the absorption properties of the film. By combining experimental characterisation, molecular dynamics simulations, and ab initio calculations, we propose that the increase in absorption at higher annealing temperatures is closely connected to structural changes in the coating, particularly localised crystallisation and phase separation within the amorphous TiO2-Ta2O5 film. At the optimal annealing temperature, an HR mirror fabricated using the EB-IAD method exhibited an absorption as low as 1.3 ppm. This work not only deepens the understanding of the absorption mechanisms in composite oxide laser films, but also offers new insights and solutions for the low-cost, large-scale production of high-power laser components.
Research Summary
Optical coatings: Heat exposes hidden absorption pathways
Heat treatment can reduce defects in laser mirrors, but too much heat can make them absorb more light. Ruichen Song, Zhilin Xia, Xusheng Xia and colleagues at Wuhan University of Technology studied TiO2–Ta2O5 high-reflection coatings made by electron-beam ion-assisted deposition and annealed them between 473 and 873 K. Experiments showed that moderate annealing lowered absorption by reducing oxygen-vacancy-related defects, reaching 1.3 parts per million at the optimum temperature. At higher temperatures, however, absorption increased. Simulations and quantum-mechanical calculations linked this reversal to local structural ordering, Ti–O clustering, phase separation and small-scale crystallization in the amorphous coating. The results point to practical routes for manufacturing low-cost, ultralow-absorption mirrors for high-power lasers.
Rights and permissions
Open Access This article is licensed under a Creative Commons Attribution 4.0 International License, which permits use, sharing, adaptation, distribution and reproduction in any medium or format, as long as you give appropriate credit to the original author(s) and the source, provide a link to the Creative Commons license, and indicate if changes were made. The images or other third party material in this article are included in the article′s Creative Commons license, unless indicated otherwise in a credit line to the material. If material is not included in the article′s Creative Commons license and your intended use is not permitted by statutory regulation or exceeds the permitted use, you will need to obtain permission directly from the copyright holder. To view a copy of this license, visit http://creativecommons.org/licenses/by/4.0/.

 DownLoad: