




-
In recent years, the rapid advancement of new-energy vehicles has increased the demand for automatic driving systems (ADSs) and advanced driving assistant systems (ADASs). Light detection and ranging (LiDAR), which offers high angular resolution, a long detection range, and other advantages, is extensively utilised in ADSs and ADASs. By measuring the time, frequency, and other properties of the echo signal, LiDAR acquires the three-dimensional (3D) point-cloud data to enable the 3D imaging of the target. Unlike conventional time-of-flight LiDAR, frequency-modulated continuous-wave (FMCW) LiDAR employs linearly frequency-modulated continuous light to interrogate its surroundings and measures the difference in frequency between the echo signal and the local signal to determine the distance1–6. FMCW LiDAR technology has attracted the interest of researchers in recent years owing to its high spatial resolution and resistance to background noise7–11. Ula et al. developed an FMCW LiDAR with high-spatial-resolution 3D imaging up to 460 µm using a vertical-cavity surface-emitting laser as a light source12. Riemensberger et al. proposed an FMCW LiDAR based on soliton combs, achieving 30 channels of parallel detection and significantly enhancing the measurement speed of FMCW LiDAR13. This innovative design establishes a robust groundwork for the practical application and advancement of this technology. Our team employed inject-locking to generate a triangular linear frequency modulation and demonstrated 3D imaging and velocity measurement simultaneously14. Thus far, FMCW LiDAR has a single function, limited to 3D imaging and velocity measurements. It cannot sense environmental changes, which limits its applicability to ADSs.
By moving FMCW LiDAR technology from free space into optical fibres, optical frequency-domain reflectometry (OFDR) can be achieved, which can be used in sensing. Similar to FMCW, OFDR uses a linearly modulated continuous light source for optical fibre measurement, and the positioning principles are the same. It has unique advantages such as high spatial resolution and a large dynamic range6,15–17 and has enabled the sensing of various measurands, including strain, temperature, pressure, and gas concentration5,10,18–22. It can be embedded into batteries for status monitoring. Yu et al. measured both the in-plane temperature difference across the cell surface and the movement of the hottest region of a lithium-ion battery during operation23. Huang et al. achieved a distributed measurement of the internal temperature gradient of a battery with a spatial resolution of up to 0.65 mm and demonstrated its feasibility by comparing it with the results of three implanted FBGs24. Refractive index measurements play a crucial role in determining the chemical changes that occur during battery charging and discharging. Our team developed a temperature-compensated distributed refractive index sensor using an etched multi-core fibre in OFDR25. A sensing length of 19 cm and spatial resolution of 5.3 mm were achieved in the experiment.
LiDAR imaging and environmental perception play crucial roles in new-energy vehicles and automatic driving technologies. In this paper, a multifunctional FMCW LiDAR system is proposed, which can be used for the 3D imaging of objects in free space and simultaneous sensing of multiple parameters. In concept-proof experiments, a plastic plate with a ‘HIT’ symbol placed 30 m away was imaged. A sulfuric acid solution was used as a candidate for monitoring various aspects, such as temperature and electrolyte density. Three mixed gases (C2H2, CO2, and CH4) were filled in a multi-pass cell (MPC) to monitor gas leakage. This system can simultaneously perform the key functions of the ADS and battery management of a new-energy vehicle with only one demodulator. Thus, it has potential for widespread application in the field of new-energy vehicles and is expected to provide a new integrated solution for improving the safety of new-energy vehicles.
-
Fig. 1 shows a schematic of the proposed multifunctional FMCW LiDAR monitoring system. The basic configuration comprises a tuneable laser source (TLS), a Mach–Zehnder interferometer (MZI), a photodetector (PD), and several devices used for sensing and imaging, as shown in Fig. 1a. The frequency of the TLS is linearly modulated with time, and the output beam of the TLS is divided into local oscillator (LO) and probe beams. The probe beam is further divided into several parts using an optical coupler (OC) and guided to different devices. The echo signals of these devices mix with the LO beam to generate beat signals. As shown in Fig. 1b, the spatial distances of these devices are different, which means that their frequency-time curves are hysteretic to the LO beam with different time delays τ1, τ2, and τ3. Thus, it generates beat signals Beat1, Beat2, and Beat3 with different beat frequencies fb1, fb2, and fb3 between the probe beams of different devices and the LO beam. These devices have intrinsic reflection spectra carried by their beat signals. Finally, these beat signals are received by the PD and can be expressed as
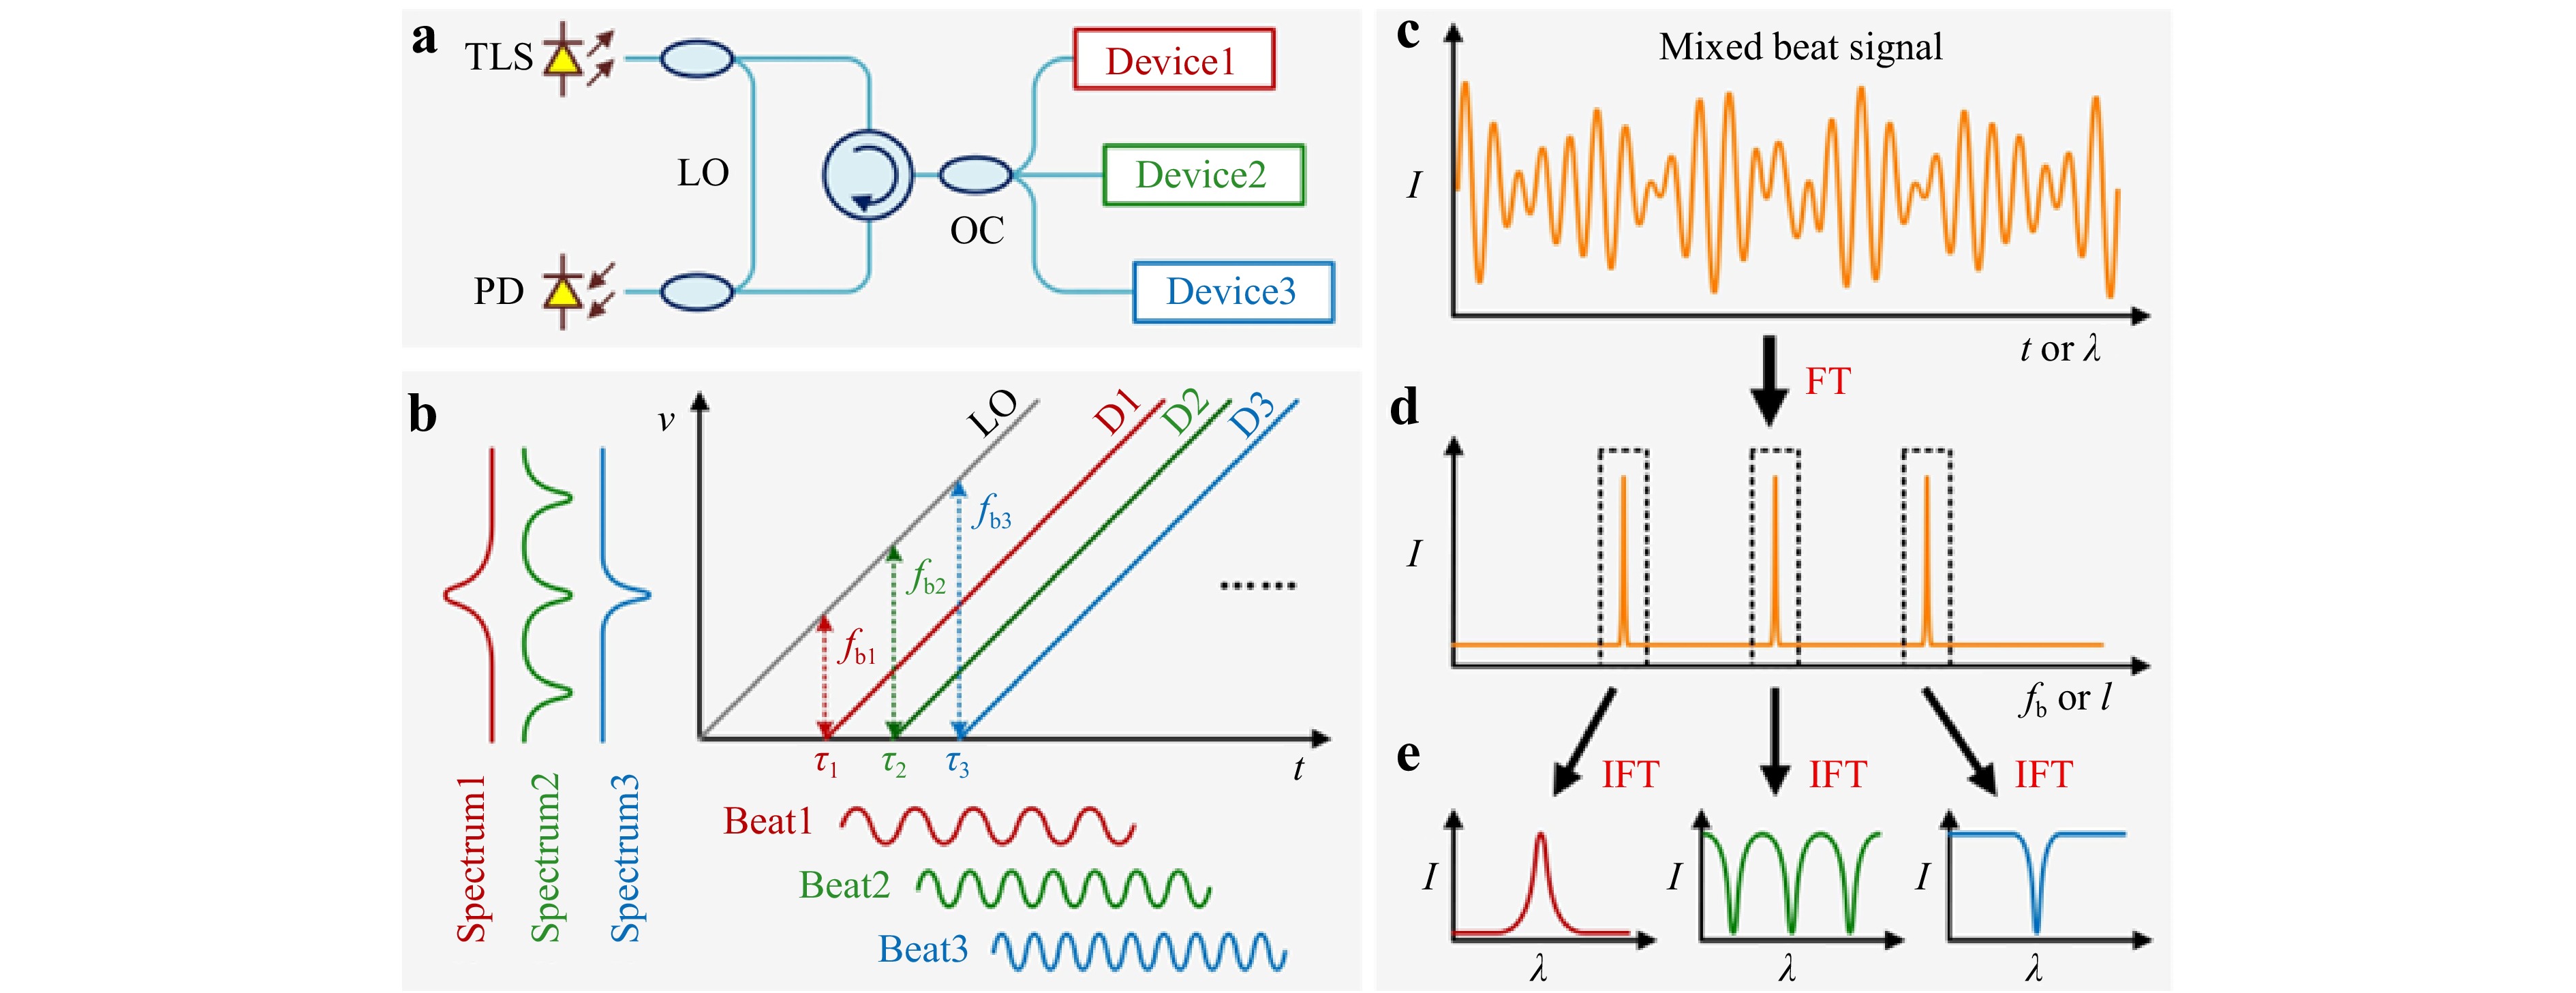
Fig. 1 Schematic of the proposed FMCW LiDAR monitoring system. a Basic configuration of the LiDAR monitoring system. b Frequency relationship of the LO and probe beams reflected from different devices, which will generate beat signals of different frequencies and carry the reflection spectra information. c–e Signal demodulation process; the beat signals are separated in the spatial domain using FT, and then the reflection spectra are reconstituted in the wavelength domain using IFT.
$$ I\left(t\right)={\left| {E}_{\rm{LO}}\left(t\right)+\displaystyle\sum \limits_{m=1}^{M}{r}_{m}{E}_{\rm{Pm}}\left(t-{\tau }_{m}\right)\right| }^{2} $$ (1) where ELO is the electronic field of the LO beam, EPm is the electronic field of the mth reflected probe beam, rm is the reflectivity of the mth device, and τm is the time delay of the mth device. τm = 2nLm/c, where n is the refractive index, Lm is the distance of the mth device, and c is the speed of light in a vacuum.
The signal demodulation process is illustrated in Fig. 1c-e. Mixed beat signals with reflection spectra in the time (or wavelength) domain are received by the PD, as shown in Fig. 1c. Using the Fourier transform (FT), beat signals with different beat frequencies are separated in the frequency (or spatial) domain, as shown in Fig. 1d. Meanwhile, the reflection spectra carried by the beat signals are separated from each other. Subsequently, using a sliding window, the desired frequency components (as indicated by the dotted-line windows) are selected for further demodulation. Using the inverse Fourier transform (IFT) within the window, the reflection spectra of different devices can be independently demodulated in the wavelength domain, as shown in Fig. 1e. The window width influences the detected spectral response, including the spectral resolution and signal-to-noise ratio26. For different devices, distinct window widths are used to avoid spectrum leakage and reduce the Rayleigh scattering noise in optical fibres. Because the different sensing devices are located at interval distances larger than the window width of the selected data in the spatial domain, the observed crosstalk between different devices is negligible. These reflection spectra can be utilised for multi-parameter sensing. The relationship between the time and wavelength domains can be expressed as λ = c/(f0+γt), where λ represents the wavelength, f0 is the initial frequency of the TLS, γ is the frequency-sweeping speed of the TLS, and t is the sweeping time. The relationship between the frequency and spatial domains can be expressed as 2nl = cfb/γ, where n is the refractive index of the medium, l denotes the distance, and fb represents the beat frequency.
-
The experimental setup is shown in Fig. 2. The TLS (Santec, TSL-770, with a linewidth of less than 60 kHz) generated a linear frequency-modulated light wave. An auxiliary Michelson interferometer consisting of an optical coupler (OC2), a delay fibre segment, and two Faraday rotating mirrors (FRMs) was used to eliminate nonlinear phase noise during the frequency-sweeping process. The main MZI, which consisted of two optical couplers (OC3 and OC4), a polarisation controller, and an optical circulator, was used to produce the beat signal that depended on the location and reflectivity. The beat signal was received by a balanced photodetector (BPD, Fsphotonics, PDB1008, with a bandwidth of 80 MHz) and recorded by a data acquisition (DAQ) card (JYTEK, Pcie69834), whose sampling clock was provided by the auxiliary Michelson interferometer. Thus, according to Nyquist sampling theory, the maximum measurement distance is equal to half the length of the delay fibre in the auxiliary Michelson interferometer. At the beginning of the frequency-sweeping process, a trigger pulse was provided by the TLS to synchronise the DAQ card.
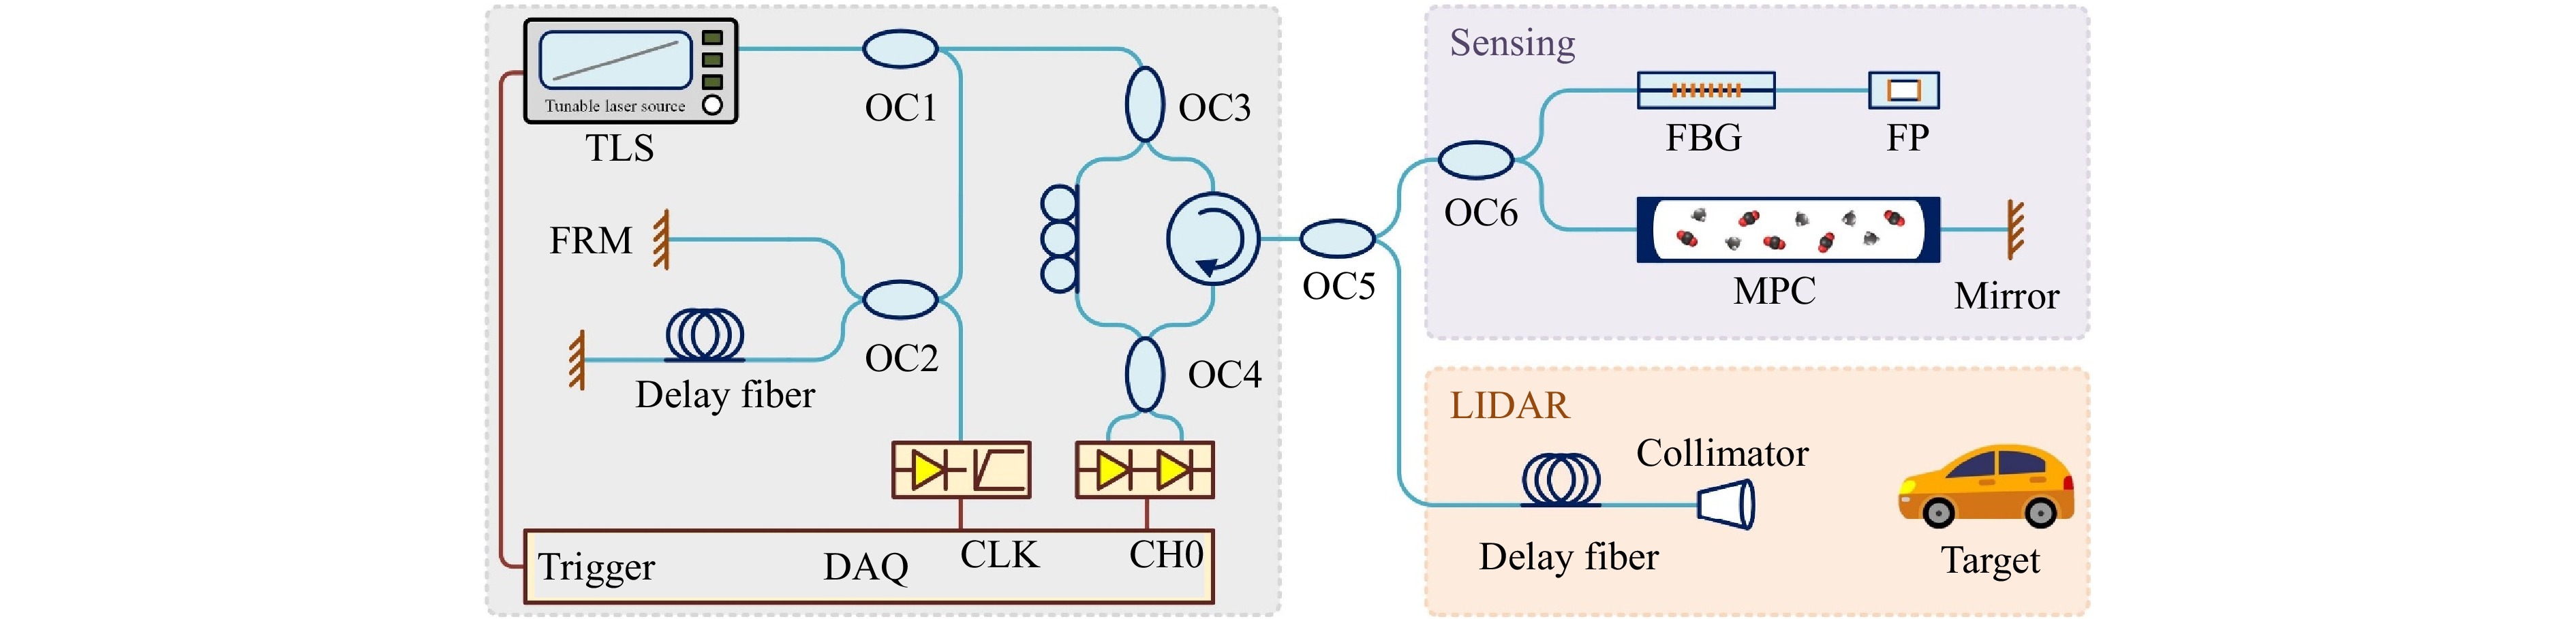
Fig. 2 Sketch of the experimental setup. TLS: tuneable laser source; OC: optical coupler; FRM: Faraday rotating mirror; DAQ: data acquisition; FBG: fibre Bragg grating; FP: Fabry–Perot; MPC: multi-pass cell.
To achieve multi-parameter sensing and 3D imaging simultaneously, the light from the optical circulator was divided into two segments by OC5. In the LiDAR imaging module, a collimator (Thorlabs, F810APC) with a numerical aperture of 0.24 was used as the coaxial transceiver. A delay fibre (50 m) was placed before the collimator to remove the LiDAR reflection signal from the sensing reflection signal in the spatial domain. Additionally, we used a twin-axial galvanometer scanner to scan the illumination point of the laser beam on the target, which was positioned behind the collimator for target scanning. The voltage of the scanner was synchronously recorded by the DAQ card for data postprocessing, which is explained in detail in the next section.
In the multiparameter sensing module, the solution density, temperature, and gas concentration were measured. For temperature measurement, an FBG with a full width at half maximum (FWHM) of approximately 150 pm and reflectivity of approximately 10% was utilised. An FP with an approximately 60-μm long open cavity was used to measure the density of the sulfuric acid solution. The FBG and FP probe were fabricated using femtosecond laser micromachining technology to achieve a compact structure. An MPC with an optical path of approximately 41.76 m was used to obtain the absorption spectrum. A gold-plated fibre mirror behind the MPC was used to reflect the laser absorption spectrum signal and enable the gas concentration measurements. The wavelength sweeping range of the TLS was 1,510–1,640 nm, which enabled the multi-parameter sensing module to detect several characteristic gases of battery thermal runaway, including C2H2, CO2, and CH4. The other parameters of the TLS were set as follows: speed of 100 nm/s and light power of 5 mW. The coupling rate of OC1, OC3, and OC6 was 99:1, whereas that of the other couplers was 50:50. The length of the delay fibre in the auxiliary interferometer was approximately 200 m. Consequently, the maximum measurement distance in the fibre of the system was 100 m, which could also be increased using resampling compensation methods. For long-distance FMCW systems, the problem of positioning errors owing to thermal expansion effects must be addressed.
-
In proof-of-concept experiments, all optical devices were rigidly fixed on an air-floating optical platform, and the auxiliary and main interferometers were enclosed in passive optical modules to minimise structural resonance. The coupling ratios of the optical couplers and delay fibre lengths for the different devices were flexibly adjusted based on the intensity of the echo signals. Variable optical attenuators (VOAs) were added appropriately to ensure that the other sensing modules were not affected in this parallel structure. Fig. 3 shows the reflection intensity in the spatial domain. The ambient temperature was room temperature, the gas concentrations of C2H2, CO2, and CH4 in the MPC were 150, 55,500, and 700 ppm, respectively, and the FBG and FP sensing probe were immersed in a lead-acid battery. The purple line represents the reflection signal of the sensing module, and the orange line represents the reflection signal from the LiDAR module. To ensure the uniformity of length in both the fibre and free space, we used an optical path, rather than distance, as the horizontal axis. The spatial resolution was 9.5 μm, corresponding to a sweeping range of 1,510–1,640 nm. The peaks marked in green were caused by different optical fibre devices, whereas the peaks marked in brown were induced by the fibre connectors. Notably, the reflected signals of several devices were separated in the spatial domain. The multiple reflection peaks generated by the inherent structure of the MPC are represented by the dashed green window. The reflection peaks inside the MPC were approximately distributed at equal intervals, corresponding to the beat signal formed by the reference light, with the weakly scattered light returning to the incident end27,28. Because the absorption intensity is proportional to the absorption optical path, we can use different reflection peaks to demodulate the gas concentration, thereby enlarging the dynamic range of gas concentration sensing21. For a gas with a very low concentration, the mirror reflection peak behind the MPC can be utilised to demodulate the signal. For the LiDAR module, the distance to the target can be calculated from the optical path difference between the collimator and target reflection peaks. The reflection spectra in the wavelength domain of the FBG, FP, and MPC can be demodulated from their reflection peaks in the spatial domain using the IFT, as shown in Fig. 4. In the IFT process, a rectangular window was used to select the reflection peak, and the selection of the window width has been discussed in detail in our previous work27,29,30. An optimal value of the window width for different devices must be determined to ensure the spectral resolution and signal-to-noise ratio. The spectral resolution was improved to 1 pm by zero padding during the IFT.
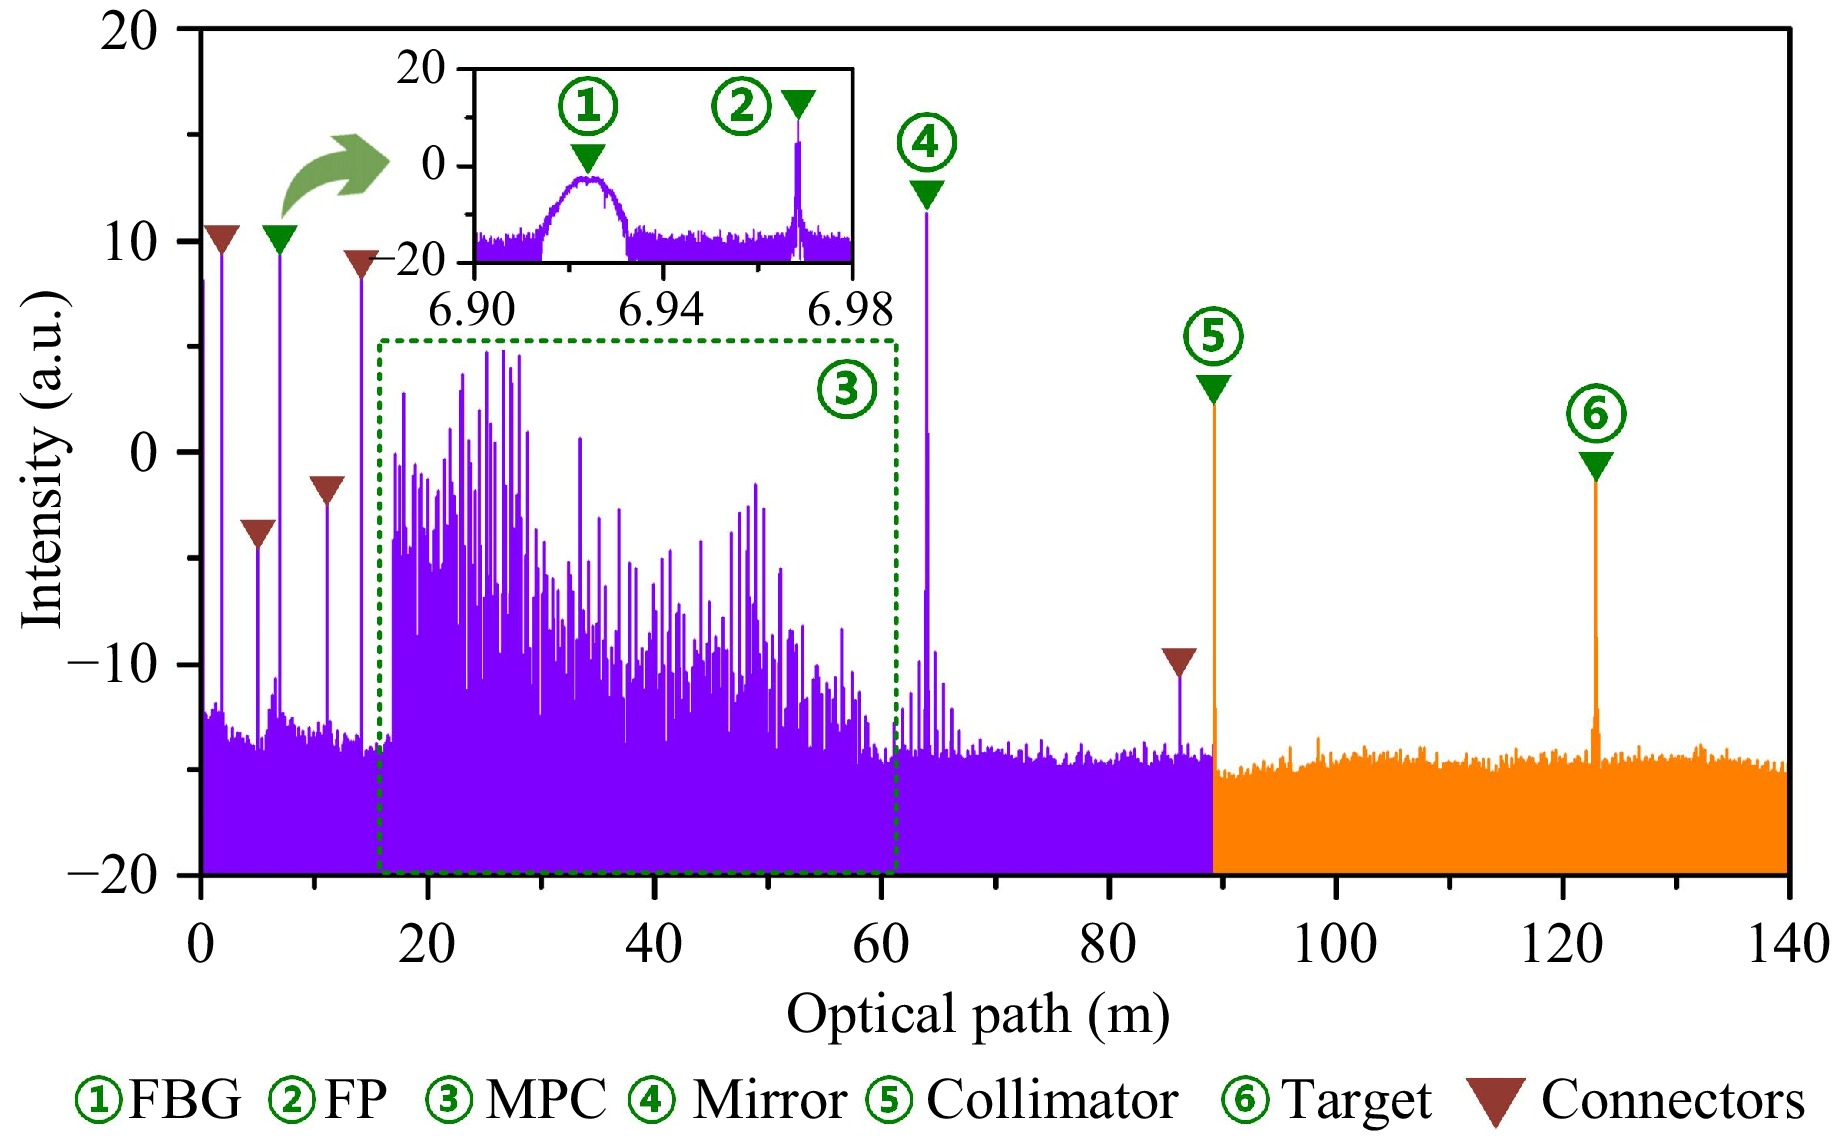
Fig. 3 Beat signal in the spatial domain. The purple and orange lines represent sensing and LiDAR modules, respectively. The green peaks were generated using FBG, FP, MPC, mirror, collimator, and target, and the brown peaks were generated by fibre connectors.
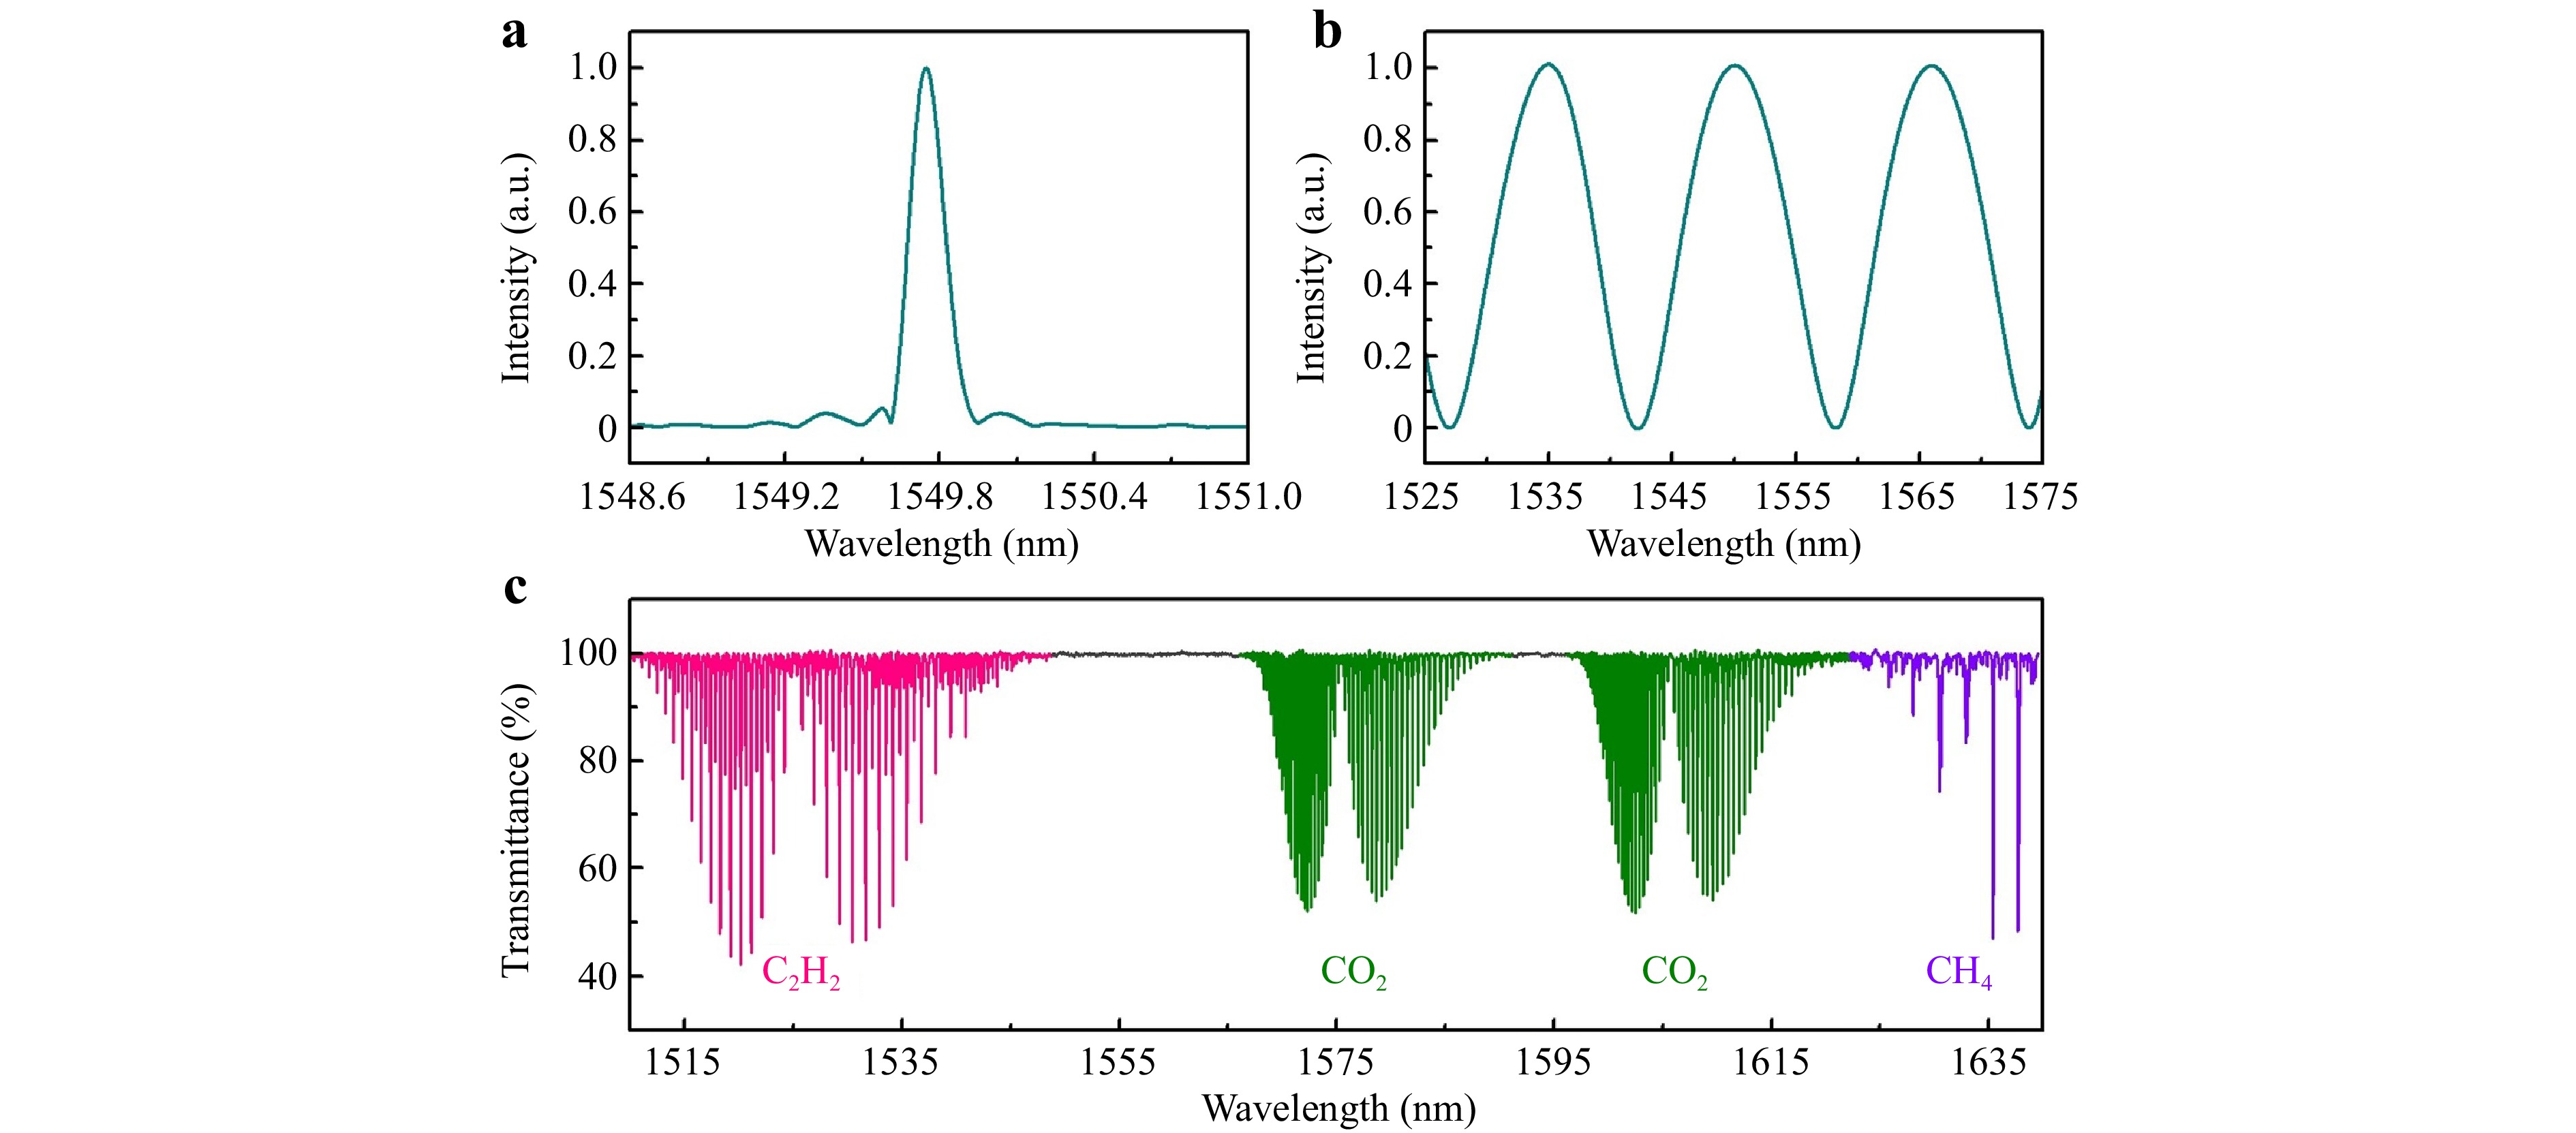
Fig. 4 Spectra in the wavelength domain of the FBG, FP, and MPC. a Normalised reflection spectrum of the FBG, used for temperature sensing. b Normalised reflection spectrum of the FP, used for solution density monitoring. c Transmission spectrum of the gas mixture of C2H2, CO2, and CH4 in the MPC.
Fig. 4a shows the normalised reflection spectrum of the FBG, which was approximately 2 cm wide. The Bragg wavelength (1,549.748 nm) changed with the ambient temperature such that the temperature variation could be monitored. Fig. 4b shows the normalised reflection spectrum of the FP. The window of the FP was about 100 μm wide, which was slightly larger than the reflection peak width. Several interference dips within the same period were observed in the spectrum, and their wavelengths varied depending on the density of the sulfuric acid solution. Thus, each dip could be used to monitor the solution density. Fig. 4c shows the transmission spectrum of the gas mixture of C2H2, CO2, and CH4 in the MPC. To ensure highly sensitive spectral sensing, we set the window width of the MPC to the base length (approximately 18 cm)27. Abundant sharp absorption features come from overtone absorption bands of these three gases in the near IR wavelength region (ν1+ν2 for C2H2, 2ν1+2ν2+ν3 and ν1+4ν2+ν3 for CO2, and 2ν3 for CH4). According to the Beer–Lambert law, gas absorbance is proportional to gas concentration; thus, the gas concentration can be evaluated by analysing the gas transmission spectrum.
-
The target-scanning imaging process of the LiDAR imaging module is shown in Fig. 5. During the frequency-sweeping process, the position of the illuminating point of the laser beam is controlled using a galvanometer scanner. The solid blue line in Fig. 5a corresponds to the laser frequency tuning curve over the sweeping period. To improve the imaging speed, this period is divided into N segments with a frequency interval of Δν. Each segment of the signal, or of the laser output, is used to detect one pixel (P1, P2, P3, ··· PN) of the target. By performing an FFT on each beat signal segment, we can obtain a reflection intensity map of the corresponding scan point. Fig. 5b shows the scan track of N imaging pixels. By adjusting the two-axis voltages of the galvanometer scanner (represented by the green and red curves in Fig. 5a), the illumination point follows a snake-like trajectory, as shown in Fig. 5b. With this method, N pixels can be imaged in a single laser frequency-sweeping period. The distance from the target is equal to the optical path difference between the reflection peaks of the collimator and target. Fig. 5c illustrates the reflection peak of the target; the sweeping range of every segment is 0.1 nm (12.5 GHz), resulting in a range resolution of approximately 1.2 cm, represented by the red line. When the sweeping range of every segment is 0.5 nm (62.5 GHz), the range resolution is about 0.3 cm, as shown by the blue line. The SNR of the reflection peak remains unaffected by the sweeping range, and the range resolution can be tuned by adjusting the sweeping range of every segment.
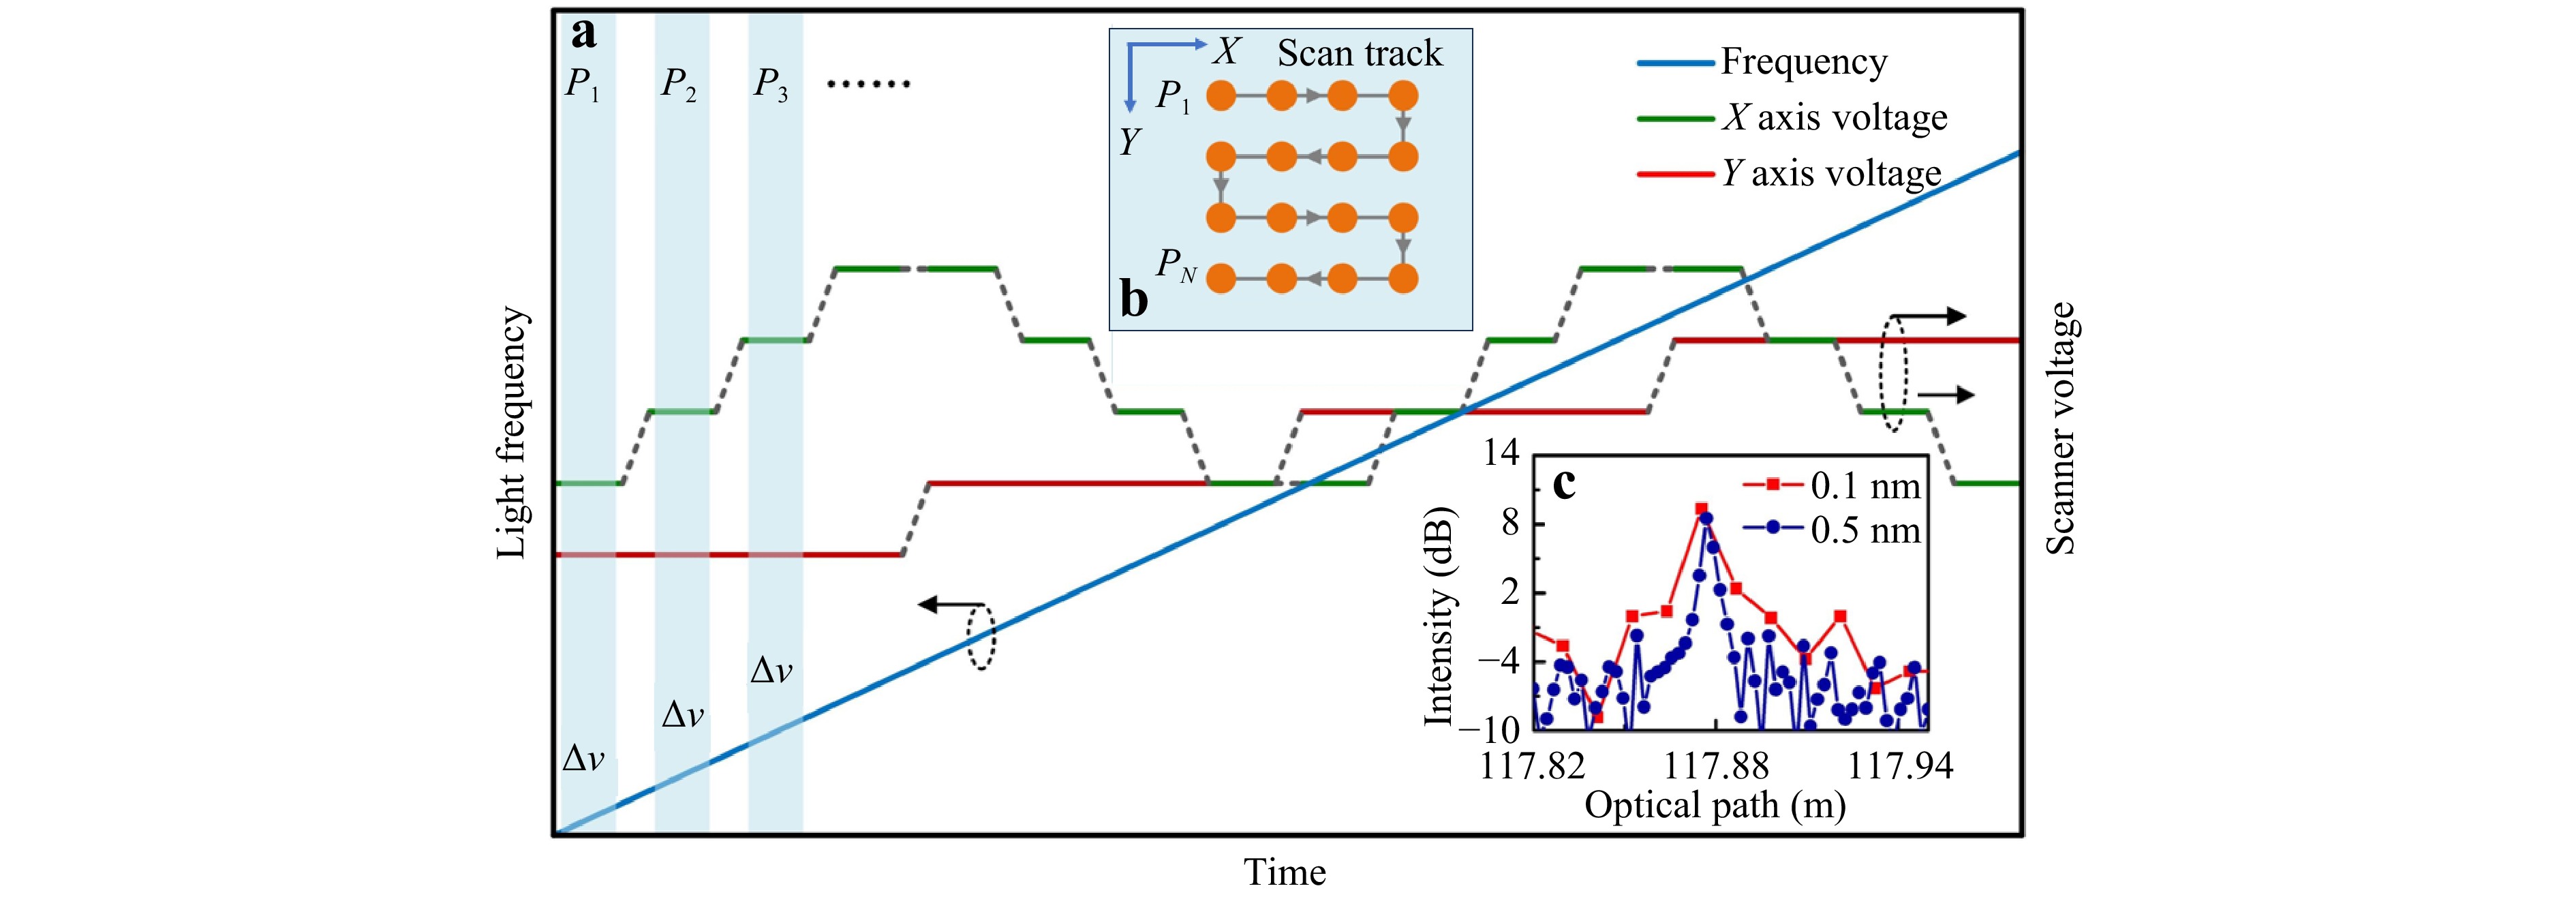
Fig. 5 Sketch of the target-scanning imaging process within a laser sweeping period in the LiDAR imaging module. a Relationship between light frequency and scanner voltage versus sweeping time. b Scan track of N imaging pixels. c Comparison of the target reflection peaks at different sweeping ranges.
Experimentally, a plastic plate with the ‘HIT’ symbol was placed in front of a wall, as shown in Fig. 6a. The plastic plate was located approximately 30 m from the collimator, whereas the collimator was located approximately 37 m from the wall. The galvanometer scanner scanned the target with a resolution of 140 × 70 pixels, and the frequency-sweeping range of every segment was 12.5 GHz, corresponding to a range resolution of 1.2 cm. The 3D point-cloud image, shown in Fig. 6b, exhibited a high degree of consistency with the actual scene. Based on the number of pixels and sweeping parameters of the TLS, the entire imaging area required eight laser sweeping periods, corresponding to an imaging time of approximately 10 s.
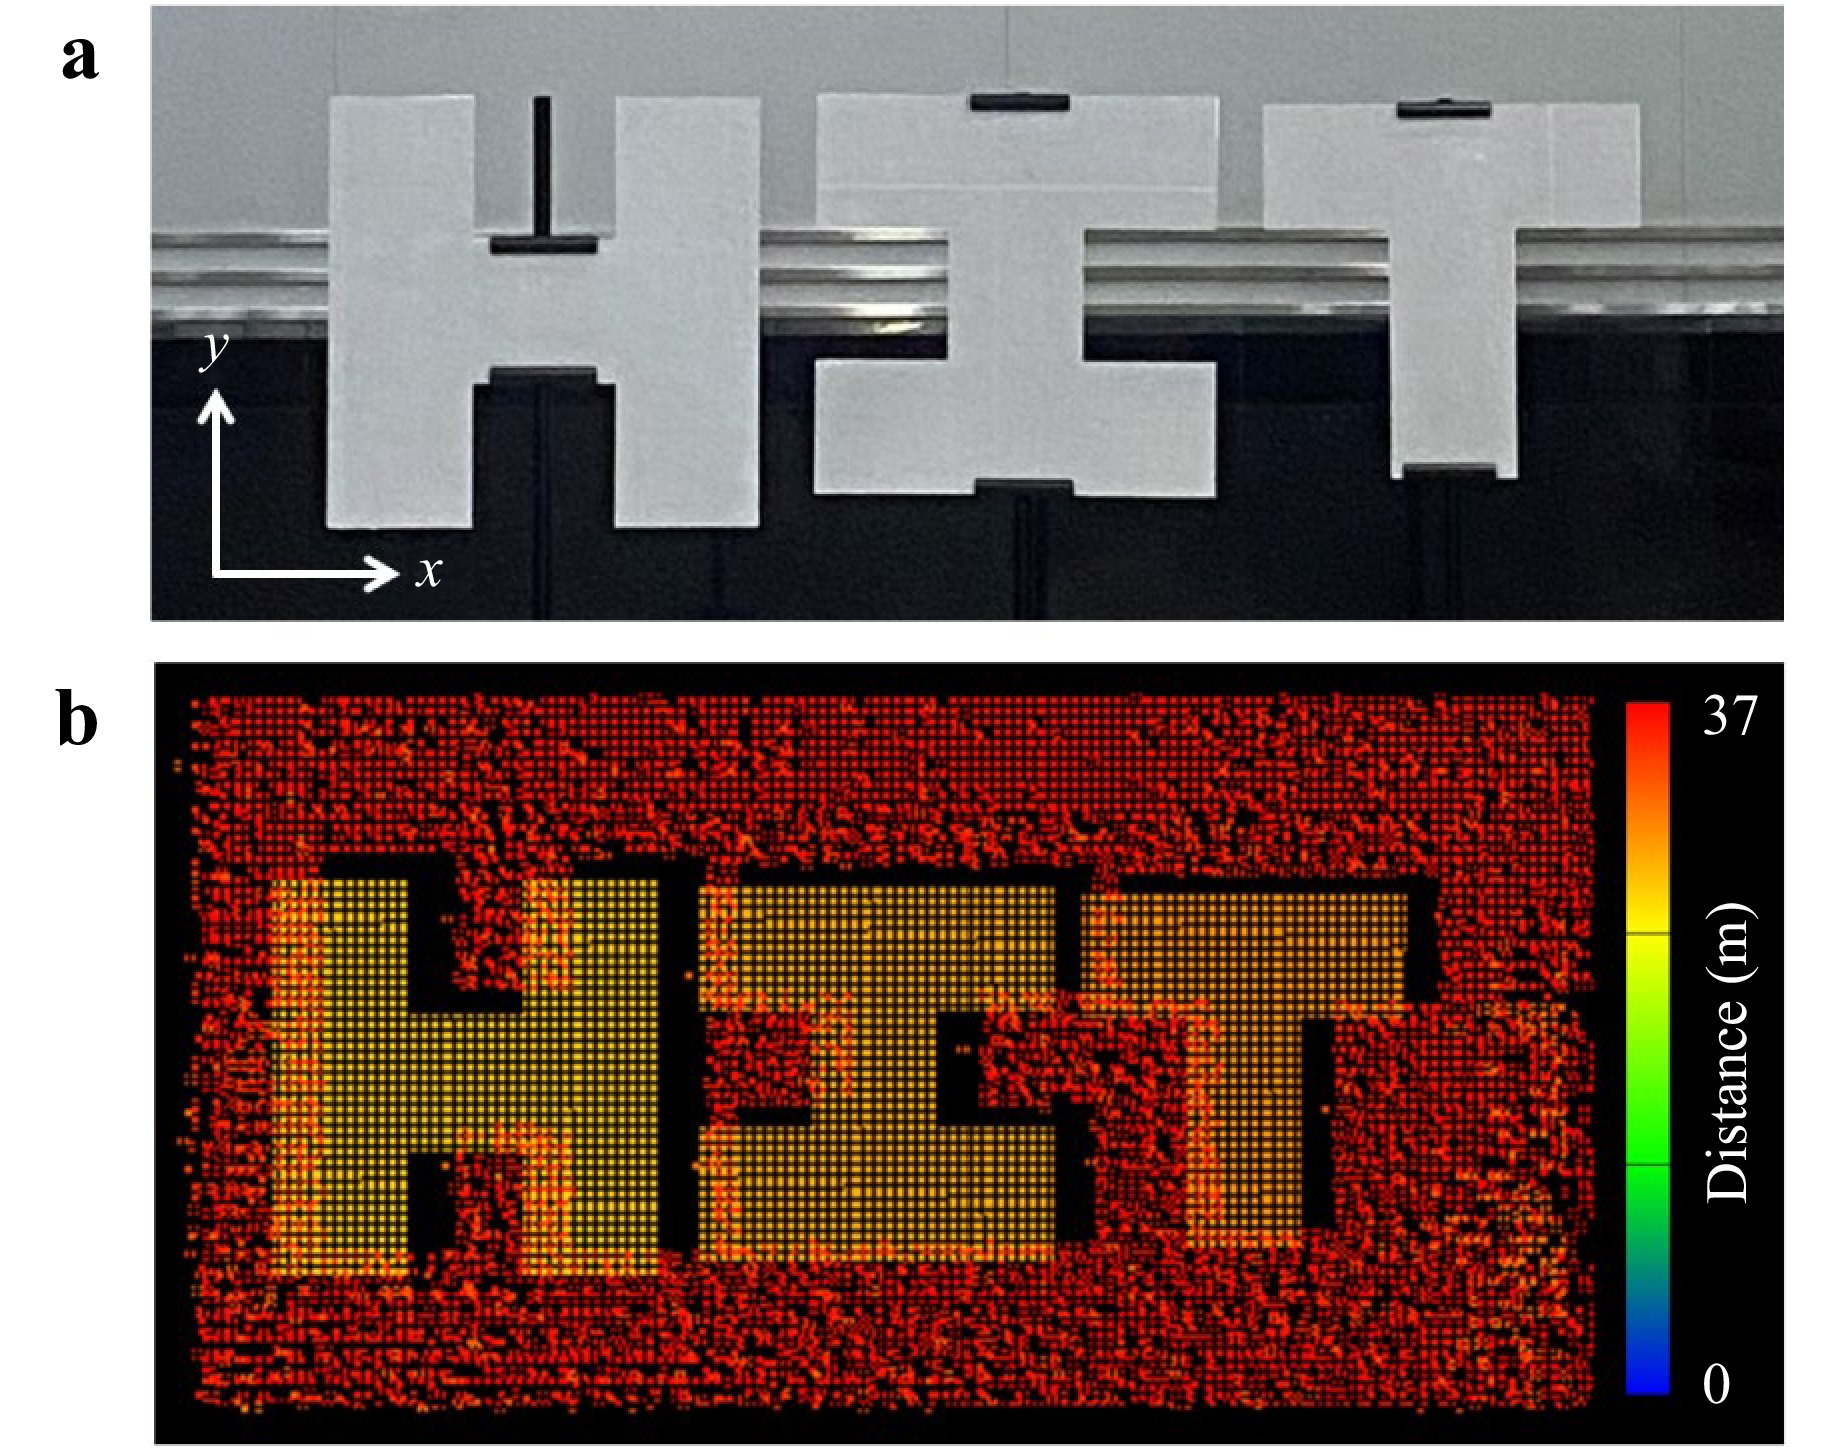
Fig. 6 LiDAR imaging result of the imaging module. a Actual scene. b 3D point-cloud image.
-
In the experiment, the FBG and FP sensing probe were immersed in a sulfuric acid solution to monitor the temperature. The temperature-sensing results are shown in Fig. 7. With the temperature increasing from 5 to 60 °C, the normalised reflection spectra of FBG were red-shifted. The Bragg wavelength shifted from 1,549.627 to 1,550.147 nm, as shown in Fig. 7a. The change in the Bragg wavelengths versus temperatures could be fitted linearly, yielding a temperature sensitivity of 9.47 pm/°C with a goodness of fit (R2 = 0.9998), as depicted in Fig. 7b. Furthermore, a temperature resolution of 0.5 °C was calculated based on the wavelength error. The temperature change induced a variation in the refractive index of the solution; therefore, a corresponding change in the optical path difference within the FP cavity resulted in a shift in the FP interference spectra. For clarity, only one period of the FP interference spectrum is shown in Fig. 7c. The FP interference spectrum blue-shifted with increasing solution temperature, with the interference dip wavelengths shifting from 1,558.286 to 1,549.696 nm. The change in interference dip wavelengths versus temperature could also be fitted linearly, exhibiting a temperature cross-sensitivity of −0.211 nm/°C with a goodness of fitting of R2=0.9996, as depicted in Fig. 7d.
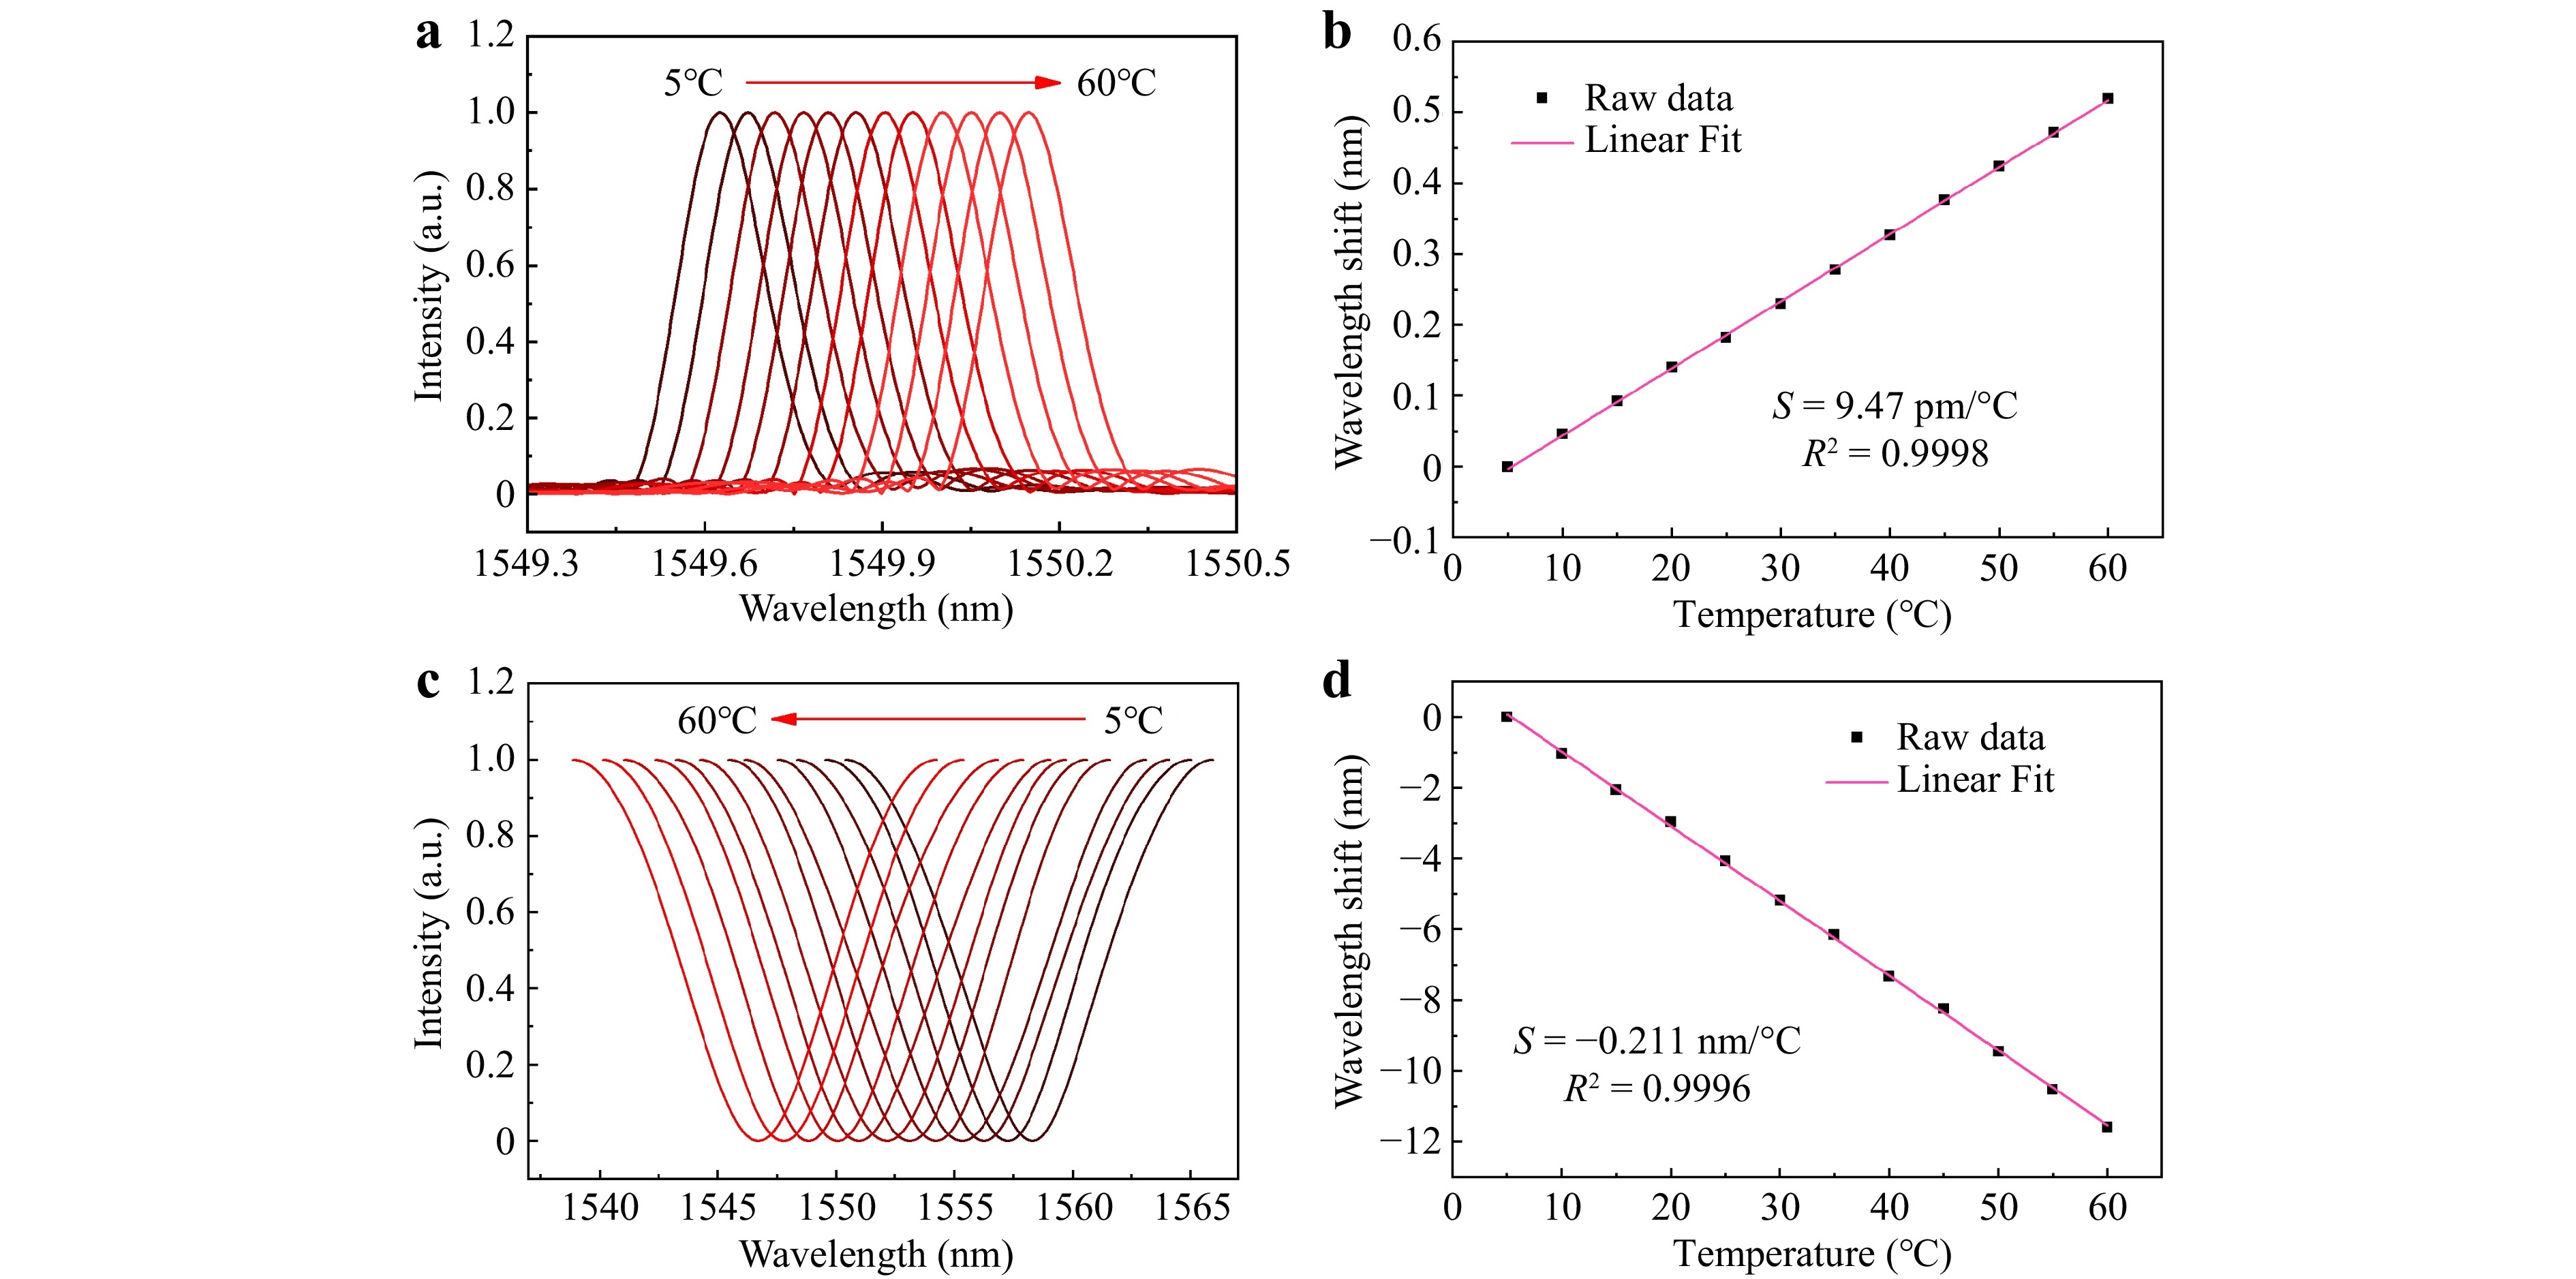
Fig. 7 Solution temperature sensing results within the temperature range of 5–60 °C. a Spectra of FBG reflection with different solution temperatures. b Linear fit results of Bragg wavelength shifts versus different solution temperatures. c FP interference spectra at different solution temperatures. d Linear fit results of interference dip wavelength shifts at different solution temperatures.
At a constant temperature of 20 °C, with other experimental conditions the same as in Figs. 3 and 4, we prepared a series of sulfuric acid solutions of different densities, which were calibrated using a densimeter. The FBG and FP sensing probe were sequentially immersed in these solutions. Fig. 8a shows the normalised reflection spectra of the FBG at different solution densities ranging from 1.0531 to 1.3485 g/mL, indicating that the Bragg wavelength remained unchanged. In other words, the Bragg wavelength was insensitive to the solution density, as depicted by the linear fit in Fig. 8b. Fig. 8c shows the normalised interference spectra of the FP at different densities. The solution density was positively correlated with the refractive index31,32. The principle of FP probe-based electrolyte density sensing is the refractive index measurement. As the density increases, the optical path difference increases, thereby reducing the free spectrum range (FSR). Correspondingly, the spectra exhibit red shifts with increasing solution density. As the solution density increased from 1.0531 to 1.3485 g/mL, the interference-dip wavelength shifted from 1,527.247 to 1,573.374 nm. The relationship between the change in the interference dip wavelength and the solution density can be linearly fitted. As shown in Fig. 8d, the density sensitivity was 155.83 nm/(g/mL), with R2=0.9997. The wavelength error was obtained through repeatability experiments, and the resolution of the solution density measurement was calculated as 3 × 10⁻⁵ g/mL. Note that the maximum wavelength shift was larger than the FSR of the interference spectrum. To avoid the cyclic ambiguity problem, the solution density should be monitored continuously.
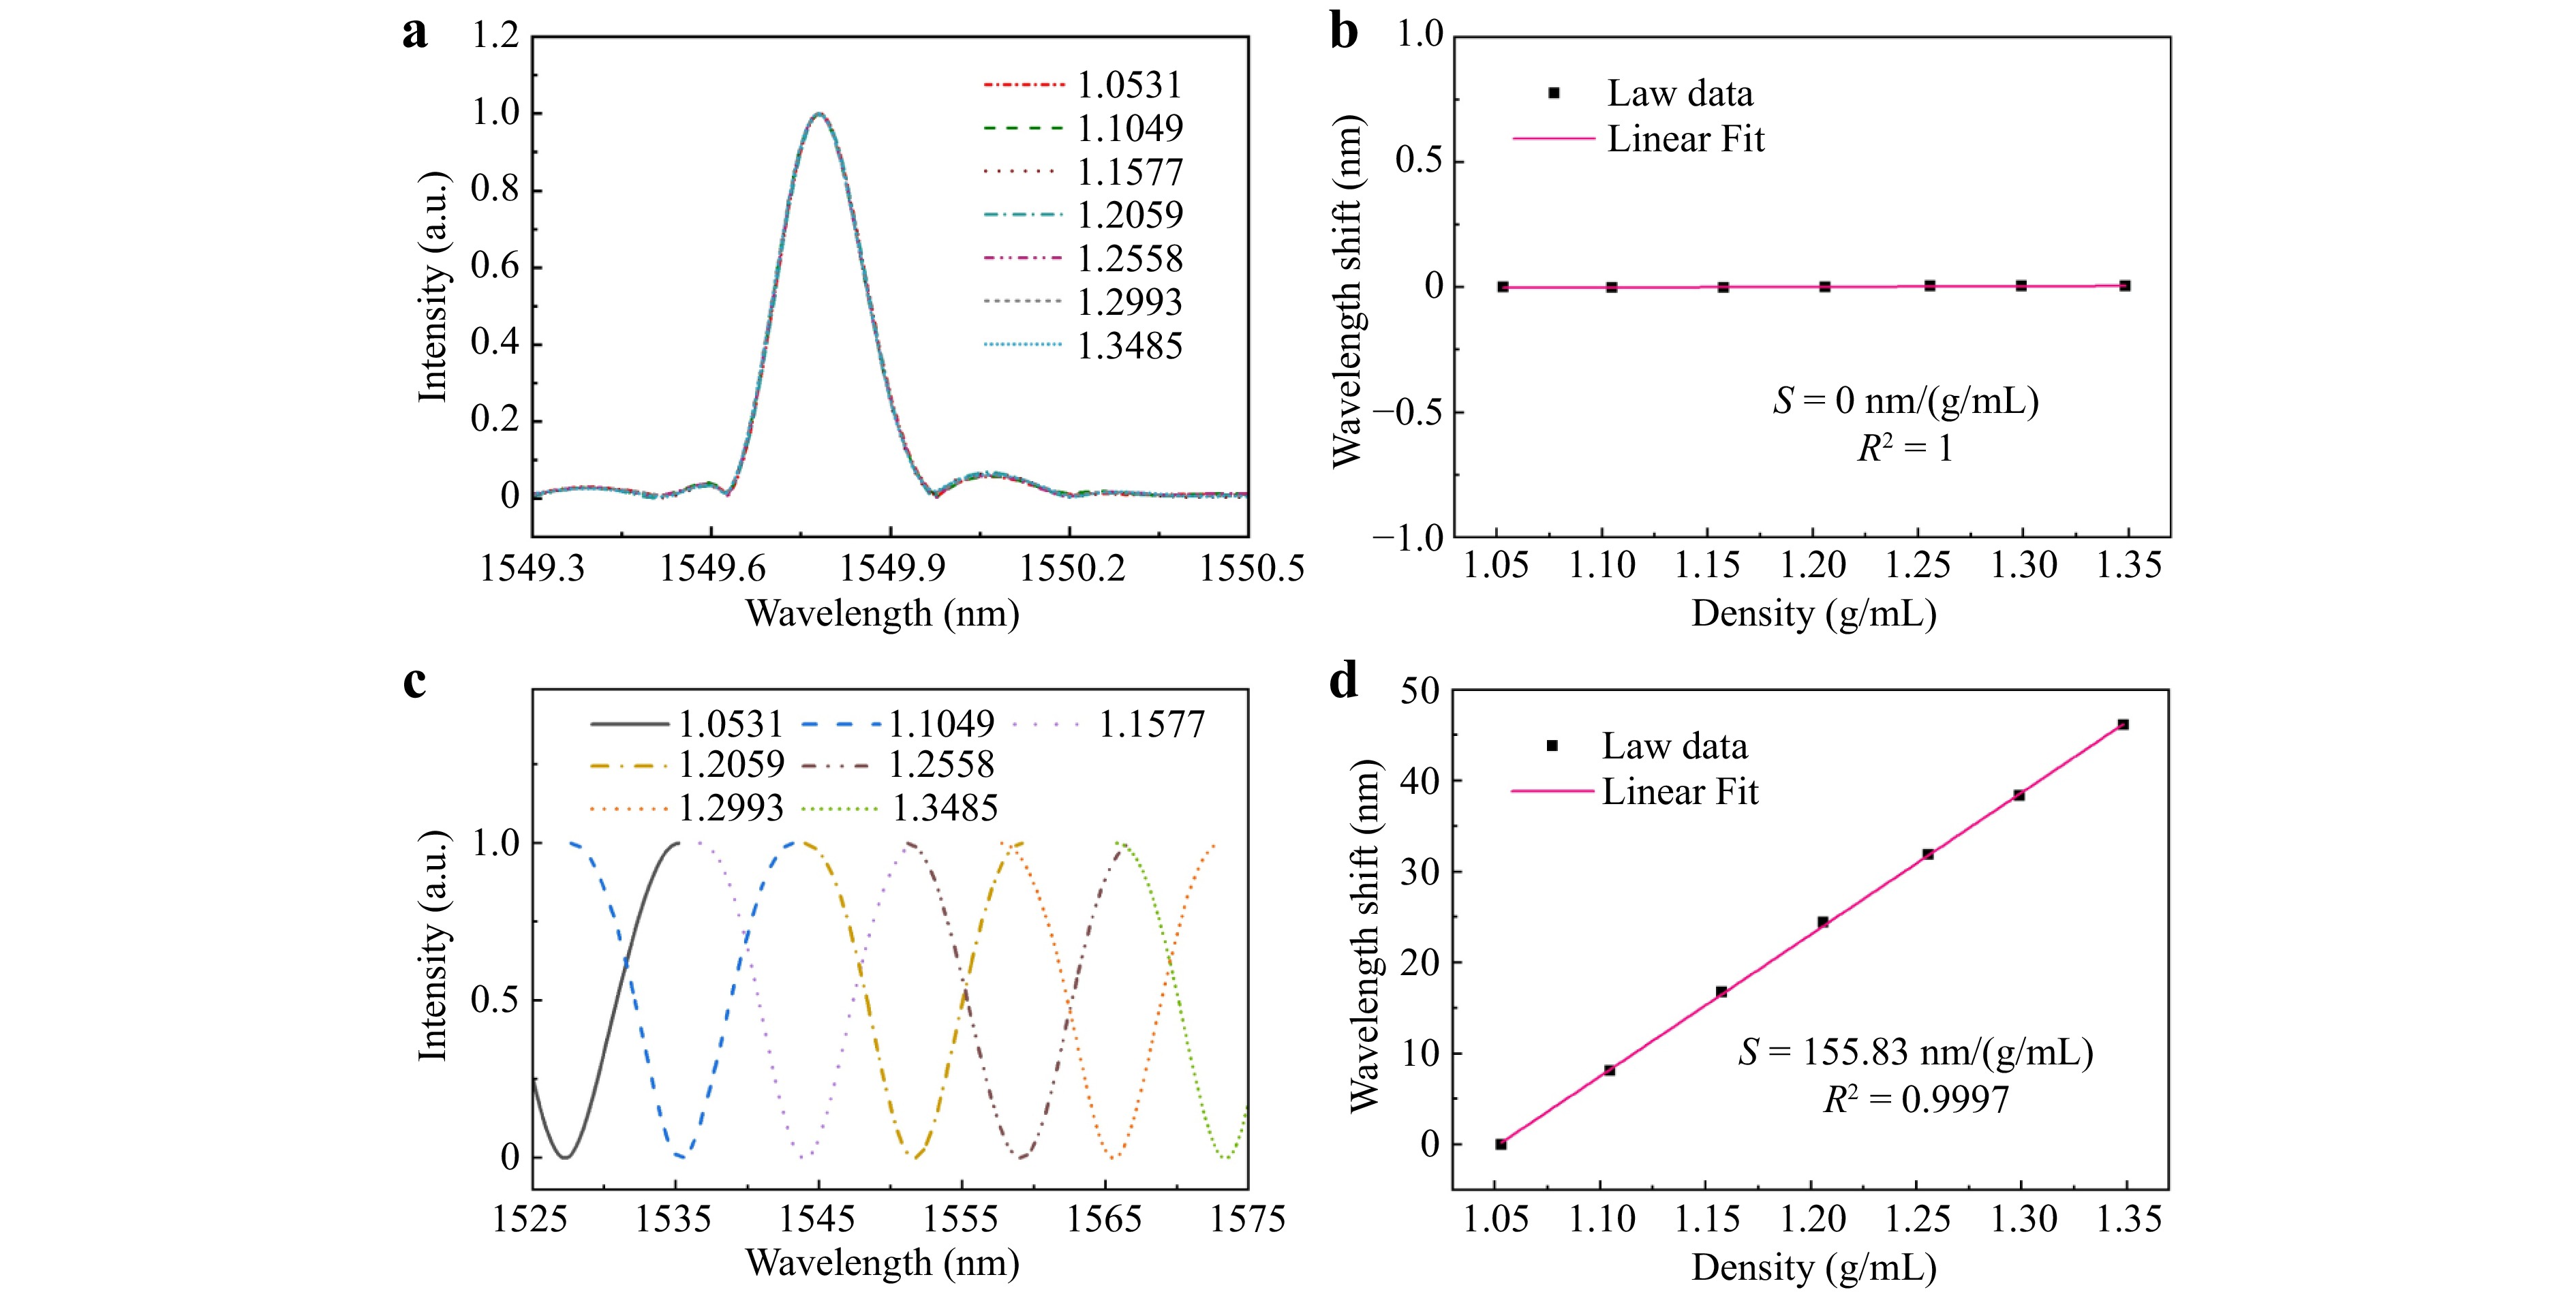
Fig. 8 Solution density sensing results within the density range of 1.0531–1.3485 g/mL. a Spectra of FBG reflection at different solution densities. b Linear fit results of Bragg wavelength shifts at different solution densities. c FP interference spectra at different solution densities. d Linear fit results of interference dip wavelength shifts at different solution densities.
Because the FP interference spectrum is sensitive to both solution temperature and density, the temperature disturbance affects the measurement accuracy of the solution density. The FBG can be used not only to measure the solution temperature but also to improve the accuracy of the density measurement by temperature compensation. The compensation matrix can be calculated from the temperature and density sensitivities of the FBG and FP sensing probes, which are expressed as
$$ \left[\begin{array}{c} \Delta \rho \\ \Delta T \end{array}\right]={\left[\begin{matrix} 155.83 & -0.211\\ 0 & 9.47 \end{matrix} \right]}^{-1}\left[\begin{array}{c} \Delta {\lambda }_{\mathrm{FP}}\\ \Delta {\lambda }_{\mathrm{FBG}} \end{array}\right] $$ (2) where Δρ (in g/mL) is the change in the solution density, ΔT (in °C) is the change in the solution temperature, ΔλFP (in nm) is the wavelength shift of the FP interference spectrum, and ΔλFBG (in nm) is the wavelength shift of the FBG reflection spectrum.
To demonstrate the capability of gas leak monitoring, we filled the MPC with different concentrations of C2H2 (3.65–17.8 ppm), CO2 (2,130–10,900 ppm), and CH4 (18.9–141 ppm). The other experimental conditions were the same as shown in Figs. 3 and 4. For each gas, to guarantee measurement sensitivity, we selected a relatively strong absorption line for concentration analysis. The retrieved transmission spectra of these three gases are shown in Fig. 9a-c. Absorbance A, which is defined by A = −lgT (where T is the transmittance) and is proportional to gas concentration, was used as the optical parameter for gas concentration sensing. The noise equivalent absorbance for the current system was estimated to be 7 × 10⁻⁴, according to which, the minimum detectable concentrations for C2H2, CO2, and CH4 were 0.07, 48, and 0.56 ppm, respectively. Fig. 9d-f show the scatter plots of gas absorbance versus concentration for C2H2, CO2, and CH4, respectively. The R2 values of the linear fitting were all greater than 0.999, indicating high linearity of the system. According to the fitting slopes, the measurement sensitivities for C2H2, CO2, and CH4 were 4.9 × 10⁻³/ppm, 6.8 × 10⁻⁶/ppm, and 5.9 × 10⁻⁴/ppm, respectively. The discrepancy in the sensitivities to these three gases resulted primarily from the difference in their absorption cross-sections.
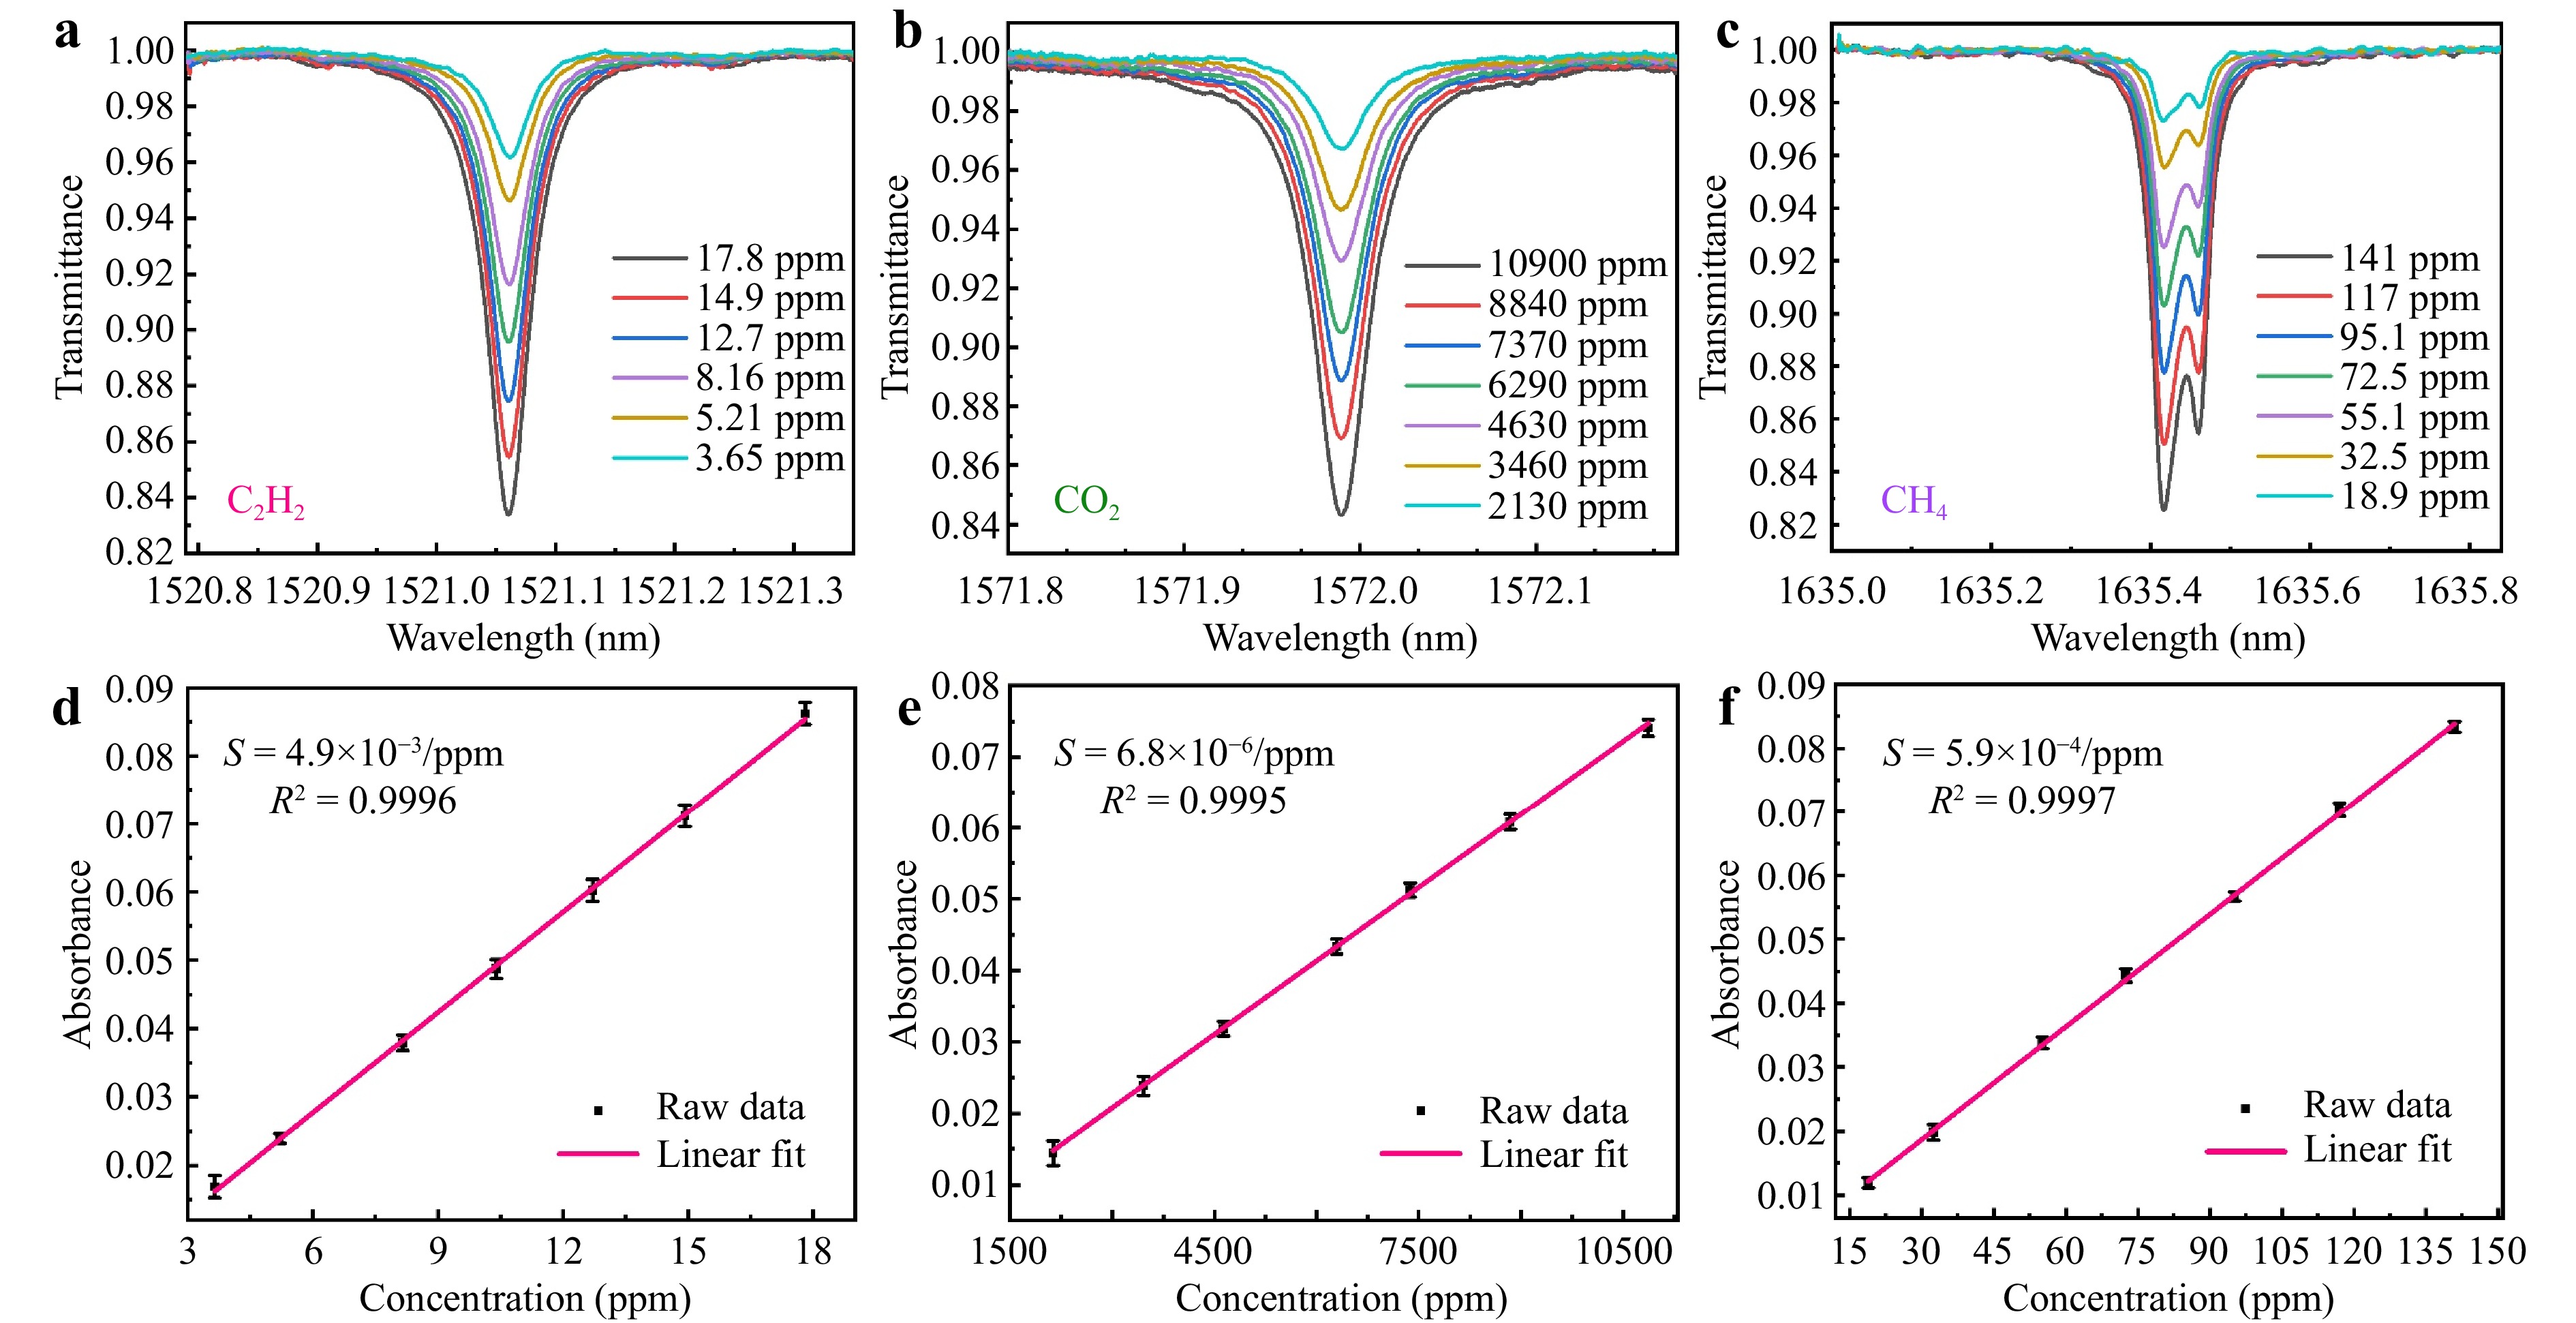
Fig. 9 Results of gas concentration sensing. Transmission spectra of C2H2 a CO2 b and CH4 c at different concentrations. Each spectrum is an average of 20 measurement results. The linear fit results of gas absorbance versus concentrations for C2H2 d CO2 e and CH4 f. The error bar is magnified 20 times for clarity.
-
In this paper, a multifunctional FMCW LiDAR system, which can simultaneously achieve free-space 3D imaging and multi-parameter sensing, is proposed. All the measurements are performed using a single laser sweep, signal modulation, and data acquisition components. In proof-of-concept experiments, a plastic character plate was imaged at 30 m with a horizontal resolution of 140 × 70 pixels and a range resolution of 1.2 cm. The imaging duration of a ‘HIT’ symbol was approximately 10 s, which can be shortened by utilising a tuneable laser source with a higher repetition rate, a fast spatial light modulation, or multiple collimators. By measuring the spectra of the cascaded FBG, FP, and MPC, we can measure the environmental temperature, gas concentration, and liquid density simultaneously. A temperature resolution of 0.5 ℃ and density resolution of 3 × 10⁻⁵ g/mL are measured by the FBG and FP sensing probe. In addition, the minimum detectable concentrations for C2H2, CO2, and CH4 are evaluated to be 0.07, 48, and 0.56 ppm, respectively. The excellent compatibility between the aforementioned ranging and sensing technologies means that the performance of either technology is not compromised. Therefore, we postulate that the optimal design of transceiver antennas and integration of additional optical fibre sensors will enable the current system to achieve longer-range imaging, monitoring of a greater number of physical quantities, and spatial multipoint or even distributed condition monitoring. The introduction of stability upgrades (vibration isolation, thermal control, etc.) is necessary to achieve higher measurement accuracy in complex testing environments. Therefore, the proposed FMCW LiDAR provides crucial additional capabilities for multi-parameter monitoring with potential applications in new-energy vehicles and automatic driving systems.
-
This work was supported by the National Key Research and Development Program of China (Nos. 2023YFF0715804 and 2022YFB3207602), National Natural Science Foundation of China (Nos. 624B2053 and 62205297), and Postdoctoral Scientific Research Development Fund of Heilongjiang Province (No. LBH-Q21092) and the National Key Laboratory of the Laser Spatial Information Foundation (No. LSI2024WDZC003).
Multifunctional frequency-modulated continuous-wave LiDAR for simultaneous 3D imaging and multi-parameter sensing
- Light: Advanced Manufacturing , Article number: 102 (2026)
- Received: 29 August 2025
- Revised: 09 June 2026
- Accepted: 15 June 2026 Published online: 05 August 2026
doi: https://doi.org/10.37188/lam.2026.102
Abstract: Traditional frequency-modulated continuous-wave (FMCW) light detection and ranging (LiDAR) is primarily used for high-precision distance measurements in free space. In this paper, a multifunctional FMCW LiDAR capable of high-precision ranging and multi-parameter sensing is proposed. By detecting echo signals from both free space and optical fibres, 3D imaging and the measurements of diverse physical parameters, including environmental temperature, gas concentrations, and liquid density, can be measured simultaneously. In an experiment, a target at 30 m was imaged with an adjustable resolution spanning 0.3–1.2 cm. Meanwhile, the electrolyte density and temperature of a battery were measured with accuracies of 3×10⁻⁵ g/mL and 0.5 °C, respectively. The concentrations of the gases (C2H2, CO2, and CH4), which are critical for monitoring thermal runaway of a battery, were measured with detection limits of 0.07, 48, and 0.56 ppm, respectively. The proposed multifunctional LiDAR exhibits significant application potential in fields such as new-energy vehicles and spacecraft.
Research Summary
Multifunctional FMCW LiDAR for simultaneous 3D imaging and multi-parameter sensing
Traditional frequency-modulated continuous-wave (FMCW) light detection and ranging (LiDAR) is primarily used for high-precision distance measurements in free space. Yongkang Dong from China’s Harbin Institute of Technology and colleagues now report a multifunctional FMCW LiDAR that achieves high-precision ranging and multi-parameter sensing. By detecting echo signals from both free space and optical fibres, 3D imaging and the measurements of diverse physical parameters, including environmental temperature, gas concentrations, and liquid density, can be measured simultaneously. It has potential for widespread application in the field of new-energy vehicles and is expected to provide a new integrated solution for improving the safety of new-energy vehicles.
Rights and permissions
Open Access This article is licensed under a Creative Commons Attribution 4.0 International License, which permits use, sharing, adaptation, distribution and reproduction in any medium or format, as long as you give appropriate credit to the original author(s) and the source, provide a link to the Creative Commons license, and indicate if changes were made. The images or other third party material in this article are included in the article′s Creative Commons license, unless indicated otherwise in a credit line to the material. If material is not included in the article′s Creative Commons license and your intended use is not permitted by statutory regulation or exceeds the permitted use, you will need to obtain permission directly from the copyright holder. To view a copy of this license, visit http://creativecommons.org/licenses/by/4.0/.

 DownLoad: