


-
Fiber Bragg grating (FBG) sensors are widely used for temperature and strain measurements because of their excellent anti-interference capability and distributed sensing characteristics1–3. Particularly, the FBGs fabricated using femtosecond (fs) laser technology exhibits outstanding high temperature resistance4. This fabrication method offers flexibility in creating various FBGs, such as point-by-point5, line-by-line6, and plane-by-plane FBG7, thereby enabling customization to meet specific application requirements. However, the Bragg resonance wavelength is influenced by both thermo-optic and elasto-optic effects, making it challenging for traditional single-mode FBGs to decouple strain from temperature5,8. The typical temperature–strain cross-sensitivity is approximately 10 με/°C. Accurate discrimination between temperature and strain is critical in various applications, such as aircraft flight monitoring and lithium-ion battery thermal runaway detection, where temperature and strain changes occur simultaneously9–13. Therefore, effective discrimination is essential for identifying and preventing such events.
Several decoupling techniques were proposed for this purpose. One approach involves positioning two parallel FBGs with one loosely arranged as a temperature compensator14. However, these isolated compensated sensor packages are complex and impractical for real-time applications. Alternatively, configurations employing interferometers, long-period gratings, or cascaded multimode-single-mode FBGs offer multiparameter sensing capabilities, but consume significant spectral bandwidth15,16. Another technique involves splicing FBGs of varying diameters to leverage differential strain responses; however, this method requires fixing the fiber ends, potentially leading to fragility issues17. Additionally, these methods achieve parameter compensation through multiple sensors located at relatively distant positions, which can result in decoupling failure due to excessive temperature gradients in the measurement environment18,19.
Ideal temperature and strain discrimination can be achieved by arranging two differentially responsive gratings within a single fiber, thereby minimising the influence of the temperature-field distribution. This approach requires optical fibres composed of heterogeneous materials to enable effective temperature and strain discrimination. Unfortunately, the most widely used single- and multimode fibres have nearly uniform material compositions. While polarization-maintaining fibres (PMFs) with heterogeneous materials in their core and stress rods offer the potential for achieving compact monofiber discrimination. However, independent monitoring of two close slow/fast axis Bragg resonant peaks of PMF-FBGs remains challenging. The two peaks’ temperature responses are too close, the ratio is about 0.96 (10.1 pm/°C vs. 10.5 pm/°C ), making their clear identification difficult20,21.
In this study, we propose and demonstrate a monofiber sensor based on heterogeneous waveguide (HW) gratings for temperature and strain discrimination. Using spherical-aberration-assisted femtosecond laser direct writing, two HW gratings were inscribed in the stress rod and parallel core of a PMF. These gratings, inscribed in materials with distinct thermo-optic properties, exhibit significantly different temperature responses. Consequently, the monofiber sensor can simultaneously measure the temperature and strain. To validate the effectiveness, the strain measurement accuracy of the proposed sensor is compared with those of conventional isolated compensation methods under dynamic temperature changes.
-
Here, a 40× water-immersion objective lens (Nikon, NA = 0.8) was immersed in matching oil with a refractive index (RI) of 1.45 during operation to eliminate the cylindrical lens effect during laser beam focusing within the optical fiber. Notably, the objective lens was originally designed for immersion in a medium with an RI of 1.33. When it was used to focus a 514 nm laser within a medium of RI 1.45, spherical aberration occurred due to the RI mismatch, as shown in the schematic of Fig. 1a. After focusing, the centre and edge of the beam were focused onto different planes, leading to elongation of the focal spot. Simulation results show that the spot size increased from 6.5 μm (under water-immersion conditions, Fig. 1b) to 10 μm (under oil-immersion conditions, Fig. 1c). With the introduction of spherical aberration, the focal depth of the objective lens approached the diameter of the fiber core.
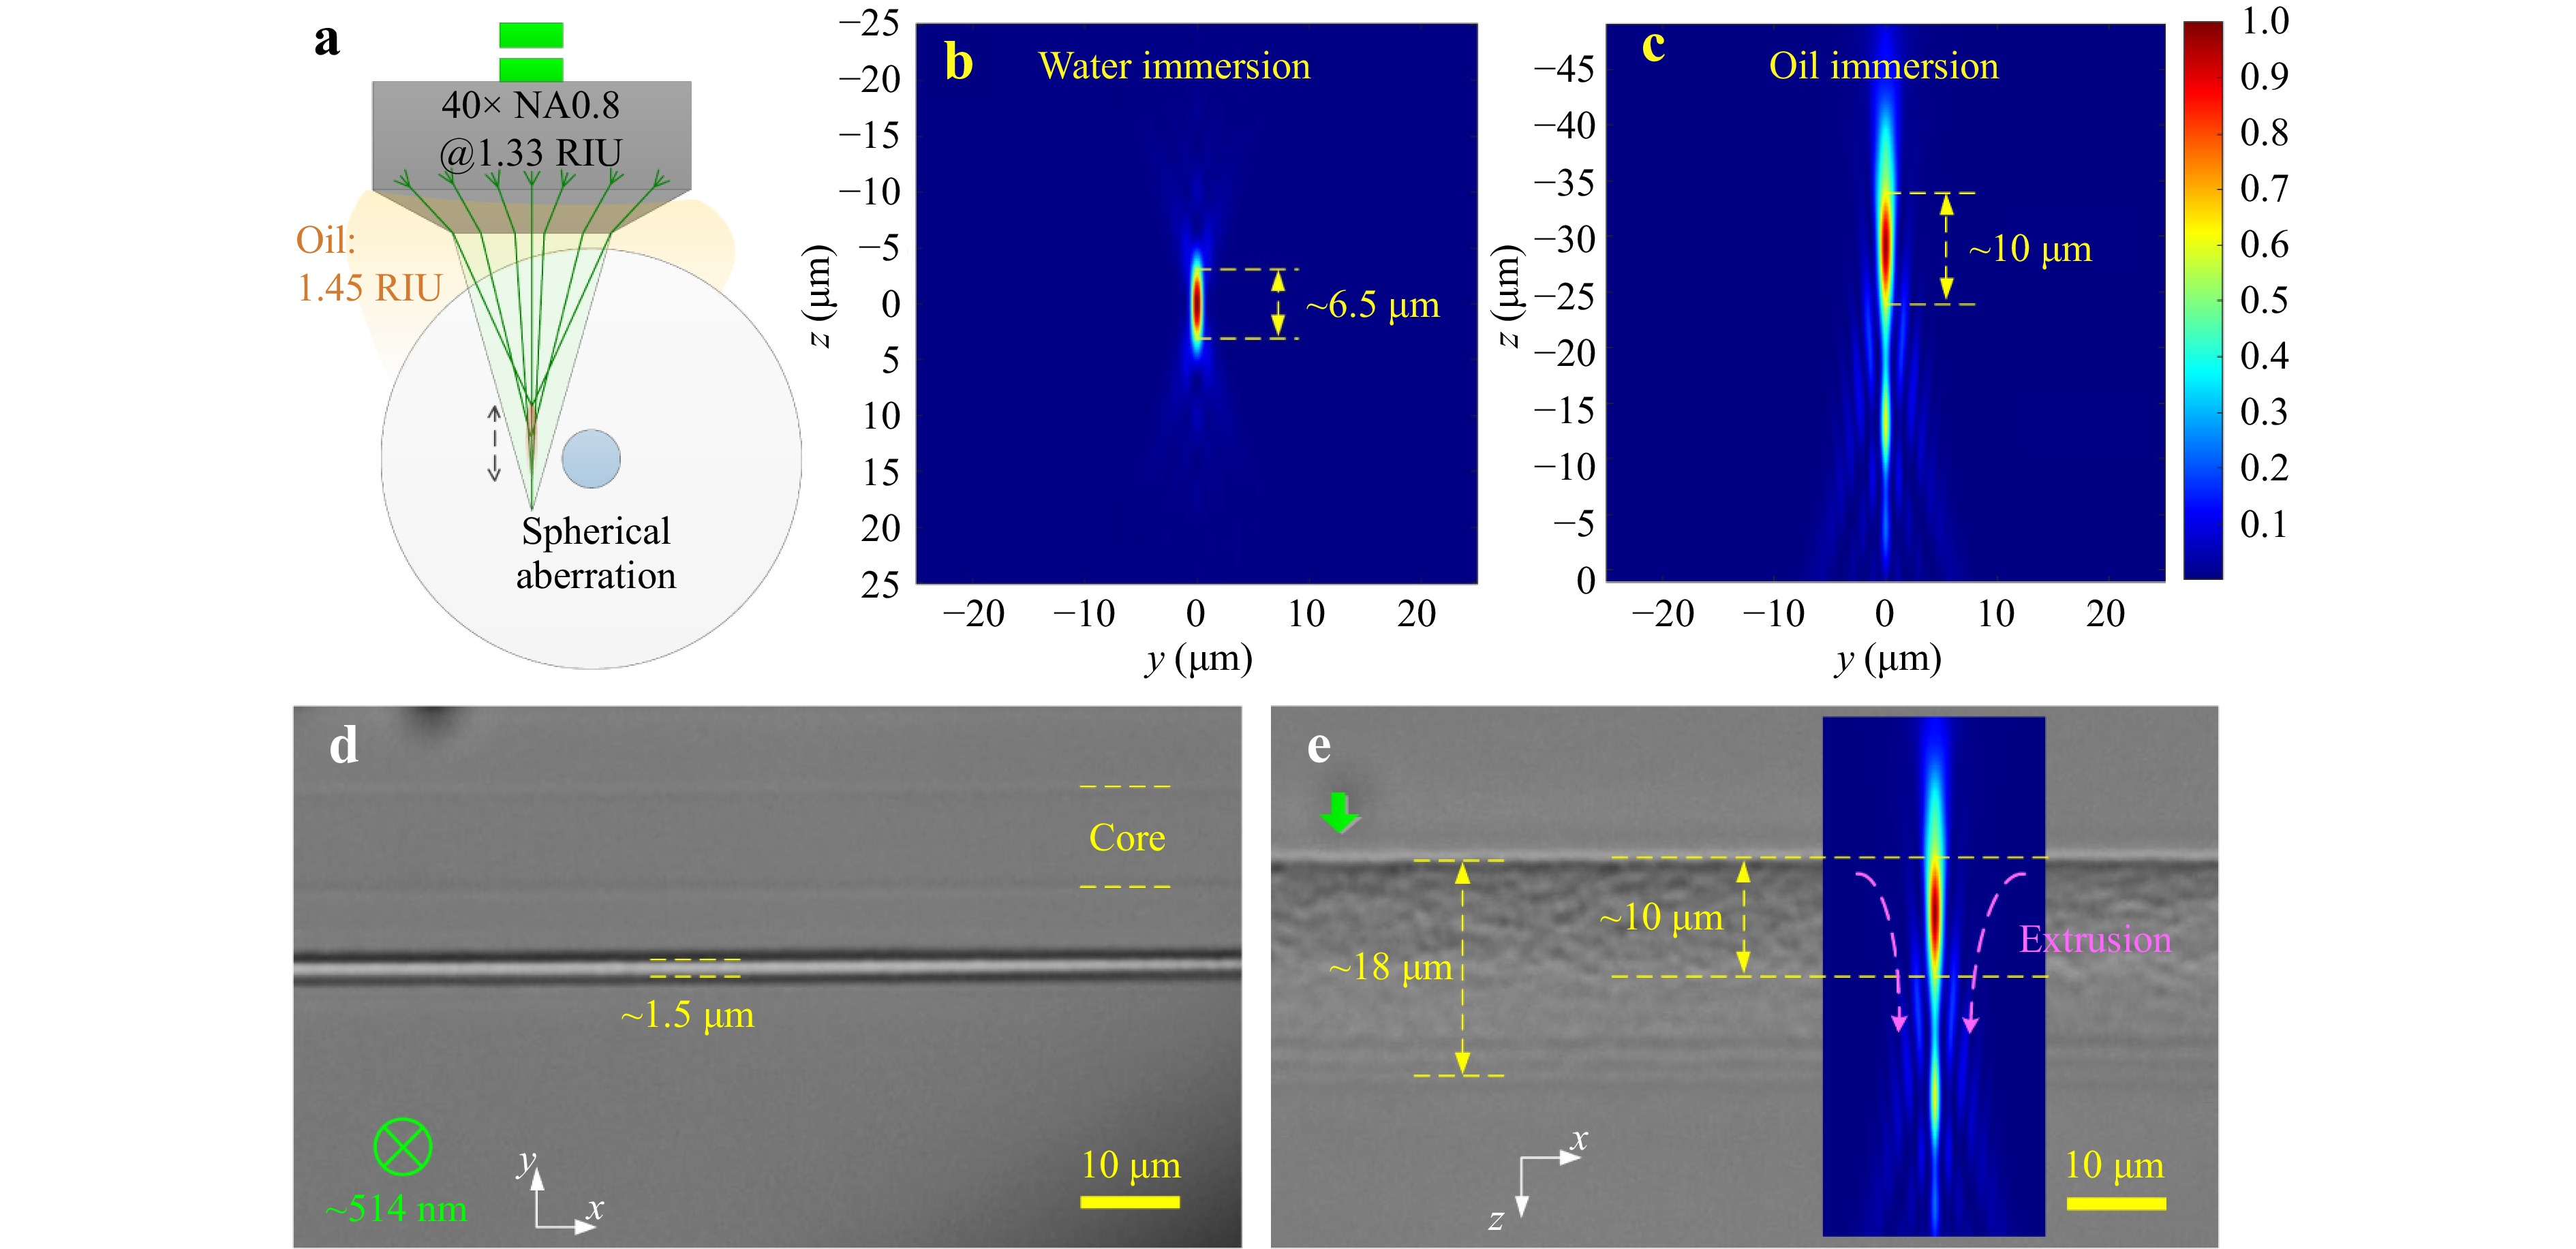
Fig. 1 Spherical aberration assisted waveguide fabrication. a Schematic diagram of spherical aberration caused by immersion refractive index mismatch. b and c Simulated focal light field when the objective immersed in water and oil, respectively. d and e The top view and the view after a 90° rotation of the laser-induced single-line track in the fiber.
Waveguides were written using a 514 nm fs laser with an optimised pulse energy of 138 nJ, a repetition frequency of 200 kHz, and a translation stage speed of 0.2 mm/s. The single-line track inscribed in the optical fiber is shown in Fig. 1d, e. Fig. 1d presents a top-view image of the single-line modification with a width of approximately 1.5 μm. Furthermore, Fig. 1e shows a view after rotating the fiber by 90° about its longitudinal axis, illustrating a total laser-modified depth of ~18 μm. The upper region exhibits negative RI modulation, while localized material compression occurs in the lower region, generating positive RI modulation with a depth of ~8 μm.
The waveguide was inscribed by multiple-move scanning22. After completing the first waveguide path, subsequent paths were inscribed in a direction away from the core. A total of seven paths were inscribed, with an interval of 500 nm between them. In the coupling region, the waveguide length was 220 μm, and the distance between the waveguide and the core was 6.5 μm. Under these processing parameters, approximately 50% of the optical power was decoupled from the core. Further details of the inscribed waveguide can be found in Supplementary Information S1.
-
Fig. 2a presents a schematic of the proposed HW grating-based monofiber sensor. The device consisted of SMF (YOFC) spliced with panda PMF (Nufern), while the stress rod waveguide (SRW) and Bragg gratings in the fiber were fabricated using the fs laser direct writing method23. The femtosecond-laser-written SRW and PMF core waveguide (CW) exhibit different thermo-optic and thermal expansion coefficients. Among these, the thermo-optic coefficient of the fiber plays a dominant role in temperature sensing. Notably, the thermo-optic coefficient of the GeO2-doped CW was greater than that of the B2O3-doped SRW24. Consequently, the temperature response of the SRW grating is expected to be lower than that of the CW grating. As a monofiber device, the two gratings shared the same elasto-optic coefficient, resulting in identical strain responses, as shown in the spectral schematic of the temperature and strain responses in the inset of Fig. 2a.
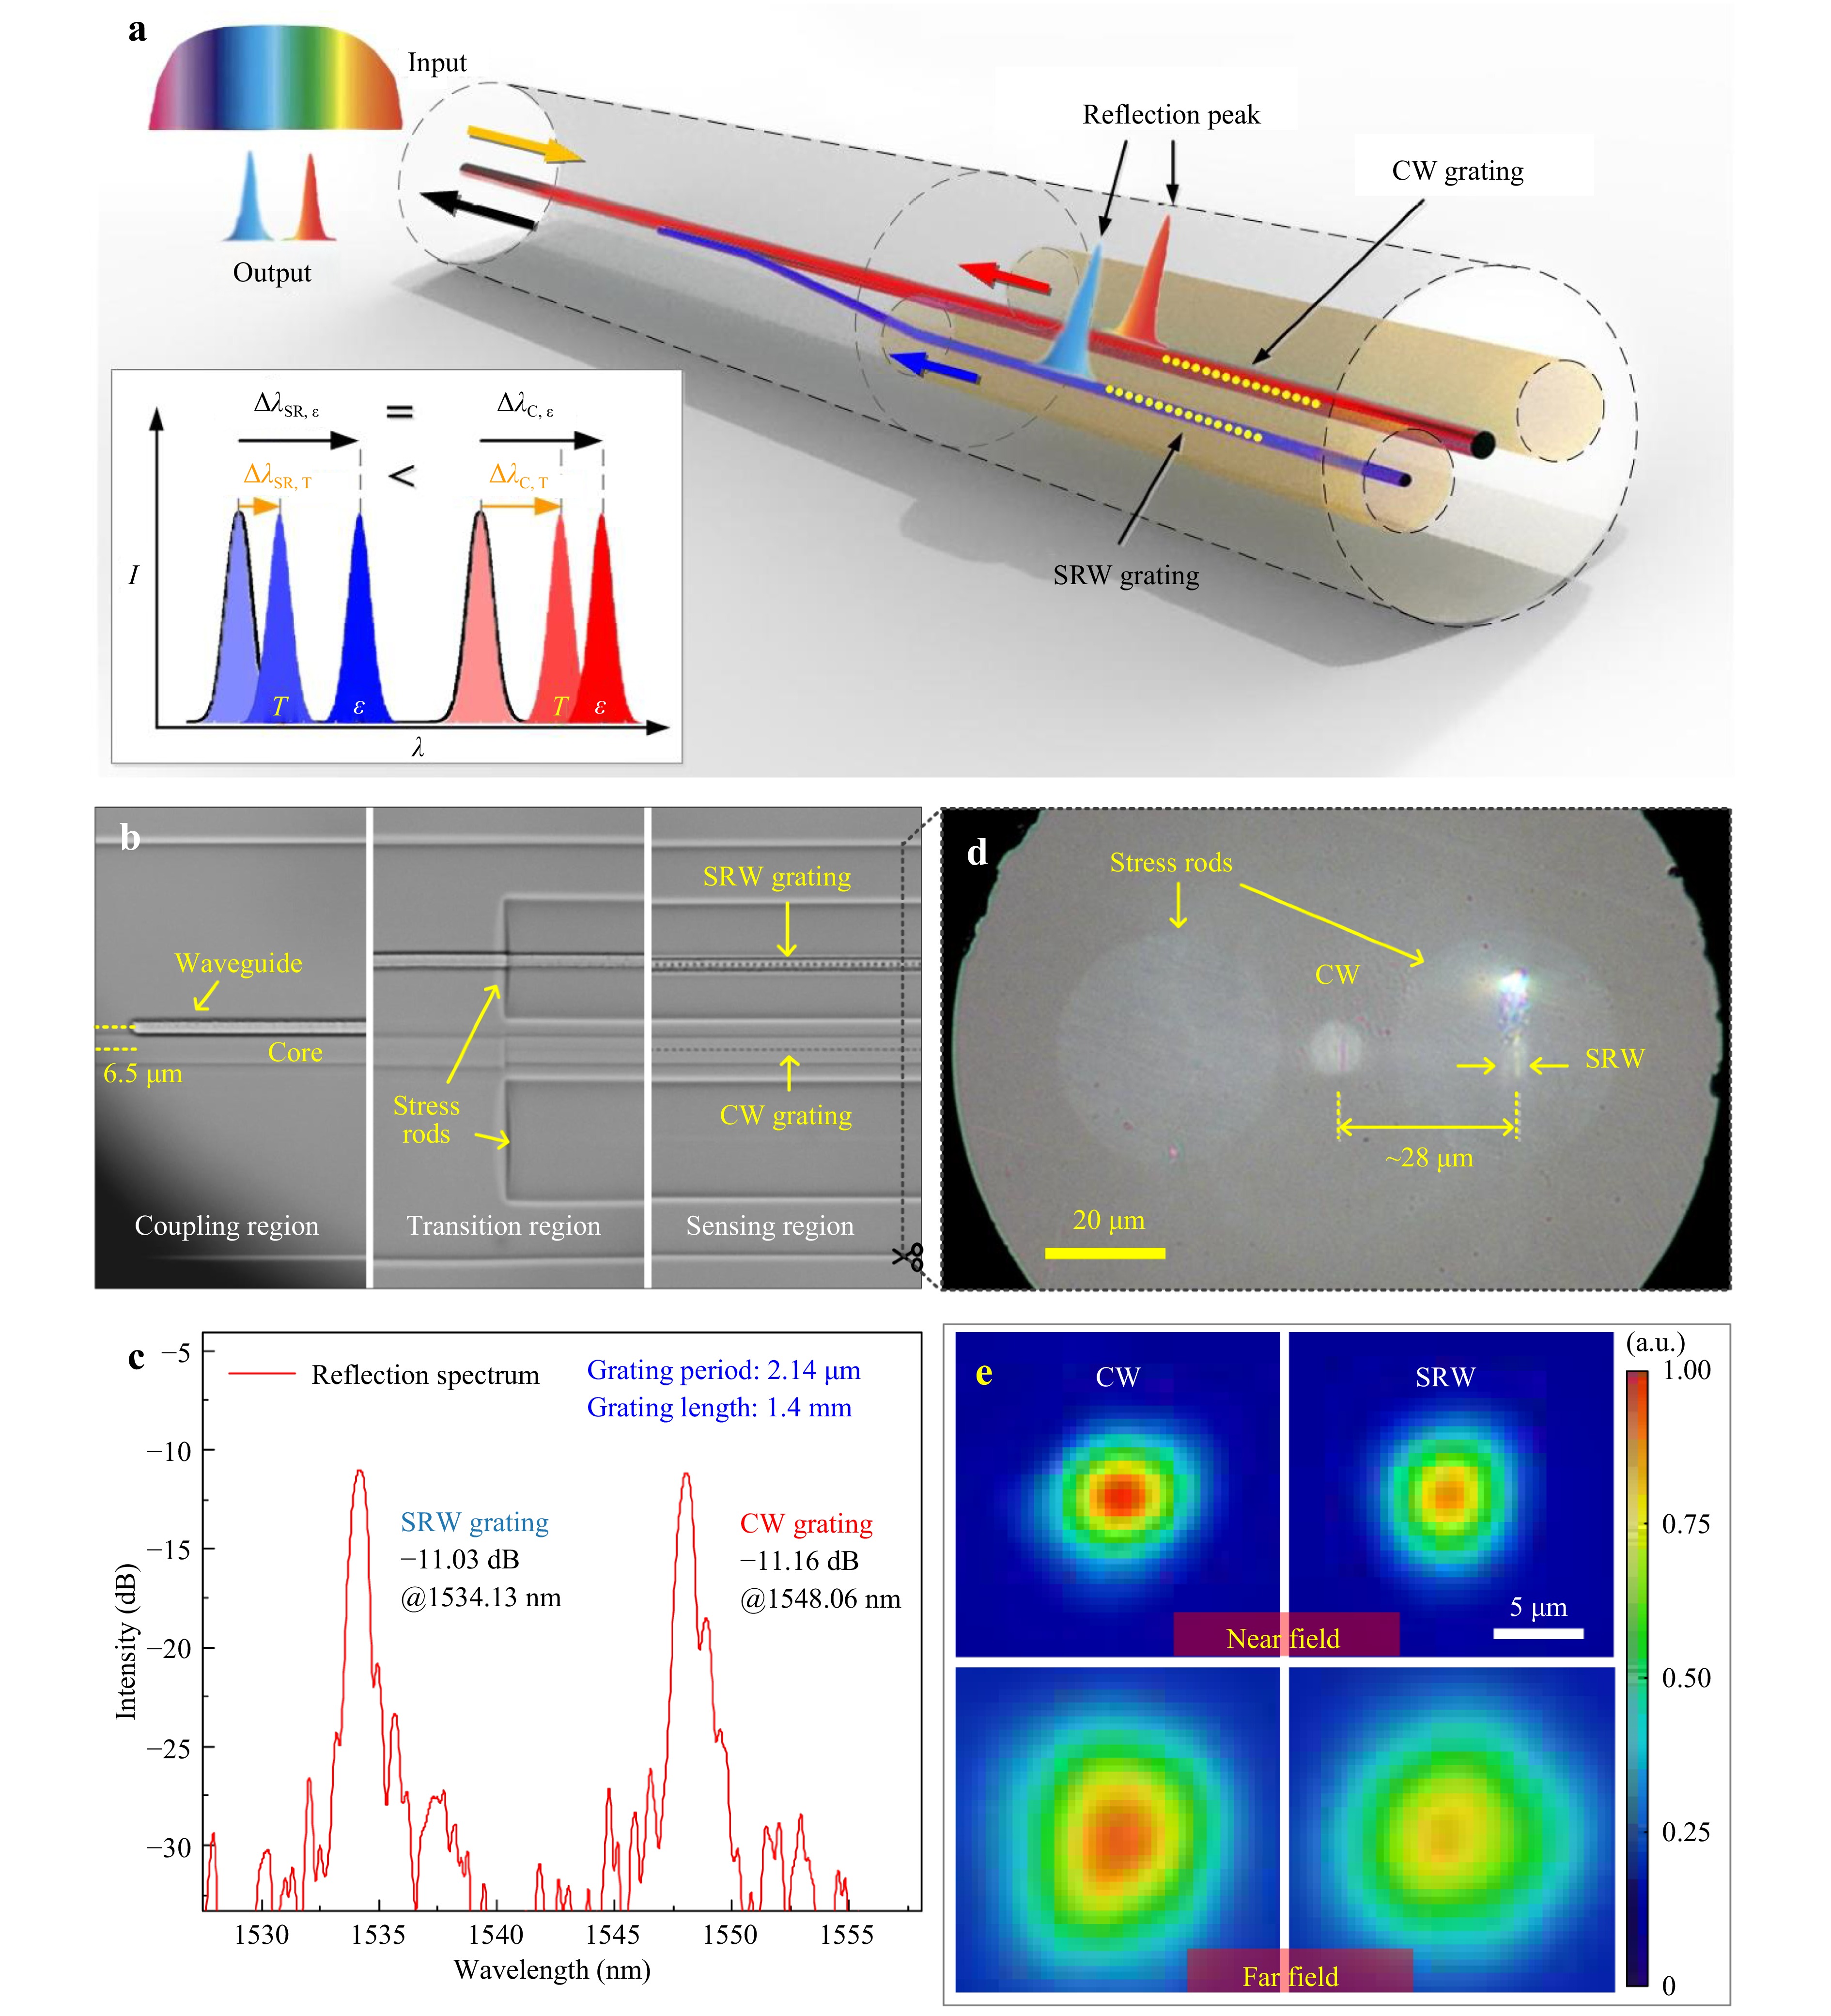
Fig. 2 Sensor structure and optical characterization. a Schematic diagram and principle of the sensor. b Micrograph of the heterogeneous waveguide gratings. c The reflection spectrum of the sensor. d Cross sectional microscopic image of the PMF. e The mode fields of the PMF’s CW and the SRW.
The waveguide length of the transition region was 1 mm, and the final departure from the core was 28 μm, resulting in a waveguide turn angle of only 1.23°, which did not affect optical transmission. As shown in Fig. 2b, the waveguide was smoothly connected at the interface between pure silica and B2O3-doped silica, demonstrating the feasibility of constructing fs-laser-direct-written waveguide connections in heterogeneous transparent materials. In the final step, two Bragg gratings with the same period of 2.14 μm were inscribed in the core and waveguide by point-by-point inscription. The inscription pulse energy of the gratings in the CW and SRW was 263 nJ and 1295 nJ, respectively. The repetition rate of the fs laser was set to 100 Hz. Both gratings had a length of 1.4 mm.
-
The microscopic image of the monofiber sensor is shown in Fig. 2b. The fs-laser-written waveguide comprises three regions defined by their functions: (i) the coupling region, where part of the light transmitted in the SMF core enters the waveguide through evanescent field coupling, and conversely, light transmitted through the waveguide can be coupled back into the core; (ii) the transition region, where the waveguide gradually moves away from the SMF core and then enters the stress rod of the PMF from the cladding of the SMF; and (iii) the sensing region, where the SRW and CW gratings are inscribed in parallel.
The reflection spectrum of the sensor is shown in Fig. 2c, with resonant wavelengths of 1534.13 nm and 1548.06 nm for the gratings in the SRW and CW, respectively. The difference in the resonant wavelengths of the two gratings with the same period is attributed to the difference in their effective refractive indices. The RI of the GeO2-doped CW was higher than that of the B2O3-doped SRW.
The mode fields of the CW and SRW were measured at a wavelength of 1550 nm. Samples fabricated using the same parameters were cut and polished in the sensing region. The polished PMF cross-section is shown in Fig. 2d. The mode fields at 1550 nm were then photographed using a 50× objective and a CCD operating in the infrared band. The near- and far-field curves of the CW and SRW are shown in Fig. 2e. The near- and far-mode field sizes of the SRW were close to those of the CW, indicating that their numerical apertures were similar. Our method effectively increases the mode field area to match that of the CW, which is advantageous for enhancing the coupling efficiency between the laser-induced waveguide and the CW25.
-
Subsequently, the temperature responses and stabilities of the sensors were investigated. Initially, we attempted to heat the sensor to 700 °C and found that the SRW grating spectrum was completely erased at approximately 660 °C. Previous reports have shown that type I modulation degrades rapidly when approaching 300 °C, primarily due to the release of laser-induced internal stress through thermal decomposition26. Therefore, we chose a lower annealing temperature of 290 °C to partially remove the stress-induced modulation region of the SRW. After standing annealing for 24 h, the spectra were stable, as shown in Fig. 3a, b. The peak intensities of the gratings in the CW and SRW decreased and increased, respectively. This behaviour is attributed to the gradual erasure of the type I modulation region caused by residual stress during annealing, which alters the coupling state of the SRW owing to changes in its effective RI.
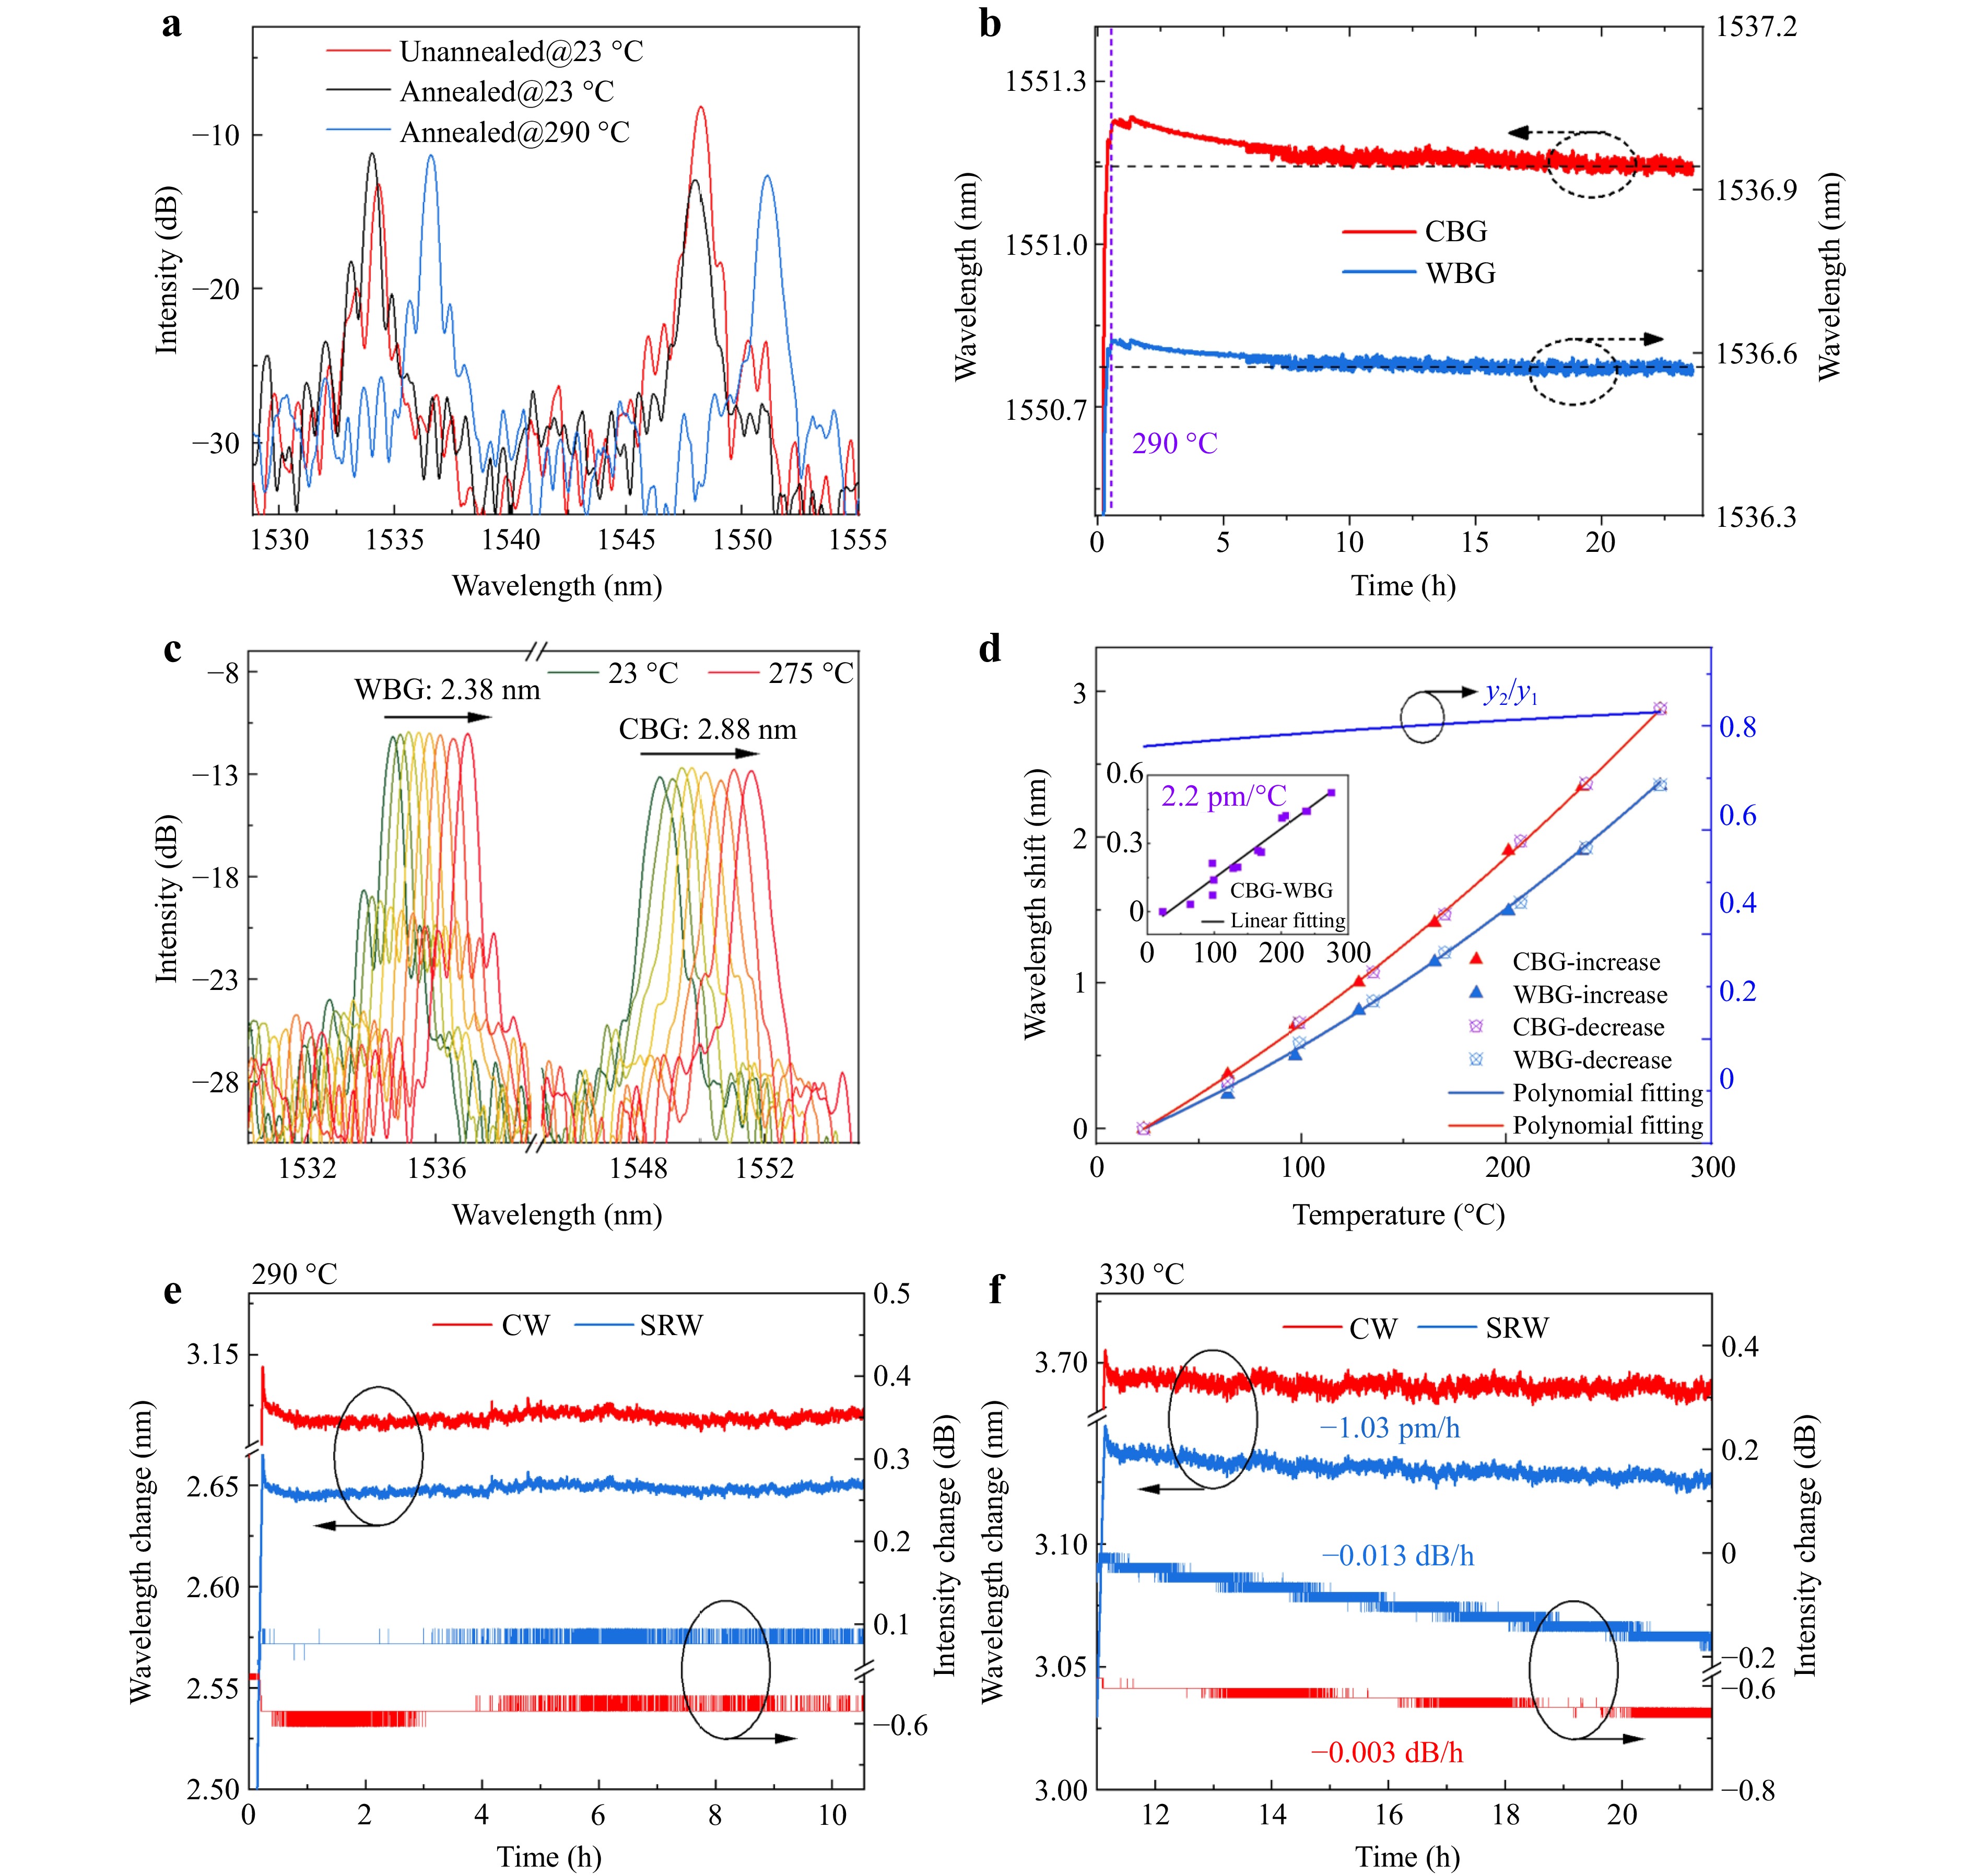
Fig. 3 Thermal responses. a Spectral evolution before and after annealing. b The drift of peak wavelengths in SRW and CW of the spectra during annealing. c Evolution of the spectra of the sensor with temperature changes after annealing. d A plot showing the relationship between the sensor’s wavelength shift and temperature. e and f Test data for intensity and wavelength stability of the sensor at 290 °C and 330 °C, respectively.
The temperature response of the annealed sensors was also measured. An annealed sample was placed in a heating furnace, and the temperature was gradually increased from 23 °C to 275 °C. The temperature was maintained at each step for at least 25 min to ensure stability. The spectral evolution with increasing temperature is shown in Fig. 3c. Both CW and SRW gratings exhibited a redshift in their resonant wavelengths. The resonant wavelength shifts of the gratings in the CW and SRW were 2.88 nm and 2.38 nm, respectively. The temperature response ratio of the SRW to the CW was approximately 0.8, which is significantly higher than that of PMF-FBGs20,21. The wavelength shifts and polynomial fitting curves for the CW and SRW as functions of temperature are plotted in Fig. 3d. The wavelength shift difference between the CW and SRW exhibited a linear relationship with temperature, with a slope of 2.2 pm/°C.
The thermal stability of the annealed sensors was evaluated by placing the annealed samples in a heating furnace. The resonant wavelength shifts and intensity changes of the gratings in the CW and SRW over time at 290 °C are plotted in Fig. 3e. The resonant wavelength fluctuations of the CW and SRW gratings followed a similar trend, which was attributed to temperature fluctuations within the heating furnace. Notably, the resonant intensities of both gratings in the CW and SRW remained unchanged, indicating that the monofiber sensor can withstand temperatures of 290 °C. Subsequently, the sample was heated to 330 °C and held for 10 hours. As shown in Fig. 3f, the resonant wavelength and intensity of the CW grating remained virtually unchanged, whereas the SRW grating exhibited decreasing trends at rates of –1.03 pm/h and –0.013 dB/h. This indicates that the sensor cannot withstand 330 °C.
-
The strain responses of the monofibre sensors were evaluated at various temperatures. One end of the bare fiber was fixed, while the other end was stretched and secured to a translation stage. A heating stage was placed beneath the suspended fiber. The strain response of the sensor was measured at eight temperatures as it was heated from 23 °C to 271 °C. The experimental data are plotted in the bar chart shown in Fig. 4a. In this chart, the total height of each bar represents the wavelength shift of the CW grating ($ \Delta {\lambda }_{C} $), the height of the blue bar indicates the wavelength shift of the SRW grating ($ \Delta {\lambda }_{SR}) $, and the height of the red bar represents the difference between them ($ \Delta {\lambda }_{C-SR} $). The overall wavelength shift in each bar can be categorised based on its inducing factors and further decomposed, as illustrated in Fig. 4b. Specifically, $ \Delta {\lambda }_{SR,T} $ and $ \Delta {\lambda }_{C,T} $ are the temperature-induced resonant wavelength shifts in the SRW and CW; $ \Delta {\lambda }_{SR,\varepsilon } $ and $ \Delta {\lambda }_{C,\varepsilon } $ are the strain-induced resonant wavelength shifts in the SRW and CW; And $ \Delta {\lambda }_{C-SR} $ depends only on temperature.
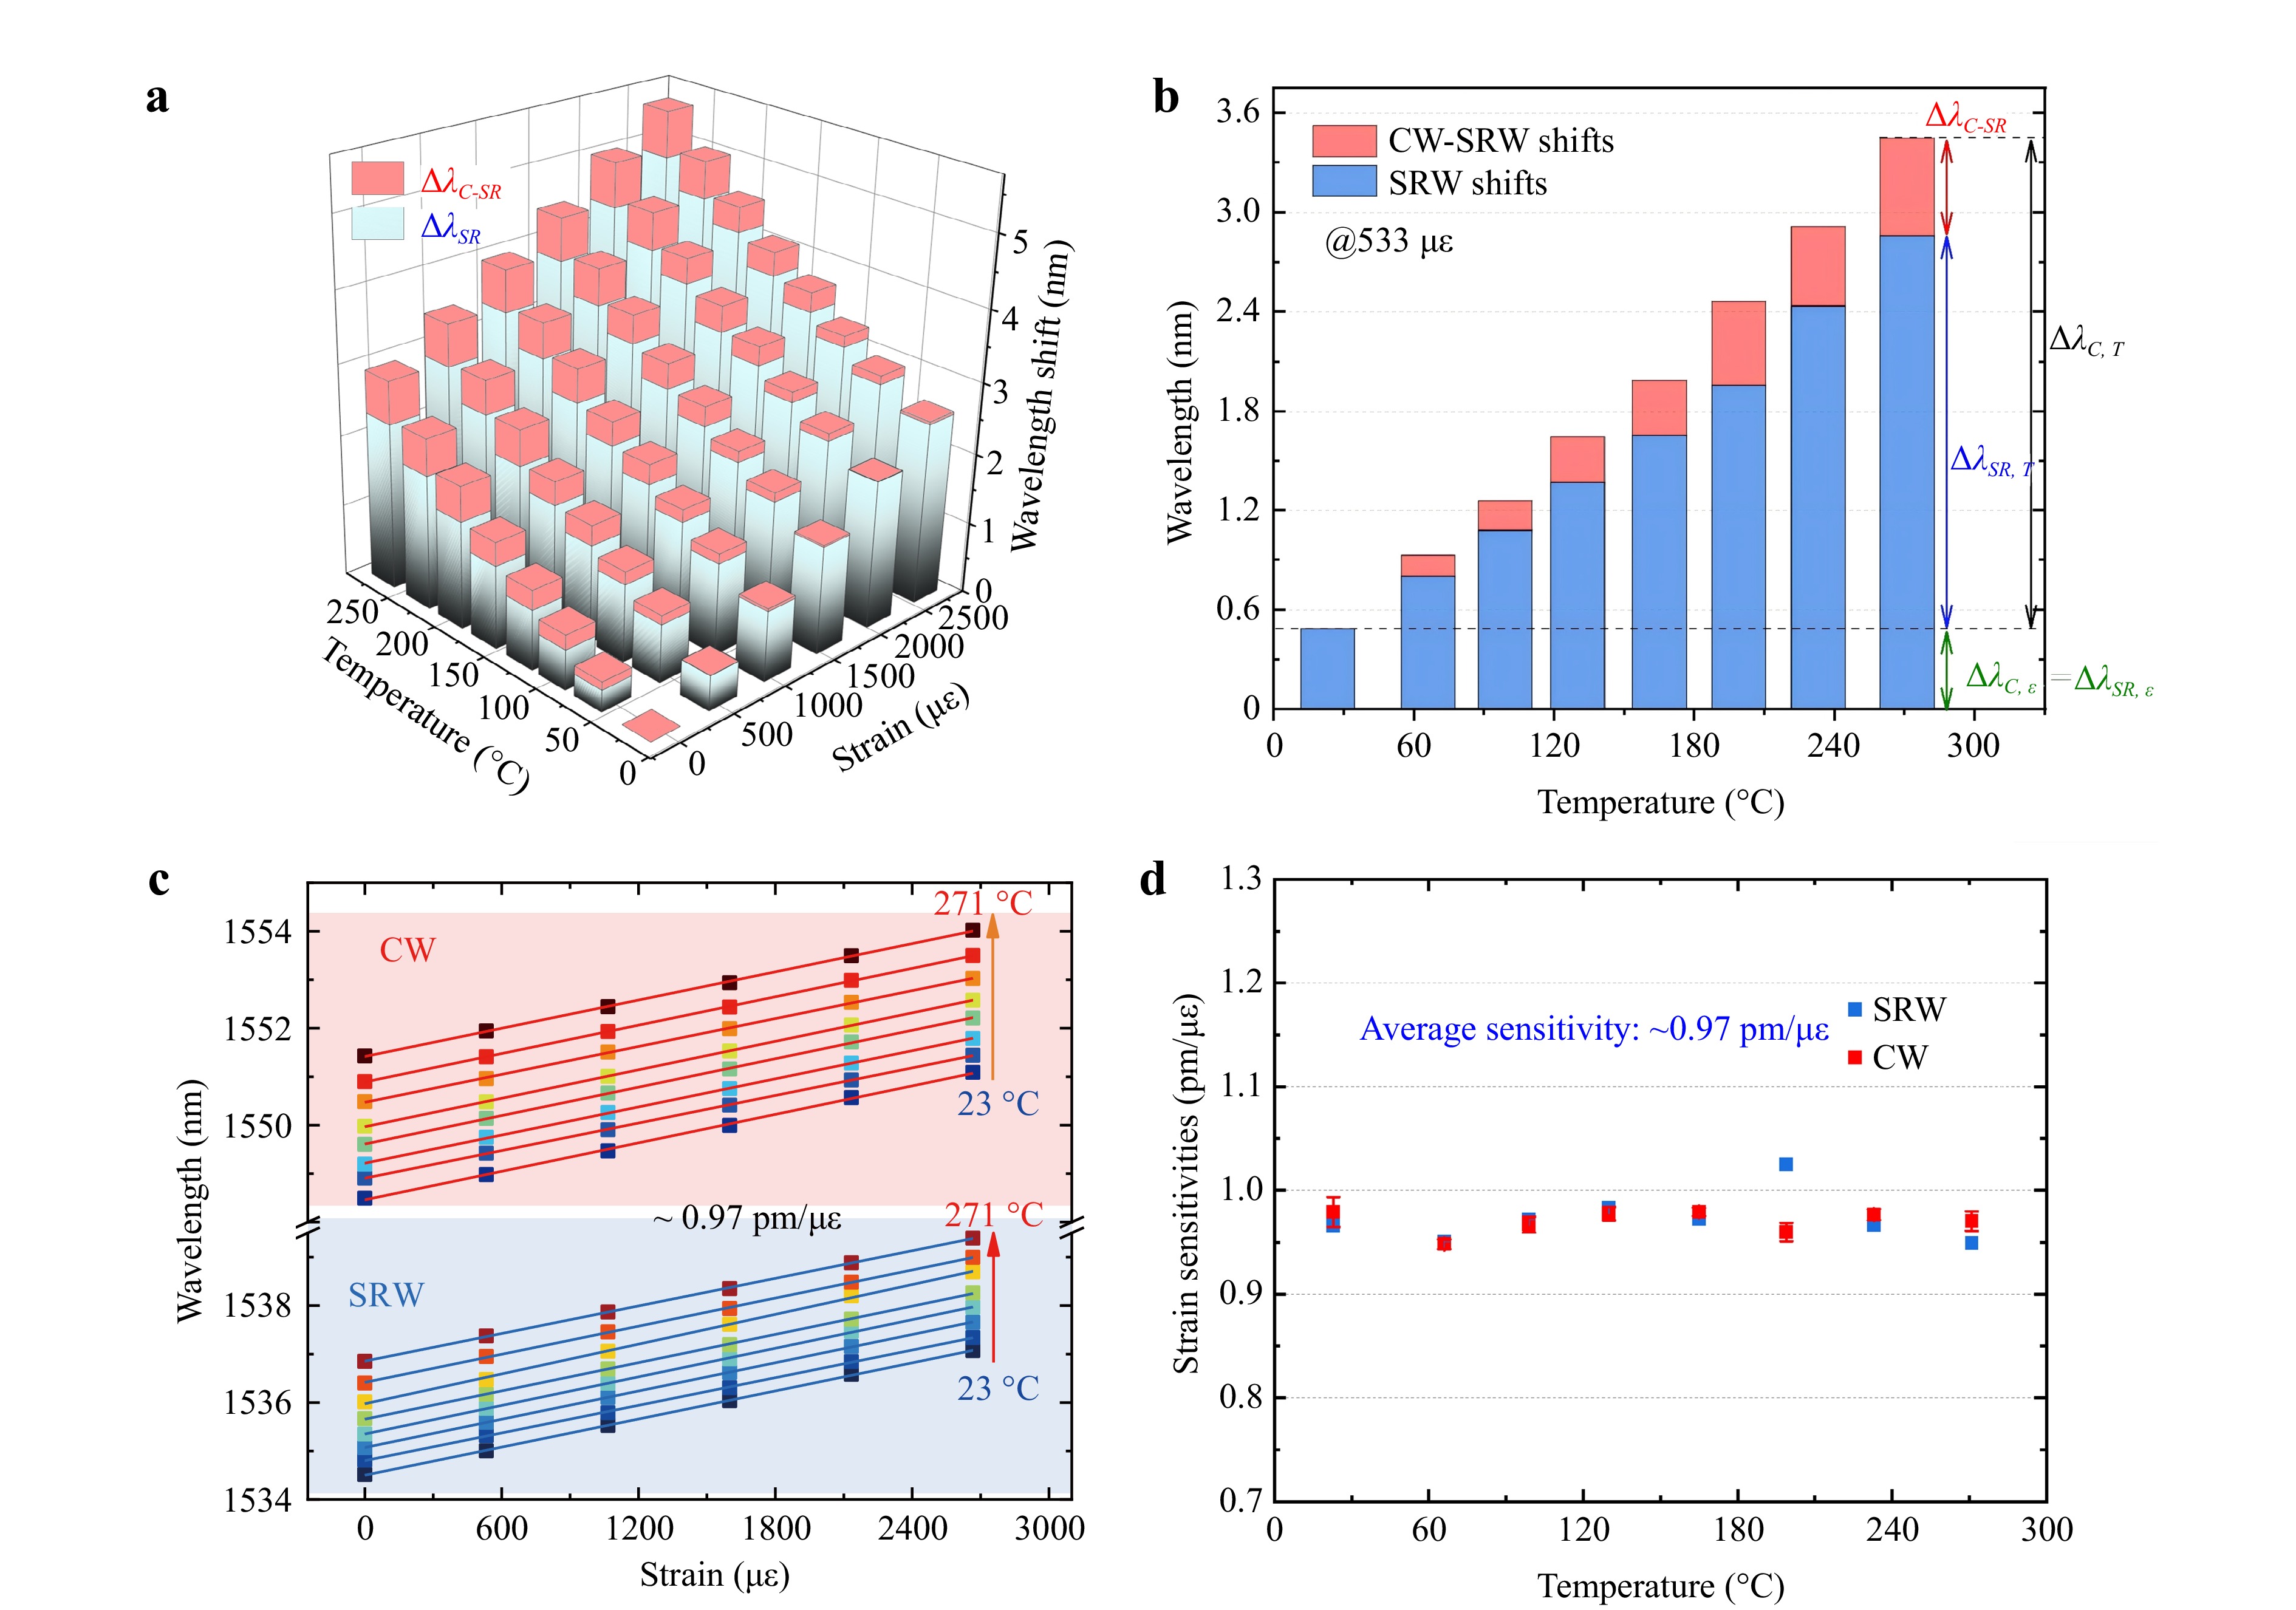
Fig. 4 Strain responses. a Strain responses at different temperature. b Temperature responses @533 με. c The strain responses at various temperatures and their linear fit. d Statistics on the strain sensitivities at various temperatures.
When tensile strain was applied to the sample, the resonant wavelengths in the CW and SRW exhibited a linear “red” shift with increasing strain. Fig. 4c plots the strain-induced peak shifts at temperatures from 23 to 271 °C. The strain sensitivities of the sensor at different temperatures are shown in Fig. 4d. The strain sensitivities were relatively consistent across all temperatures, with an average sensitivity of 0.97 pm/με. Minor fluctuations may have been caused by random errors.
-
The temperature (T) response fitting functions (R2 > 0.99) of the gratings in SRW and CW are
$$ \Delta {\lambda }_{SR,T}=\mathrm{ }-0.16475+\mathrm{ }0.00598\mathrm{*}T+\mathrm{ }0.0000116321\mathrm{*}{T}^{2} $$ (1) $$ \Delta {\lambda }_{C,T}=\mathrm{ }-0.18872+\mathrm{ }0.00802\mathrm{*}T+\mathrm{ }0.0000114315\mathrm{*}{T}^{2} $$ (2) The $ \Delta {\lambda }_{C-SR} $ exhibits a linear relationship with temperature changes, with a slope of 2.2 pm/°C. The measured temperature can be obtained by
$$ T=\frac{\Delta {\lambda }_{C-SR}}{0.0022}+23 $$ (3) By substituting Eq. 3 into Eq. 1, we can obtain the value of $ \Delta {\lambda }_{SR,T} $. The strain induced resonant wavelength shift in SRW, $ \Delta {\lambda }_{SR,\varepsilon } $ can be expressed as:
$$ \Delta {\lambda }_{SR,\varepsilon }=\Delta {\lambda }_{SR}-\Delta {\lambda }_{SR,T} $$ (4) Then, the measured strain can be obtained by $ \Delta {\lambda }_{SR,\varepsilon } $/0.97.
-
To evaluate the performance of the HW grating-based monofiber sensor in temperature and strain discrimination, an experimental setup was used in which a constant strain and random temperature changes were applied to the sensor, as shown in Fig. 5a. The reference comparison was a conventional dual-fiber decoupling group, consisting of a bare SMF-FBG (FBG2) and a strain-isolated compensating SMF-FBG (FBG1) enclosed in a thin steel tube. The dual-fiber sensor was placed 1 mm away from the monofiber sensor. An active heater was positioned beneath them, and artificial movement was used to produce random temperature variations.
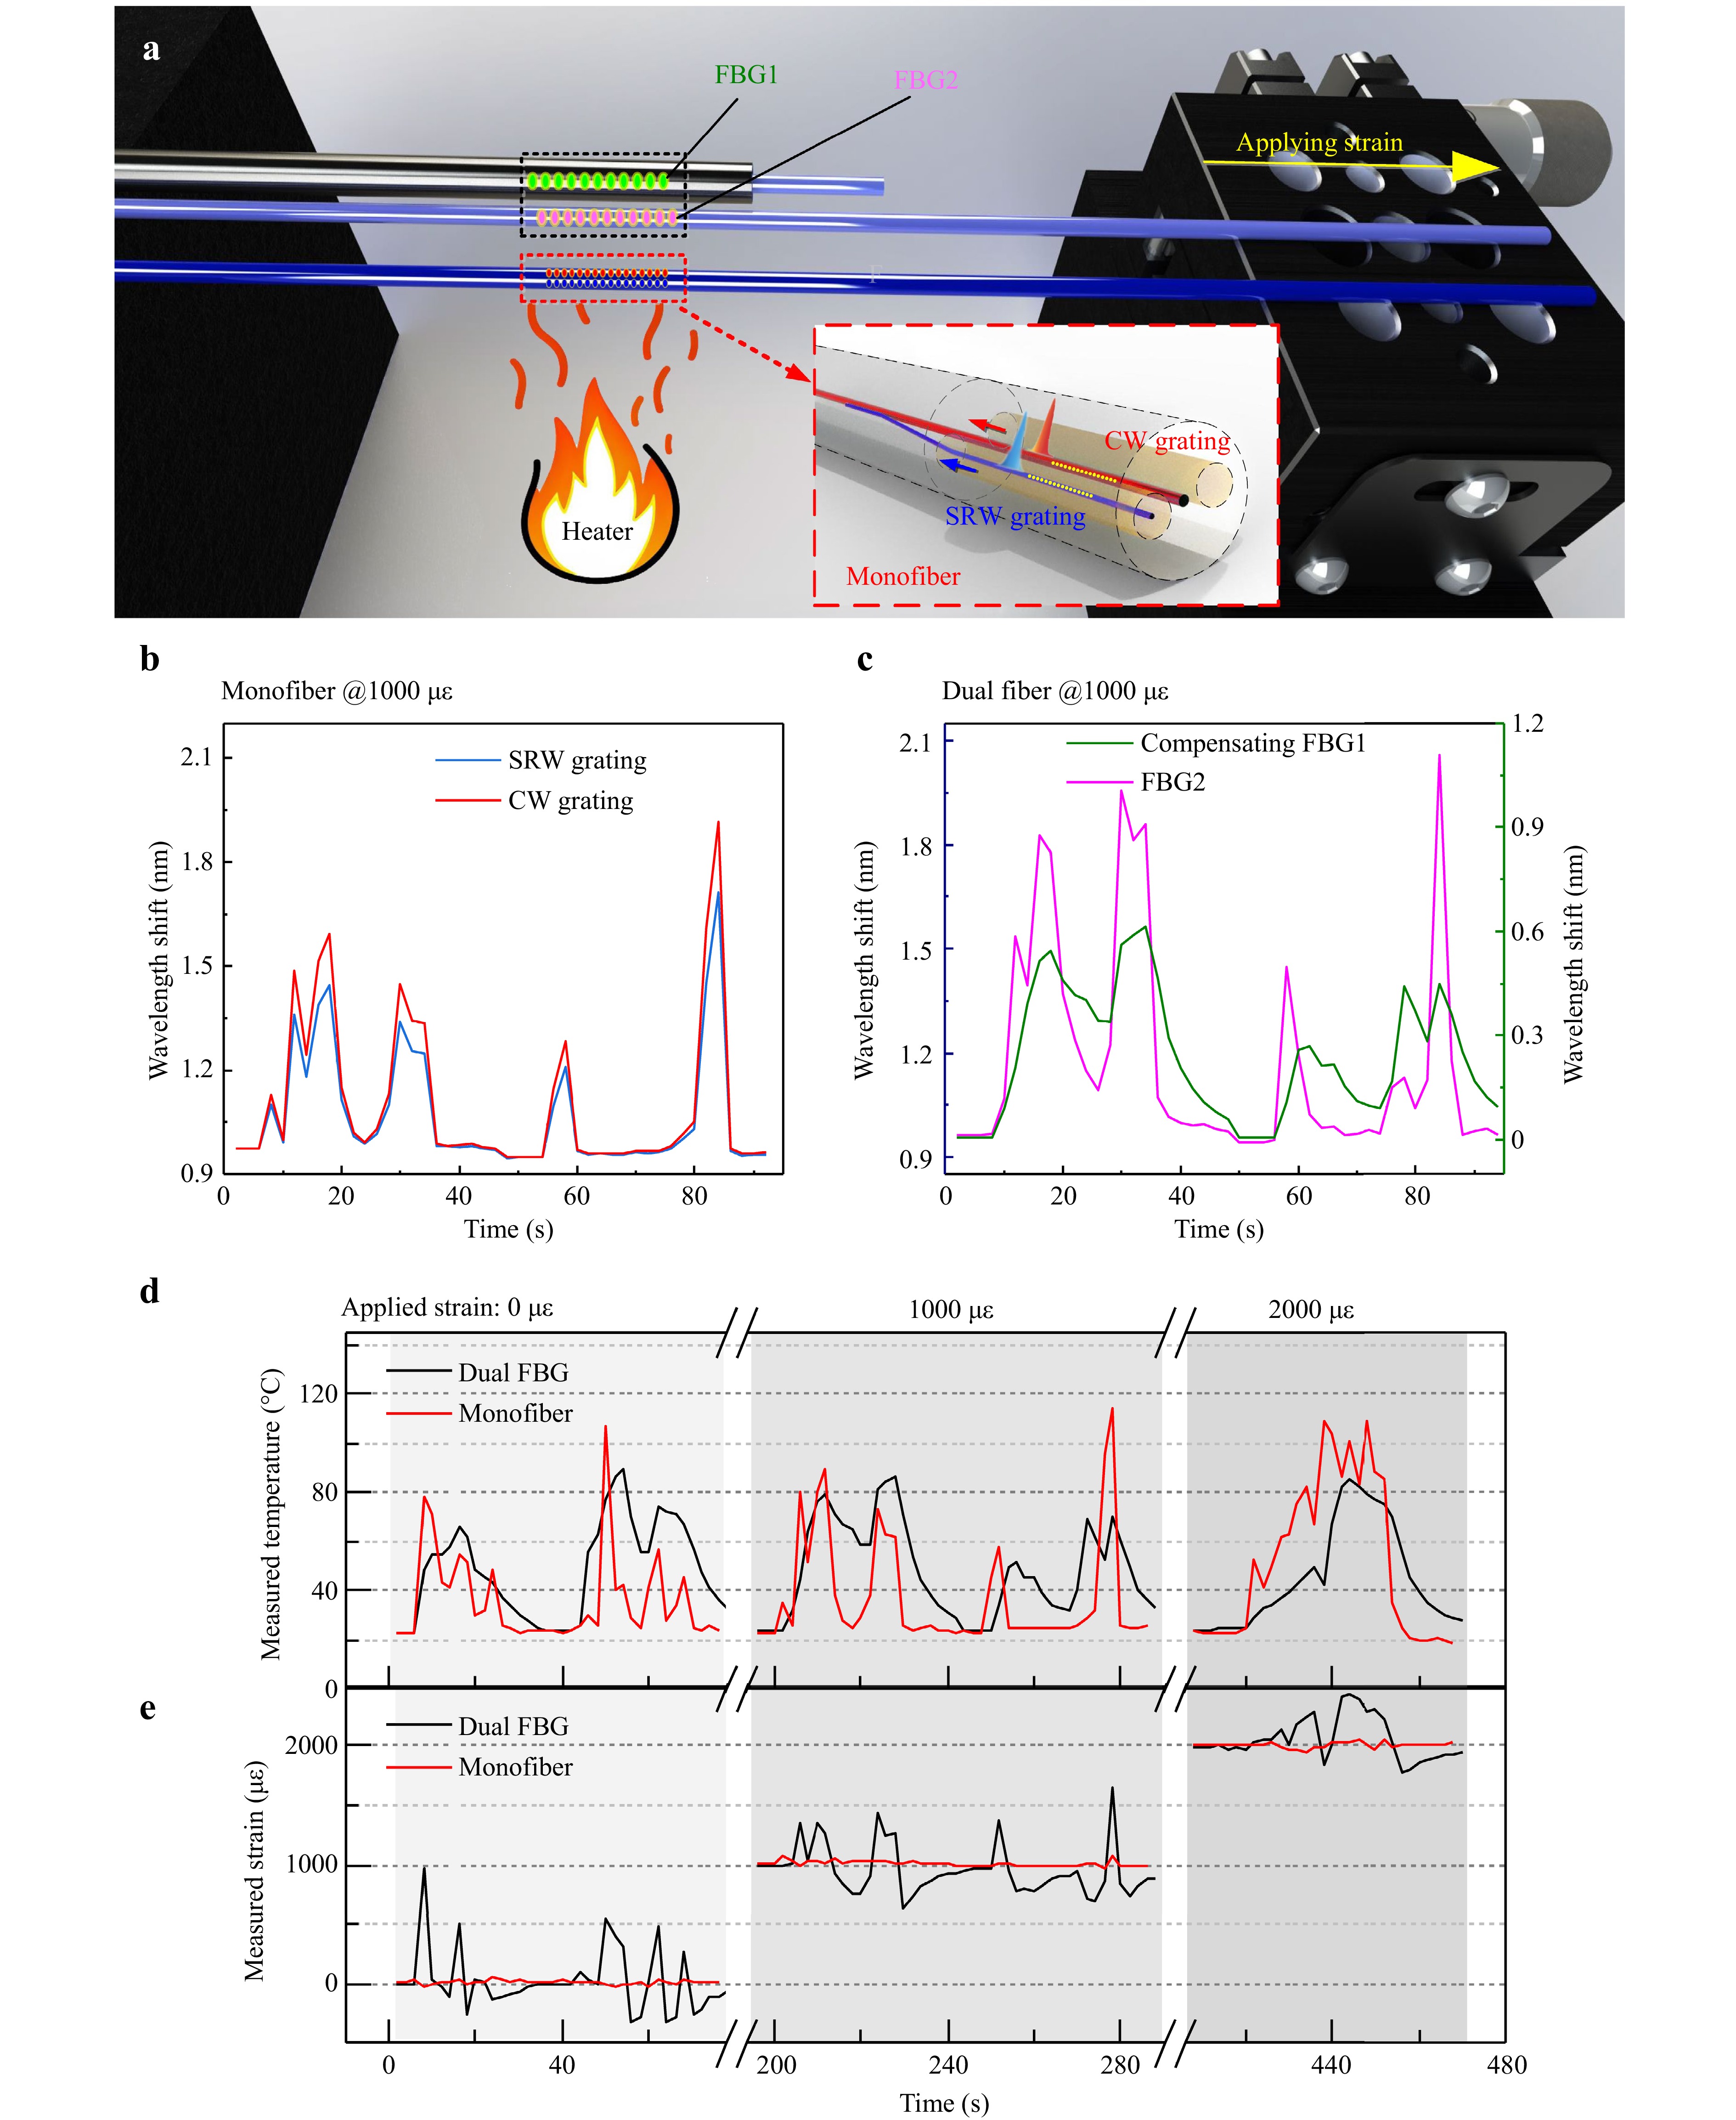
Fig. 5 Comparative test results. a Diagram a of dual-parameter test setup; b and c The resonant wavelength variations of monofiber sensor and dual fiber sensors during dynamic temperature changes at 1000 με. d and e Measured dynamic temperature and static strain by monofiber sensor and dual fiber sensors under different strains.
In the test, one end of both the monofiber sensor and the FBG2 of the dual-fiber group was fixed to a stationary stage, while the other end was attached to a translation stage that provided a constant strain. The compensating FBG1 was fixed at one end to eliminate the influence of strain. When the strain was set at 1000 με, the resonant wavelength shifts of the monofiber sensor and dual-fiber sensors, subjected to random temperature changes, were recorded in Fig. 5b, c, respectively. The resonant wavelength shifts of the monofiber sensor were consistent and proportional, whereas those of the dual-fiber sensor exhibited similar trends but lacked synchronisation.
The temperatures measured at different strains and recovered using the monofiber and dual-fiber methods are shown in Fig. 5d. The temperatures measured by the monofiber sensor showed greater temporal detail compared to those measured by the dual-fiber method. The strains measured at various temperatures and recovered using both methods are shown in Fig. 5e. The strains measured using the monofibre sensor exhibited smaller fluctuations. The high synchronisation of the strains measured by the monofiber sensor is attributed to the ultra-close distance (~28 μm) between the SRW and CW. Furthermore, the conventional dual fiber methods inevitably use rigid tubes to encapsulate the strain isolated FBG to prevent damage in FBG applications27. Although the steel tube has relatively faster heat transfer characteristics, it is still not satisfactory. The tube encapsulated FBG exhibits thermal response hysteresis, and is only applicable in static or quasi-static thermal environments.
Table 1 summarises the statistical data from the test for the proposed monofiber sensor and the conventional dual-fiber method. The proposed monofiber sensor demonstrated a strain measurement standard deviation (i.e., measurement accuracy) that was one order of magnitude smaller than that of the dual-fiber method under random temperature interference. These results clearly demonstrate the effectiveness of the HW grating-based monofiber sensor for achieving reliable temperature and strain discrimination. Further comparison with the previous reports can be found in the Table S1 of Supplementary Information28–35. The proposed monofiber sensor exhibit higher strain measurement accuracy and more compact size under dynamic temperature changes.
Method
Strain (με)★ monofiber (this work) Dual fiber Average Standard
deviation (±)Average Standard
deviation (±)0 13.7 18.5 23.0 265.7 1000 1011.2 21.5 956.2 215.2 2000 2006.8 23.3 2055.4 179.5 Table 1. Comparison of Sensors’ Performances
-
In conclusion, we proposed and demonstrated a monofiber sensor based on heterogeneous waveguide (HW) gratings for temperature and strain discrimination. The sensor comprised two HW gratings located in the stress rod and core within the same fiber. As the temperature increased from 23 °C to 275 °C, the gratings in the stress rod waveguide (SRW) and core waveguide (CW) exhibited redshifts of 2.38 nm and 2.88 nm, respectively. Their strain responses were similar, at approximately 0.97 pm/με. The distinct temperature responses of the two gratings enabled the device to effectively discriminate between temperature and strain. Compared to conventional dual-fiber compensation methods, the proposed monofiber sensor exhibited a strain measurement standard deviation that was an order of magnitude smaller under random temperature interference. The proposed monofiber sensor can operate at high temperatures (~290 °C) and demonstrates excellent strain measurement accuracy under dynamic temperature changes. Given its fabrication via non-standardized processes, which incur relatively high manufacturing costs, we suggest that its future deployment be prioritized for investigating rapid and dynamic scientific processes as well as high-end industrial applications. Examples include monitoring transient chemical processes and performing health monitoring on critical components of aircraft.
-
The fabrication setup included a femtosecond laser (Pharos; Light-conversion), an optical path system, a three-dimensional precision translation stage (XMS50, XMS100, VP-5Za; Newport), a computer control system, and an imaging system. The fs laser has a central wavelength of ~514 nm and a pulse width of ~290 fs. The 3 mm-diameter laser beam was focused using a 40× water-immersion objective (Nikon, NA = 0.8). During processing, the objective was immersed in oil to eliminate the cylindrical lens effect of the fiber. The spherical aberration caused by the RI mismatch of the objective lens helped achieve a looser focal region, resulting in a larger RI modulation area. Additionally, during waveguide preparation, the loose focus helped prevent random micro explosions caused by heat accumulation in the silica, which could otherwise interrupt the waveguide and impair light guidance36.
-
This work was supported by the National Natural Science Foundation of China (62135007 and 62405130), the Natural Science Foundation of Jiangsu Province (BK20243014), the Guangdong Basic and Applied Basic Research Foundation (2023B1515120011), the National Key R&D Program of China (2021YFA1401103), and the Innovation Program for Quantum Science and Engineering (2021ZD0300700). We also acknowledge support from the China Postdoctoral Science Foundation (2023M741619) and the Postdoctoral Fellowship Program of CPSF (GZC20231099).
Monofiber-based temperature and strain discrimination using heterogeneous waveguide Bragg gratings
- Light: Advanced Manufacturing , Article number: (2025)
- Received: 22 January 2025
- Revised: 03 September 2025
- Accepted: 18 September 2025 Published online: 27 November 2025
doi: https://doi.org/10.37188/lam.2025.077
Abstract: The identical responses of fiber Bragg grating (FBG) sensors to temperature and strain limit their practical applications. To address this challenge, we propose and demonstrate a monofiber sensor capable of discriminating between temperature and strain by leveraging the distinct thermo-optic properties of two heterogeneous waveguides. Specifically, a pair of waveguide Bragg gratings was inscribed in different sections of a panda polarisation-maintaining fiber (PMF) using spherical-aberration-assisted femtosecond (fs) laser fabrication. When subjected to temperature changes, the two Bragg resonance peaks exhibited distinct responses, whereas their strain responses remained consistent. Consequently, the monofiber sensor achieves discrimination without requiring additional isolated compensation. The proposed sensor demonstrates an order-of-magnitude improvement in strain measurement accuracy compared to conventional isolated temperature-compensation methods under dynamic temperature changes.
Research Summary
Monofiber Bragg grating sensor: discriminating strain and temperature
Conventional fiber Bragg grating sensors cannot easily separate the effects of strain and temperature, which limits their accuracy in real-world monitoring. Researchers at Nanjing University have developed a compact monofiber sensor that overcomes this challenge. The device integrates two waveguide Bragg gratings inside a single polarization-maintaining fiber—one in the core and one in the stress rod—fabricated using a femtosecond laser technique. Because these regions respond differently to heat but similarly to strain, the sensor can distinguish temperature from strain changes without relying on external compensation. Tests showed that the new design improved strain measurement accuracy by an order of magnitude compared with conventional dual-fiber approaches. The robust sensor also operates reliably up to about 290 °C, offering potential applications in aircraft health monitoring, battery safety, and other high-end industrial scenarios.
Rights and permissions
Open Access This article is licensed under a Creative Commons Attribution 4.0 International License, which permits use, sharing, adaptation, distribution and reproduction in any medium or format, as long as you give appropriate credit to the original author(s) and the source, provide a link to the Creative Commons license, and indicate if changes were made. The images or other third party material in this article are included in the article′s Creative Commons license, unless indicated otherwise in a credit line to the material. If material is not included in the article′s Creative Commons license and your intended use is not permitted by statutory regulation or exceeds the permitted use, you will need to obtain permission directly from the copyright holder. To view a copy of this license, visit http://creativecommons.org/licenses/by/4.0/.

 DownLoad: