


-
Freeform optics is an emerging solution for imaging and non-imaging optical system design. A notable trend is the increasing demand for the rapid prototyping of freeform optical systems for customized products. Unlike the ultra-precision optics applied in high-end specific projects1, freeform optics are becoming more relevant to everyday life than ever before, such as biomedical implants2, head-up display3, and illumination4. The sequential machining-testing chain decelerates the manufacturing process. Component datums are lost during unclamping and re-clamping operations when transferring components between machining and measurement machines5. Metrology challenges during the manufacturing process are restricting the broader adoption of freeform optics6,7. It requires multi-disciplinary expertise in design, fabrication, and testing8.
On-machine surface measurement (OMSM), which integrates measurement into the machining process, is a promising solution for performing manufacturing and measurement on single platform9. Currently, the issues of uncertainty and traceability obstruct the achievement of the goal6. High precision freeform measurement remains a significant challenge, even for well-established areal interferometry techniques, such as Fizeau and Twyman-Green interferometry10. The retrace error of areal interferometers can only be effectively reduced when an ideal null condition is achieved. However, that is difficult for freeform surface under test (SUT), as creating an ideal reference element is not always practical11. The solution lies either in utilizing a non-null system configuration with fine calibration, or in eliminating optical path different (OPD). The tilted wave interferometry (TWI) replaces physical nulling by employing multiple tilted wavefronts, a technique building upon Twyman-Green and Fizeau interferometry12. Limited by the measurement range and field of the view, sub-aperture stitching interferometry (SSI) is an engineering-preferred way to mitigate retrace error by measuring multiple sub-apertures of the surface, applying an optimized measurement pose that ensures low OPD in each field of view.
Concerns regarding the stability of on-machine metrology systems were initially highlighted a stitching interferometer system deployed on an ultra-precision polishing machine13. In other similar systems, a significant disparity in measurement accuracy persists between on-machine and off-machine measurement. The vibration of the host machine induces artifacts, with amplitudes up to 12.7 nm for a scanning white light interferometer (SWLI), in the cabin of an ultra-precision diamond turning machine14. The resonance of the fixture induces measurement errors of up to 500 nm under continuous scan15. The overall uncertainty with fine alignment and calibration is 0.3 µm16, which is much greater than the offline metrology systems. These observations indicate that on-machine dynamic factors significantly compromise the reliability of surface evaluation performed during the manufacturing process. A top-down revisit of the metrology system design is needed to facilitate improvements in the performance of the on-machine measurement system.
Currently, non-contact on-machine surface measurement is implemented using two primary methods: SSI and point scanning. The relative position between the SUT and the areal interferometer need to be adjusted in full 6 degree of freedom (DOF). Due to the heavy and sensitive interferometry module, the kinematic decoupling is preferably achieved by actuating the SUT about $ \psi $ axis to fulfil an optimized pose, as shown by Fig. 1a. The QED SSI system adopts this configuration for aspherical and freeform optics measurement17. The areal SSI type on-machine interferometry system has been implemented on a polishing machine with 8 DOF13,18. The servo system is specially tuned to be over-damped, so that the oscillation of the working table can be reduced13. This common configuration of an OMSM system is N+S layout, where N represents the number of controllable motion axis of the host platform, and S is the sensor unit. For manufacturing platforms with fewer DOF (i.e., N = 2~5 for most diamond turning machines), integrating an area interferometer is significantly restricted, and sometimes impossible. The miniaturisation of the optical sensors brought the possibility using a compact probe to scan the surface actively19. As shown in Fig. 1b, the SUT is rotated about a single axis C at a constant speed. The probe is actuated about T axis. The high-precision point probing based instruments like LUPHOScan20 and NANOMEFOS21 adopts an actuated sensor head with real time position feedback. A growing number of on-machine systems have adopted the point aperture stitching methods on ultra-precision machines22,23.
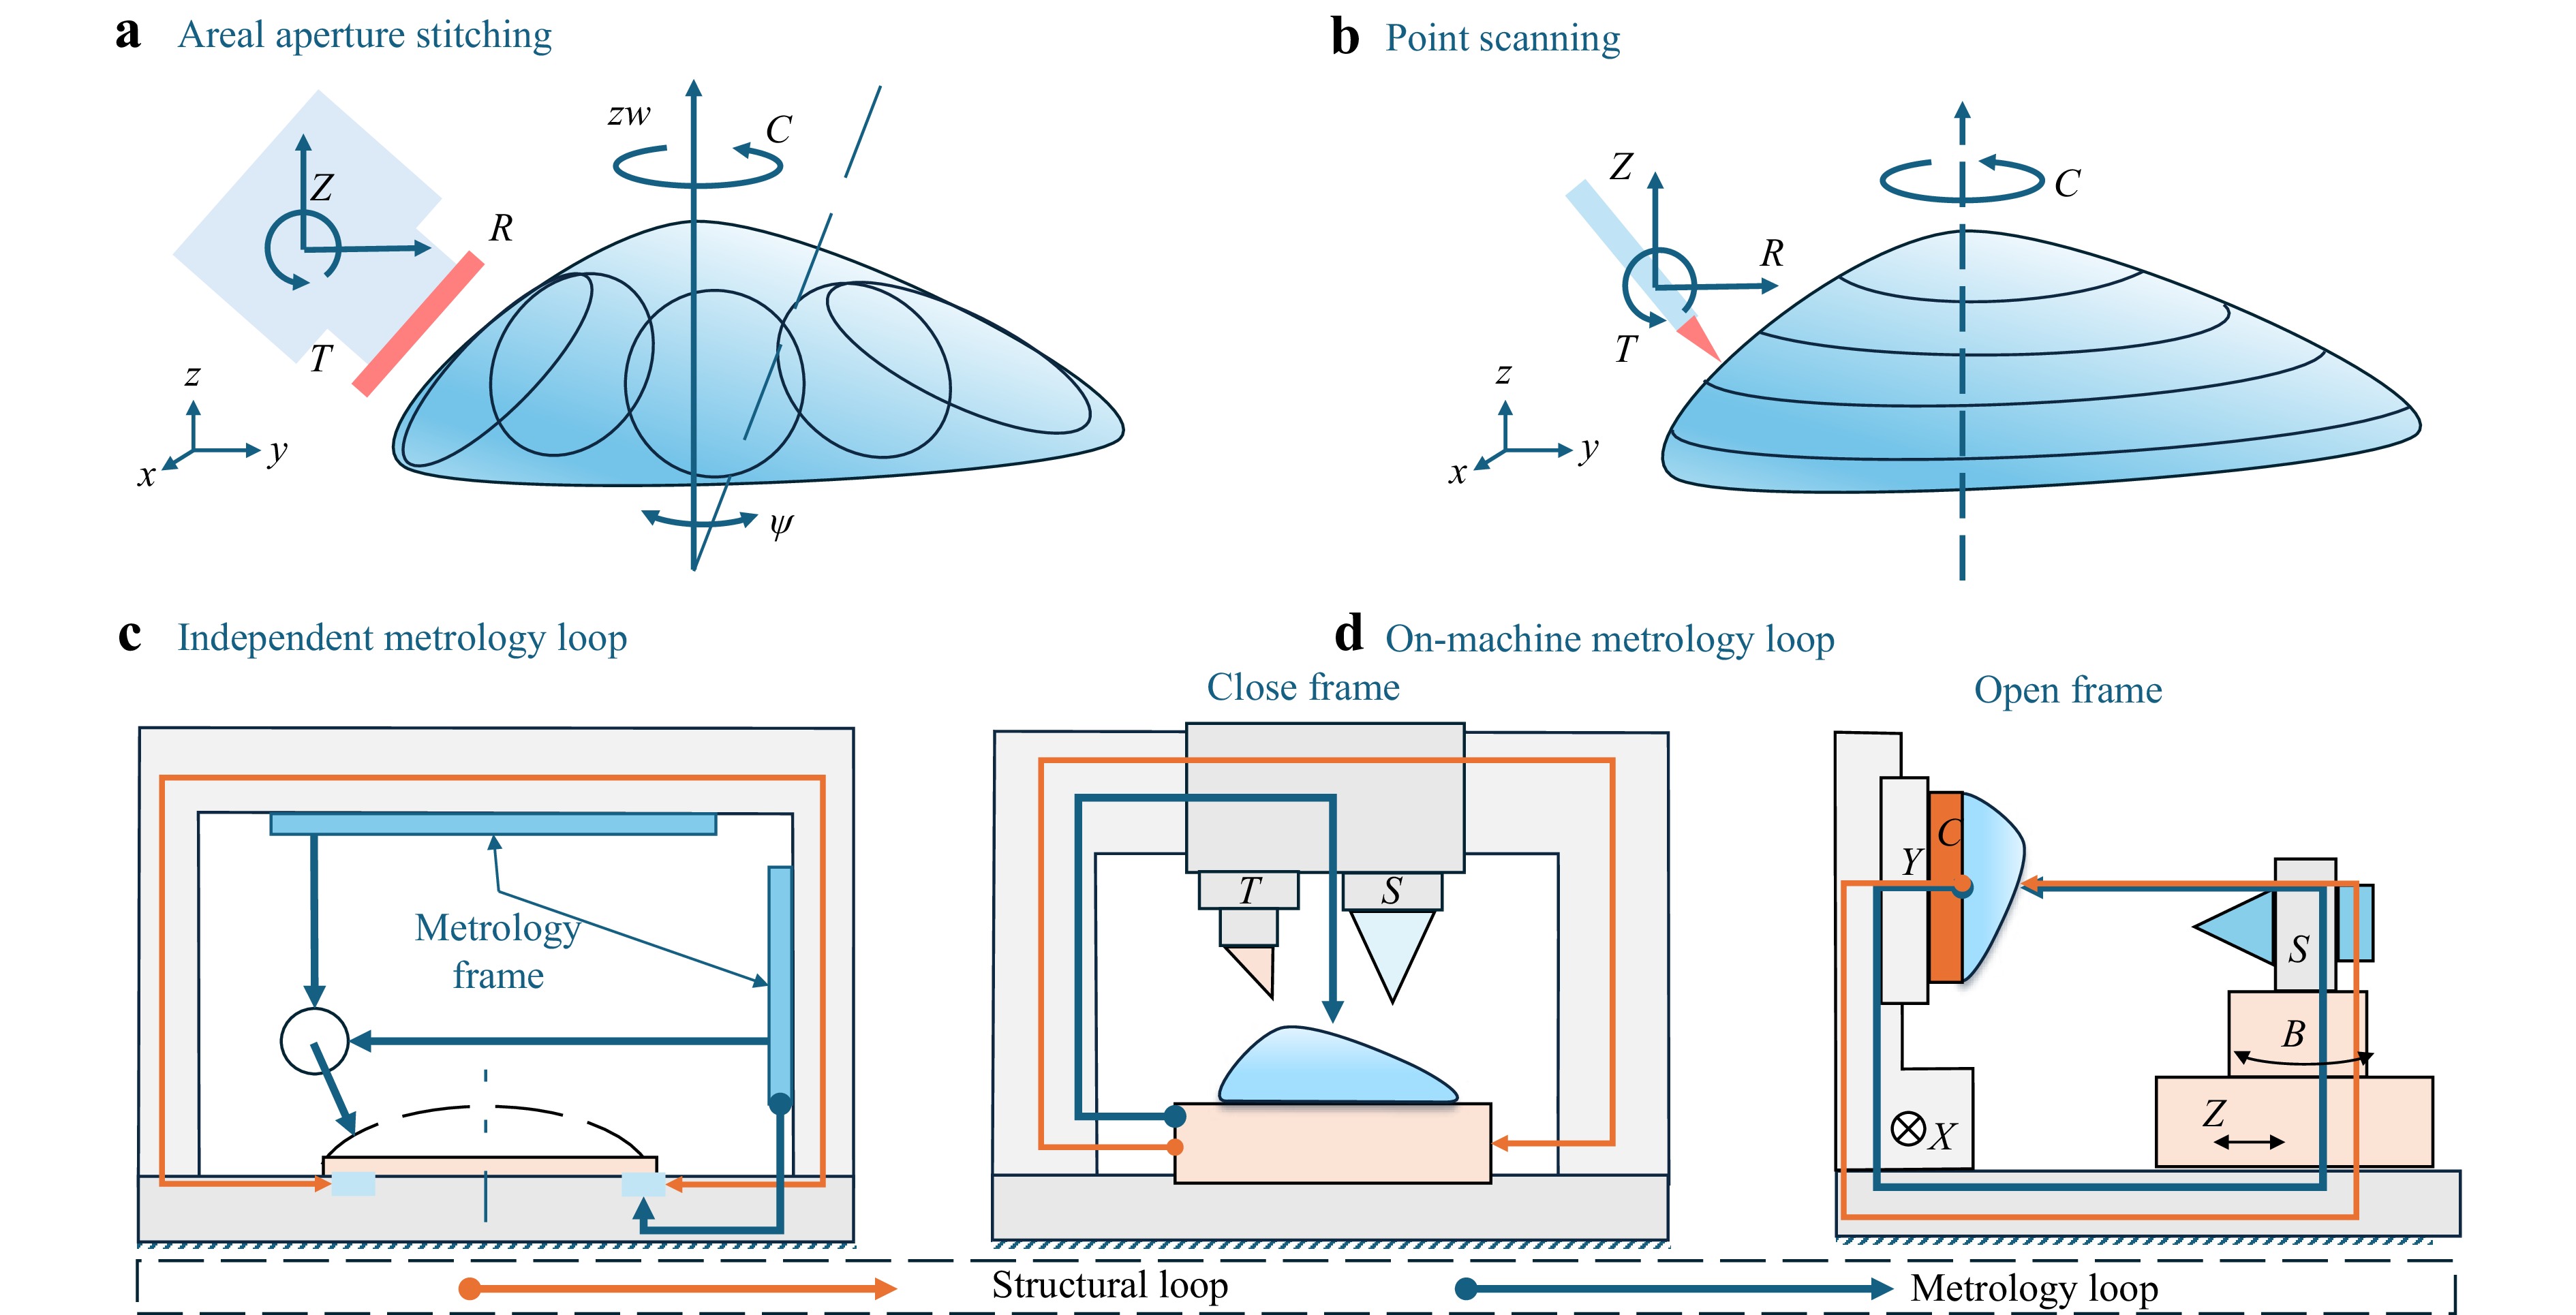
Fig. 1 Coordinate configuration of freeform measurement machine. a SSI. b point scanning. c Machine coordination configuration of the independent metrology loop. d Machine coordination configuration of on-machine metrology loop.
A diagram of the metrology frame of ultra-precision freeform measurement machines21,24,25 is shown by Fig. 1c. The pivot point of the probe is referred to the metrology frame. The axial and radial position of the spindle are also measured in real time. The metrology loop of the system is independent with the structural loop, which ensures that the motion disturbance of the axis is excluded from the measurement results. In contrast, as shown by Fig. 1d, the on-machine metrology loop is coupled with the structural loop26. For both close-frame and the open-frame machines, the issue of the coupling between metrology loop and structural loops exists. Motion disturbance-induced error on the axis deteriorates accuracy13,15. The existing OMSM system calibration methods follow the similar way of lathe, where the volumetric error is reduced effectively27–29. In the measurement process, the axis motion speed is higher than that in the machining process. Thus, the dynamic calibration methods for machine tools are not applicable to the OMSM system.
Efforts have been made to address the issue of the precision positioning without an independent metrology frame. For instance, direct tracking the end effector position with an auxiliary laser tracker30, estimating the accurate the position of end effector position observing acceleration31. In existing on-machine deployed systems, precise positioning of optical sensors with real time feedback is still not available6. No standard calibration of the dynamic error for the OMSM is available as far as we can reach. Eliminating dynamic errors is the last mile toward high-speed high precision on-machine evaluation of freeform surfaces. The scope of the work is to establish a novel dynamic error calibration method by system modelling and identification.
-
The measurement system integrates a chromatic confocal sensor with machine axis, which enlarges measurement range of the sensor. It utilizes a “measurement-on-the-fly” strategy, capturing the positions of the machine axis and the chromatic sensor’s readings in real time32. The position of the chromatic confocal sensor’s best focus point relative to the workpiece is determined by the metrology loop (SUT →C→Y→X→Base→Z→B→S), as shown in Fig. 2a. This loop consists of two primary segments: the workpiece side (SUT→Base) and the tool/sensor side (Base→S). The system possesses a fully coupled metrology and structure loops. A detailed kinematic analysis of a similar system can be found in the previous work27. In the process of measuring a freeform surface with mild curvature, the X and C axes feed at a constant rate, while the Z-axis follows a free trajectory. The collaborative motion of the machine axis and the probe coordinates is facilitated by the machine’s embedded controller, and signal acquisition is performed in real time32.
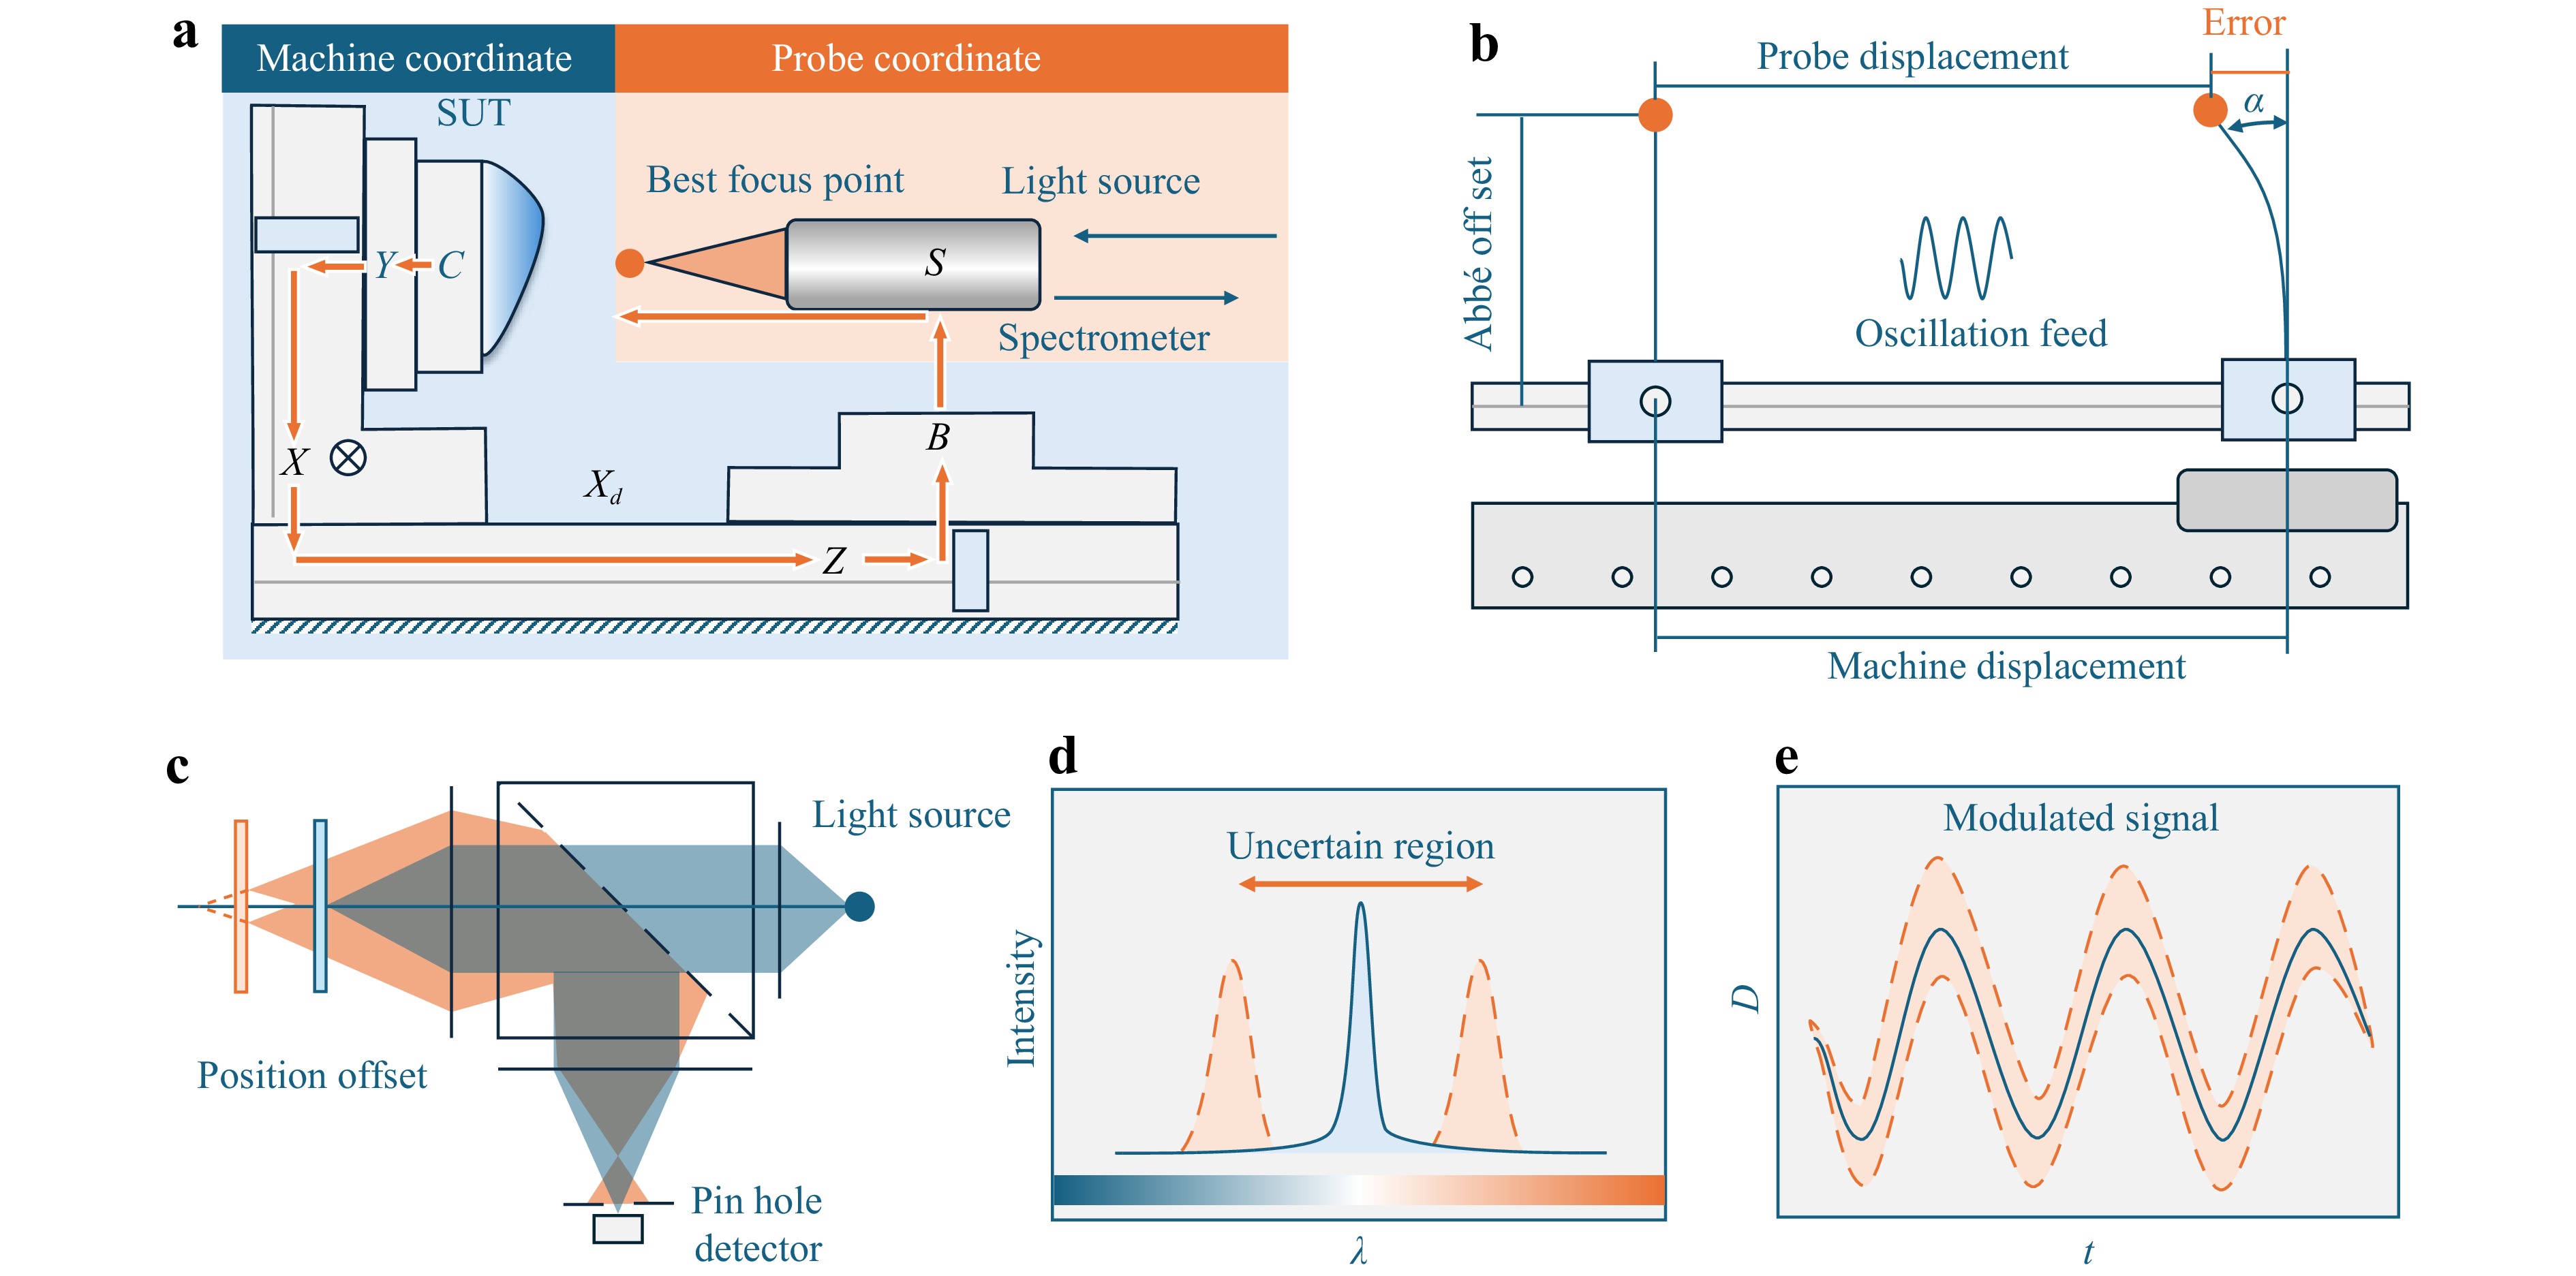
Fig. 2 Diagram of the measurement principle and the dynamic error source. a The kinematic chain of the OMSM. b The diagram of the dynamic error source with probe-on-carriage model. c The working principle of the chromatic confocal sensor. d The spectrum with dynamic error induced uncertain region. e The measured distance D with dynamic error.
The measurement accuracy of the system is intrinsically limited by the Abbe error. A simplified schematic of the dynamic factor induced measurement error with a probe-on-carriage model is shown by Fig. 2b. The Abbe error originates from the offset distance between the axis of the grating encoder and the probe’s optical axis. Ideally, the probe’s best focus point perfectly follows the carriage displacement. However, a discrepancy between them arises when a machine axis moves along a free path with varied velocity. Any angular deviations (α) and offset (dx) of the probe during stage translation, exacerbated by the Abbe offset (L), introduce an error (E) in the measured displacement, quantitatively approximated by E ≈ L·α + dx, where we assume α is far smaller than 1 rad. The working principle of the chromatic confocal sensor is shown by Fig. 2c. The SUT is scanned with an Archimedes spiral path by synchronised motion between the linear axis and the spindle33. The relative offset between the SUT and the best focus point cause dispersion, and the detector behind the pin hole captures the reflected confocal light. The offset causes an uncertain region on the spectrogram of the signal. Correspondingly, the measurement result contains a distortion on the surface height. The distortion of the metrology loop caused by disturbances is directly added to the measured results, which is referred to as the dynamic error in this work.
-
Several preliminaries are established as follows before the detailed theoretical derivations. As the Z axis slide move in free path tracking motion with varied speed, the tool/sensor side (Base→S) is the main focus of the calibration. Key assumptions include that the angular displacements of the sensor pivot are minimal and that the spindle motion is maintained at a low frequency (e.g., < 120 rpm), ensuring that all significant motion harmonics remain within the working bandwidth of the servo system (< 50 Hz). Within this constrained domain, the system’s dynamic response is assumed to be linear, while minor error sources such as friction, hysteresis, and linear motor servo jitter are considered negligible.
The surface height $ \delta h $ within the time interval $ \mathrm{\Delta }t $ is determined by:
$$ \delta h={X}_{O}\left(t+\mathrm{\Delta }t\right)-{X}_{O}\left(t\right) $$ (1) where $ {X}_{O} $ is the summation of the grating encoder results and the chromatic confocal results by:
$$ {X}_{O}\left(t\right)={X}_{c}\left(t\right)+{X}_{d}\left(t\right) $$ (2) where $ {X}_{c}\left(t\right) $ is the chromatic confocal sensor reading, and the $ {X}_{d}\left(t\right) $ is the grating encoder displacement. The effect of the dynamic factors on the measurement results is expressed as:
$$ {X}_{O}\left(t\right)=H\left({X}_{d}\left(t\right)\right)+{X}_{c}\left(t\right) $$ (3) where $ H\left(\cdot \right) $ is the system dynamic response in time domain. The working distance of the chromatic confocal sensor is 1.4 mm. The static beam axis alignment error is calibrated in advance.
The control box model of the measurement system is shown in Fig. 3. The long-range measurement loop is driven by a feed command $ {X}_{f} $. A cascaded short measurement loop is affected by $ {G}_{m}\left(s\right) $ in frequency domain.
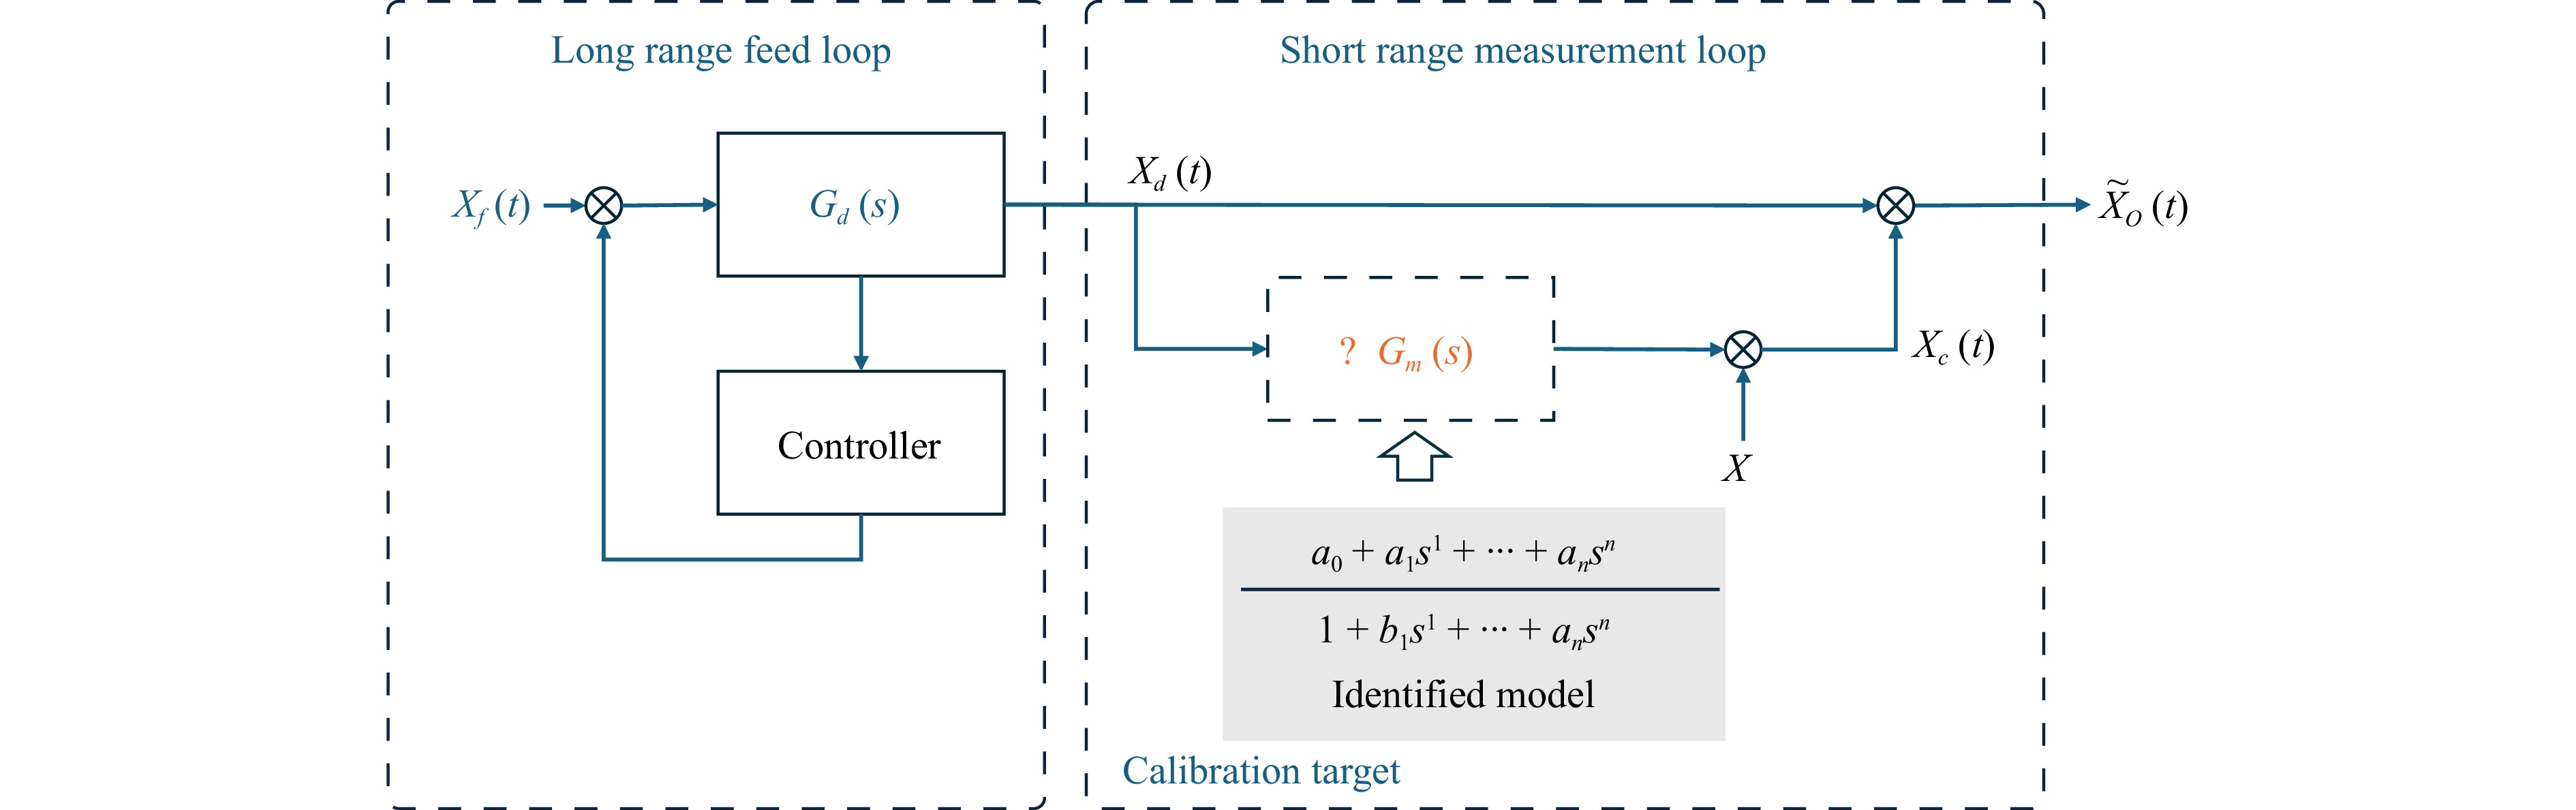
Fig. 3 System diagram of OMSM measurement process with a calibration model.
The system is based on a Moore Nanotech 650 FGV2 ultra-precision diamond turning machine with 5 controllable axes. The structure loop and the metrology loop are highlighted in Fig. 4a. A Precitech CHRocodile chromatic confocal sensor with 100 µm measurement range and 10 nm axial resolution is applied for short range measurement. The long-range measurement is performed by the holographic grating linear encoder inside the linear axis, which has 0.4 nm resolution. The surface measurement recorded is a continuous streaming dataset with 6 channels, i.e. the chromatic confocal sensor measured distance, C axis absolute angle, and real time positions of X-Y-Z-B axis. The data are collected with an in-house developed controller HUD-CNCV2. The signal acquisition process is triggered by the controller at a frequency of 1 kHz , and a diagram of the signal chain is shown in Fig. 4b.
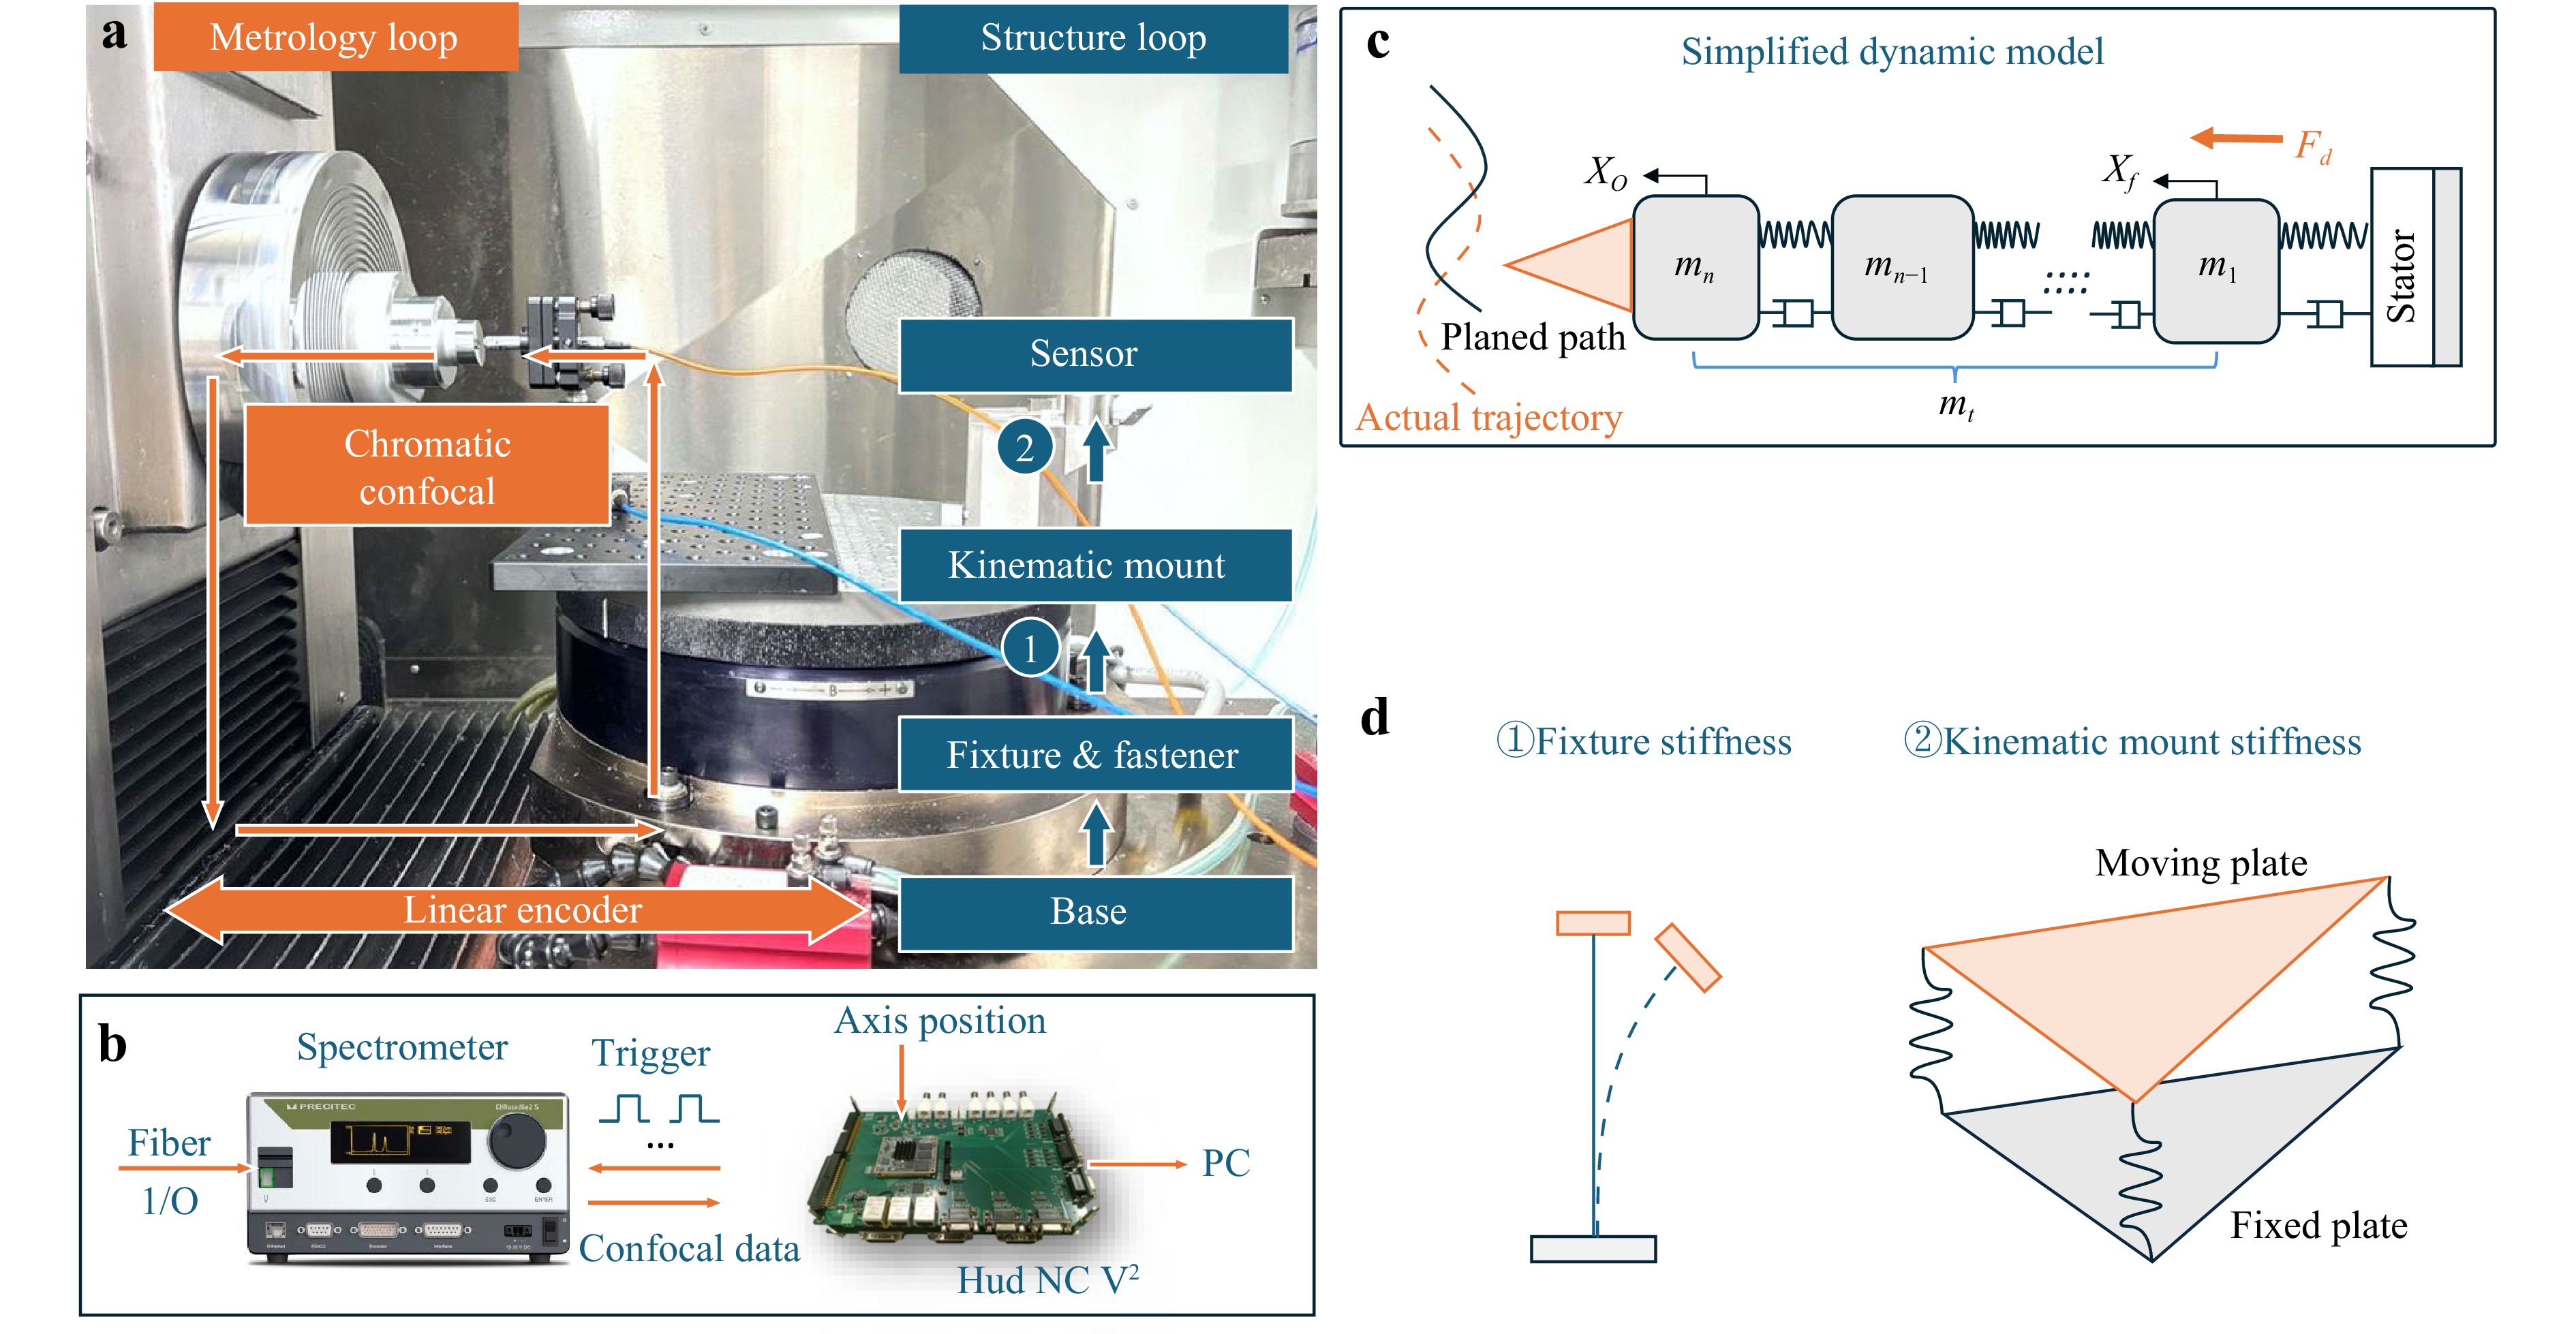
Fig. 4 Schematic of OMSM system. a The system configuration of 5+S OMSM on a Moore Nanotech 650 FG v2 diamond turning machine. b The data acquisition and signal processing chain. c The multi-body dynamic model of the system. d Flexible nodes of the structure loop.
The structure loop started from the machine base and ended to the sensor pivot point. A kinematic mount is used for fine adjustment of the yaw angle of the chromatic confocal sensor. The system can be simplified as a multi-body dynamic system with distributed mass, spring, and damping components34, as shown in Fig. 4c. The flexible nodes of the structure loop are the fixture and the kinematic mount, which are shown by Fig. 4d. In this work, the model is simplified by combining the contributions of all flexible nodes and regarding the result as a system with uncertain degrees of freedom (x-DOF). The machine base is regarded as an ideal rigid stator with infinite mass, the mass of table is represented as $ {m}_{t} $, which is the total mass of the stage. The best focus point of the confocal sensor is ideally attached to $ {m}_{n} $, the end of the mechanical loop. The elements of mechanical components {$ {m}_{1},{m}_{2},\dots ,{m}_{n}\} $ connected by springs and dampers denoted by {$ {k}_{1} $, $ {k}_{2} $, …, $ {k}_{n} $} and {$ {c}_{1} $, $ {c}_{2} $, …, $ {c}_{n} $} respectively.
Under the given actual feed position $ {X}_{d} $, the system output $ \stackrel{~}{{X}_{O}} $ considering the dynamic error is:
$$ \widetilde{{X}_{O}}={X}_{d}\left(s\right)+{X}_{c}\left(s\right)+{E}_{\mathrm{d}\mathrm{y}\mathrm{n}} $$ (4) $$ {E}_{\mathrm{d}\mathrm{y}\mathrm{n}}\left(s\right)=(1-{G}_{m}(s\left)\right){X}_{d}\left(s\right) $$ (5) The relation between the feed command and the sensor response is:
$$ G\left(s\right)=\frac{{X}_{d}\left(s\right)}{{X}_{O}\left(s\right)}=\frac{1}{{m}_{t}{s}^{2}}+\frac{1}{{m}_{t}}\sum _{i=2}^{N}\frac{{\alpha }_{i}}{{s}^{2}+2{\overline{\xi }}_{i}{\omega }_{i}+{\overline{\omega }}_{i}^{2}} $$ (6) where $ {m}_{t}=\sum _{i=2}^{N}{m}_{i} $ is the total mass on the table. $ N $ is the number of distinct mass blocks, here used to denote the modes count. $ {\xi }_{i} $ and $ {\omega }_{i} $ are the associated damping ratio and natural frequency of the ith mode, and $ \overline{{\alpha }_{i}} $ is determined according to the eigenmode. The resonance frequencies of each component are unknown and therefor needed to be identified by system identification. A general simplification on such systems using a non/collocated double mass spring damper model is shown by Fig. 5a, b. The actual position of the focus point is unknown, which is a non-collocated configuration. The order of the system is retrieved on-machine with singular value decomposition from the in-out data in a measurement35,36.
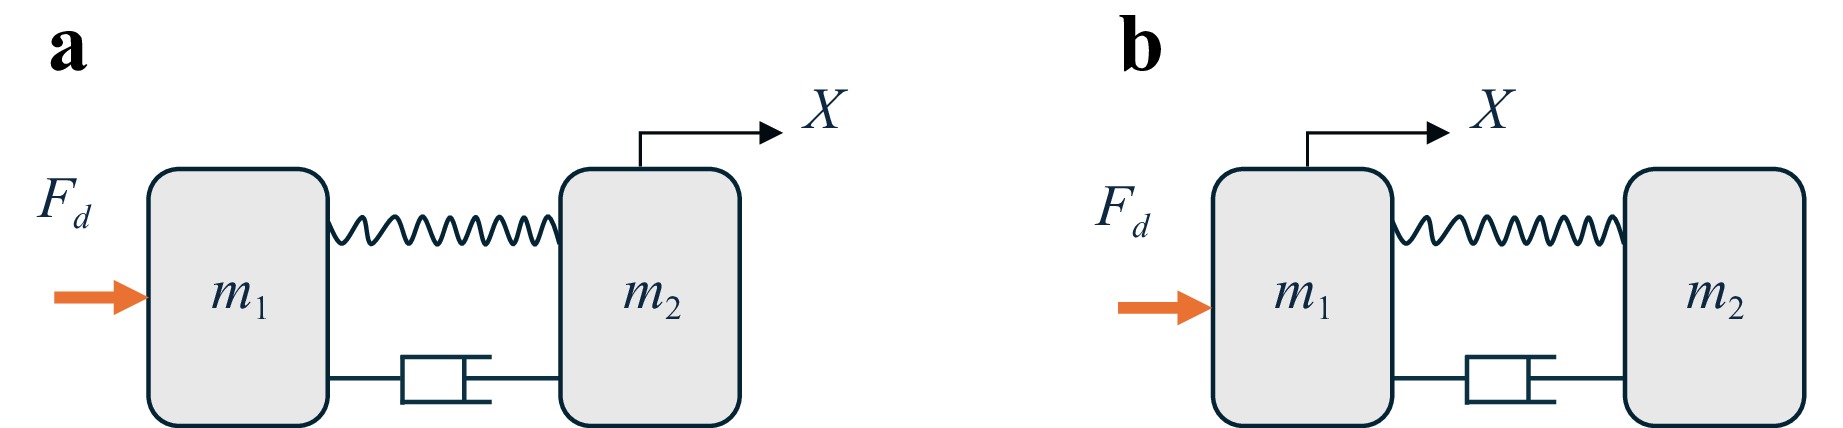
Fig. 5 Double mass block model. a Collocation model. b Non-collocated model.
In the case that sensor and the end motor are exactly coincide, the response of the subsystem can be described by the non-collocated model:
$$ {G}_{d}\left(s\right)=\frac{{c}_{2}s+{k}_{2}}{{a}_{4}{s}^{4}+{a}_{3}{s}^{3}+{a}_{2}{s}^{2}+{a}_{1}s+{a}_{0}} $$ (7) Where $ {a}_{4}={m}_{1}{m}_{2},{a}_{3}=\left({m}_{1}+{m}_{2}\right){c}_{2}+{m}_{2}{c}_{1},{a}_{2}=({m}_{1}+ {m}_{2}) {k}_{2}+ {m}_{2}{k}_{1}+ {c}_{2}{c}_{1}, {a}_{1}=\left({k}_{1}+{k}_{2}\right){c}_{1} $, and $ {a}_{0}={k}_{1}{k}_{2} $. The flexible modes can be given as:
$$ {G}_{m}\left(s\right)=\sum _{i=2}^{N}\frac{{\alpha }_{i}/{m}_{i}}{{s}^{2}+2{\overline{\xi }}_{i}{\omega }_{i}+{\overline{\omega }}_{i}^{2}} $$ (8) Combing the equation above, the total transfer function of the system is:
$$ G\left(s\right)={G}_{d}\left(s\right){G}_{m}\left(s\right) $$ (9) -
System identification is performed to determine the dynamic response of the integrated measurement unit. The calibration configuration, shown in Fig. 6a, consists of the chromatic confocal sensor focused on a plano mirror (Opt target) and a reference sensor pointed at a fixed metal mirror (Cap target). The reference sensor is a Lion Precision CPL190 capacitive displacement sensor with a 250 µm measuring range, 80 mV/µm sensitivity, and a 10 kHz bandwidth. To monitor high-frequency vibration of the stage, a PCB-356A17 triaxial accelerometer with a sensitivity of 500 mV/g (51 mV/m/s2) is also utilized. The numerical control system generates profile consisting of 10 incremental and 10 decremental steps of 10 µm for each.
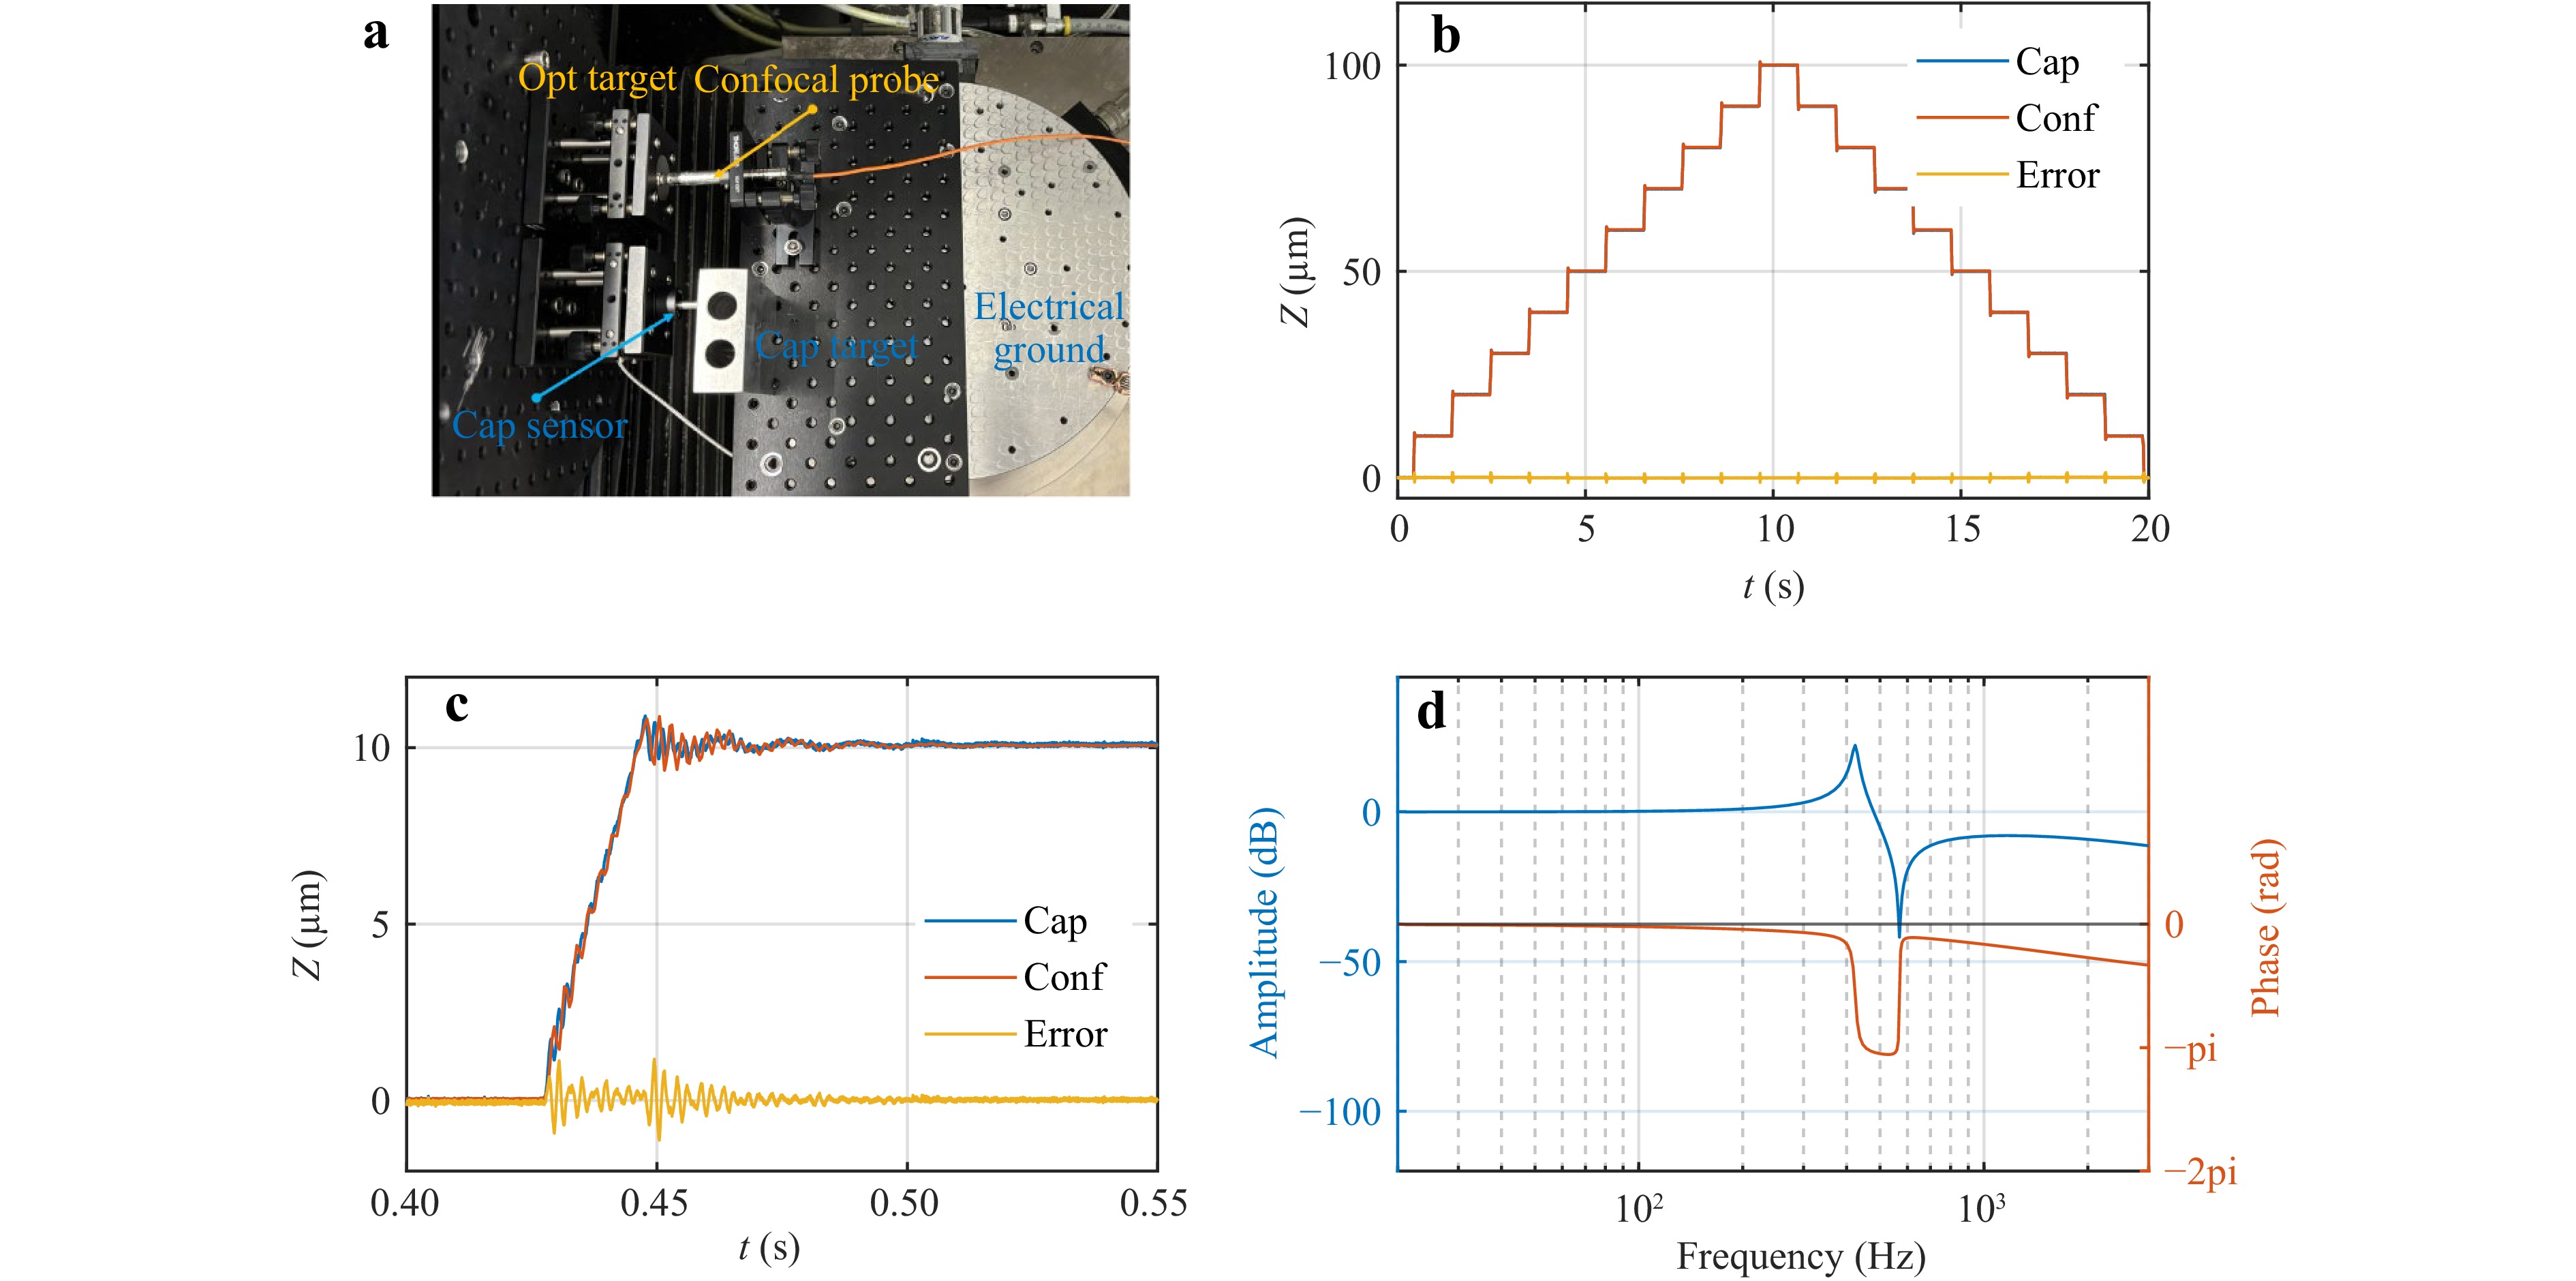
Fig. 6 System identification with confocal displacement. a System setup with precise displacement measurement with capacitive distance sensor. b Measured displacement on the sensors. c Zoomed view of the displacement of the single edge, Error=Conf-Cap. d Frequency response of the identified system transfer function.
The resulting displacement of the chromatic probe in response to this input motion is shown in Fig. 6b. The band width of the typical slow tool servo system is 50 Hz. The positioning error at the driving direction is 1.78% of the amplitude under 1 Hz oscillation in a similar system37. The dynamic error correction is implemented on the system with an identified transmission relationship $ {G}_{m}\left(s\right) $ of the metrology loop:
$$ \widetilde{{X}_{O}}\left(s\right)={G}_{m}\left(s\right){X}_{d}\left(s\right)+{X}_{c}\left(s\right) $$ (10) where $ {X}_{c}\left(s\right) $ is the distance measured by the chromatic confocal sensor, and $ {G}_{m}\left(s\right) $ is the transfer function representing the dynamics of the OMSM system in frequency domain:
$$ {G}_{m}\left(s\right)=\frac{{a}_{0}+{a}_{1}{s}^{1}+\dots +{a}_{n}{s}^{n}}{1+{b}_{1}{s}^{1}+\dots +{b}_{n}{s}^{n}} $$ (11) The identified $ {G}_{m}\left(s\right) $ is given by:
$$ {G}_{m}\left(s\right)=\frac{1.29\times {10}^{5}{s}^{2}-3.07\times {10}^{8}s+1.26\times {10}^{12}}{{s}^{3}+5.17\times {10}^{4}{s}^{2}+1.22\times {10}^{8}+1.27\times {10}^{12}} $$ (12) The corrected $ k $th data point in time series data can be solved recursively by arithmetic operations:
$$\begin{split} {x}_{o}\left[k\right]=\;&{a}_{0}x\left[k\right]+\dots +{a}_{n}x\left[k-n\right]-{b}_{1}{x}_{o}\left[k-1\right]-\dots \\&-{b}_{n}{x}_{o}\left[k-n\right]+{x}_{c}\left(k\right) \end{split}$$ (13) The overall deviation between the confocal sensor displacement and the working table displacement is within 0.15 µm when system is stabilized. The effect of the feed disturbance is shown in Fig. 6c. The measurement error near the feed edge is greater than 2.29 µm. The test result indicates that, under the circumstance of fast feed motion, the dynamic positioning accuracy of the probe is 15 times worse than under the static positioning status. The dynamic response in the frequency domain is shown by Fig. 6d. The resonance mode of the system is $ {\omega }_{c} $, which is about 338 Hz in this case. For the frequency greater the $ {\omega }_{c} $, the motion of the stage and the sensor will deviate. From the identified features of the characterization of the system the error caused by phase lag and amplitude error can be eliminated deterministically.
-
For validation, an off-axis parabolic mirror was used as SUT. The measurement results were then compared with those from a commercial instrument, the LUPHOScan 50SL (Taylor Hobson Ltd., UK). The SUT featuring reflective angle of 90°, a diameter of 25.4 mm and an effective focal length (EFL) of 50.8 mm. The system set up is shown by Fig. 7a. The normal vector of the best fit plane of the SUT is aligned with the optical axis of the chromatic confocal sensor. The spindle speed is 30 rpm, the corresponding fundamental frequency $ {\omega }_{0} $ is 0.5 Hz. The lateral spacing of the scan path is 0.1 mm/rev. The scan path and its corresponding frequency spectrum are shown in Fig. 7b c, respectively. The path contains up to the third order harmonics of the system’s fundamental frequency. A detailed view of the axis displacement and the corresponding dynamic error is shown in Fig. 7d. The amplitude of the predicted error correlates with the amplitude of the axis displacement over a 25-second time window. Both the axis displacement and the sensor response are smooth in the time domain, and a closer inspection of Fig. 7e confirms that no significant jitter is observed.
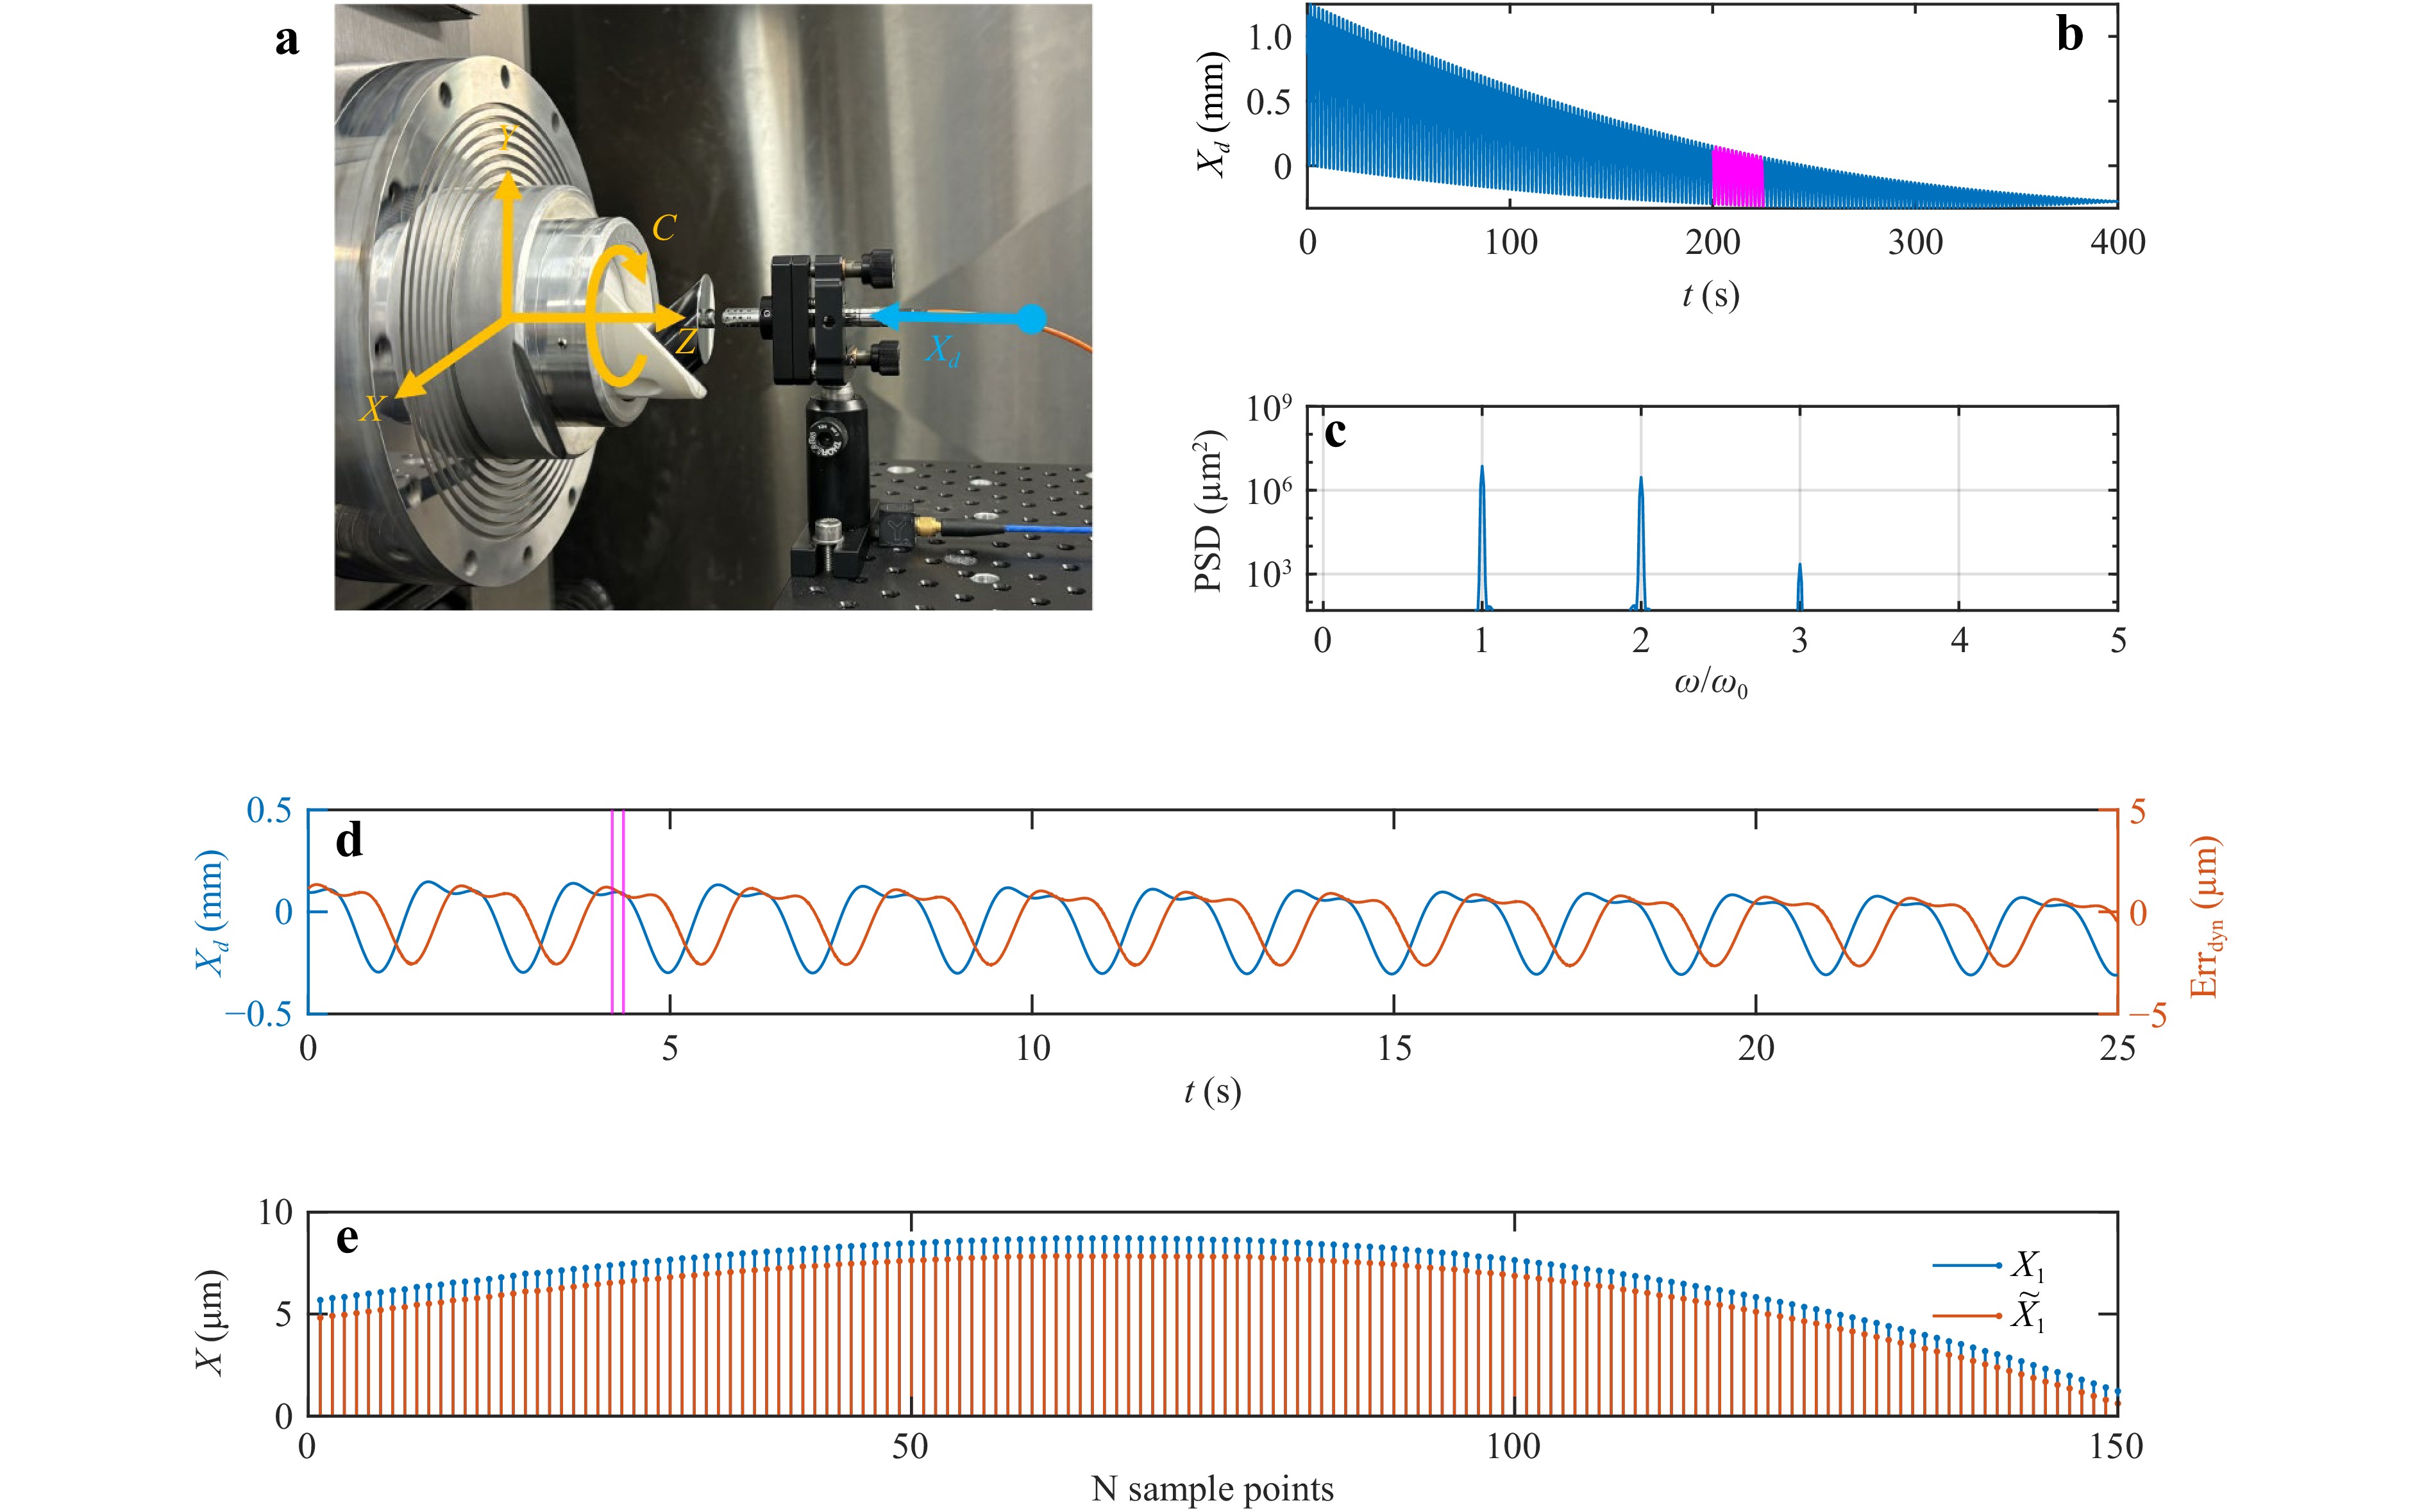
Fig. 7 Calibration of the temporal series profile of OMSM measured data. a Measurement set up. b Z linear drive position from grating encoder as the input of the calibration process. c PSD of the linear motion stage feed path. d The highlighted section in subfigure b, with the corresponding dynamic error predicted by the calibration model presented by Eq. 1. e A comparison of the calibrated profile $ \overline{{X}_{1}} $ and the original profile $ {X}_{1} $ in 150 points between the two vertical lines in subfigure d.
The on-machine and off-line measurement result are depicted in Fig. 8. Initially, the uncalibrated on-machine measured surface exhibited significant form error, with a peak-to-valley (PV) deviation of approximately 6 µm, primarily caused by dynamic disturbances during scanning. By extracting and applying the dynamic error map for compensation, the corrected form demonstrated substantial improvement. The deviations along the X, Y, and radial (R) profiles were effectively reduced to within 0.5 µm after calibration.
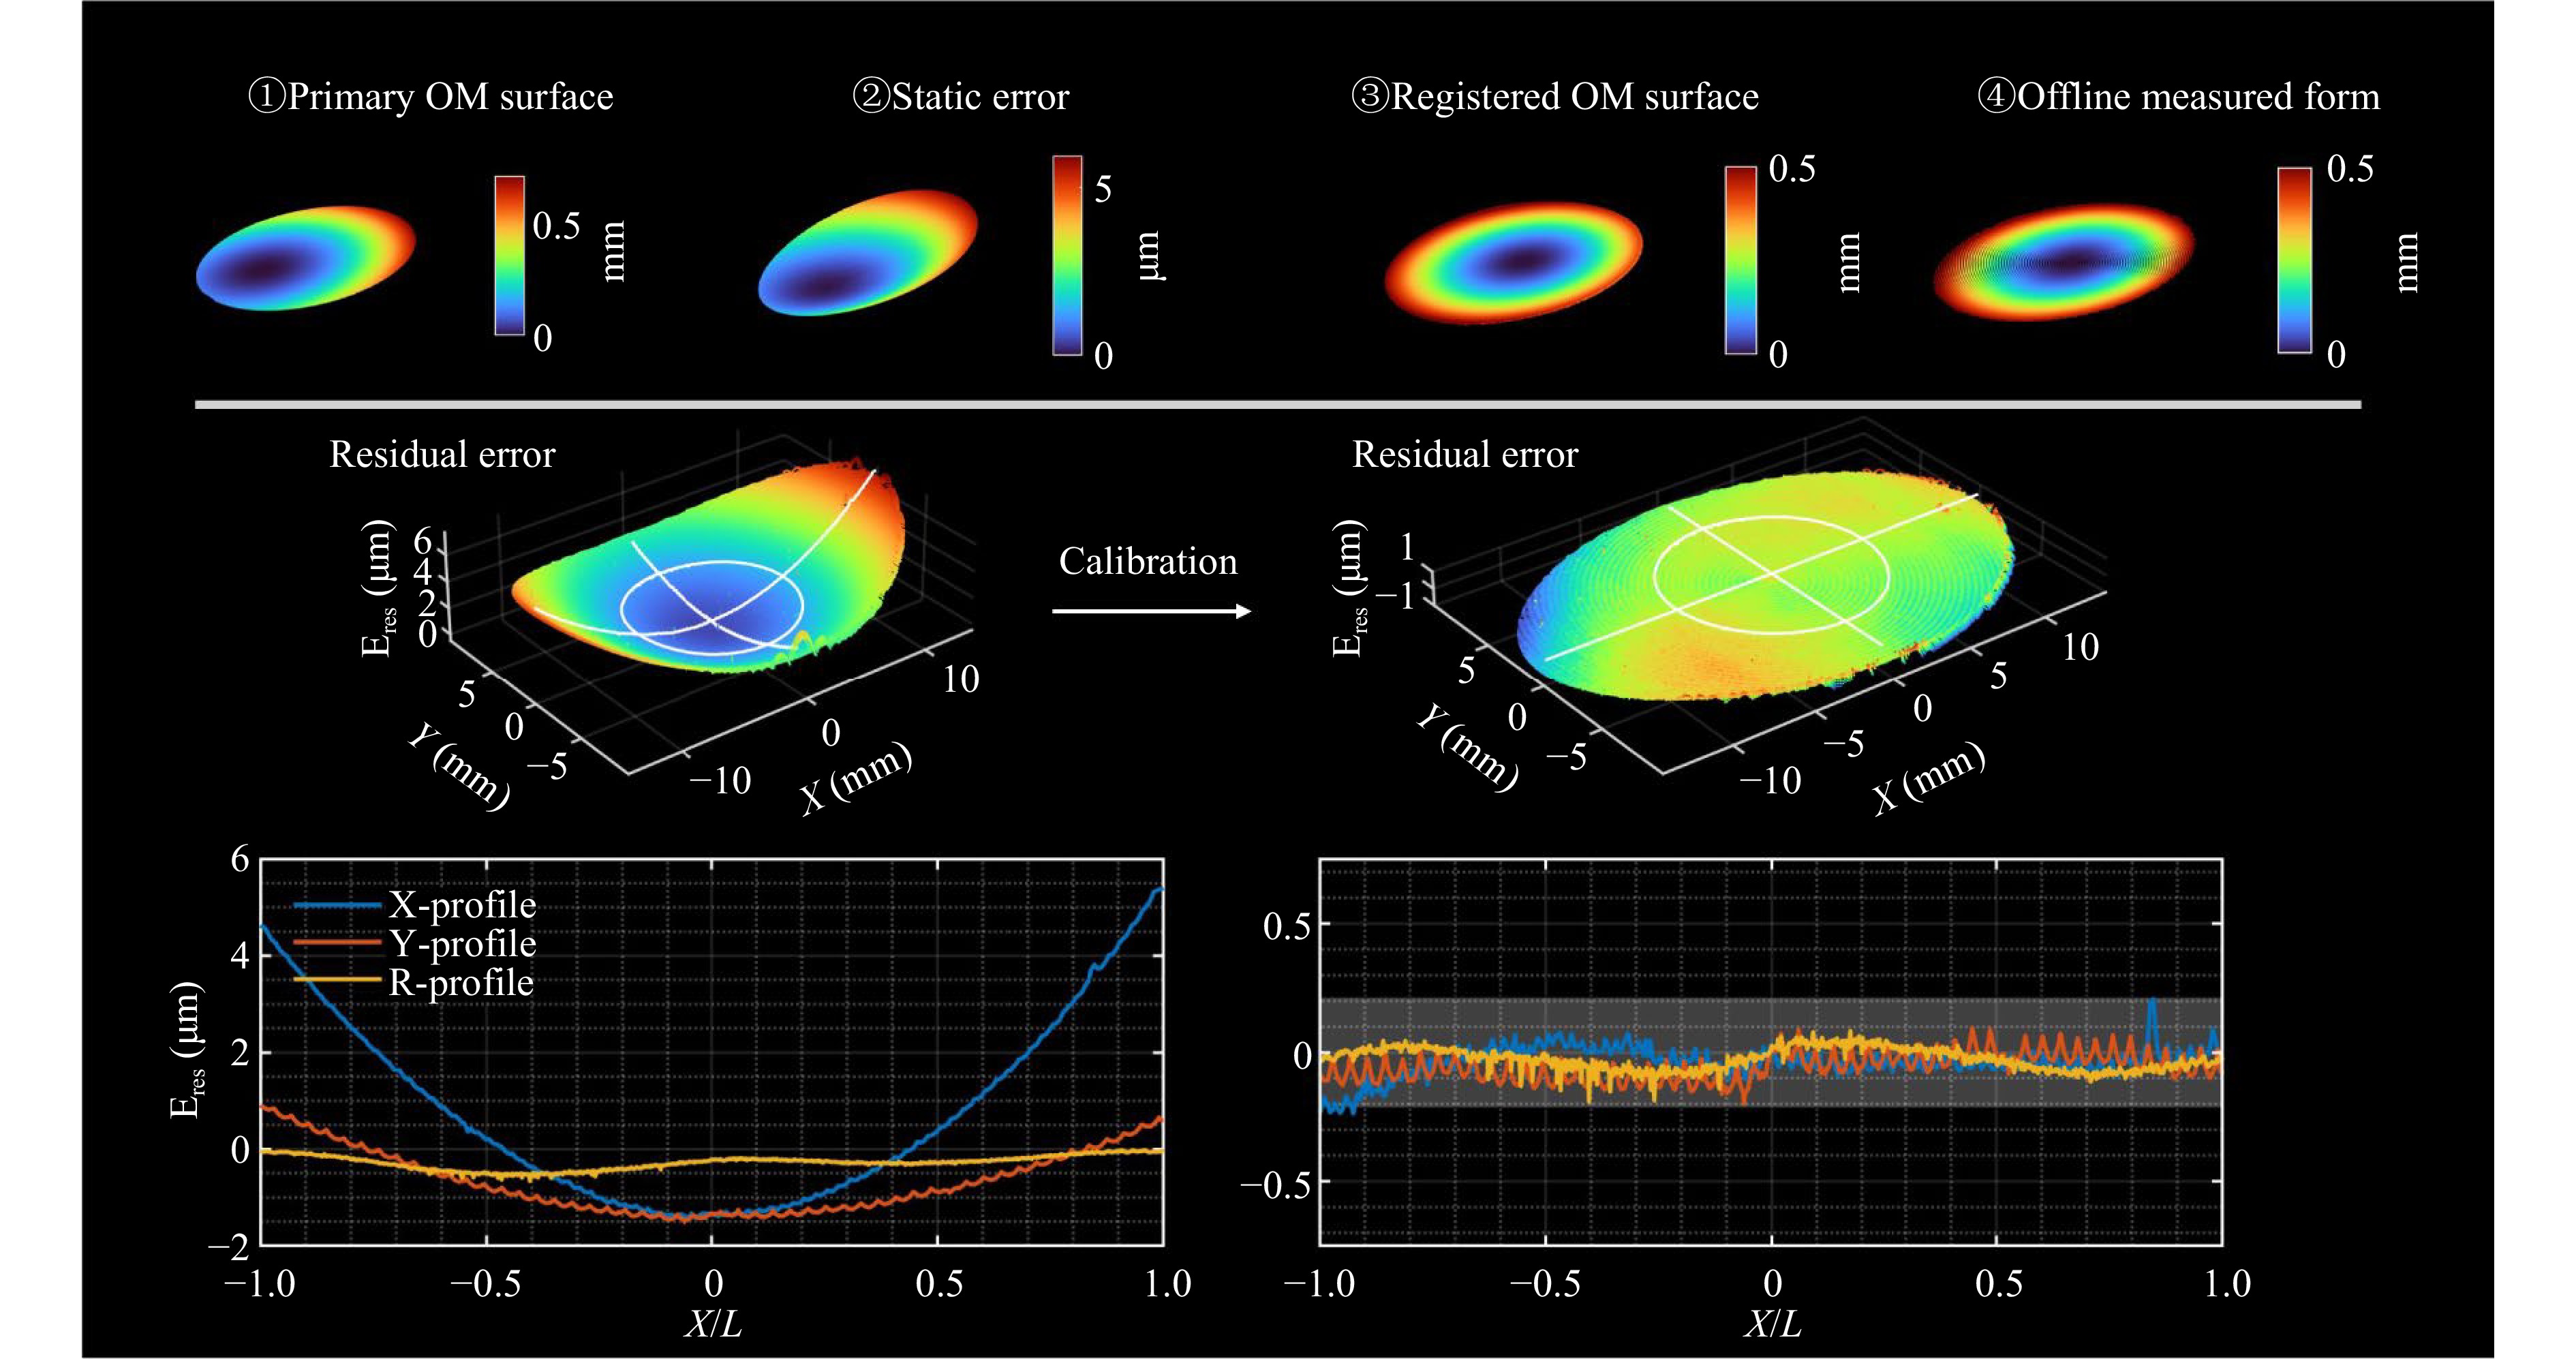
Fig. 8 Measurement result of the sample surface.
The residual error is primarily due to spindle errors, fixture backlash, and data alignment issues. The residual errors exhibit a root mean square (RMS) amplitude of 20 nm, and the PV is 0.5 µm. The same sample was measured offline using approximately 6 minutes to evaluate the surface form, acquiring 23,513 data points. The current on-machine system collected 290,011 effective data points in the same measurement duration, while also avoiding the time-consuming offline measurement setup procedure.
-
The potential performance limit of the 5+S on-machine measurement system is examined. A free path tracking test is performed by driving the stage moves with an oscillation path with the frequency from zero to 15 Hz. A trajectory of the 40 µm feed and the corresponding response is shown in Fig. 9a. The primary measurement error Err, the residual mechanical error after calibration EMech , and the noise of the system EN are shown by Fig. 9b. The calibration residual error is 20 nm in RMS. The residual mechanical error is caused by micro sliding between position pairs inside the optical mount under dynamic load.
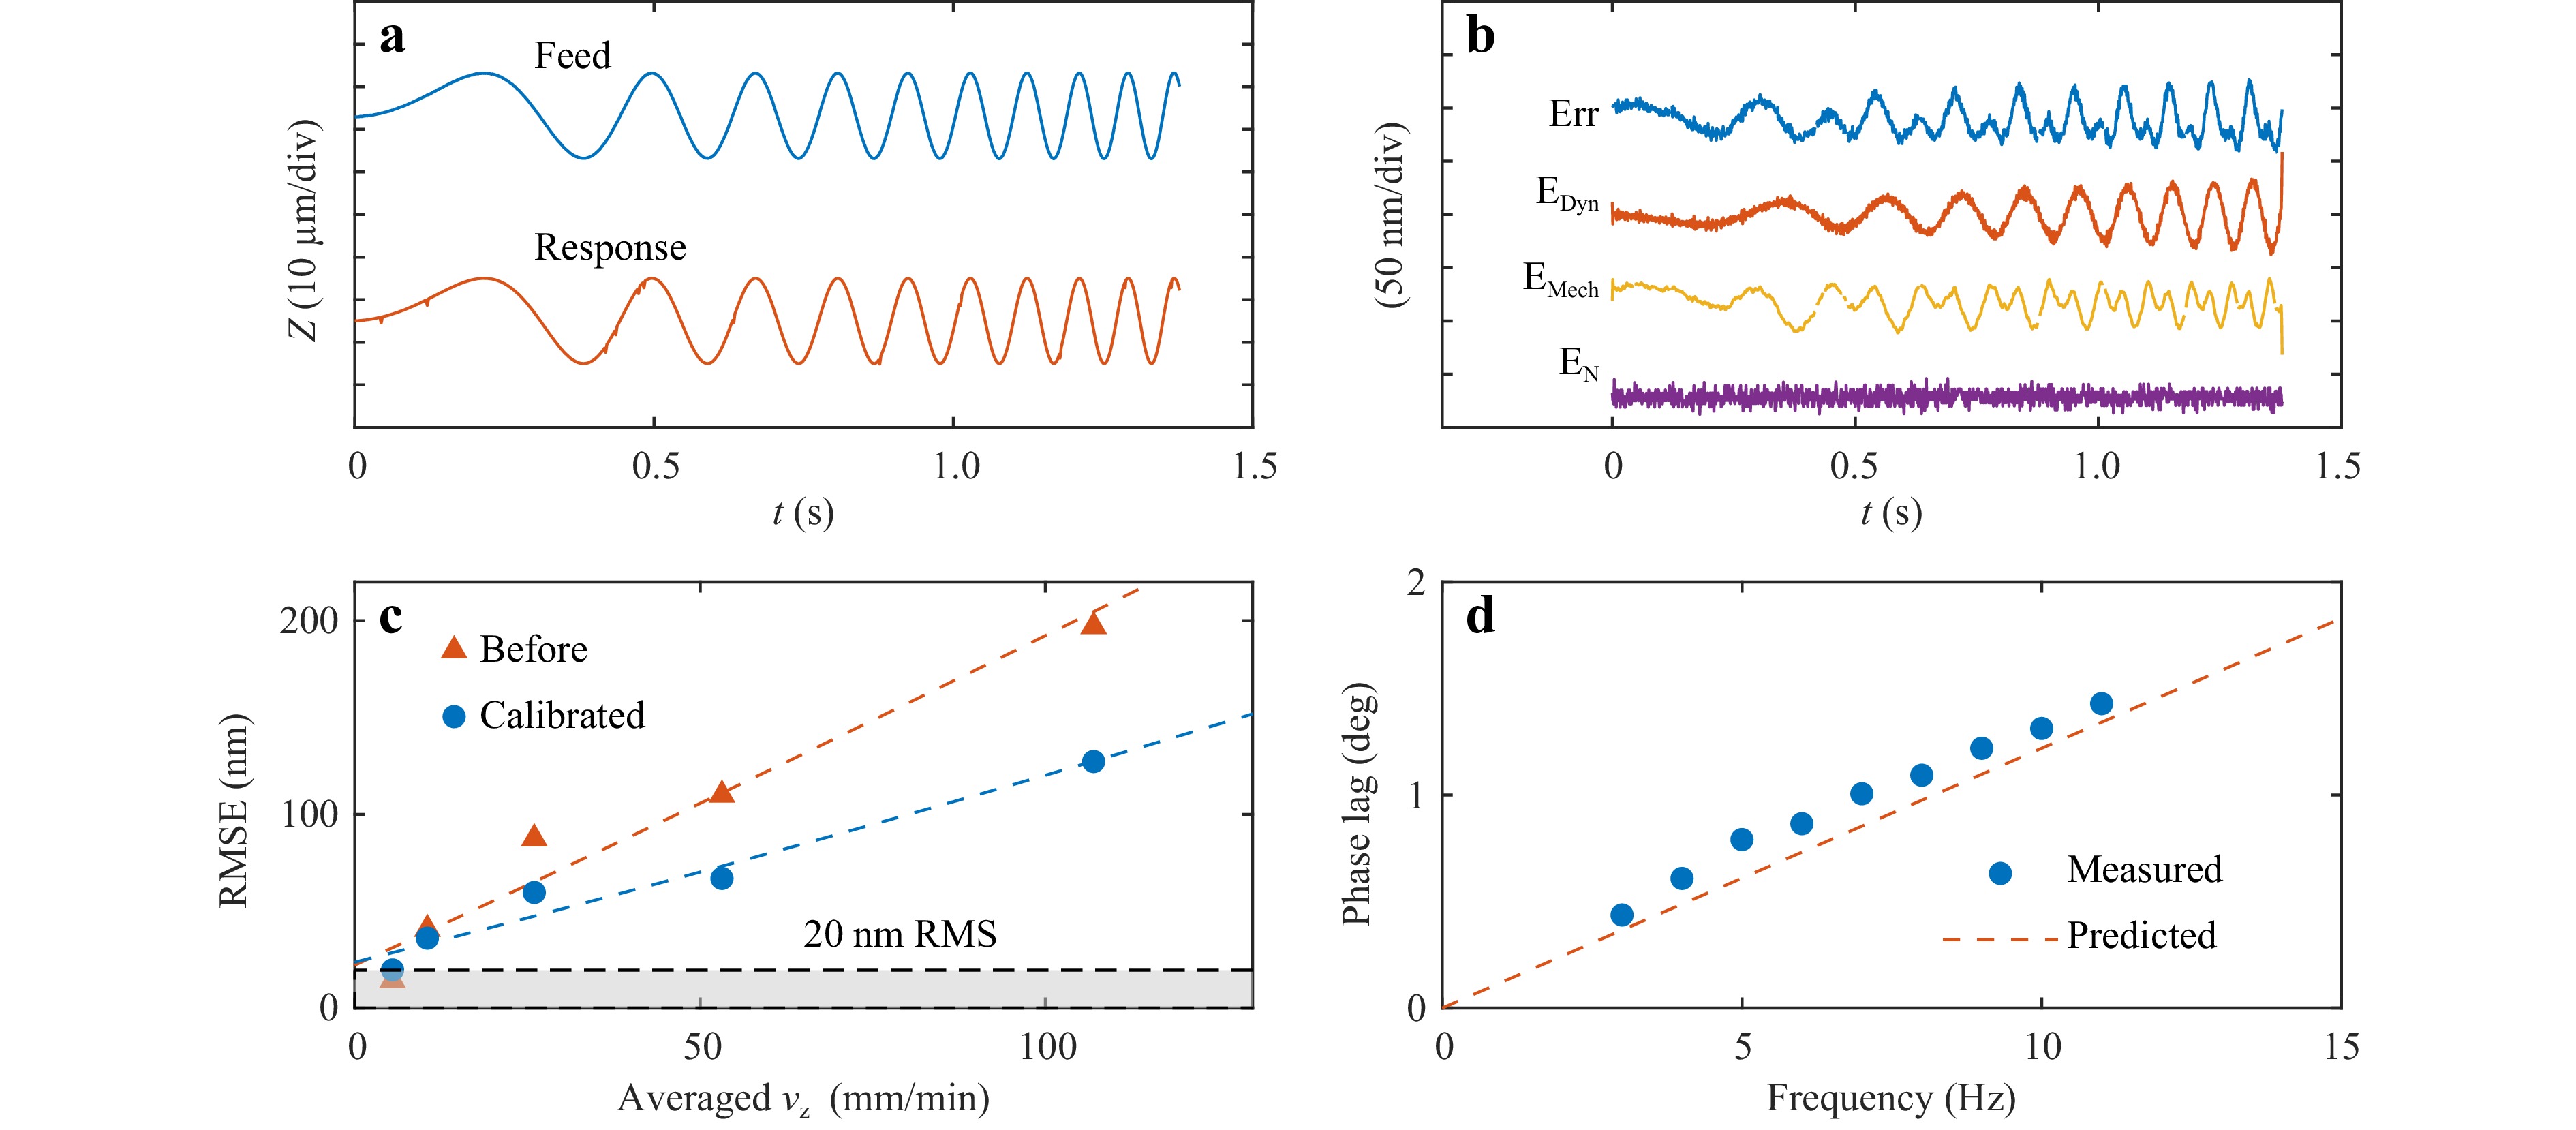
Fig. 9 Free path tracking test for system performance evaluated with elevated scanning velocity. a Free path of the linear feed drive with frequency from zero to 15 Hz. b The residual error of the sensor response. c Amplitude error of the sensor response in RMS before and after calibration. d Phase lag of the sensor response.
With an increase in scanning velocity, the proposed calibration method reduces the RMS error by 50%, as shown in Fig. 9c. Phase lag is considered a more stable indicator of system precision as it is insensitive to noise38,39. As depicted in Fig. 9d, the instantaneous phase lag is retrieved using the Hilbert transform. The phase lag grows steadily from zero to approximately 2 degrees, which is in good agreement with the prediction from Eq. 12. This indicates that the system maintains its precision across a wide range of motion speeds when a stiff fixture is used .
-
Although the system’s lateral resolution of 1.8 µm is theoretically sufficient to identify mid-spatial frequencies (MSF) error, the actual on-machine performance is ultimately limited by both the sampling interval and dynamic disturbances. Here, one single profile was measured with different speed parameters, denoted as F1, F2, F3, and F4 and listed in Table 1. The corresponding measurement results are shown in Fig. 10. The scanning path followed a circular trajectory with a 6 mm radius, and 0.3 mm sagitta. The dominant spatial errors resulted from tool marks with wavelengths between 5–15 µm is known as prior.
F1 F2 F3 F4 Feed velocity, averaged (mm/s) 1.53e-3 1.55e-2 1.21e-1 2.45e-1 Spindle speed (rpm) 0.140 1.875 15 30 Sampling distance (μm) 0.314 4.214 33.930 67.861 Amplitude RMS (nm) 11 10 5 3 Sensor lateral resolution 1.8 µm, Sampling frequency 1000 Hz Table 1. Scanning parameters for spatial frequency evaluation
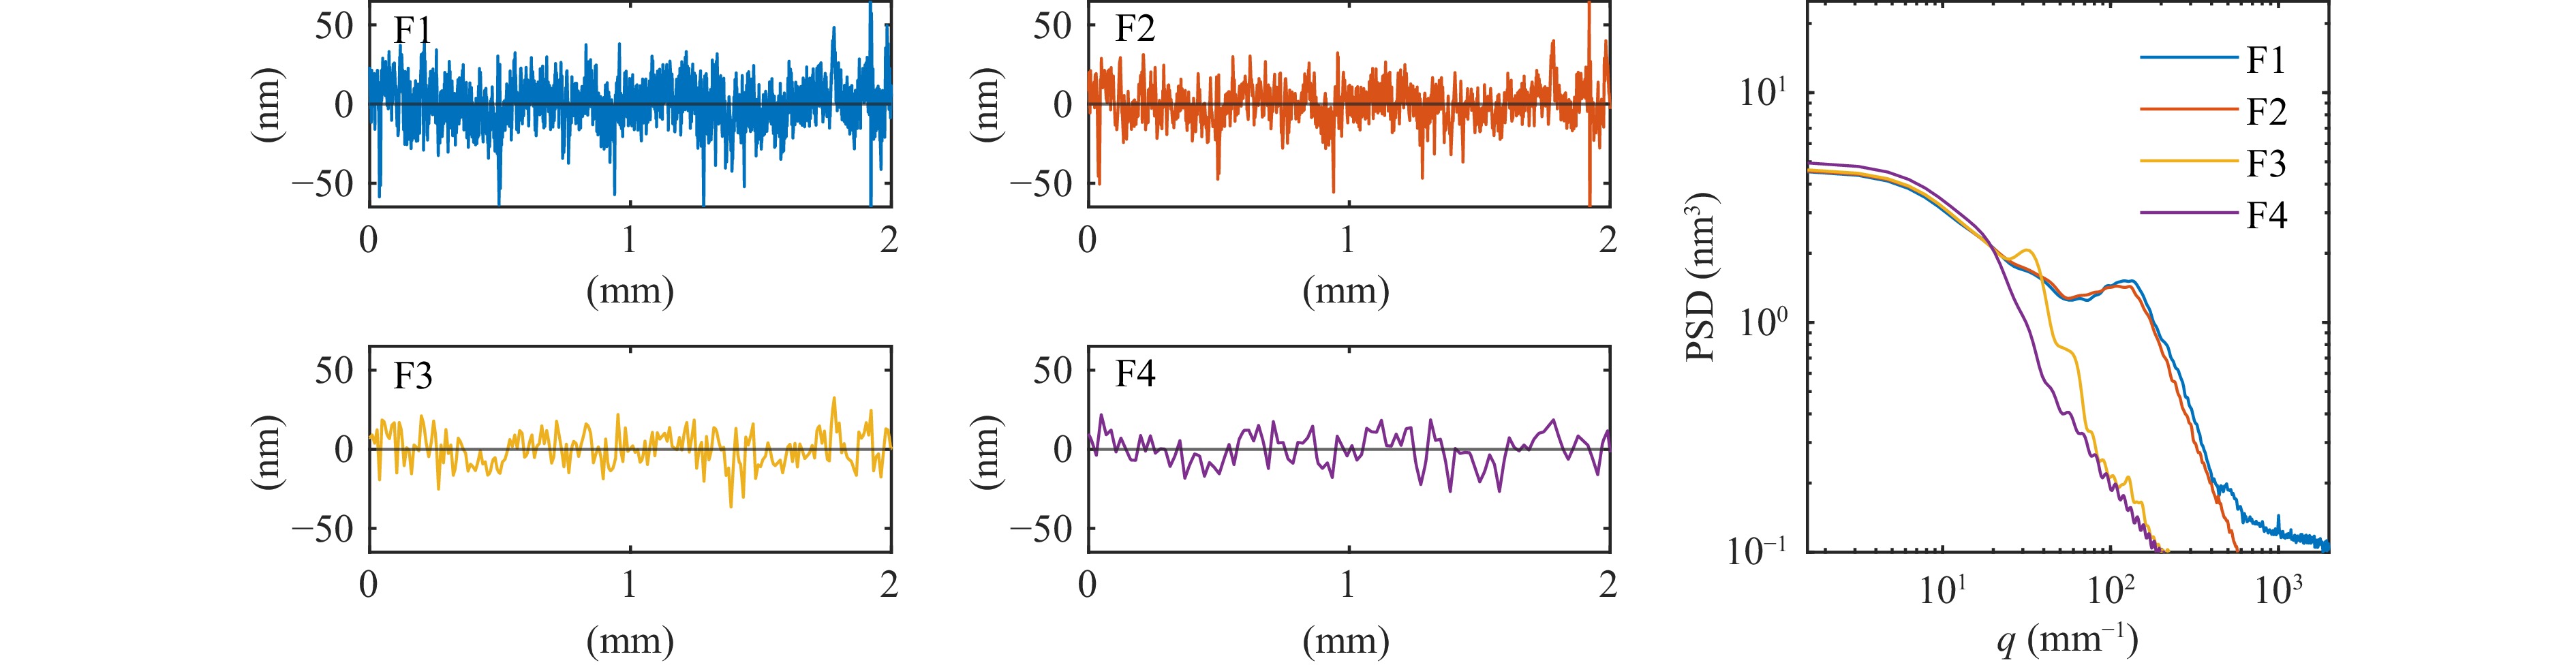
Fig. 10 Measurement result of surface texture with different scan parameters.
Measurements using F1 and F2 consistently identified spatial frequency peaks corresponding to a spatial period of 15 µm, which matched the previously determined tool marker spacing. In contrast, F3 revealed a pseudo-peak at a 20 µm period, likely caused by environmental vibrations. Meanwhile, F4 produced an erroneous peak at 100 µm due to oversampling and a loss of spatial resolution. The respective RMS amplitude values for F1 through F4 were 11 nm, 10 nm, 5 nm, and 3 nm. The identification of spatial frequency errors is highly sensitive to measurement conditions. Single measurement cannot ensure reliability for on-machine assessment due to potential disturbances such as vibrations or oversampling artifacts. Therefore, varying the sampling distance and feed parameters during the measurement process provides a practical strategy to cross-validate results and improve the accuracy of surface error characterization.
Multiple factors including mechanical-electronic coupling effects could cause mid-high frequency feed ripples40,41. Vibration signals were recorded during scanning with parameter the F2 and F3, shown as Fig. 11. The frequency spectrum analysis showed that F2 exhibited minimal vibration. In contrast, F3 revealed a distinct vibration at 680 Hz, exceeds the Nyquist limit of the chromatic confocal sensor, resulting in frequency folding. The folded frequency can be determined by $ \left|f-{f}_{s}NINT\left(f/{f}_{s}\right)\right| $, where NINT is the nearest integer function using the rounding half up rule, $ f $ is the original frequency of the signal, and $ {f}_{s} $ is the actual sampling rate, 1000Hz here for the chromatic confocal sensor. This aliasing effect produced a false peak at approximately 350 Hz in the temporal frequency spectrum, which directly corresponds to the spurious spatial frequency peak identified in the F3 measurement.
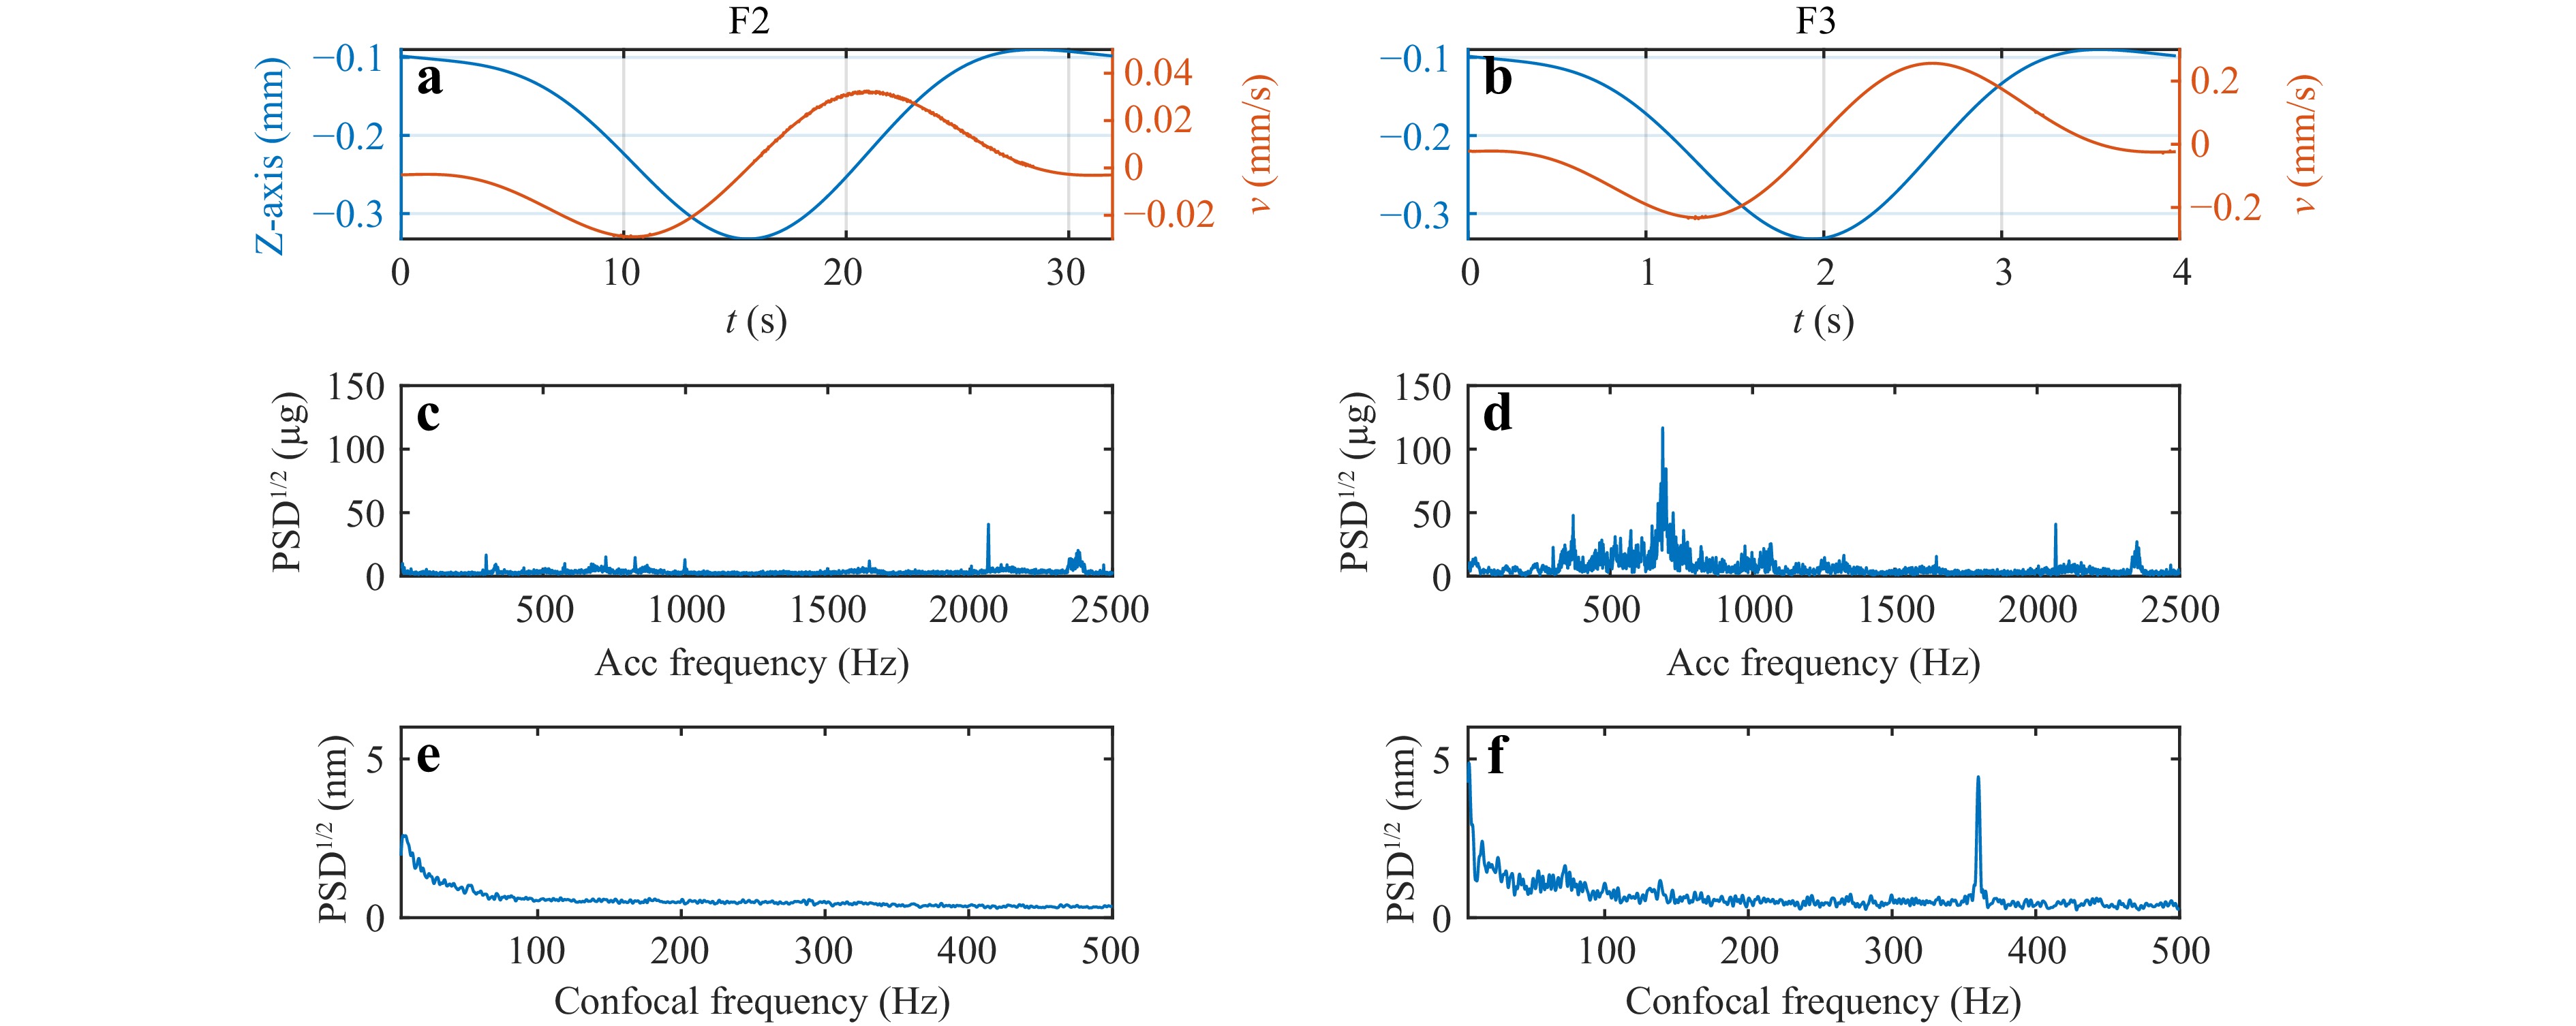
Fig. 11 Effect of feed induced vibration on the mid-to-high frequency error of the result. (a,b) Z axis feed path and velocity of with scan parameter F2, F3. (c,d) PSD of vibration signal. (e,f) PSD of the chromatic confocal signal.
These results confirm that mechanical vibration can introduce pseudo spatial frequency components, compromising the accuracy of on-machine measurements. To mitigate this effect, continuous machine status monitoring is essential. Additionally, due to the freeform surface inherently possess high frequency components42, refining motion control commands to reduce vibration during scanning can further enhance measurement reliability and ensure more accurate surface characterization. The similar disturbance has been identified in measurement of other OMSM systems of different layouts43. Decreasing the scanning velocity and applying a band stop filter in post processing of OMSM data are effective ways for removing high frequency ripples from the raw data44.
-
In conclusion, this research proposes a generally applicable dynamic error calibration methodology that substantially enhances form measurement accuracy. It effectively reduces the measurement error from 6 µm to 0.5 µm. Furthermore, the system facilitates high-speed data acquisition and generates high-resolution point cloud datasets with an order of magnitude greater data density than those produced by conventional commercial systems, without increasing the measurement time. This makes the system capable of evaluating mid-spatial frequency form errors with improved reliability. The proposed method also has the potential for application in other precision manufacturing processes, such as optics manufacturing, including freeform polishing.
-
The authors gratefully acknowledge the UK’s Engineering and Physical Sciences Research Council (EPSRC) funded programmes EP/P006930/1, EP/Z53285X/1, UK’s STFC-IPS funding ST/W005263/1, and the Innovation Launchpad Network+ programme RIR26E230613-1, as well as the UK’s Royal Academy of Engineering (RAEng) and Renishaw PLC who co-sponsor Prof. Jiang’s RAEng/Renishaw Research Chair.
Towards high-speed on-machine measurement of freeform surfaces: a dynamic error calibration method
- Light: Advanced Manufacturing , Article number: (2025)
- Received: 18 October 2024
- Revised: 07 October 2025
- Accepted: 07 October 2025 Published online: 11 November 2025
doi: https://doi.org/10.37188/lam.2025.078
Abstract: Metrology challenges have increasingly been the bottleneck in the manufacturing of freeform optics. On-machine metrology has emerged as a potential solution to bridge the gap between measurement and machining processes. It is widely recognised that metrology systems integrated with manufacturing platforms are affected by the dynamic characteristics of the host platform. However, there is a limited understanding of how these dynamic disturbances contribute to measurement error, primarily due to a lack of comprehensive system-level analysis. This paper aims to depict the relationship between mechanical vibration and measurement error in an on-machine surface measurement (OMSM) system and proposes a method to mitigate this error through system calibration. A dynamic error model of the OMSM system is developed, incorporating feed disturbances, machine dynamics, and the compliance of the measurement units. Our analysis identifies phase lag in the measurement unit as a primary contributor to the distortion of the measured surface figure. To address this issue, a calibration procedure is performed based on system transfer function identification. The proposed calibration method effectively reduces the residual error in high-speed measurements. Experimental results demonstrate a reduction of the peak-to-valley (PV) error from 6 µm to 0.5 µm, and a decrease in the root mean square (RMS) error from 2.3 µm to 20 nm. Using this system, a high-density point cloud of 290,000 points was measured in 6 minutes, successfully meeting the challenges of measuring freeform surfaces on the manufacturing platform with both high accuracy and high efficiency. The proposed calibration method, which compensates for the absence of an independent metrology frame, can be adapted for other similar on-machine systems. This approach offers a cost-effective and time-efficient solution for the rapid prototyping of freeform optical components using integrated surface metrology.
Research Summary
High speed on-machine metrology: Measuring freeform where they are made.
Integrating metrology into the manufacturing chain for freeform optics is a key strategy for improving the efficiency and accuracy of ultra-precision optics. However, intrinsic dynamic errors within the system hinder the achievement of this goal. A team led by Professor Xiangqian Jiang at the University of Huddersfield, in collaboration with Taylor Hobson, reports a novel method to overcome this long-standing challenge with modelling the primary source of error in high-speed measurement. By identifying the metrology system's transfer function, the method corrects for distortion during high-speed surface measurement. The technique provides measurement results traceable to standalone metrology platforms. In an on-machine measurement demonstration of a freeform surface, the peak-to-valley measurement error was reduced from 6 µm to less than 0.5 µm. This offers a cost-effective solution to accelerate the sustainable production of advanced freeform optics.
Rights and permissions
Open Access This article is licensed under a Creative Commons Attribution 4.0 International License, which permits use, sharing, adaptation, distribution and reproduction in any medium or format, as long as you give appropriate credit to the original author(s) and the source, provide a link to the Creative Commons license, and indicate if changes were made. The images or other third party material in this article are included in the article′s Creative Commons license, unless indicated otherwise in a credit line to the material. If material is not included in the article′s Creative Commons license and your intended use is not permitted by statutory regulation or exceeds the permitted use, you will need to obtain permission directly from the copyright holder. To view a copy of this license, visit http://creativecommons.org/licenses/by/4.0/.

 DownLoad: