


-
The market for extended-reality (XR) devices has expanded in recent years, and many optical manufacturers are actively developing new products. A 2021 market survey by Fuji-Kimera forecasts long-term growth in virtual-reality (VR), augmented-reality (AR), and mixed-reality (MR) devices1. By contrast, a Reuters report summarizing International Data Corporation (IDC) indicates sluggish demand over 2022–2024, with renewed expansion expected from 2026 onward2. From a long-term industry perspective, establishing mass-production capability for XR optics is therefore essential.
To realize higher-fidelity displays, direct-on-screen rendering architectures are being investigated. In such systems, a high-brightness RGB laser and a MEMS mirror enable wide-area image drawing; however, achieving a large scanned field typically requires a long propagation distance between the laser output and the MEMS mirror. To reconcile this requirement with compact form factors, polyhedral optical prisms that fold the beam path by multiple internal reflections are considered.
The prisms of interest comprise multiple optical faces—including freeform surfaces—and include configurations in which lateral faces are mutually parallel. The relative positions of these faces must be formed and maintained with high accuracy, necessitating metrology capable of precise inter-surface positional evaluation. In particular, for prisms incorporating freeform, more advanced evaluation techniques are required than for simple triangular prisms composed solely of planar faces that can be measured by generic three-dimensional measuring machines.
Manufacturing of polyhedral prisms with freeform geometry has been reported—for example, monolithic freeform fabrication by Optimax Systems Inc. in 20173. For XR applications, however, the required component size is on the order of a few millimeters, and reports on the fabrication and metrology of small-scale freeform prisms in this regime remain scarce. Moreover, the optics industry requires standardized measurement methods suitable for high-volume production.
Since the 1990s, Panasonic has deployed the Ultra-high Accurate 3D Profilometer (UA3P), contributing to higher-quality optical devices. UA3P combines high-accuracy three-dimensional coordinate metrology with a low-force contact probe to enable absolute coordinate measurement, and—via comparison with mathematical reference surfaces—supports high-precision evaluation not only of rotationally symmetric profiles but also of freeform surfaces. According to4, the UA3P-4000 used in this work attains a standard uncertainty of 30 nm.
In optical characterization, evaluation of surface figure and inter-surface decenter (axis misalignment) is standard. The same holds for polyhedral prisms, where both surface shape and the positional relationship between optical centers are critical. Building on UA3P-based coordinate metrology, Panasonic proposed an inter-surface decenter evaluation technique in 20025, which has contributed to higher-precision camera modules. Subsequently, a method was developed to evaluate six-degree-of-freedom (6-DoF) misalignment, including twist between freeform surfaces6.
In this paper, we extend these techniques and validate a surface-position evaluation method for polyhedral optical systems incorporating freeform.
-
The UA3P-4000 used in this study is equipped with a three-axis, independently referenced laser interferometric length-measuring system common to the UA3P series, with a configuration that minimizes Abbe error (Fig. 1). Despite being contact-type, the instrument is equipped with a probe that achieves an ultra-low measuring force of 0.05 mN, enabling high-accuracy acquisition of three-dimensional shape coordinates.
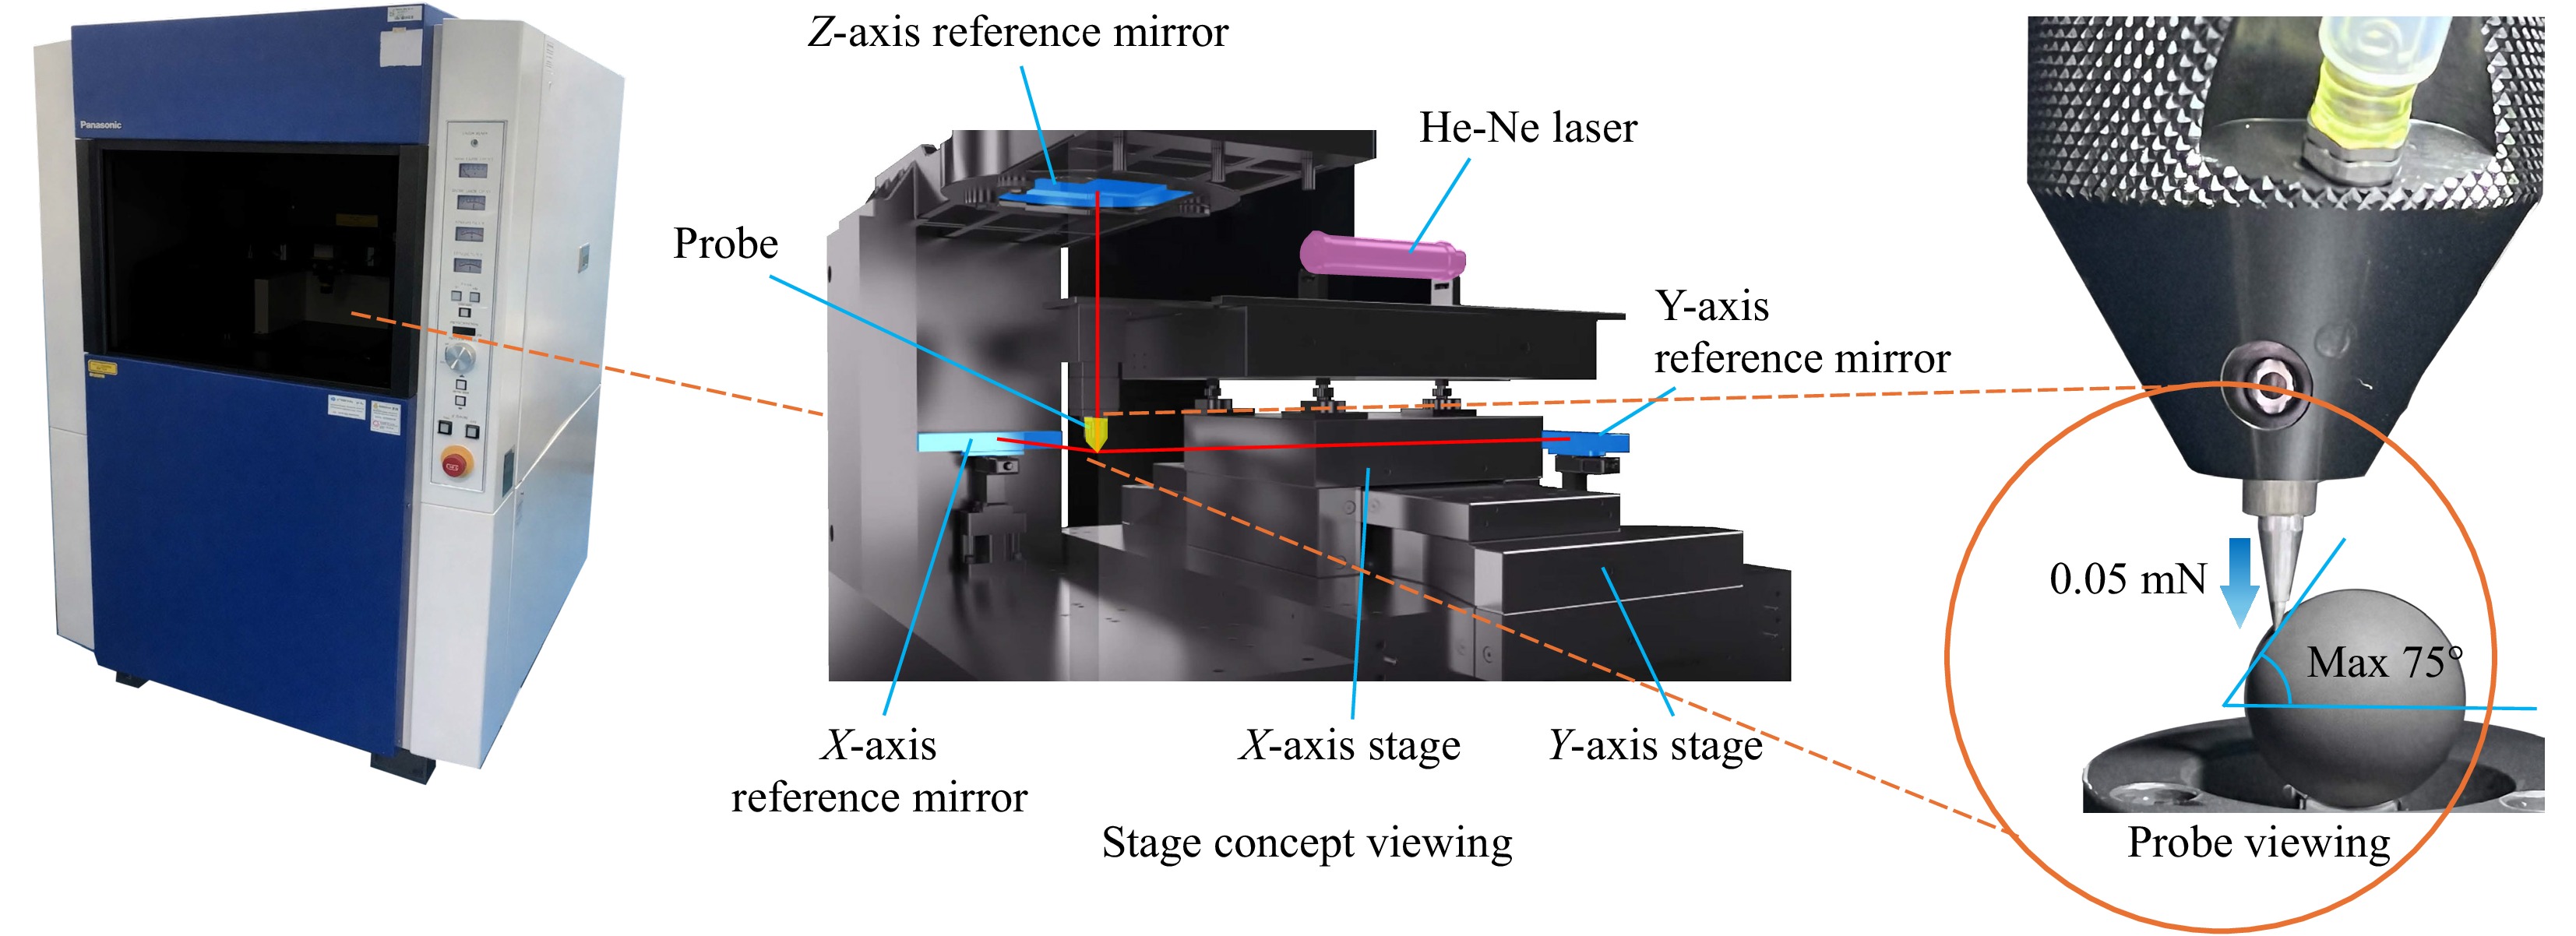
Fig. 1 UA3P structure concept.
The UA3P series provides an automatic six-axis (6-DoF) coordinate transformation (“alignment”) based on least-squares fitting of the measured coordinates to the target design equation, thereby evaluating deviations from the ideal surface (Fig. 2). In addition, the design surface to be evaluated can be programmed in C++, allowing high-precision measurement and evaluation against analytical reference surfaces even for complex geometries that include freeform surfaces.
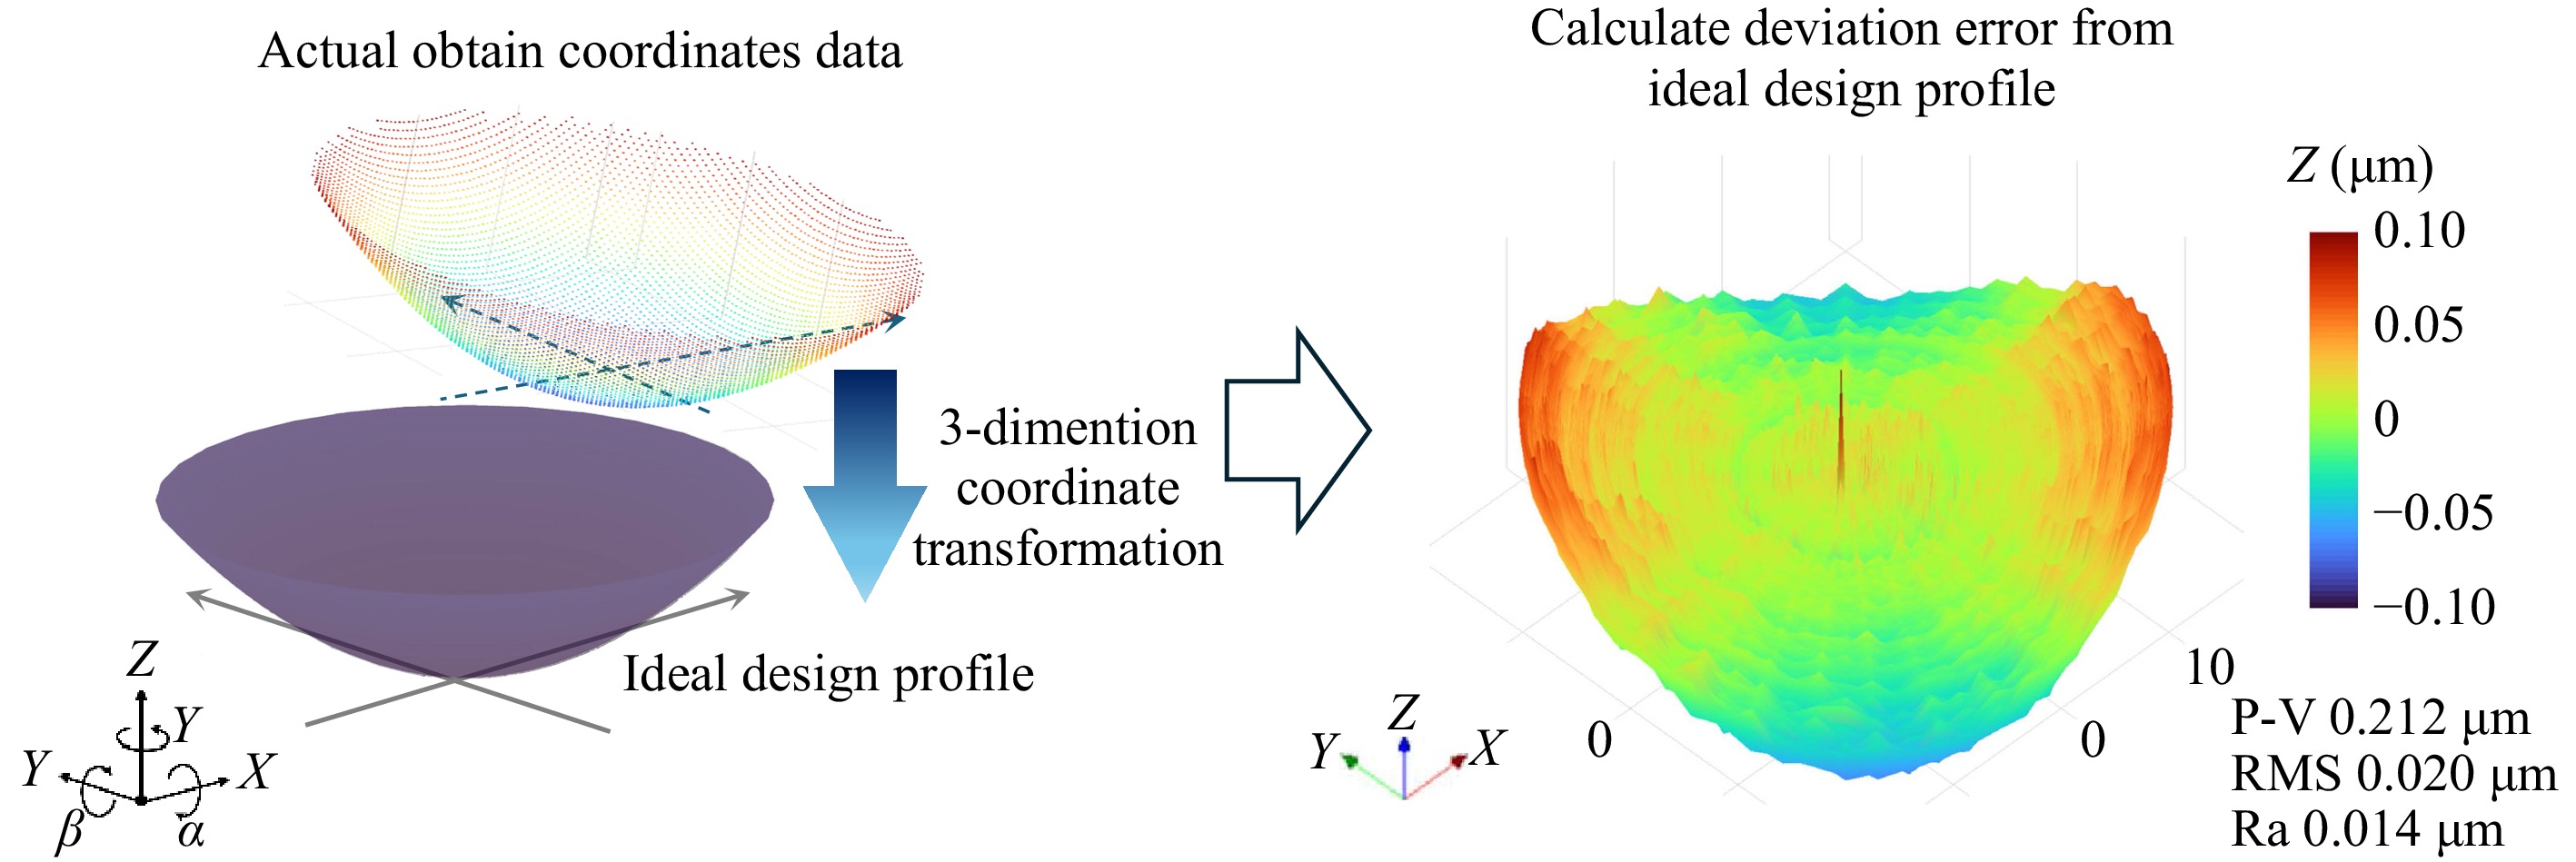
Fig. 2 Work shape evaluation function overview.
-
Since 2002, the UA3P series has supported an evaluation method—using the fixture shown in Fig. 3 and the evaluation system in Fig. 5—for inter-surface optical-axis tilt, decenter, and center thickness of rotationally symmetric aspheric lenses.
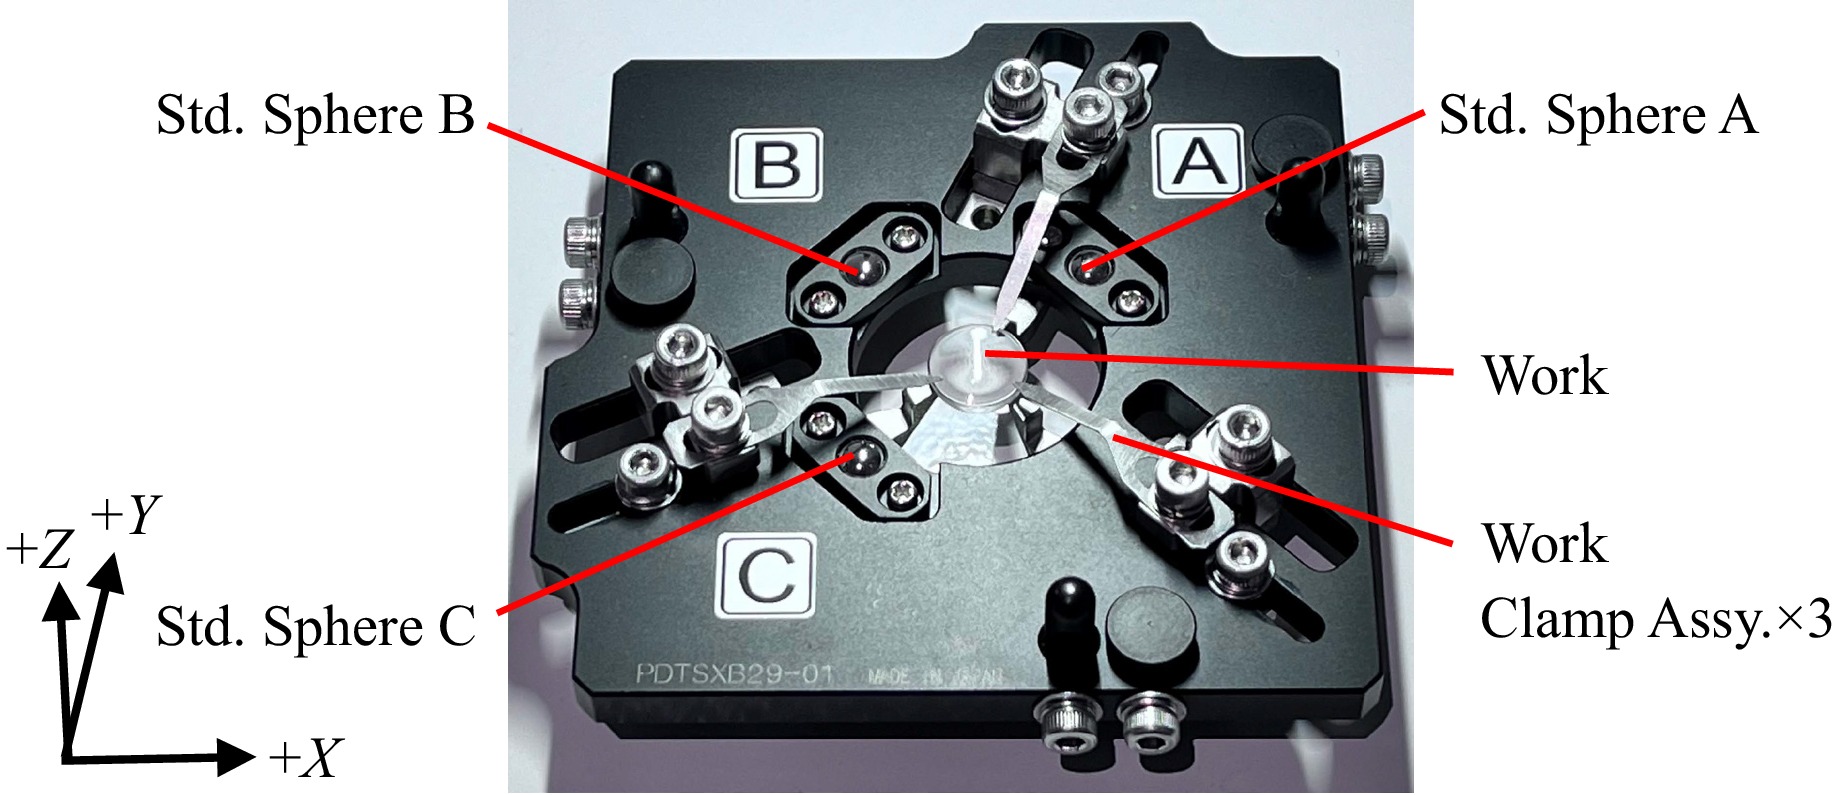
Fig. 3 Standard decenter/tilt measurement fixture.
Because of its mechanical configuration, UA3P fundamentally measures from the top side of the workpiece. Accordingly, inter-surface decenter evaluation requires the use of the fixture in Fig. 3: the front and back surfaces are measured separately, and the datasets are synthesized in software to compute positional misalignment. The fixture embeds standard spheres A, B, and C, which are measurable from both sides.
The overall measurement procedure is illustrated in Fig. 4. The standard spheres and the workpiece are first measured from the fixture’s first side (1st side). The fixture is then flipped, and the measurements are repeated from the second side (2nd side).
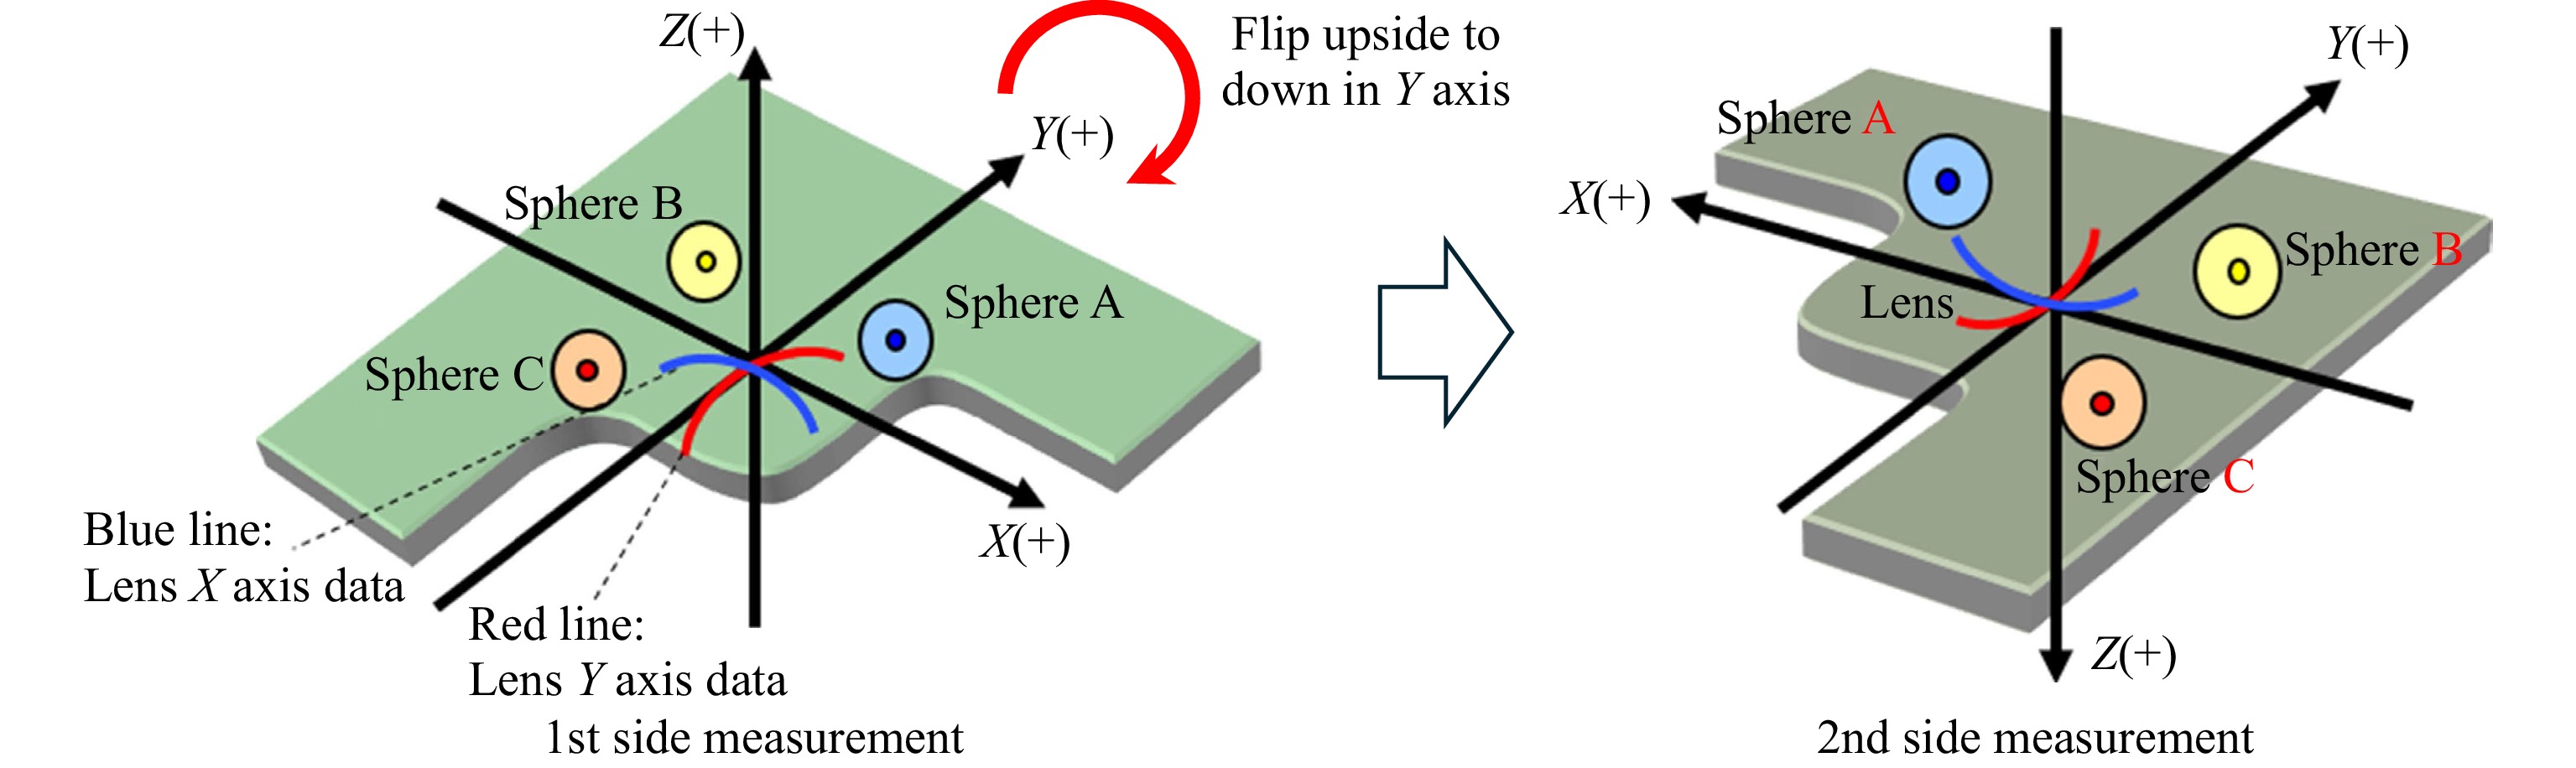
Fig. 4 Measurement method of decenter/tilt measurement.
The two coordinate frames are then synthesized using the centers of spheres A, B, and C. Finally, the normal vector N1 obtained from the reference (standard) surface and the normal vector N2 from the evaluation surface are compared to determine decenter, tilt, and center thickness (Fig. 5).
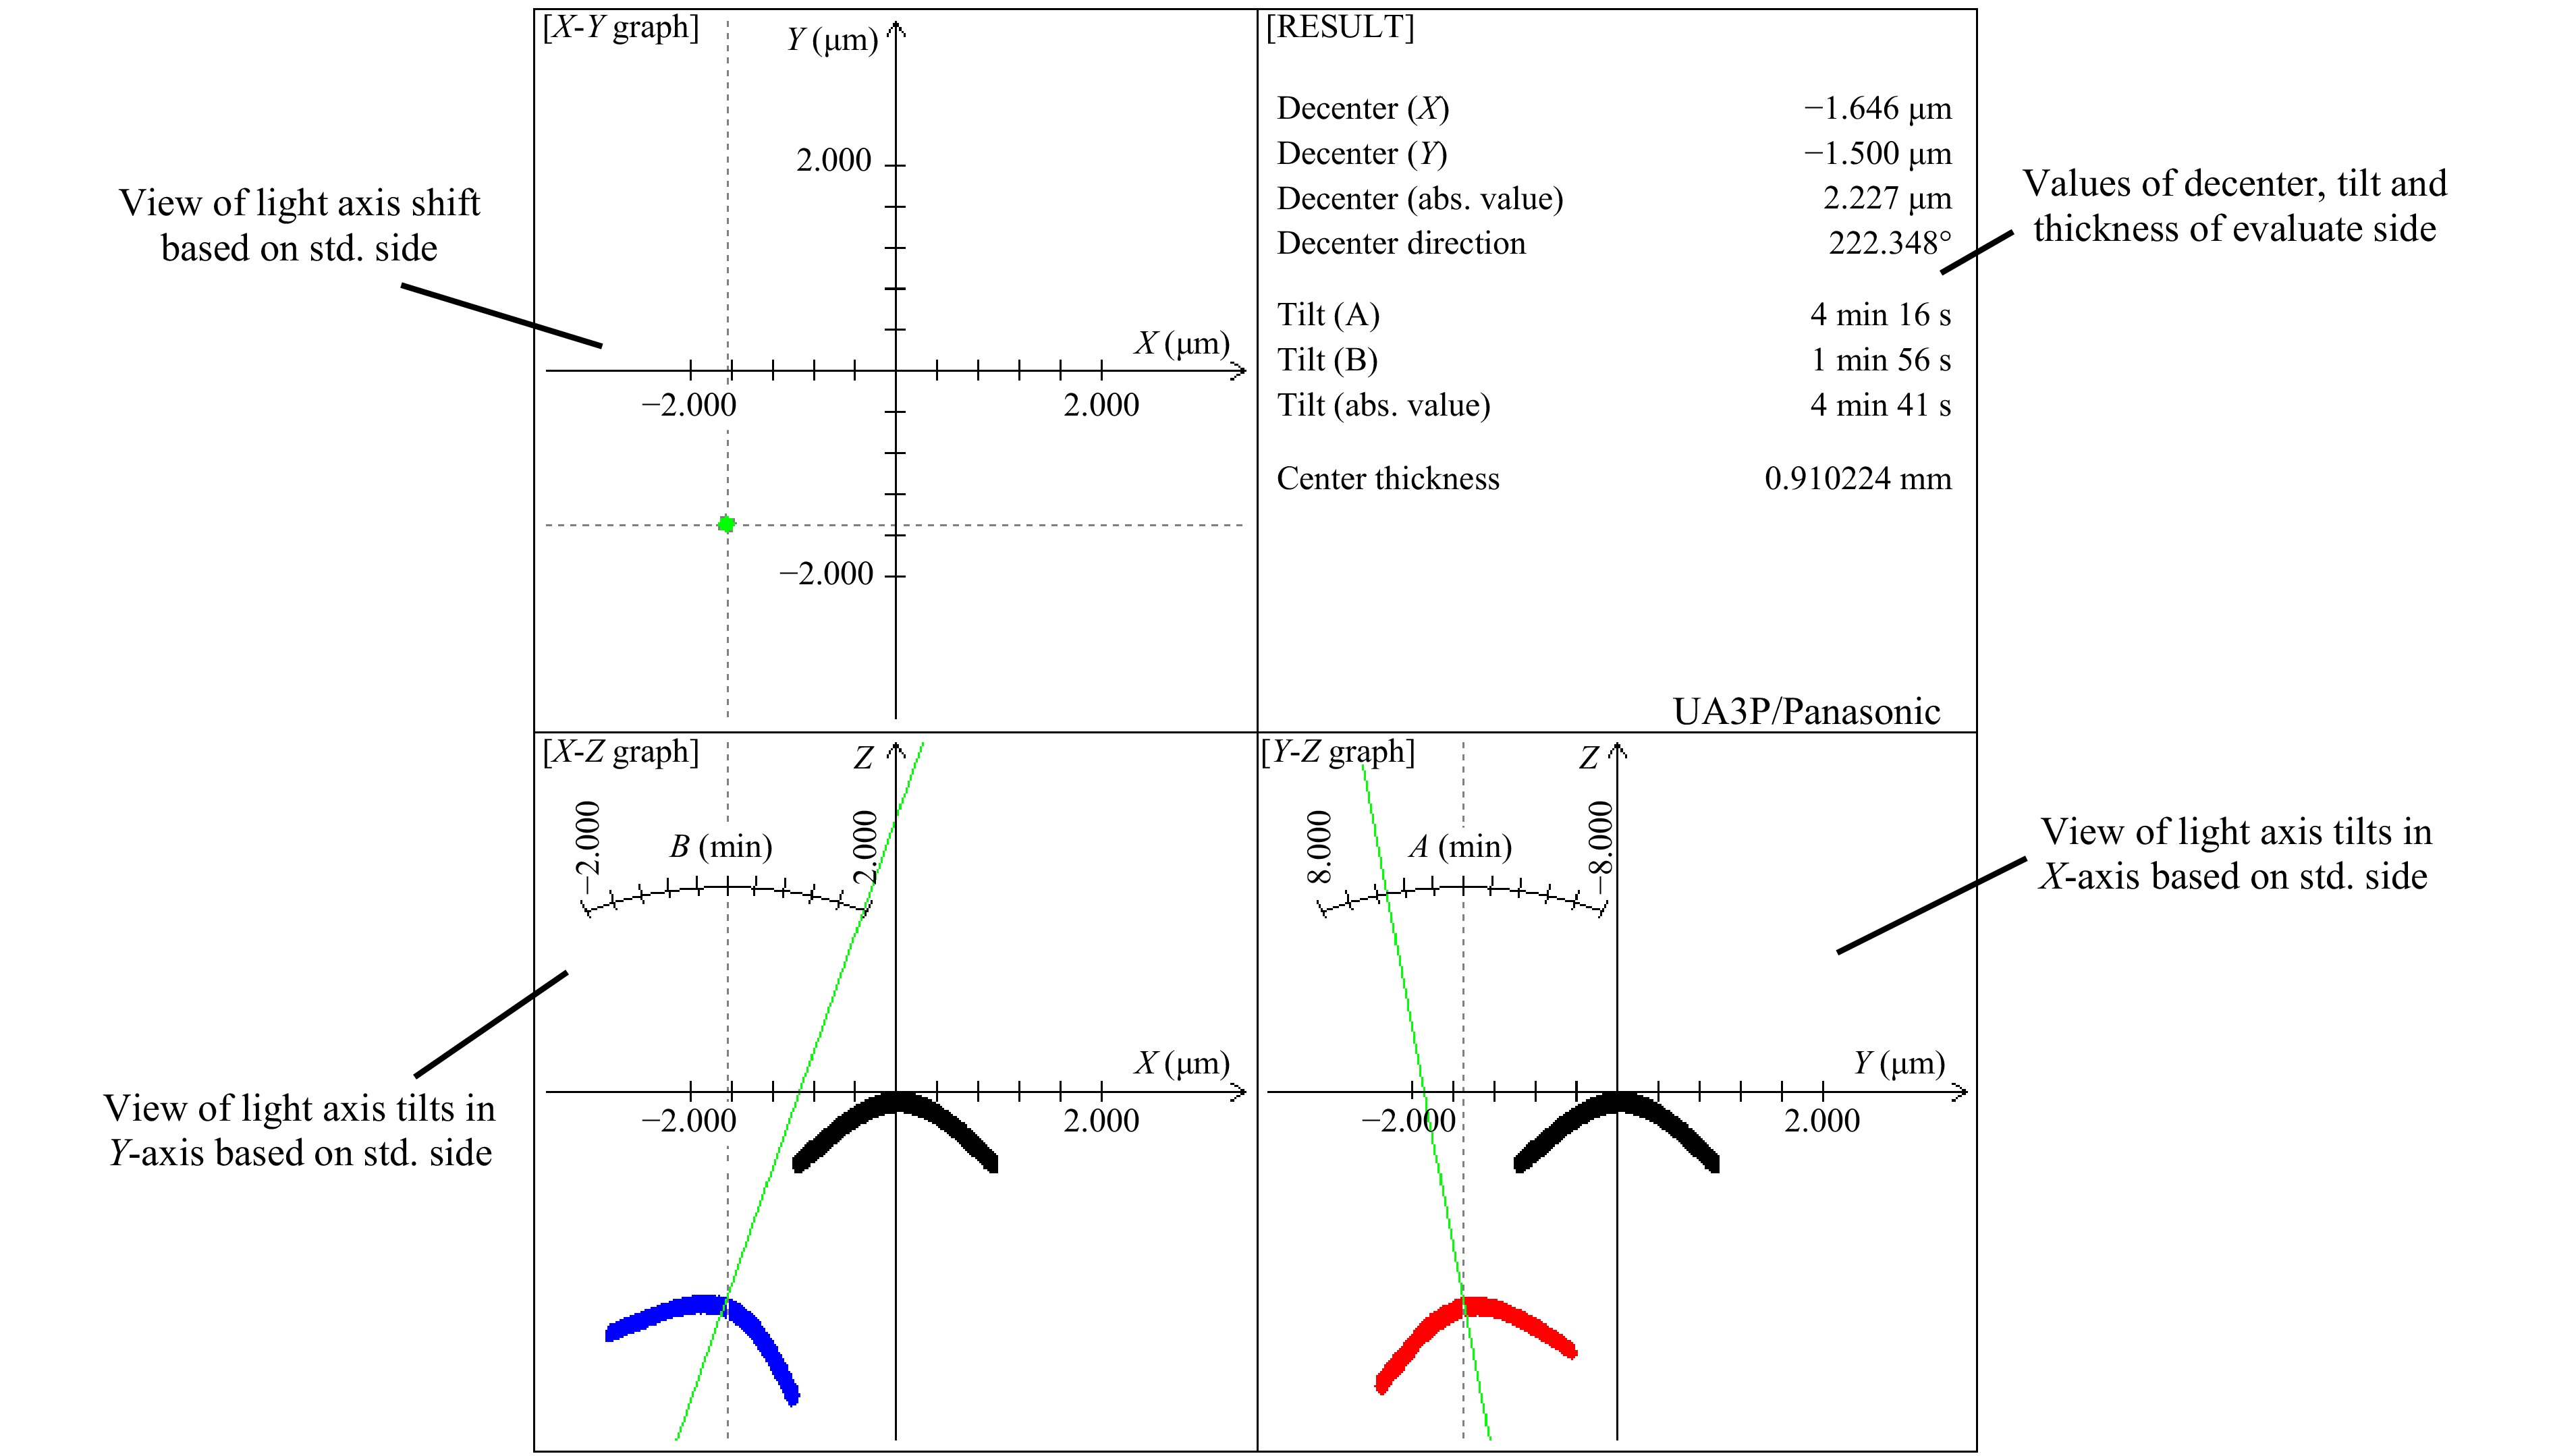
Fig. 5 Decenter bi-aspherical lens evaluation system.
-
We extended the conventional method for rotationally symmetric aspheres to enable evaluation of decenter, tilt, and twist between freeform surfaces; this method is referred to as the '22 algorithm. Its validation is reported in Ref. 6.
In the present work, the measurement dataset from Ref. 6 is re-evaluated using our newly developed system (hereafter the '24 algorithm), and the correlation between the two systems is assessed to verify effectiveness.
In Ref. 6, the workpiece in Fig. 6 was mounted in the fixture of Fig. 3, and tilt, decenter, and center thickness between the 1st and 2nd Polynomial Parts were measured five times each in repeated trials. The twist angle was evaluated twelve times by comparing the physical angle computed from UA3P measurements of a side reference plane on the workpiece with the angle computed by the '22 algorithm from the two Polynomial Parts. The optical prescriptions and boundary conditions are given in Fig. 7 and Tables 1, 2, and the measurement conditions in Tables 3, 4. The workpiece material was STAVAX, fabricated by diamond turning.
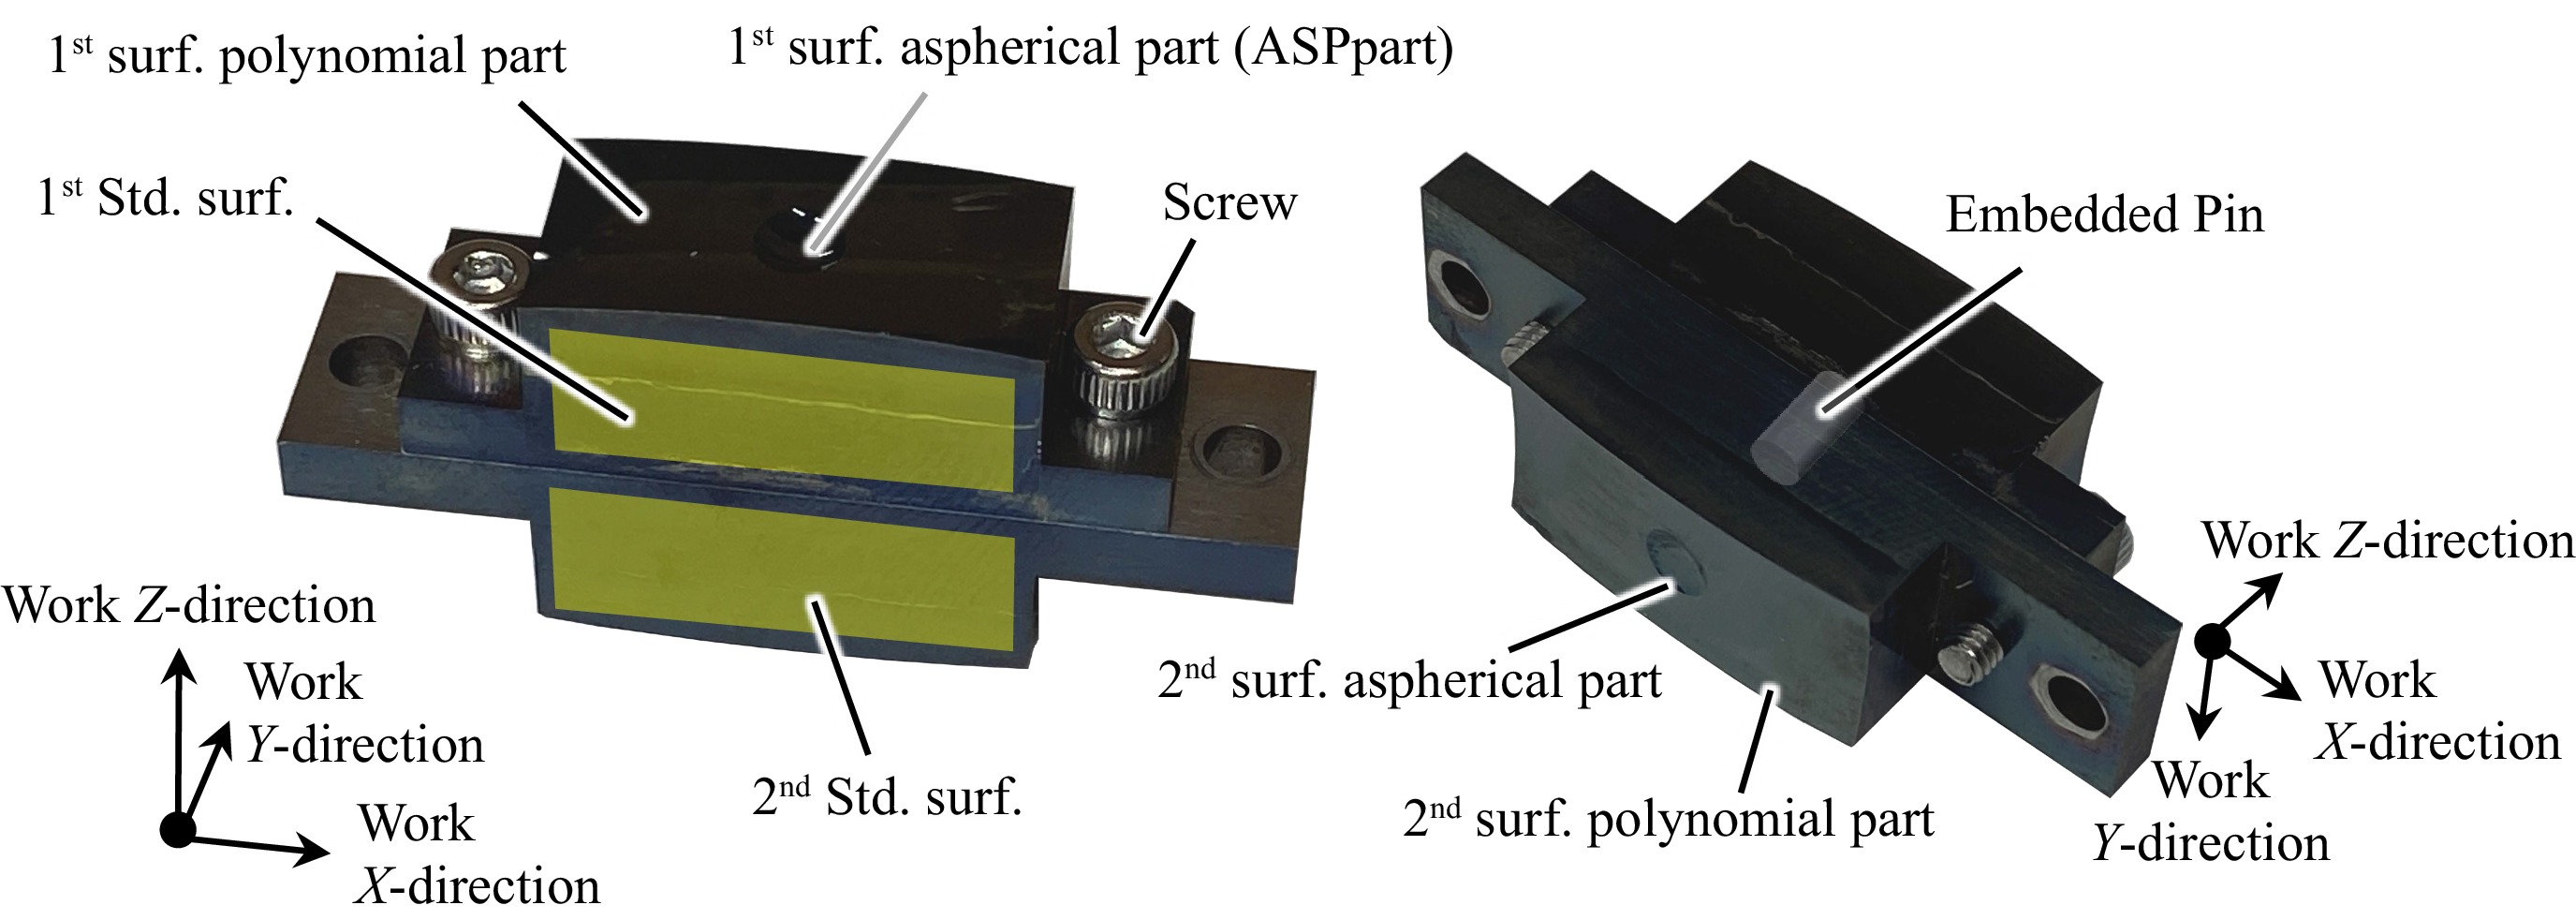
Fig. 6 Workpiece structure for bi-freeform evaluation.
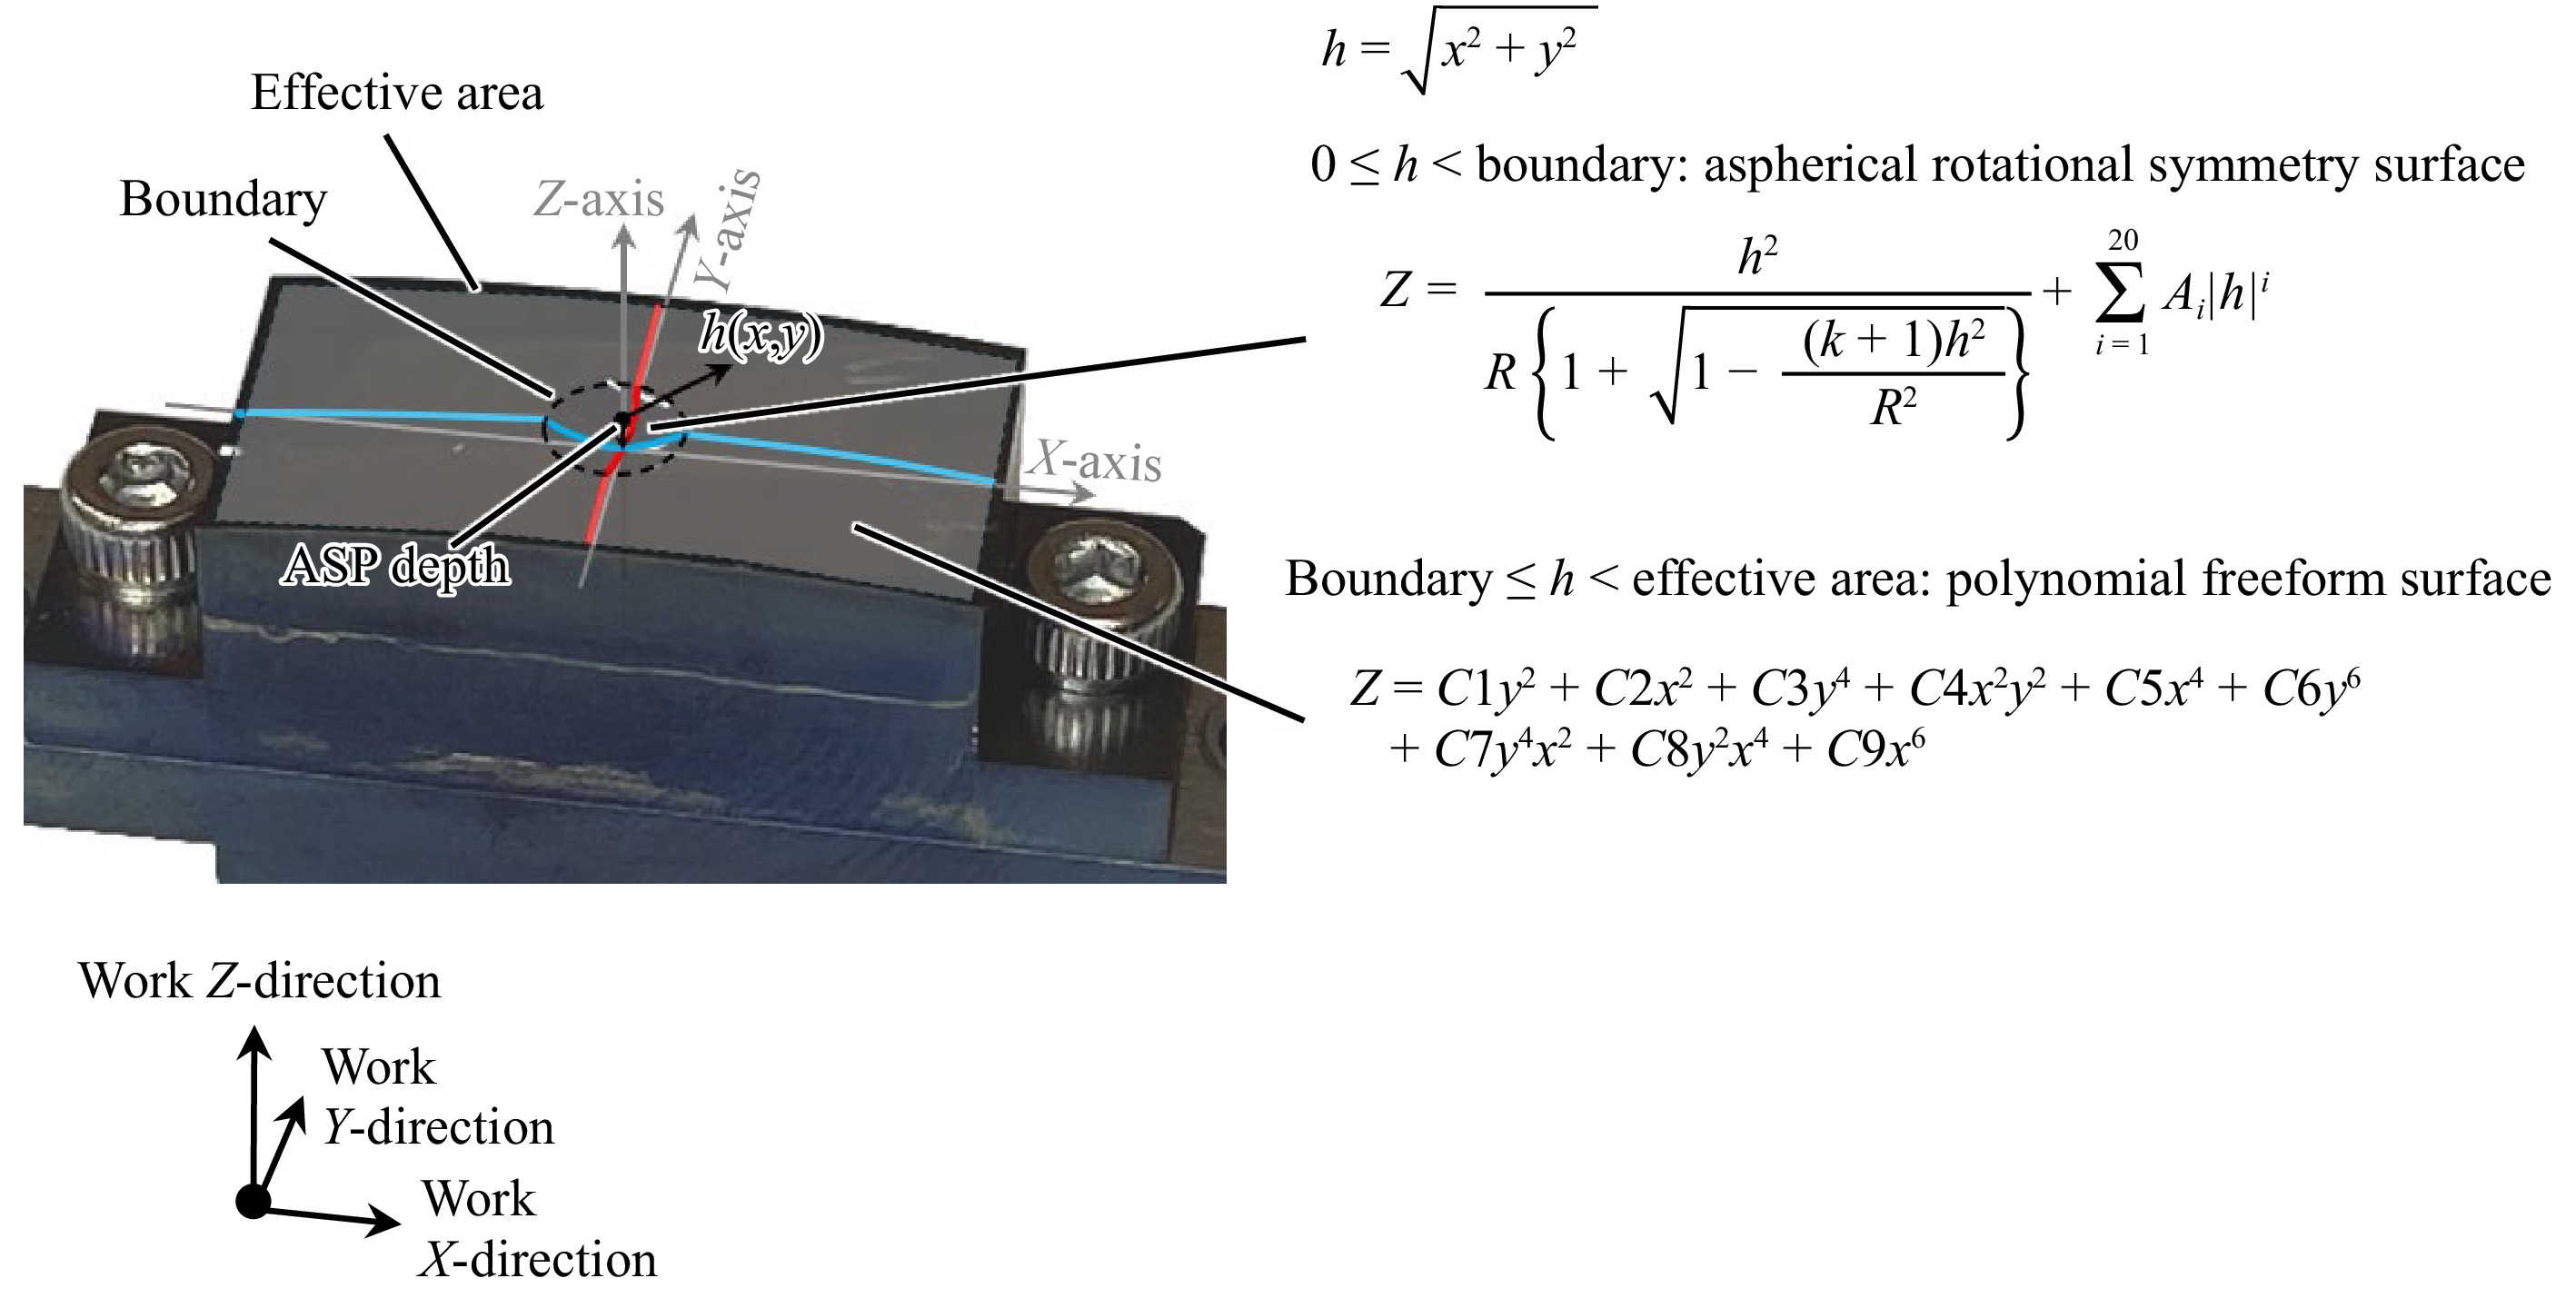
Fig. 7 Design Structure of the workpiece.
ASP part Polynomial freeform R (mm) −4.00270840 C1 −0.0052730 k 0.150 C2 0.0159710 A4 −0.0070 C3 −1.0440 × 10⁻⁵ C4 −2.3290 × 10⁻⁸ C5 3.0110 × 10⁻⁹ C6 −1.0120 × 10⁻¹⁰ C7 9.4910 × 10⁻¹³ C8 −4.7620 × 10⁻¹² C9 −1.0800 × 10⁻¹³ Table 1. Design equations parameters
Boundary radius φ1.5 mm Depth of aspheric part −0.1711566 mm Freeform part effective area 20.0 × 8.0 mm square Table 2. Polynomial + Aspheric part shape boundary conditions
Scan range Method Scan shift Speed Data pitch XY: 18 × 8 mm Raster scan on surface 0.4 mm 1.2 mm/s 0.01 mm Table 3. ASP + Polynomial part surface measurement conditions
Scan range Method Speed Data pitch ±1.6 mm Axes Meas. 0.3 mm/s 0.001 mm Table 4. Std. Sphere embedded in the fixture (ref. Fig.3) axis measurement conditions
-
The '22 algorithm is limited to configurations in which the two optical surfaces face each other across the workpiece. It is therefore not applicable when the optical surfaces are arranged with an out-of-plane rotation of 90°. In contrast, the '24 algorithm augments the processing with automatic synthesis using Euler angles for arbitrary triplets of points in space, and was developed as a hybrid with the conventional approach.
The verification shows that, for all metrics—decenter (Table 5), tilt (Table 6), center thickness (Table 7), and twist angle (Table 8 and Fig. 8)—the differences between the two algorithms are within practical tolerances. Values for the '22 algorithm are quoted from Ref. 6.
Decenter 1st 2nd 3rd 4th 5th Average '22 Algorithm (μm) 11.368 11.196 11.424 11.369 11.064 11.284 '24 Algorithm (μm) 11.339 11.176 11.396 11.339 11.401 11.330 Difference (μm) −0.029 −0.020 −0.028 −0.030 0.337 0.046 Table 5. Comparison decenter between '22 algorithm and '24 algorithm
Tilt 1st 2nd 3rd 4th 5th Average '22 Algorithm (min. angle) 0.383 0.383 0.383 0.367 0.217 0.347 '24 Algorithm (min. angle) 0.398 0.393 0.391 0.383 0.391 0.360 Difference (min.angle) 0.015 0.009 0.007 0.017 0.175 0.013 Table 6. Comparison tilt between '22 algorithm and '24 algorithm
Center of thickness 1st 2nd 3rd 4th 5th Average '22 Algorithm (mm) 16.048 16.048 16.048 16.048 16.048 16.048 '24 Algorithm (mm) 16.048 16.048 16.048 16.048 16.048 16.048 Difference (mm) 0.000 0.000 0.000 0.000 0.000 0.000 Table 7. Comparison center of thickness between '22 algorithm and '24 algorithm
Twist angle (min.angle) Physical angle '22 Algorithm '24 Algorithm 0.0518 0.5500 0.5376 0.0518 0.5833 0.5726 0.0518 0.5667 0.5558 0.0518 0.5667 0.5687 0.0518 0.5667 0.5729 4.3585 3.7167 5.3947 12.0792 11.7667 11.7652 12.0792 11.7667 11.7755 24.1845 23.3667 23.3794 24.1845 23.3833 23.3937 46.5214 45.8333 45.8498 46.5214 45.8333 45.8526 Table 8. Comparison twist angle of physical angle, '22 algorithm and '24 algorithm
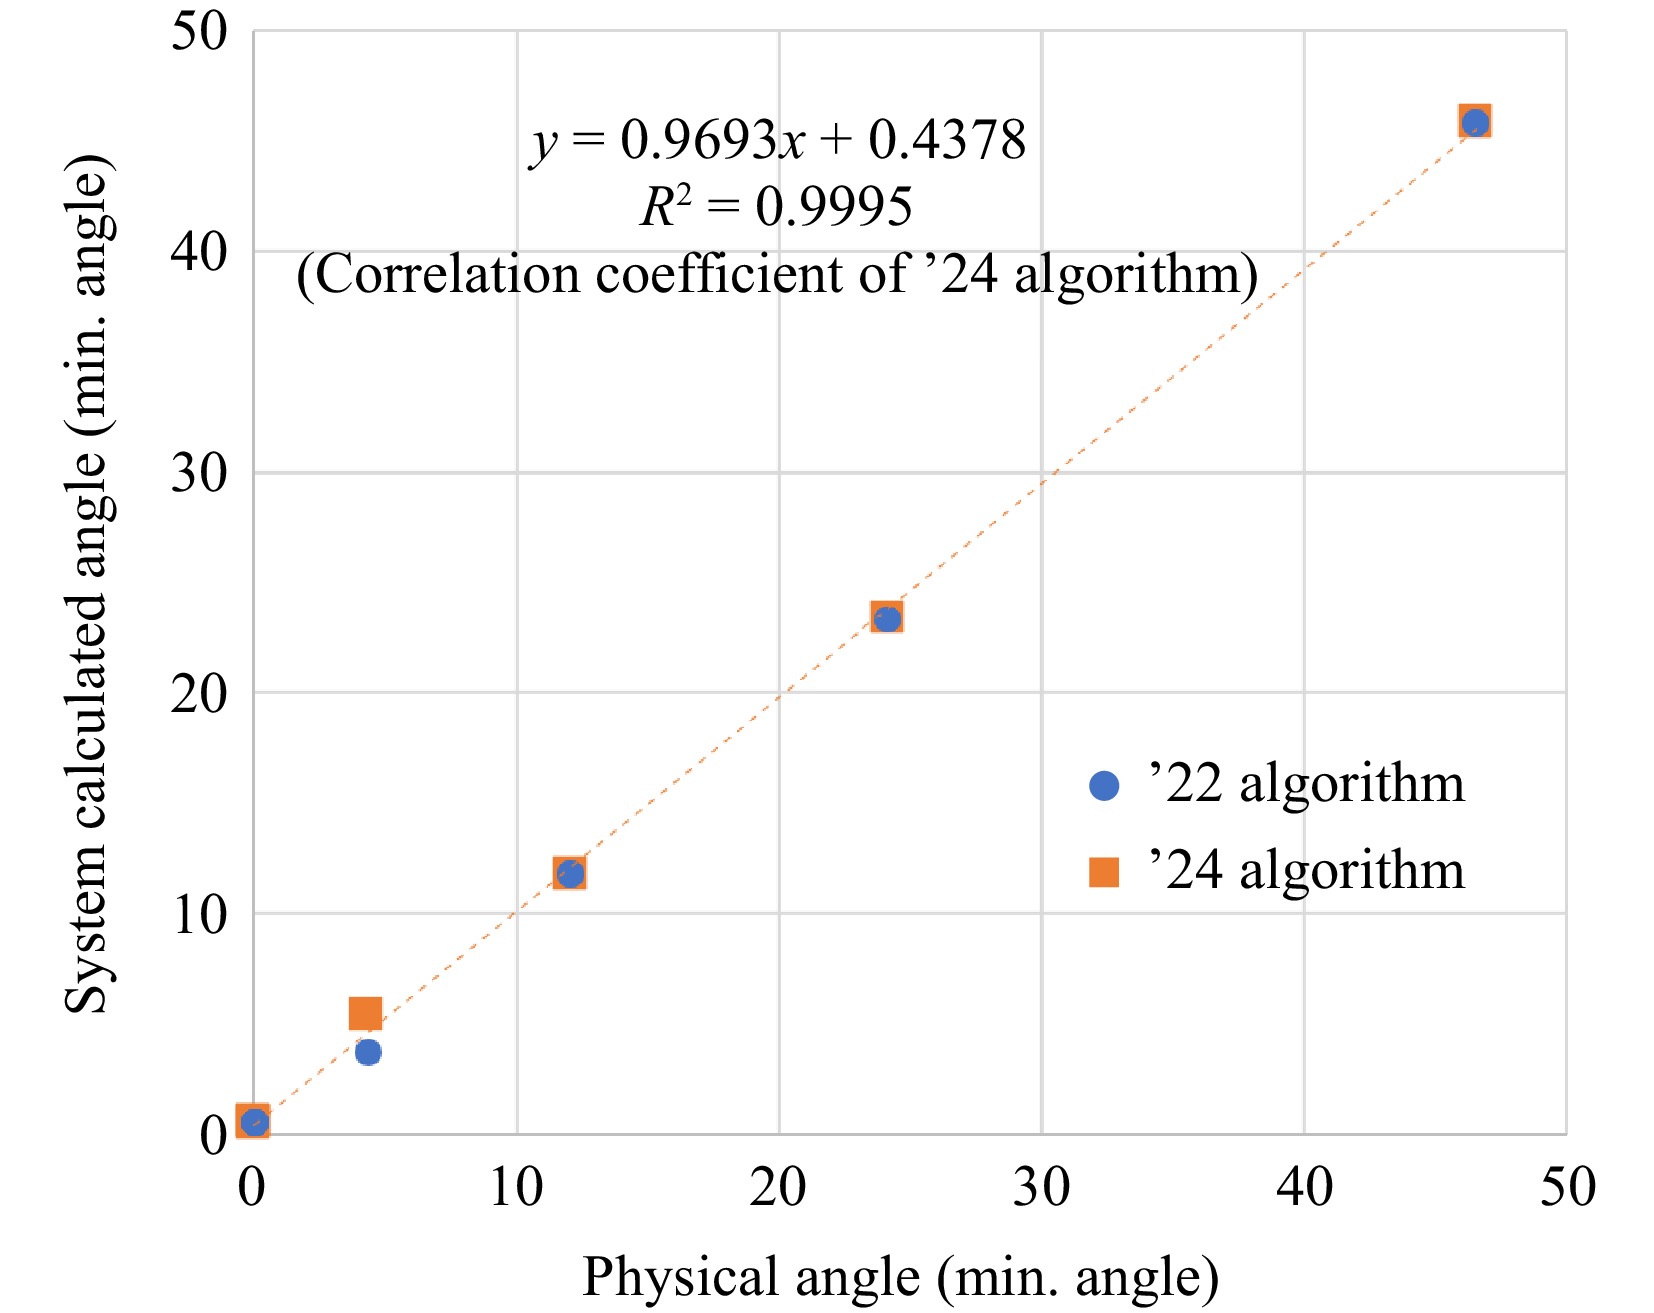
Fig. 8 Graph of correlation between Physical angle and system calculated angle.
-
Because UA3P fundamentally assumes measurement from the top side of the workpiece, the conventional method using the fixture in Fig. 3 is not applicable to elements in which optical surfaces are arranged with an out-of-plane rotation of 90°. We therefore designed the validation workpiece shown in Fig. 9.
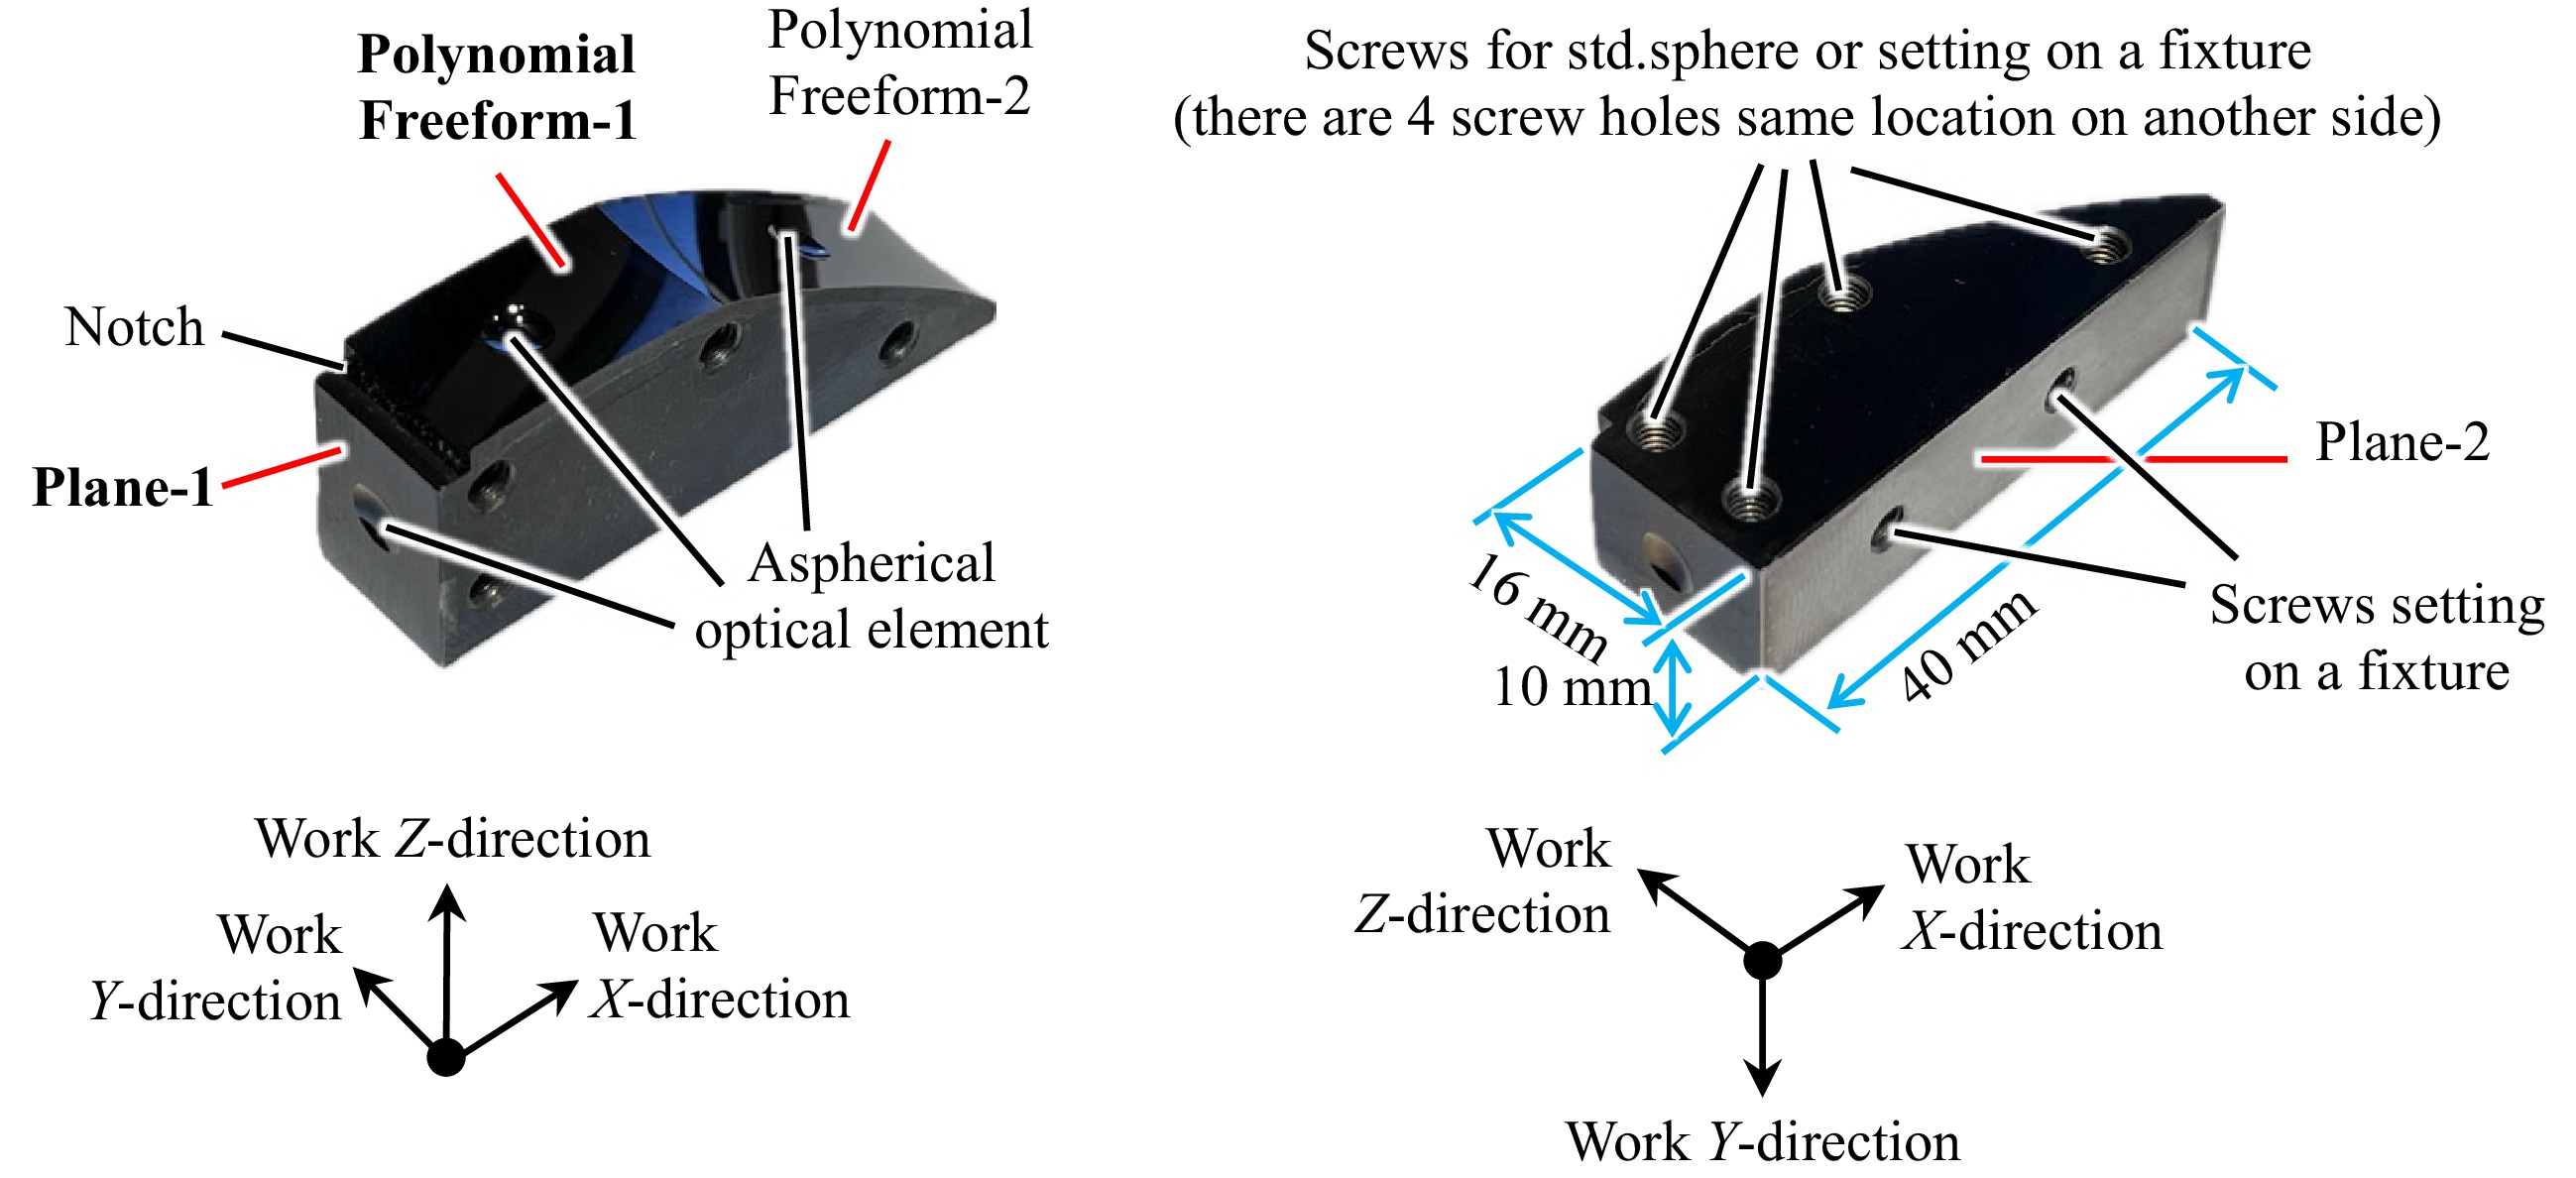
Fig. 9 Polyhedral sample work overview.
The workpiece measures 40 × 16 × 10 mm and carries four optical faces on its periphery—two freeform surfaces and two planar faces. The material is STAVAX, and the part was fabricated by five-axis diamond turning. Freeform-2 is tilted, on average, by 38° out of plane relative to Freeform-1, and Plane-1 is rotated by approximately 90° out of plane with respect to Freeform-1. A notch is provided between Freeform-1 and Plane-1 as a positional reference.
Standard spheres (φ 6.35 mm, silicon nitride, Grade 3) are mounted on φ 3 mm aluminum-alloy shafts and can be fixed into threaded holes on the side faces of the workpiece (Fig. 10).
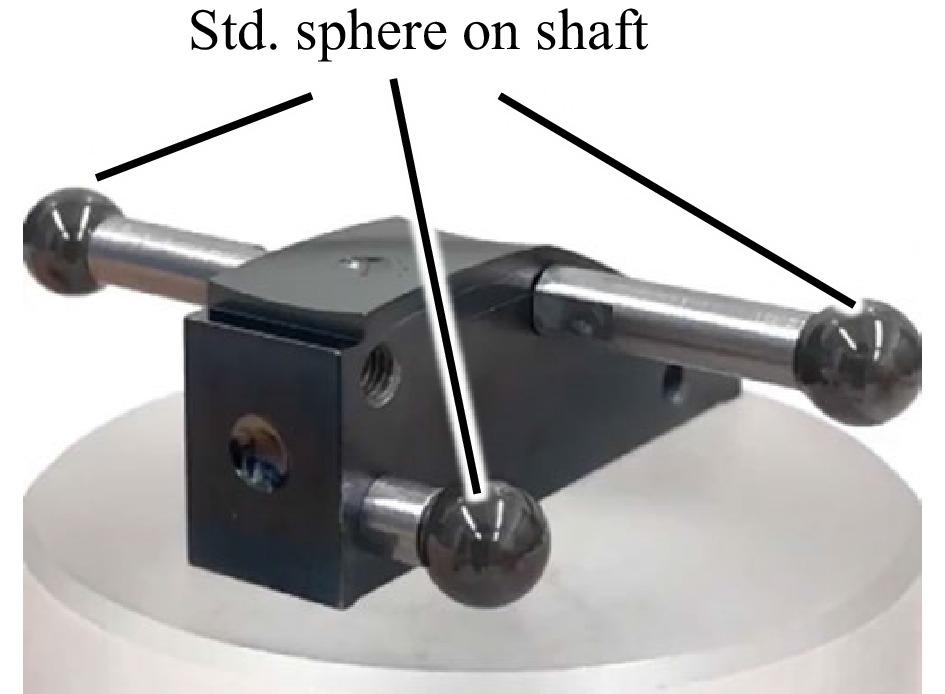
Fig. 10 The work assembled std. sphere.
By varying the shaft length and the mounting positions, the measurement posture can be changed while avoiding interference among the probe, workpiece, shafts, and spheres (Fig. 11).
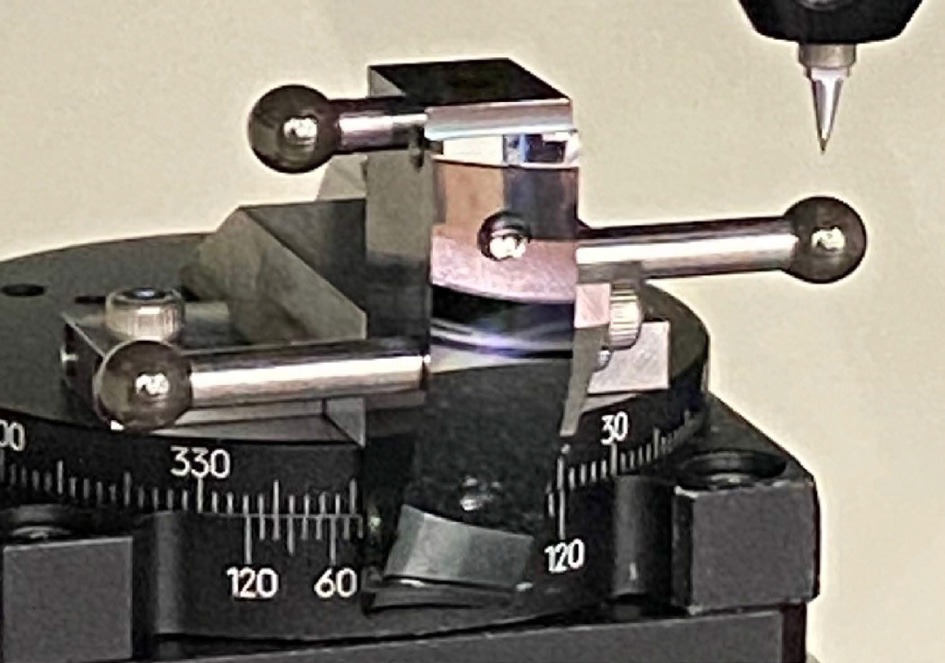
Fig. 11 Example of work attitude for measurement.
-
Freeform-1 and the rotationally symmetric asphere reuse the equation structure employed in Fig. 7 (see Fig. 12). For measurement convenience, the workpiece is installed with a 90° rotation about the Z-axis; however, the optical-surface program and the input coefficients remain unchanged. Machining is referenced to the center of the rotationally symmetric asphere, and the axes of the asphere and freeform regions are made coincident. The equation structure and parameters for Freeform-1 are listed in Tables 9, 10, while the effective area of Plane-1, the parameters of the rotationally symmetric aspheric region contained within it, and the boundary conditions with the plane are presented in Tables 11-13.
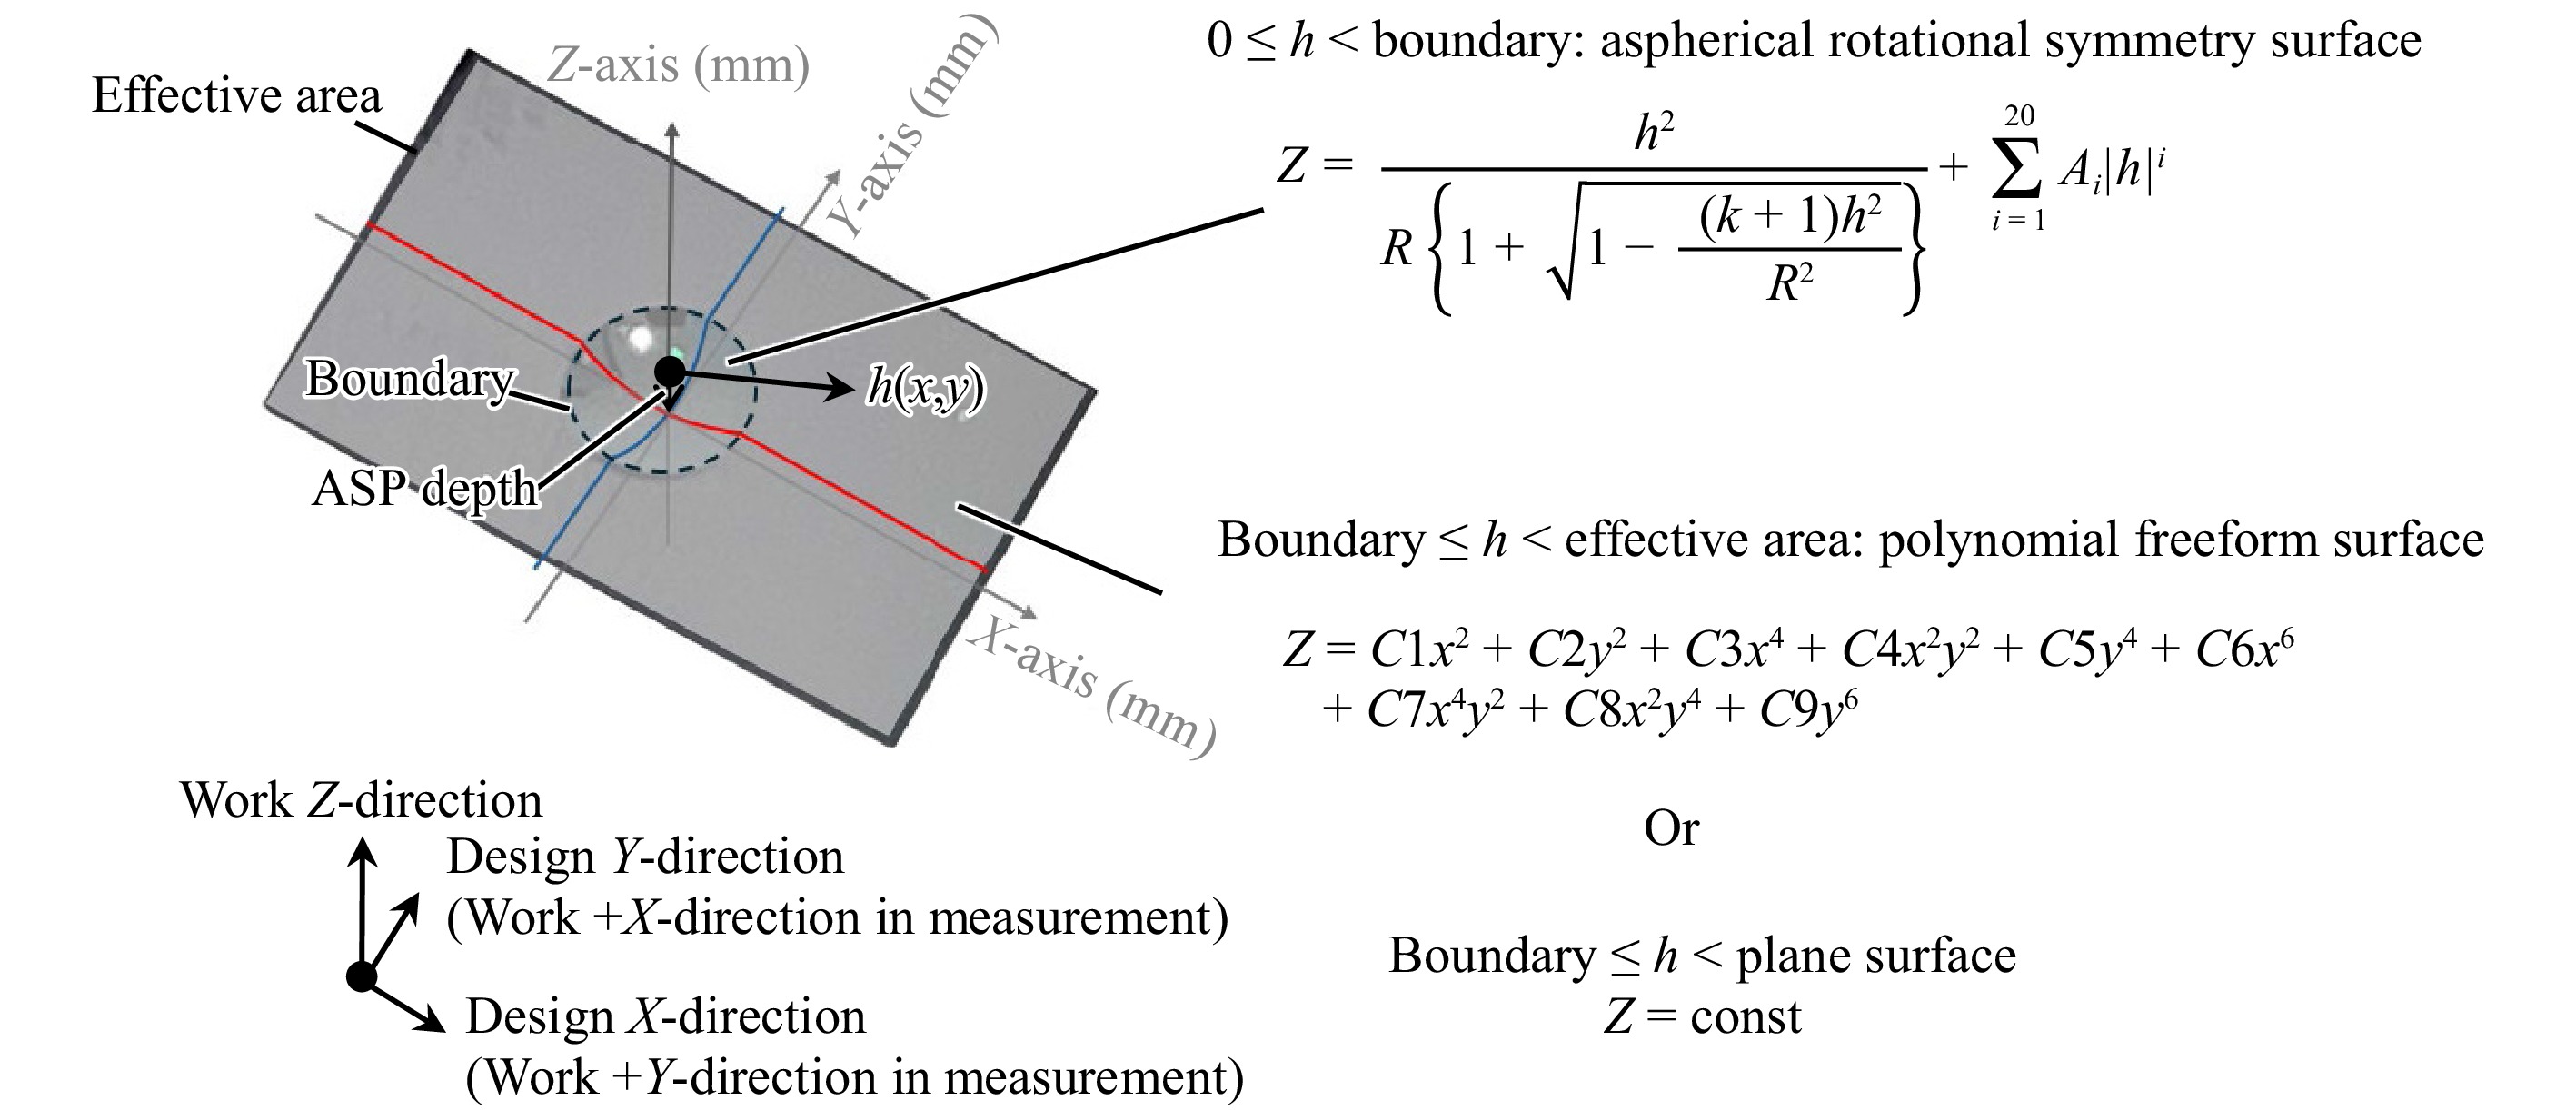
Fig. 12 Design structure of freeform-1 part in Polyhedral work in Fig. 9.
Aspheric part Polynomial freeform R −4.00270840 C1 −0.0052730 k 0.150 C2 0.0159710 A4 −0.0070 C3 −1.0440 × 10⁻⁵ C4 −2.3290 × 10⁻⁸ C5 3.0110 × 10⁻⁹ C6 −1.0120 × 10⁻¹⁰ C7 9.4910 × 10⁻¹³ C8 −4.7620 × 10⁻¹² C9 −1.0800 × 10⁻¹³ Table 9. Design equations parameters for Freeform-1 surface in Fig. 9
Boundary radius φ1.5 mm Depth of aspheric part −0.1740 mm Freeform-1 effective area 15.0 × 8.0 mm square Table 10. Aspherical part shape boundary conditions in Freeform-1 in Fig. 9
Plane-1 effective area 8.0 × 8.0 mm square Table 11. Effective area of Plane-1 in Fig. 9
Aspheric part R −4.00270840 k 0.150 A4 −0.0070 Table 12. Parameter of aspherical part in Plane-1 surface in Fig. 9
Boundary radius φ1.5 mm Depth of aspheric part −0.32387 mm Table 13. Aspherical part shape boundary conditions in Plane-1 in Fig. 9
-
The measurement proceeds as follows:
1. Plane-1 upward: perform centration using the rotationally symmetric asphere as the reference; measure the entire Plane-1 region and the three standard spheres.
2. Freeform-1 upward: again perform centration; measure the entire Freeform-1 region and the three standard spheres.
The measurement conditions for each surface and for the standard spheres are summarized in Tables 14-16, respectively.
Scan range Method Scan shift Speed Data pitch XY: 8 × 8 mm Raster scan on surface 0.2 mm 3.0 mm/s 0.005 mm Table 14. Plane-1 surface measurement conditions
Scan range Method Scan shift Speed Data pitch XY: 14 × 8 mm Raster scan on surface 0.2 mm 3.0 mm/s 0.005 mm Table 15. Freeform-1 surface measurement conditions
Scan range Method Speed Data pitch ±1.6 mm Axes meas. 0.3 mm/s 0.001 mm Table 16. Std. Sphere on an aluminum shaft (ref. Fig.10) axis measurement conditions
-
Fig. 13 illustrates the positional relationship between the reference and evaluation surface data of the workpiece. Figs. 14, 15 summarize the five-evaluation metrics. Gaps observed around the rotationally symmetric aspheric region originate from junctions that were not machined exactly according to the design; these were treated as noise and manually trimmed.
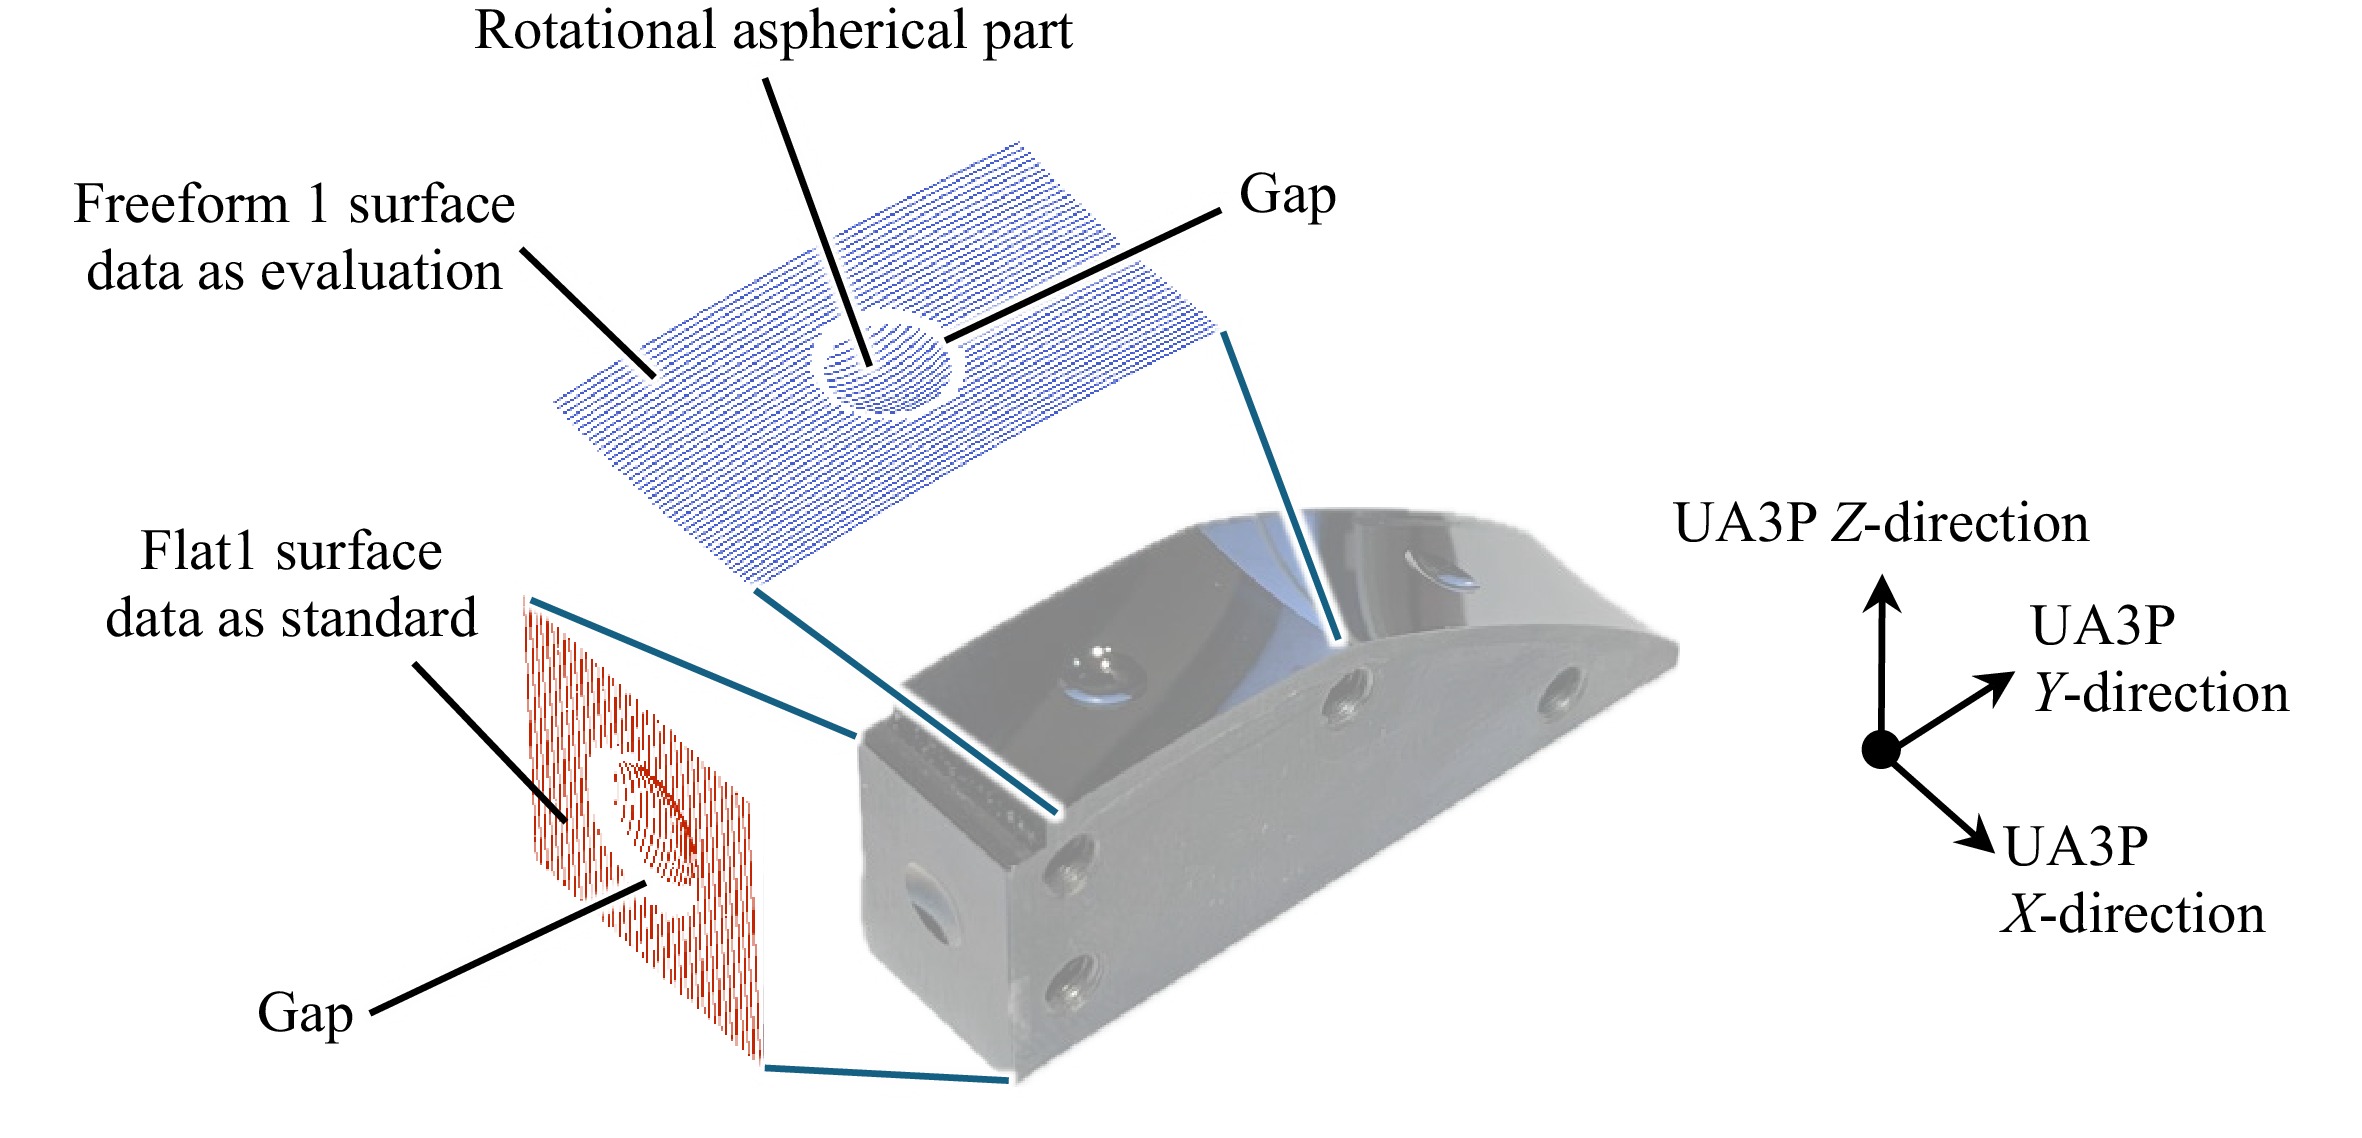
Fig. 13 Data location and coordinate system in UA3P (as 0degree setting).
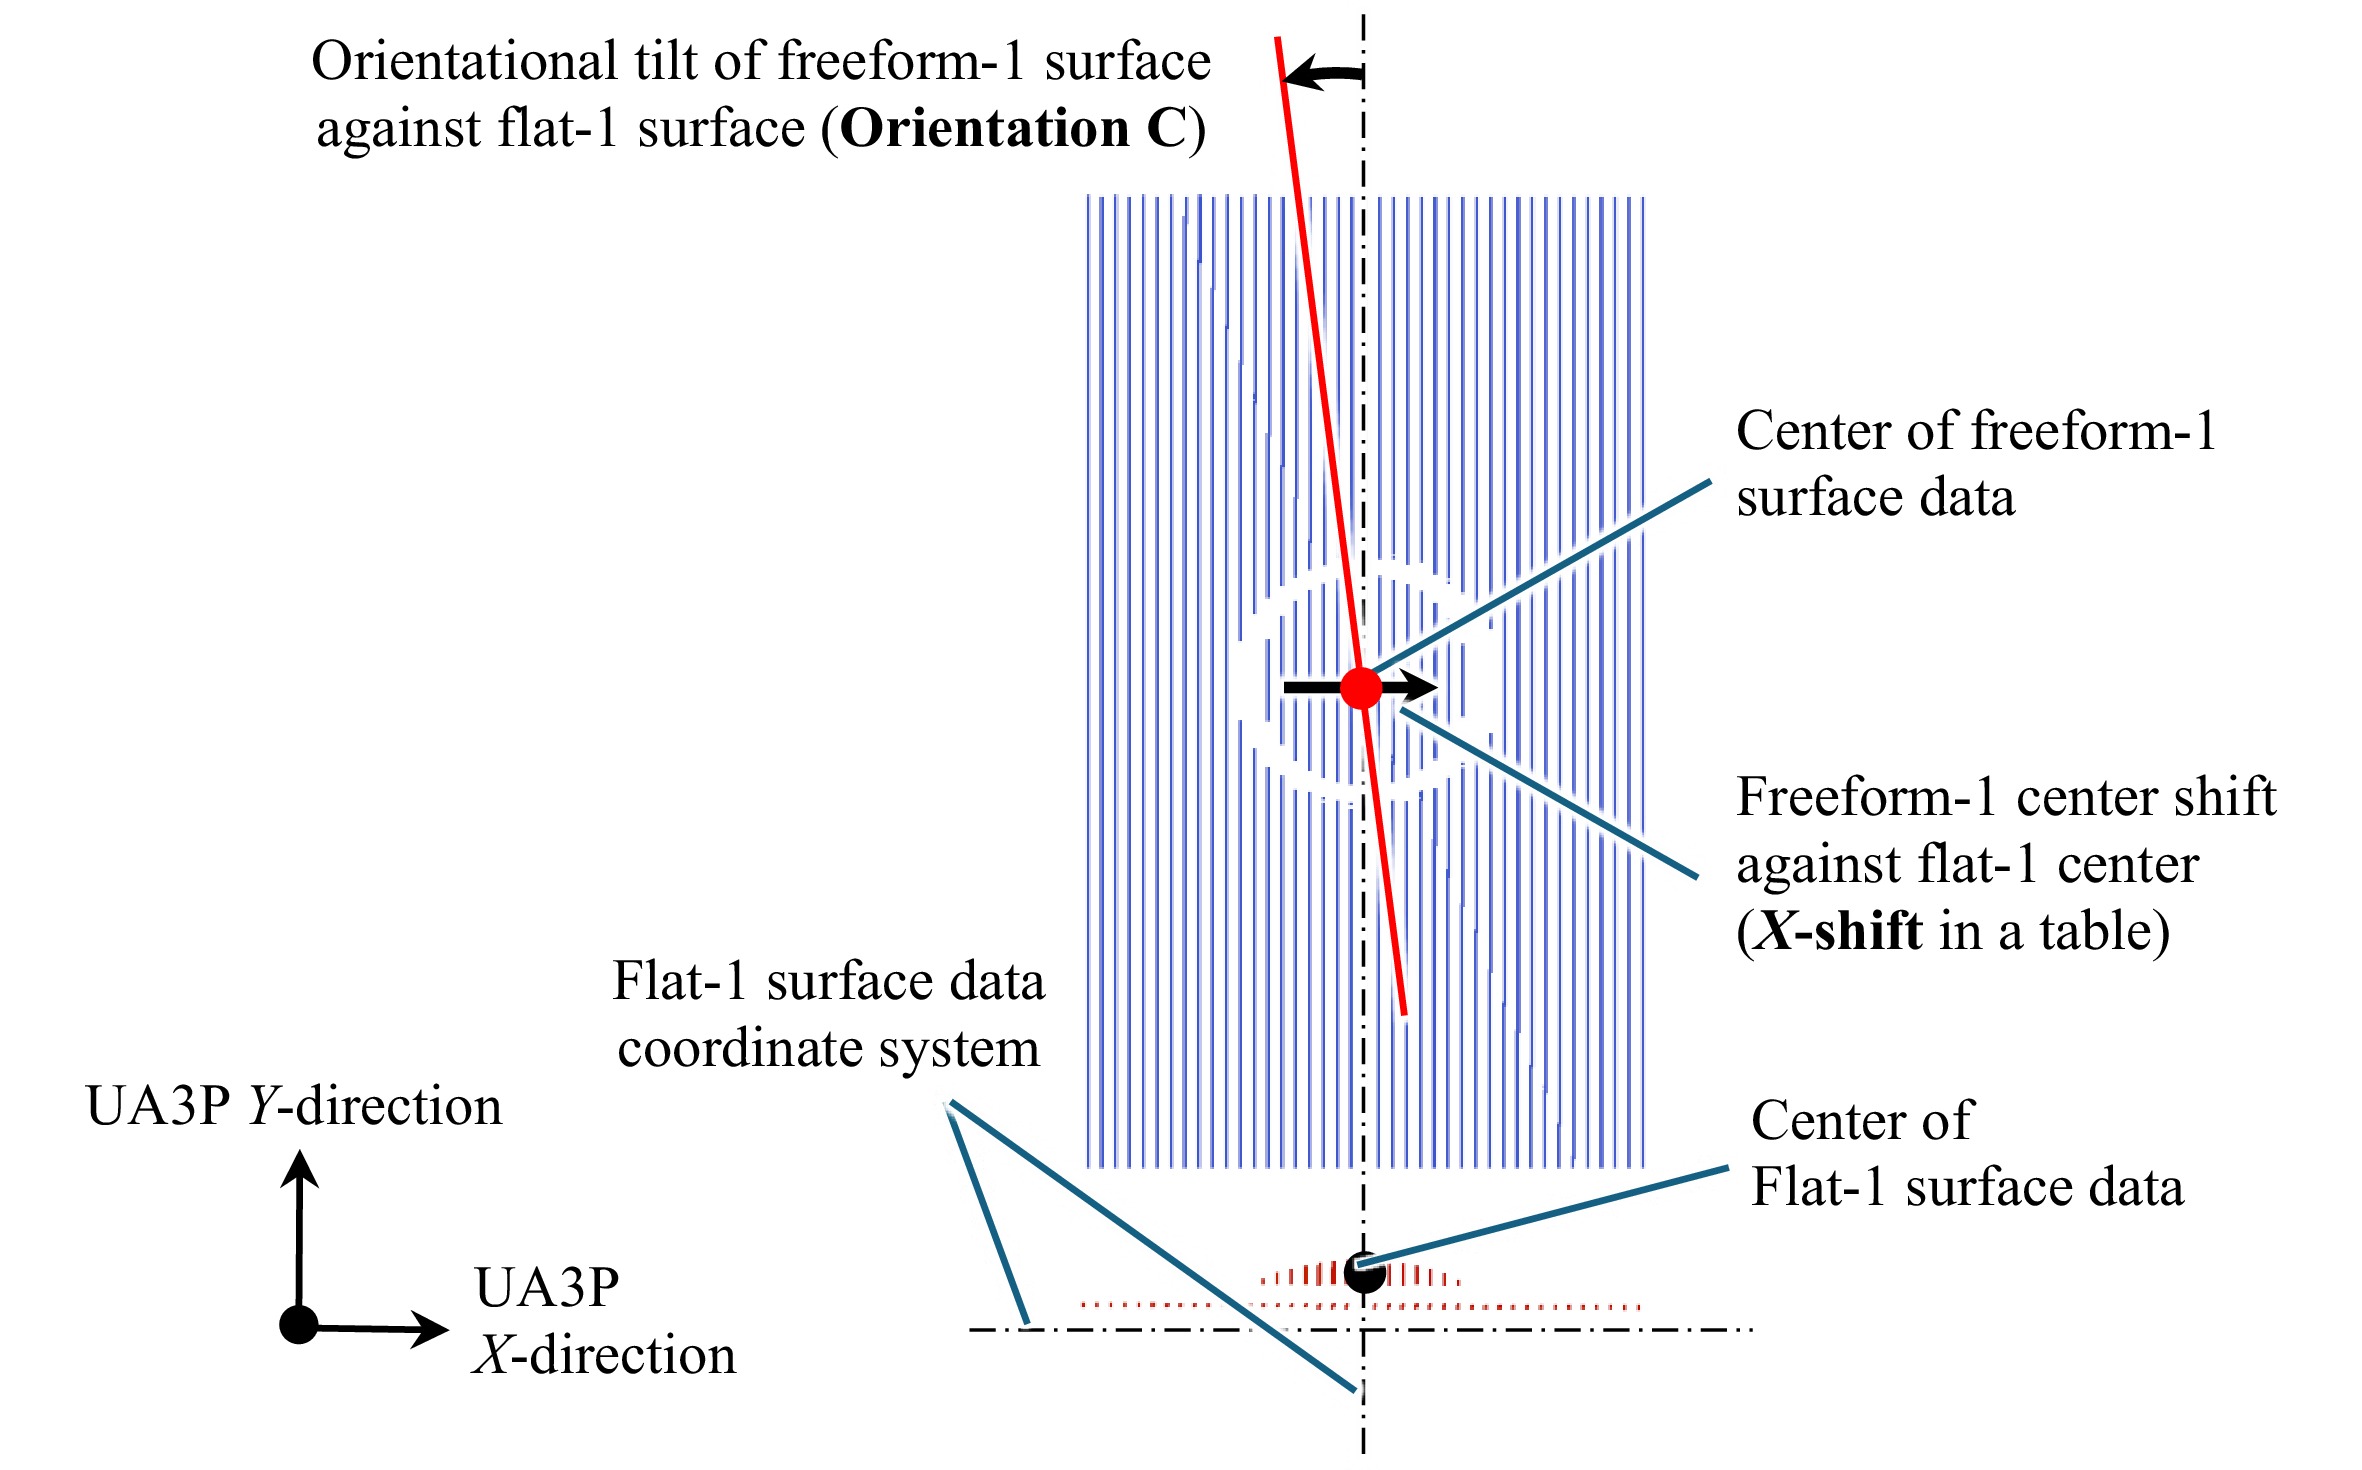
Fig. 14 Data relation from Z top view in UA3P coordinate system.
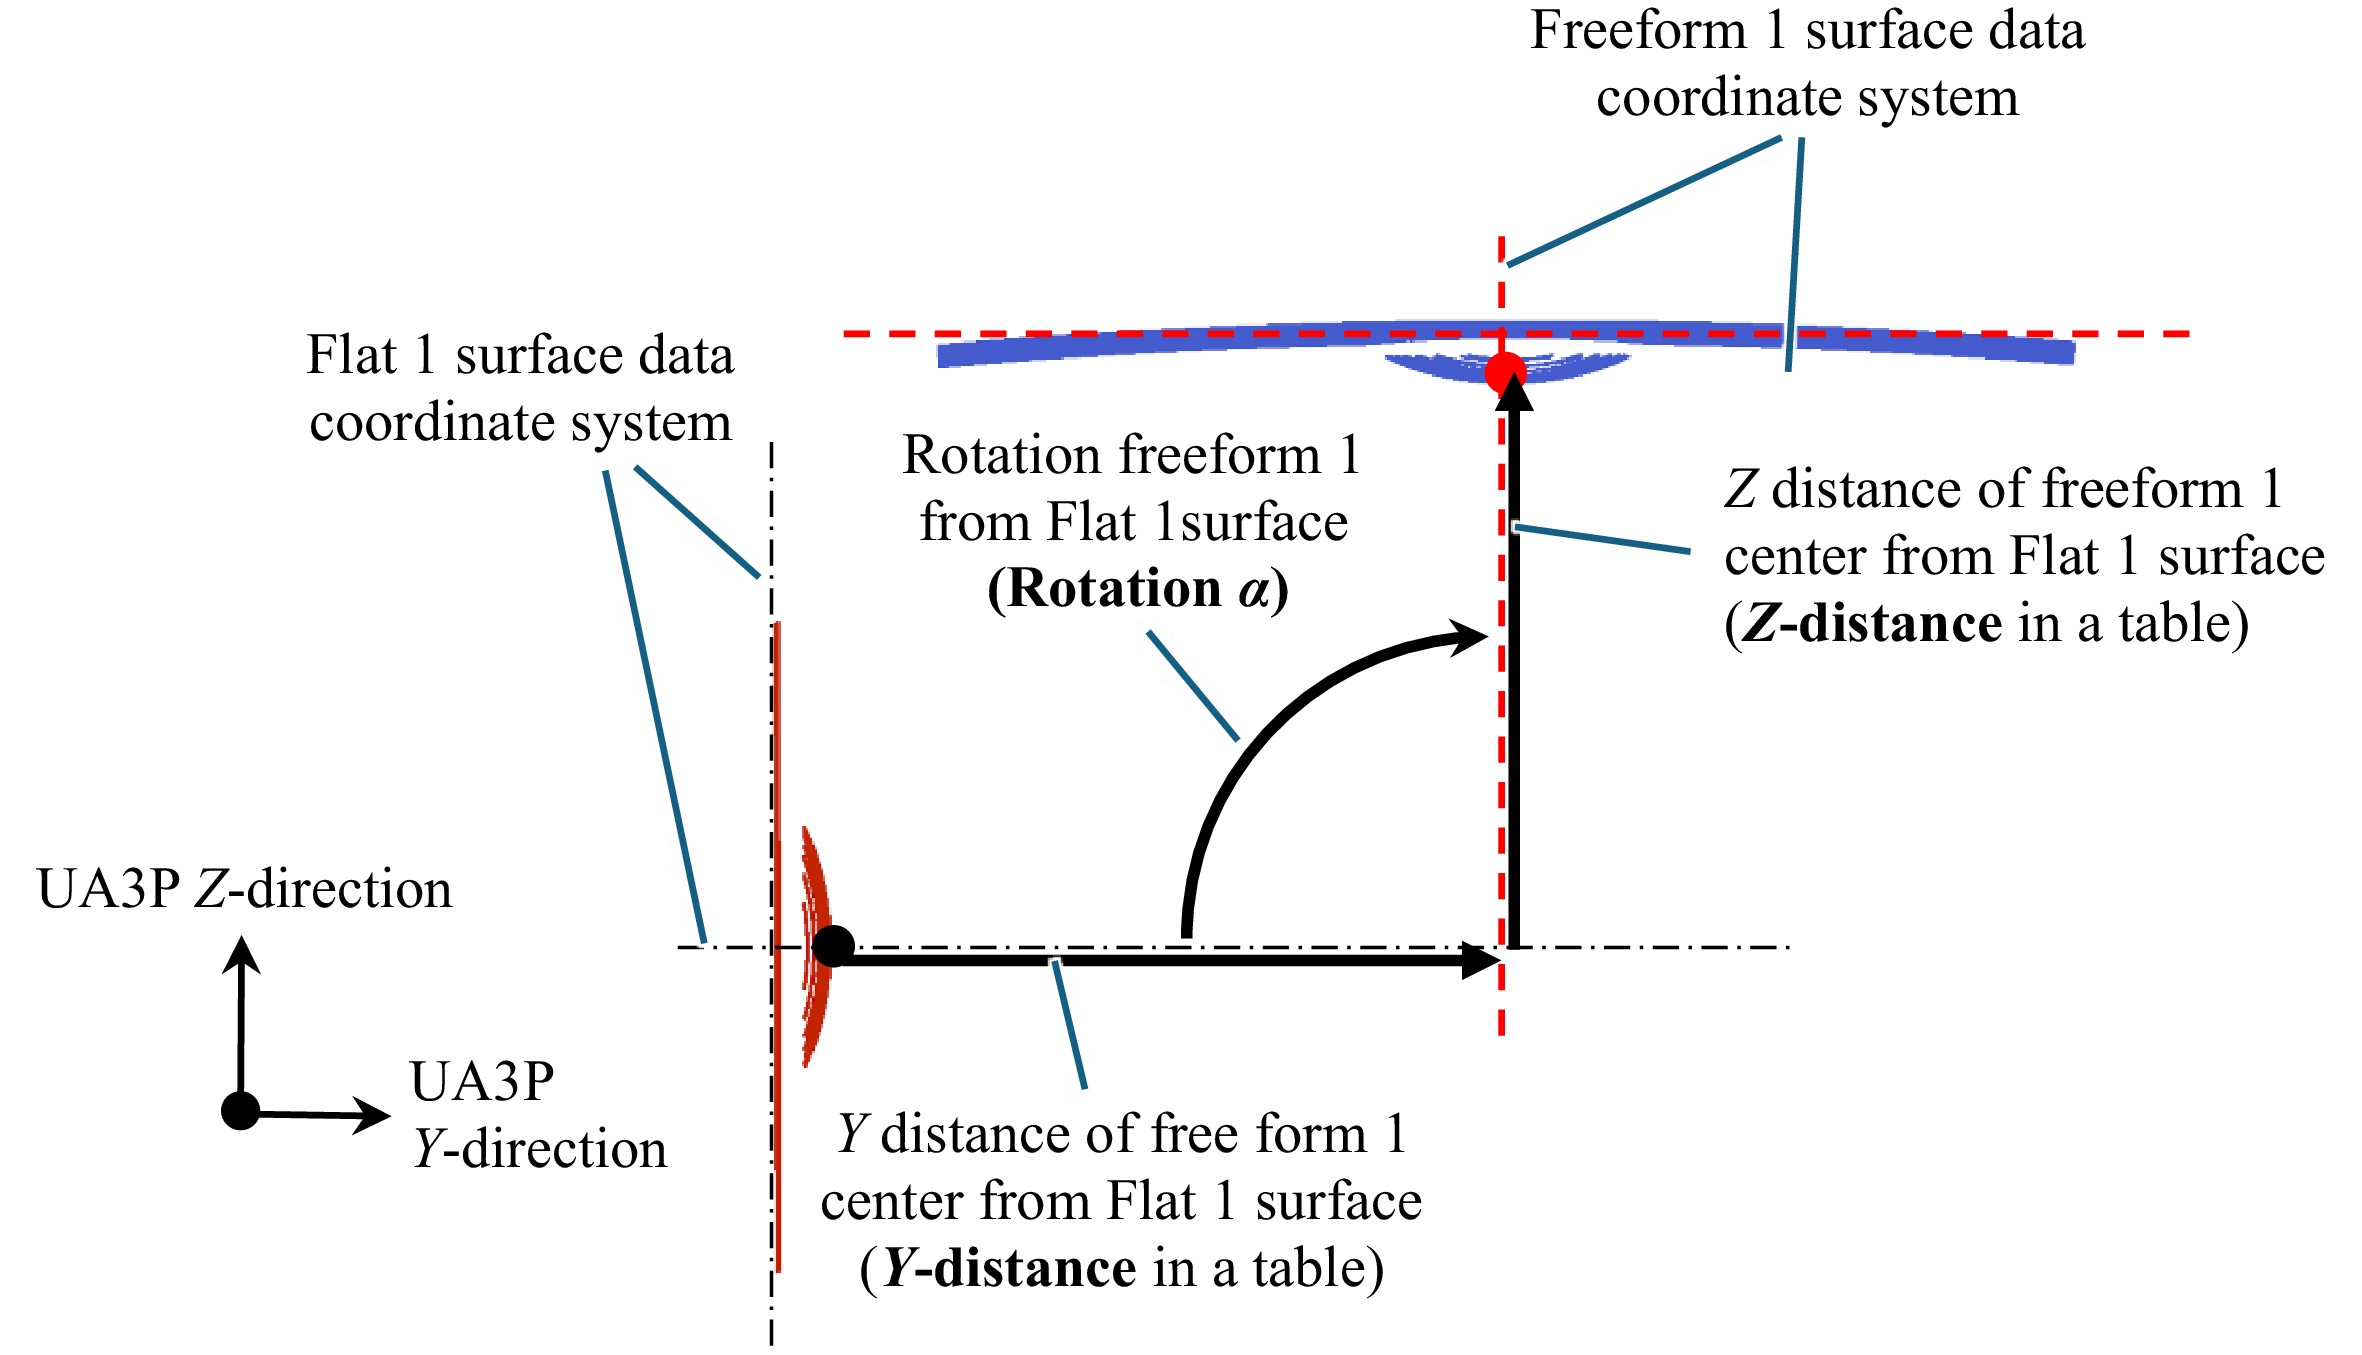
Fig. 15 Data relation from X positive to X negative direction of Fig.13.
-
The workpiece was installed with an angle of approximately 0° relative to the machine coordinate system, and five repeated measurements were conducted. The results are listed in Table 17, showing good stability in both positional and angular evaluations.
Evaluation metrics 1st 2nd 3rd 4th 5th Ave. Std. Dev. X-shift (µm) −6.817 −7.041 −6.851 −6.785 −6.858 −6.870 0.089 Y-distance (µm) 8385.095 8385.112 8385.109 8385.165 8385.160 8385.128 0.028 Z-distance (µm) 6962.252 6962.311 6962.214 6962.150 6962.225 6962.230 0.053 Rotation α (min) 5399.030 5399.019 5399.029 5399.028 5398.991 5399.019 0.015 Orientation C (min) 1.067 1.062 1.044 1.057 1.052 1.056 0.008 Table 17. Freeform-1 surface position repeatability with setting angle 0degree.
The sign convention of the tabulated values corresponds to the arrow directions indicated in Figs. 14, 15.
-
In industrial practice, the installation angle of a workpiece can vary from trial to trial. To evaluate robustness under such conditions, repeatability at arbitrary installation angles (Setting Rot.C) was tested, and results are summarized in Table 18. The sign convention of the tabulated values corresponds to the arrow directions indicated in Figs. 14-16. To avoid the risk of probe drop-off beyond the optical surface, the measurement range of Freeform-1 was restricted to 12 × 8 mm (Table 19). Other measurement conditions were identical to those in Tables 13-15.
Representative angle 0 min 12 min 24 min 36 min 48 min 60 min 75 min 90 min Ave. Std. Dev. Calculated setting Rot. C (min) −1.043 11.223 23.035 35.249 47.002 58.979 73.535 87.672 Evaluation metrics X-shift (µm) −6.817 −7.395 −7.350 −7.893 −7.779 −7.886 −7.807 −7.847 −7.597 0.357 Y-distance (µm) 8,385.095 8,385.060 8,384.982 8,385.197 8,385.253 8,385.215 8,385.203 8,385.107 8,385.139 0.087 Z-distance (µm) 6,962.252 6,962.137 6,962.194 6,962.054 6,962.117 6,962.134 6,962.101 6,962.023 6,962.126 0.068 Rotation α (min) 5,399.030 5,399.042 5,399.016 5,399.054 5,399.049 5,399.064 5,399.054 5,399.059 5,399.046 0.015 Orientation C (min) 1.067 1.050 1.022 0.849 0.866 0.848 0.859 0.814 0.922 0.098 Table 19. Freeform-1 surface position repeatability with each of setting angles.
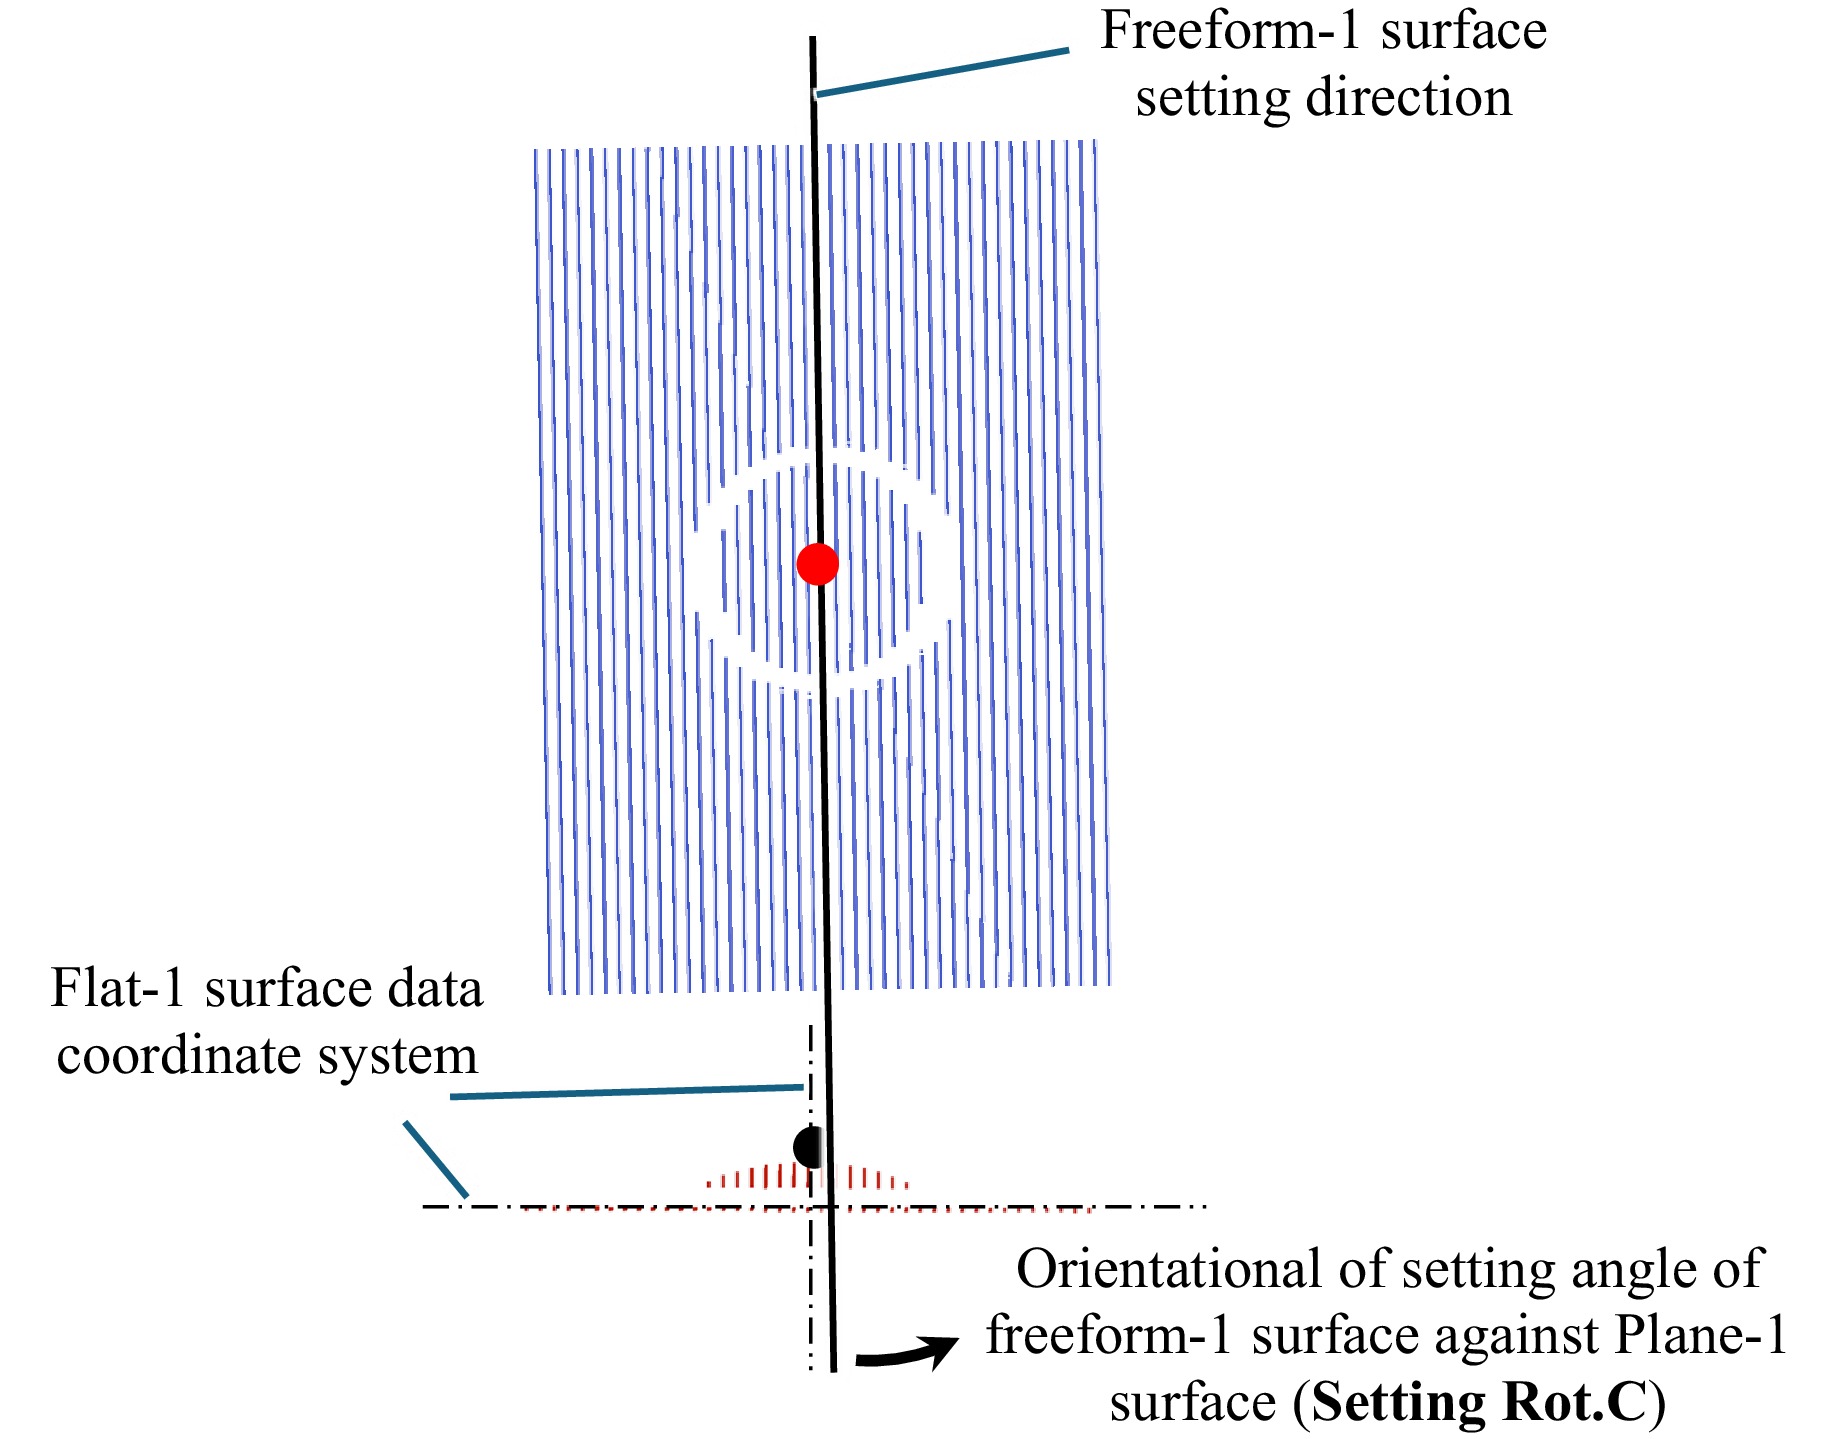
Fig. 16 Setting angle overview from Z top view of Fig. 13.
Scan range Method Scan shift Speed Data pitch XY: 12 × 8 mm Raster scan on Surface 0.2 mm 3.0 mm/s 0.005 mm Table 18. Freeform-1 part surface measurement conditions with Setting Rot.C angle
-
This study extended the applicability of surface position evaluation beyond the conventional method (the '22 algorithm), which was restricted to face-to-face configurations, to include arbitrary orientations such as out-of-plane rotations of 90°.
Performance evaluations yielded the following findings:
• Consistency with the conventional method: High agreement was observed across all indices -decenter, tilt, center thickness, and twist.
•Accuracy and repeatability: Even in tests incorporating installation variability, repeatability was achieved within 0.357 μm deviation and 0.1 min angle rotation, demonstrating practical robustness and reliability.
Future work should address:
• Automated segmentation and processing of junction regions between optical surfaces.
• Implementation of automated measurement and evaluation routines compatible with industrial takt times.
Overall, the UA3P-based surface position evaluation method has established repeatability on the order of 0.3 μm, making it a promising candidate as a standard metrology process for polyhedral freeform prisms. This advancement is expected to make a substantive contribution to high-yield manufacturing and reliability assurance of high-density optical prisms for XR devices.
-
Surface position evaluation of polyhedral prisms using the UA3P system was confirmed to exhibit stable repeatability. By feeding back the obtained inter-surface positional relationships into optical simulations and manufacturing process factors, further improvements in production efficiency can be expected.
Moreover, the method was demonstrated to be applicable to optical-axis evaluation and optical path-length simulation of lens-integrated triangular prisms (called Power Prism Fig. 17), which are anticipated to see increasing demand in smartphone applications.
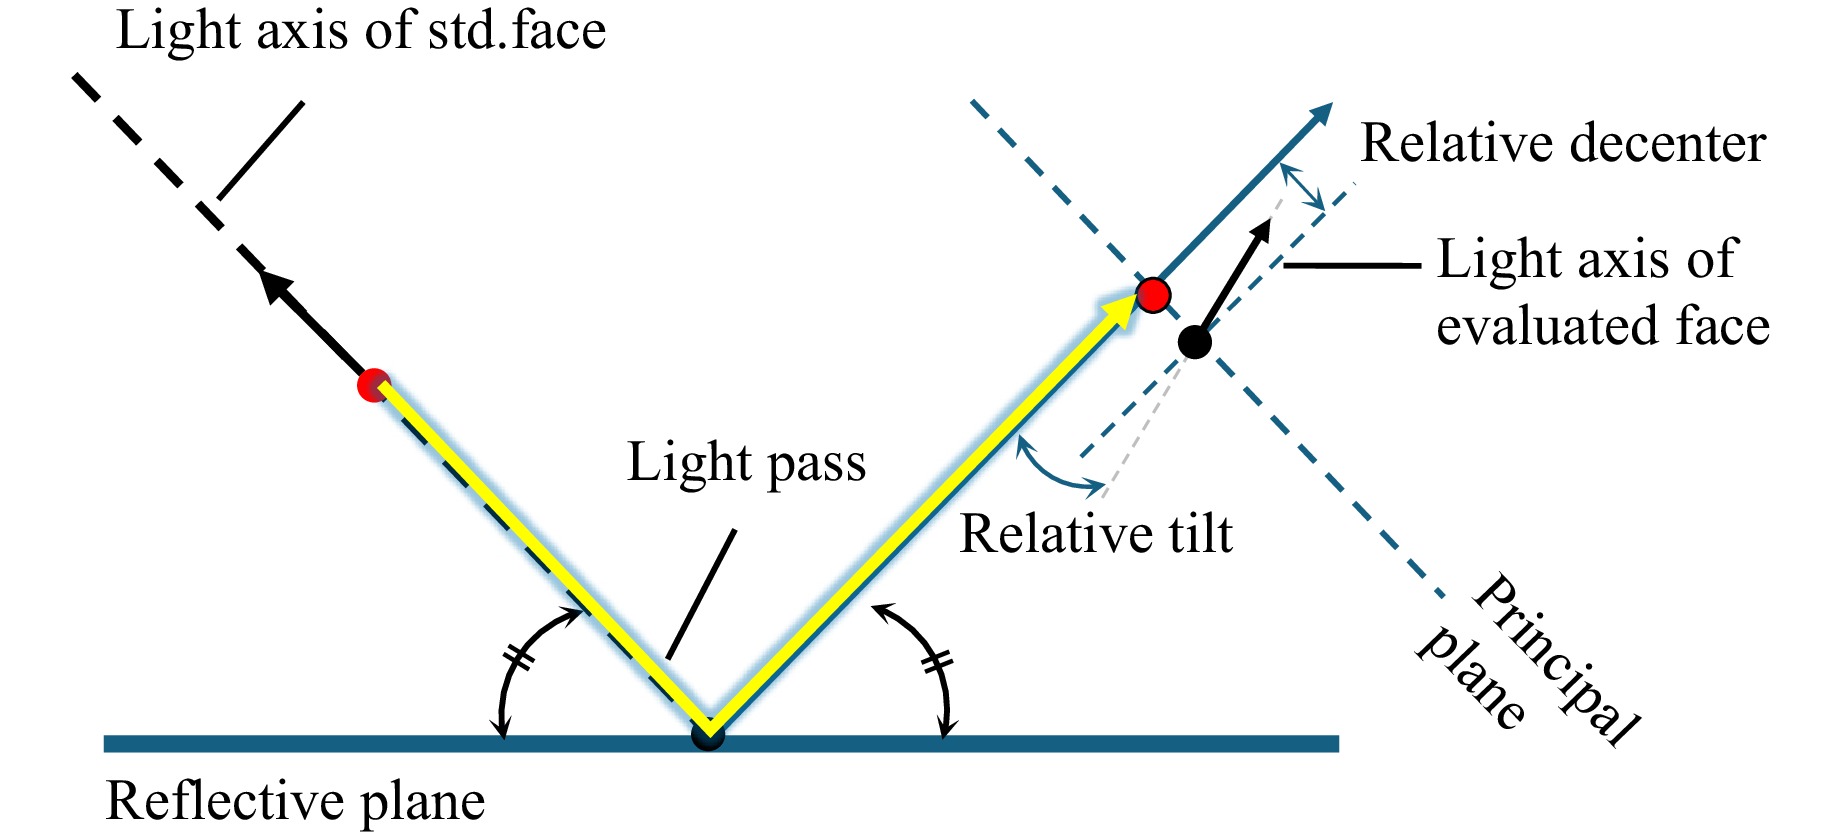
Fig. 17 Example of application for power prism evaluation for smartphone
These results indicate that the proposed approach will make a significant and practical contribution to the development and mass production of polyhedral freeform prism optics for industrial applications.
-
The authors would like to thank the members of Panasonic Production Engineering Co., Ltd. for their technical support and valuable discussions related to this work.
Development of a surface position evaluation method for polyhedral freeform prisms
- Light: Advanced Manufacturing , Article number: 34 (2026)
- Received: 02 July 2025
- Revised: 17 January 2026
- Accepted: 09 February 2026 Published online: 03 June 2026
doi: https://doi.org/10.37188/lam.2026.034
Abstract: With the rapid growth of extended-reality (XR) devices, simultaneously achieving long optical path length and miniaturization has become a central challenge in optical system design. One promising approach is to employ optical designs that utilize multiple internal reflections in a prism to extend the path length within a compact volume. The prisms targeted in this study are polyhedral elements composed of three or more optical surfaces including freeform surfaces, in which two lateral faces are mutually parallel. A representative example is a triangular prism whose optical faces are replaced by freeform surfaces. Because such prisms contain multiple reflecting faces, their inter-surface positional relationships must be formed and maintained with high accuracy; consequently, metrology capable of precise evaluation of face-to-face position is indispensable for production. Since 2002, Panasonic has introduced to the market inter-surface misalignment evaluation of lens surfaces using the ultra-high-accuracy three-dimensional profilometer UA3P, contributing to higher-precision camera modules. Building on that platform, the present work develops a new measurement method that extends the UA3P system to prisms with multiple reflecting faces, enabling spatial registration to be evaluated with an accuracy of 0.2–0.3 µm. The developed system shows strong correlation with existing methods and validated repeatability, demonstrating its suitability for high-precision manufacturing and quality assurance of optical elements, including prisms for XR devices.
Rights and permissions
Open Access This article is licensed under a Creative Commons Attribution 4.0 International License, which permits use, sharing, adaptation, distribution and reproduction in any medium or format, as long as you give appropriate credit to the original author(s) and the source, provide a link to the Creative Commons license, and indicate if changes were made. The images or other third party material in this article are included in the article′s Creative Commons license, unless indicated otherwise in a credit line to the material. If material is not included in the article′s Creative Commons license and your intended use is not permitted by statutory regulation or exceeds the permitted use, you will need to obtain permission directly from the copyright holder. To view a copy of this license, visit http://creativecommons.org/licenses/by/4.0/.

 DownLoad: