





HTML
-
Diamond possesses exceptional physical properties, including a high bulk modulus and extreme mechanical hardness, enabling its use in a wide range of environments1. Accordingly, diamond is well suited to extreme conditions that may involve high pressure, high temperature, physical abrasion, chemical harshness, and radiation exposure. Embedding functional structures within diamond extends the applicability of techniques to environments that were previously inaccessible. Metallic nanoparticles (NPs) are an example of one such embeddable structure capable of enabling enhanced light-matter interactions in harsh environments across a range of fields such as photocatalysis, photovoltaics, and quantum sensing.
Surface-enhanced Raman spectroscopy (SERS) is a notable example which utilises NP plasmonic interactions. This technique allows trace-level chemical identification of complex sample compositions. However, conventional SERS measurements are restricted to laboratory environments owing to the fragile nature of plasmonic nanostructures. NPs are commonly fabricated on paper or opaque silicon surfaces, where the NPs are exposed to analyte2,3. These substrates suffer from longevity issues owing to a lack of multi-measurement capabilities and short shelf lives. Therefore, to enable SERS applications in real-world environments and to increase substrate longevity, a robust and chemically stable plasmonic substrate is required. Some progress towards this goal has been made with steel wire mesh4, SiO2 coatings5, nickel foam cages6, copper foam coatings7, and boron nitride coatings8. Each of these approaches addresses aspects of SERS fragility; however, a fully all-round substrate which is physically, chemically, and thermally robust is yet to be reported.
A few studies have reported overgrowing common metallic NPs of Ag and Au with diamond for alternative applications. Ag-NPs have been embedded in diamond films by both Li et al. and Bellucci et al. with NP diameters ranging from 10 to 500 nm and diamond films 20–400 nm thick for photocatalytic activity9,10, quantum-based sensing11, and film colour tunability12. The incorporation of plasmonic NPs provided much stronger light-matter interactions, as desired for these specific applications. Seeded growth on both Si9,11 and quartz12 substrates was performed by Li et al., overgrowing Ag-NPs of diameters 10–500 nm, with diamond films in the range of 20–250 nm. Bellucci et al. reported Ag-NP overgrowth on a diamond substrate with 45−65 nm diameter NPs and a 410 nm thick diamond film10. Despite different substrate and growth conditions, both Li et al. and Bellucci et al. reported increased graphitic impurities in films grown with Ag-NPs. As for Au-NPs, Nicely et al. reported encapsulation in boron-doped diamond films for NPs with a diameter of 100–500 nm13. Overall, while successful in other applications, previous studies encapsulating both Ag- and Au-NPs in diamond films were too thick for the enhancement of the field surface projection required for SERS analyte interactions. In addition, a direct comparison of the diamond growth interactions around Au and Ag would be beneficial for further plasmonic diamond studies.
Despite its application to other plasmonic interactions, one which has yet to be explored within diamond films is SERS. Exposed NPs have been paired with diamond surfaces without encapsulation for SERS14−16. In these cases, the addition of diamond provided a further plasmonic enhancement of the Raman signals. However, NPs are still exposed and hence vulnerable to degradation. The fabrication of plasmonic NPs within the diamond film could provide NP protection, negating longevity issues which have thus far prevented real-world applications. This paper presents a novel investigation of common plasmonic materials (Ag and Au) encapsulated in thin diamond films. Examining their compatibility with thin-film diamond growth and their ability to produce previously unexplored robust diamond SERS.
The relevant enhancement occurs at the diamond-air interface where the analyte is located. Therefore, three parameters govern the strength of the interaction: the distance from the plasmon dipole to the diamond–air interface (diamond film thickness), NP material, and NP diameter. It is also important to compare the compatibility of different NPs with the diamond growth process, as the resulting film quality will affect the final enhancement.
In this study, both Ag- and Au-NPs buried in diamond films were investigated, with diameters of ~10 nm and ~30 nm, respectively, for comparison. Substrate fabrication was performed by annealing the deposited metallic films into NPs using an H2 plasma treatment. Subsequently, diamond was grown around the NPs using microwave plasma chemical vapour deposition (MPCVD) before the diamond film thickness was reduced via reactive ion etching (RIE). The substrates were tested for SERS enhancement with various NP properties and diamond film thicknesses. Investigation of diamond growth interactions around Ag- and Au-NPs was undertaken to understand the material suitability with respect to fabrication.
-
The following three substrate fabrication variables were investigated: diamond film thickness, NP material (Ag or Au), and NP size. ~10 nm and ~30 nm NPs were fabricated using both Ag and Au to investigate the optimal fabrication parameters. Fig. 1 illustrates the substrate-fabrication process. Metallic films deposited on single-crystal diamond (SCD) were subsequently annealed into NPs, followed by diamond epilayer growth to facilitate encapsulation and finally etching to reduce the film thicknesses ($ t $). NP sizing for Ag (Fig. 1a, c) and Au (Fig. 1b, d) was controlled by varying the thickness of the deposition of the metallic film, with thicker films resulting in larger NP diameters ($ d $).
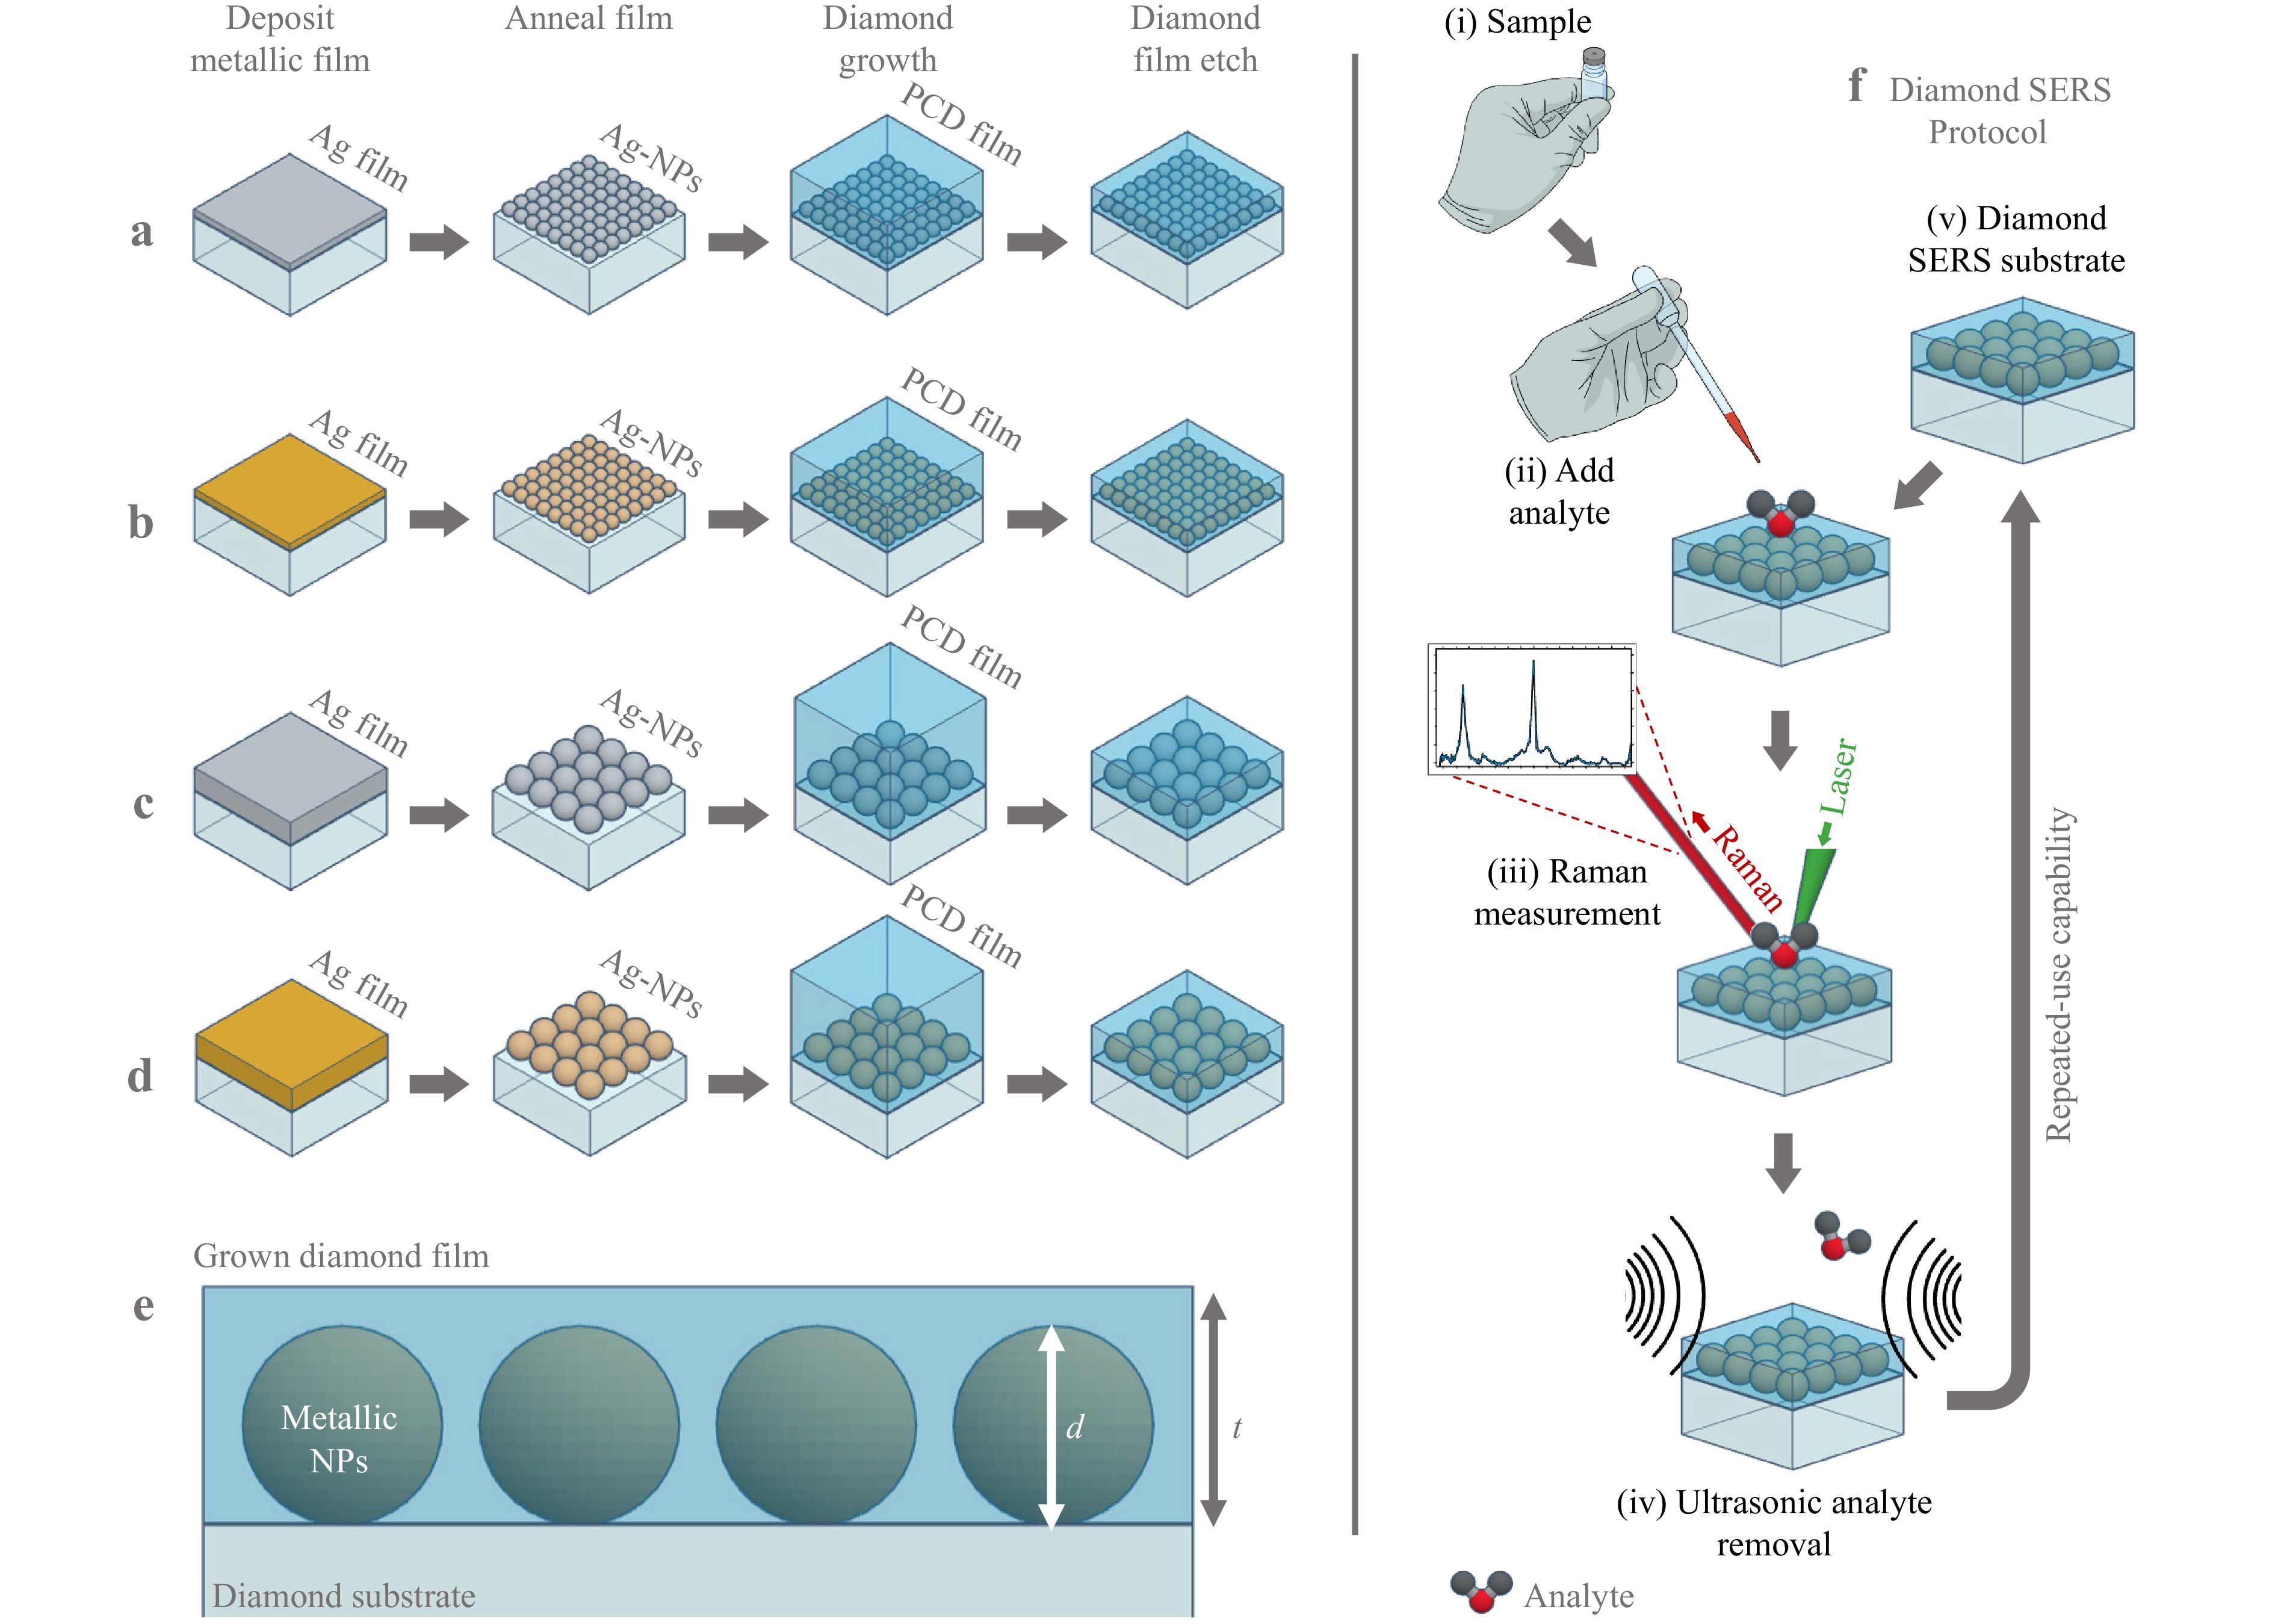
Fig. 1 Diamond SERS substrate fabrication process flow. Fabrication process for a 10.4 nm Ag-NP substrate, b 11.0 nm Au-NP substrate, c 29.6 nm Ag-NP substrate, and d 27.1 nm Au-NP substrate. Single crystal diamond (SCD) substrates undergo deposition of a thin film of Au or Ag of varying thicknesses to control NP sizing, H2 plasma annealing to form NPs, polycrystaline diamond (PCD) film overgrowth and, finally, diamond film etching. e Cross-section depiction of desired substrate fabrication, where d is NP diameter and t is grown diamond film thickness. f Depicts the diamond SERS measurement protocol whereby (i) analyte must be sampled and (ii) added to the diamond SERS substrate. (iii) Raman spectroscopy measurements may be performed before (iv) removal of the analyte via sonication. The cleaned diamond SERS substrate (v) can then be reused by adding, measuring, and removing the analyte for repeated-use capability.
The diamond SERS measurement protocol is shown in Fig. 1f, where (i) analyte must be collected and (ii) added to the diamond SERS substrate. (iii) Raman spectroscopy measurements may be performed before (iv) removal of the analyte via sonication. The cleaned diamond SERS substrate (v) can then be reused by adding, measuring, and removing the analyte.
-
A 4.2 nm Ag film was dewetted to form NPs with a mean diameter of 10.4 ± 0.3 nm and an interparticle distance of 5.5 nm. A second Ag film deposition of 9.4 nm and subsequent anneal produced larger NPs within the desired size range, with a mean diameter of 29.6 ± 0.6 nm and an interparticle gap of 12.5 nm. For Au, a 3.4 nm film was deposited, resulting in a mean NP diameter of 11.0 ± 0.3 nm and interparticle distance of 6.3 nm. Finally, a thicker Au film of 8.5 nm was dewetted to a mean NP diameter of 27.1 ± 1 nm and an interparticle distance of 9.9 nm. Table 1 lists the final fabrication parameters for the metallic NPs.
Metal Ag Au Film thickness (nm) 4.2 9.4 3.4 8.5 Median NP diameter (nm) 10.4 29.6 11.0 27.1 Median interparticle distance (nm) 5.5 12.5 6.3 9.9 Table 1. NP fabrication results.
When analysing the results, a correlation between the NP diameter and the interparticle distance was noted. Owing to the dewetting mechanism, an increased NP size provides an increased interparticle distance. Given the metallic film dewetting mechanisms on a flat substrate, NPs with a uniform size distribution were produced across the entire substrate. To obtain the median NP diameter, an array of scanning electron microscopy (SEM) images was analysed, and the collated data are presented in Fig. 2. Atomic force microscopy (AFM) scans of the fabricated Ag- and Au-NPs are given in Fig. 3 prior to diamond growth.
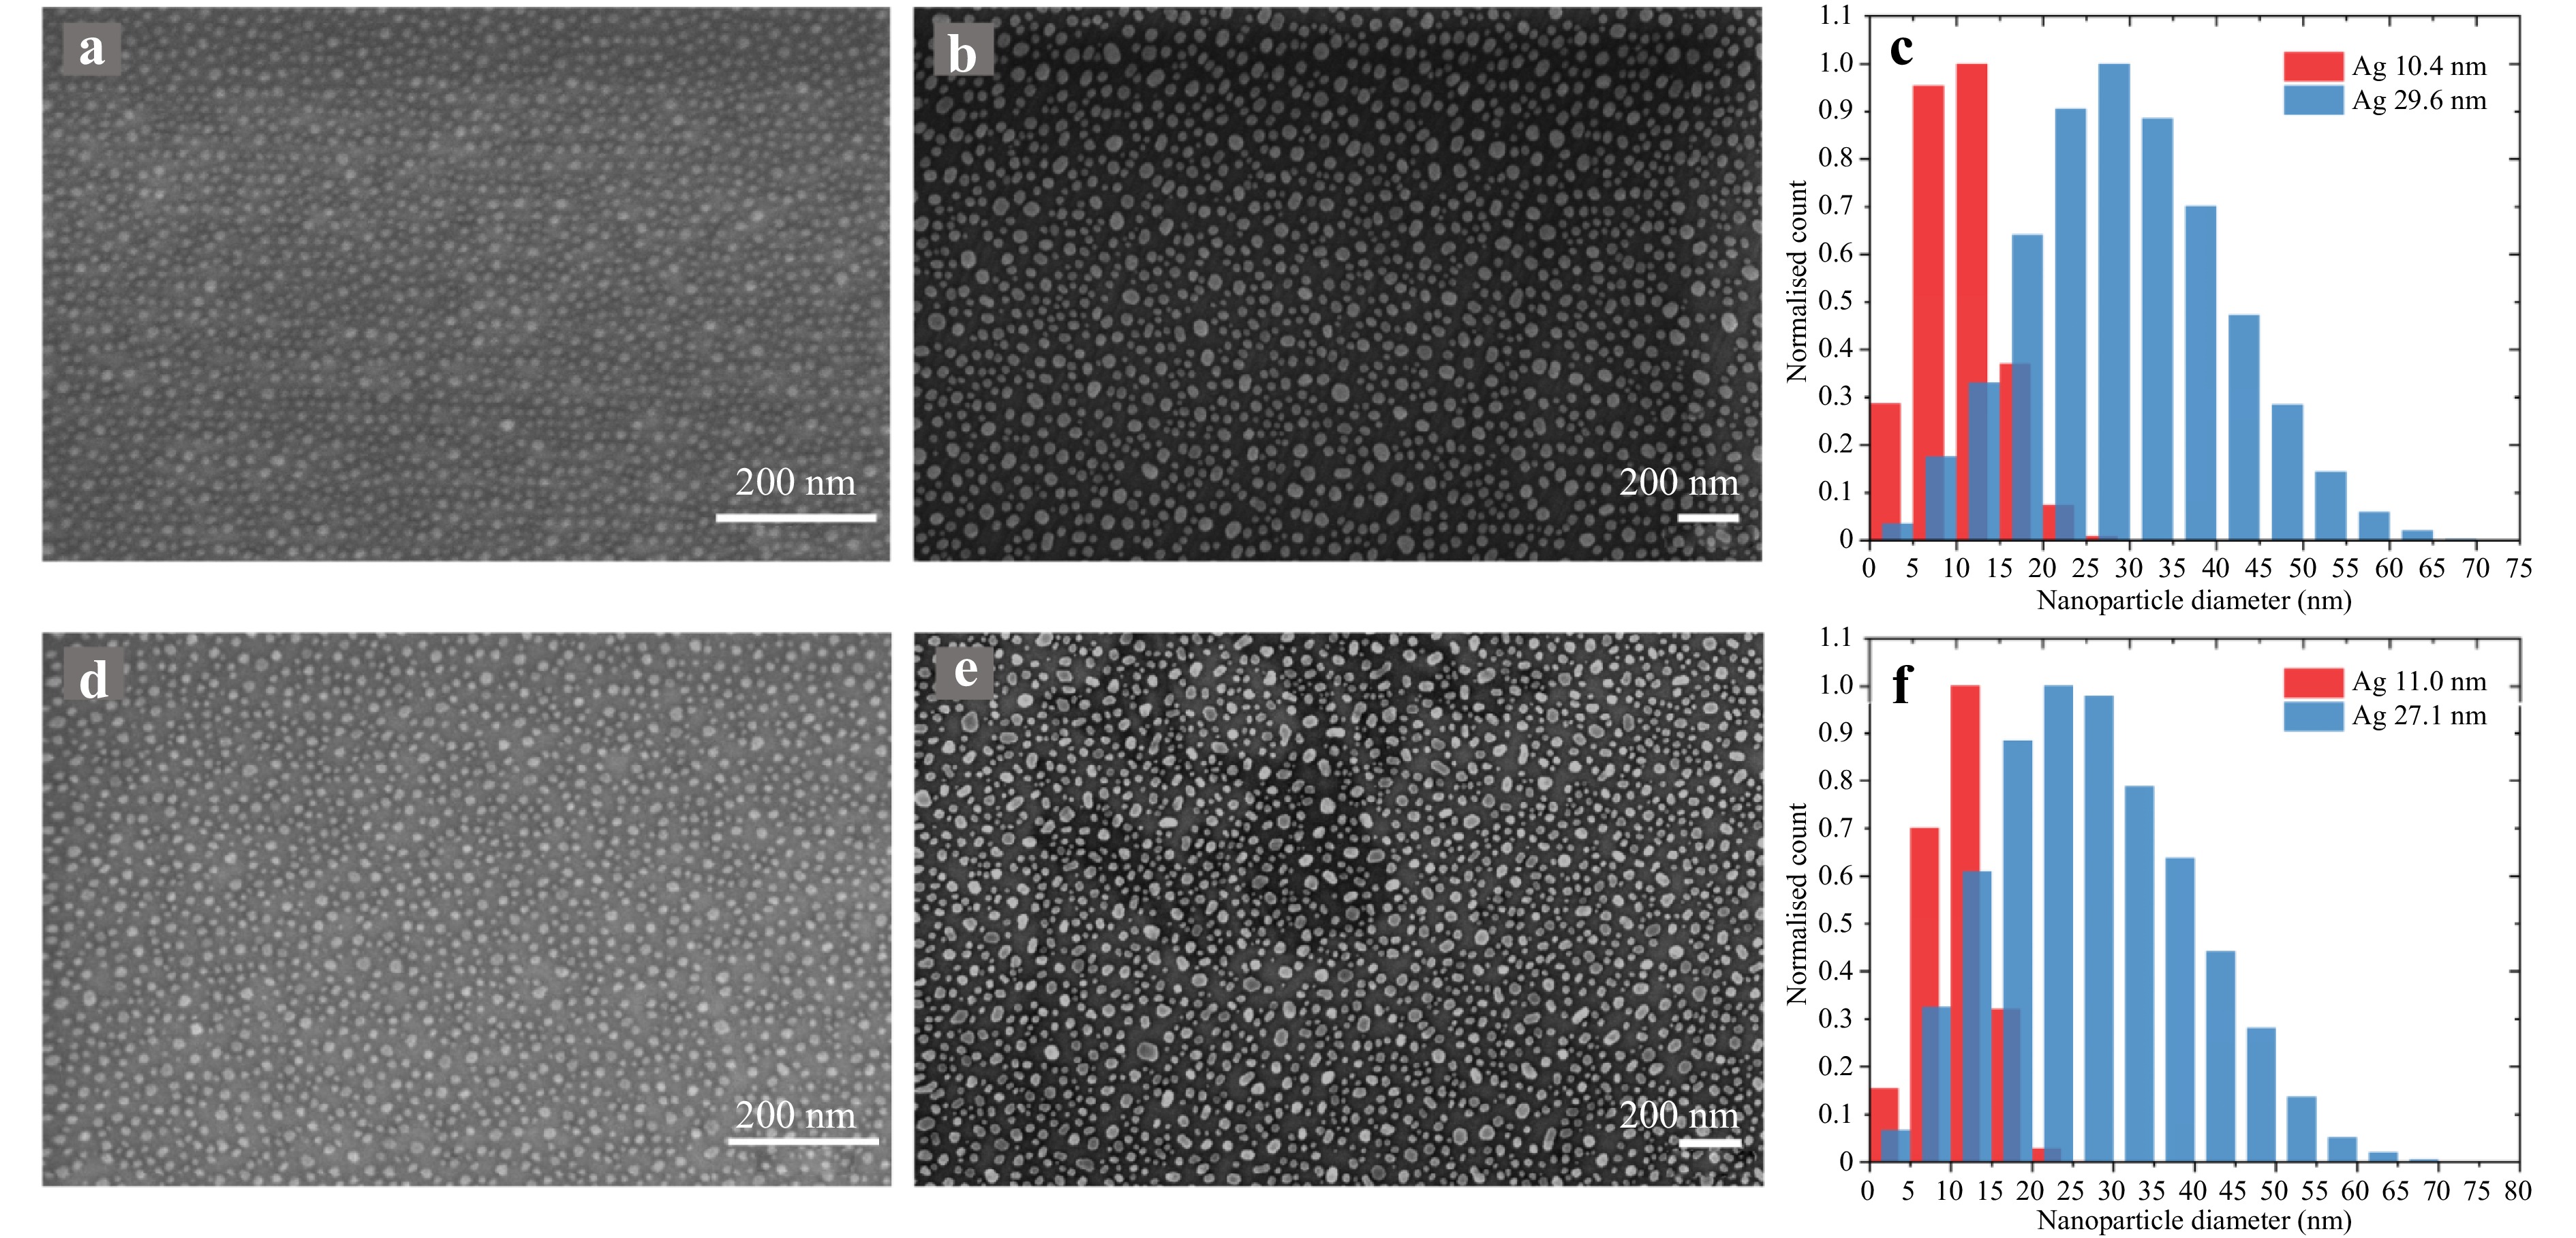
Fig. 2 Metallic nanoparticles (NPs) fabricated from dewetting thin films on diamond. SEM of Ag-NPs with an average diameter of a 10.4 nm and b 29.6 nm. c Normalised bar graph of Ag nanoparticle diameter sizing distribution. SEM of Au-NPs of mean diameter d 11.0 nm and e 27.1 nm. f Normalised bar graph of Au nanoparticle diameter sizing distribution.
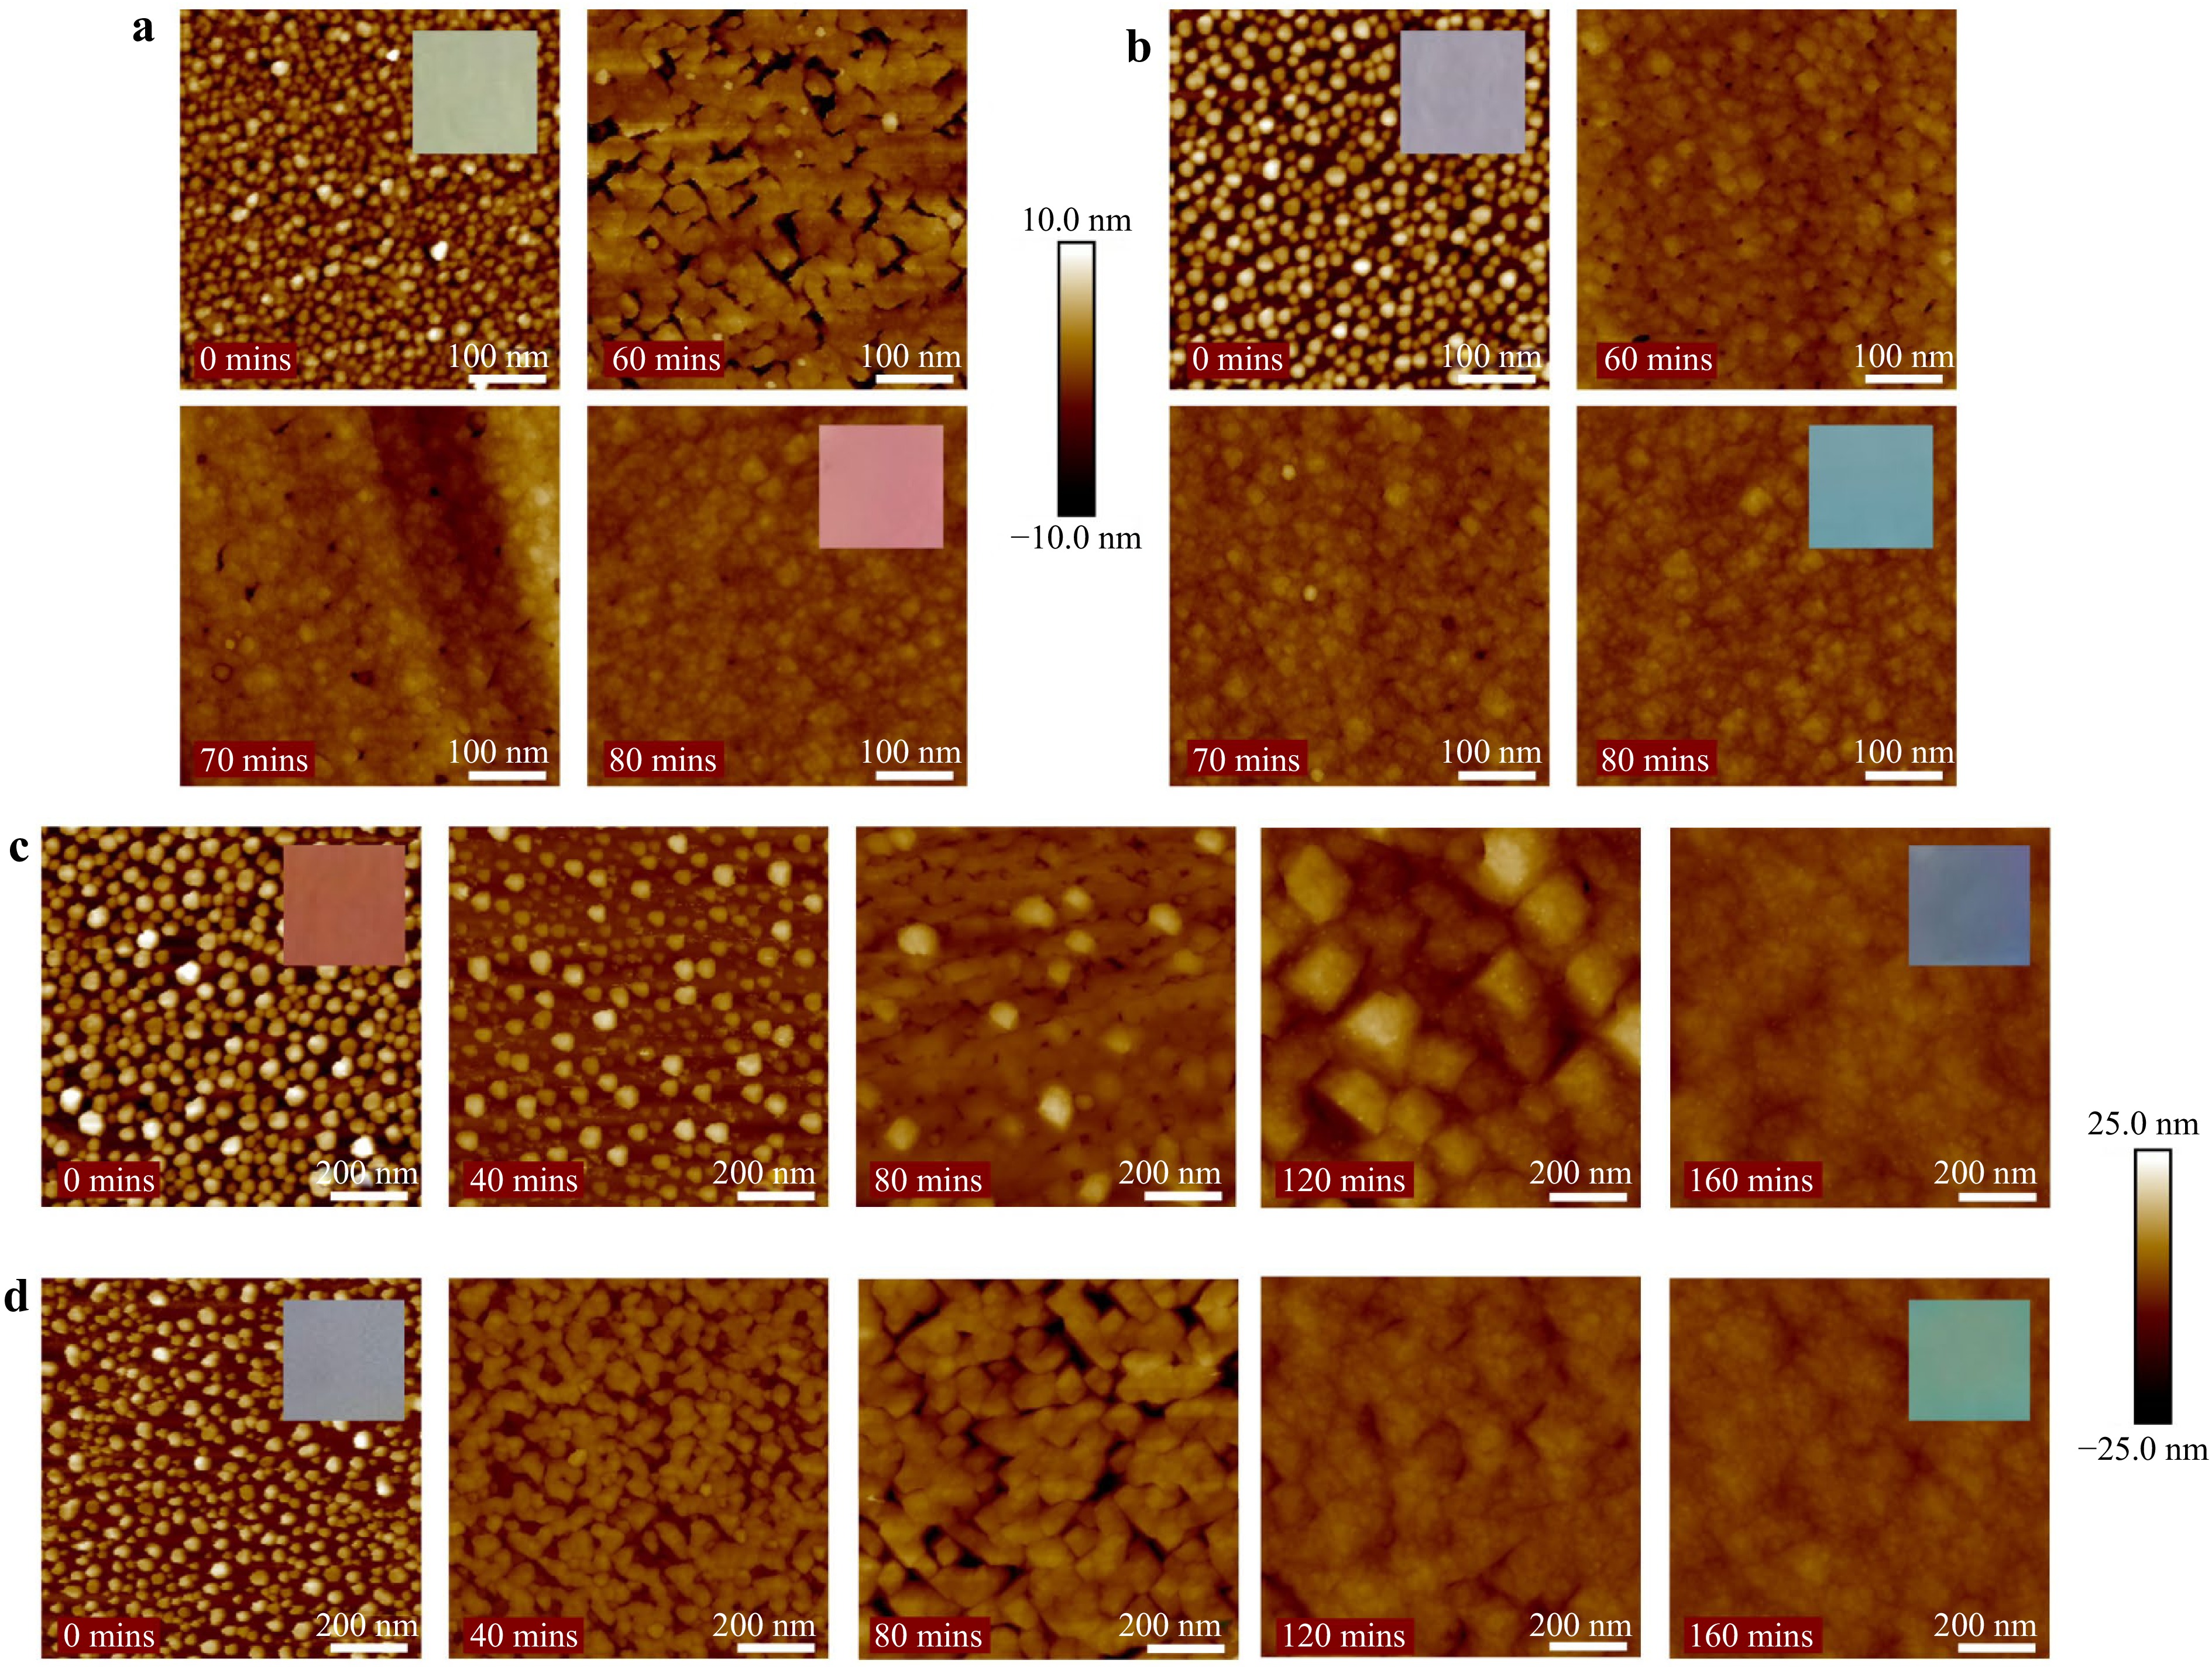
Fig. 3 1 µm AFM scans of diamond growth over a 10.4 nm Ag-NPs, b 11.0 nm Au-NPs, c 29.6 nm Ag-NPs, and d 27.1 nm Au-NPs. The growth times are provided in the insets of the images. Inset: differing substrate colours are provided due to preferential scattering of light (daylight) by fabricated metallic NPs on diamond substrates. Colour can be seen to change when exposed NPs are encapsulated by diamond overgrowth.
-
Growth was performed in steps to enable tracking of NP encapsulation. This was conducted via visual and roughness inspections of AFM scans following each growth step. AFM scans for growth on ~10 nm and ~30 nm NPs can be seen in Fig. 3. Additionally, substrate colours were observed because of the preferential scattering of light by the fabricated NPs, as depicted in the inset of the scans in Fig. 3. This colour can be observed to change with the NP's dielectric environment; hence, the absorption changes with diamond growth. AFM scans also indicated a difference in the growth interactions around the NPs of different metallic compositions. This is evident when compared to the 10.4 nm Ag-NP film (Fig. 3a) to the 11.0 nm Au-NP film (Fig. 3b) and the 29.6 nm Ag-NP film (Fig. 3c) to the 27.1 nm Au-NP film (Fig. 3d) in Fig. 3. Diamond growth over Ag-NPs appears to result in larger grain sizes or growth around NPs which move in the z-direction. It should be noted that AFM scans cannot distinguish between sp3 and sp2 growth; therefore, the varied structures could be evidence of sp2 nucleation around the Ag-NPs.
Once NPs were deemed encapsulated, the substrates underwent a metallic etching process (30%−50% KI, 2.5%−10% I2, 3 min), removing any non-encapsulated NPs as well as the Au growth mask. This allowed AFM step measurements to determine diamond epilayer thickness. After 160 min of growth, 108.3 nm and 106.3 nm diamonds were grown on the 29.6 nm Ag and 27.1 nm Au-NP substrates, respectively. 80 mins of diamond growth resulted in 20.4 nm growth on the 10.4 nm Ag-NPs and 15.0 nm growth on the 11.0 nm Au-NPs.
The grown diamond films were investigated using 532 nm excitation Raman spectroscopy to determine their crystal quality. Fig. 6a shows the spectra collected for each substrate with the initial SCD substrate spectra provided for reference. All spectra have been normalised to the diamond peak, which is clearly present at 1,331.2 cm−1 due to sp3 lattice vibrations in the diamond crystal17,18. An in-depth peak analysis of the Raman spectrum of each film is shown in Fig. 6b-e, and a breakdown of the relevant peak assignments is given in Table 2. Further information regarding the relevant Raman peaks is presented in the supplementary information in Table S3. Upon peak fitting, it was determined that diamond films grown over Au-NPs provided higher diamond line intensities (11.0 nm Au-NP: 0.981, 27.1 nm Au-NP: 0.972) in comparison to Ag-NPs (10.4 nm: 0.893, 29.6 nm: 0.508) due to the greater sp3 content, where the 27.1 nm Ag-NP film had a significantly lower intensity.
Peak Position (cm−1) Assignment 1 1,164.7 Transpolyacetylene at grain boundaries21 2 1,259.0 Low-quality diamond17,22 3 1,331.2 Diamond line17,18 4 1,345.8 D-band: non-sp3 disordered carbon18 5 1,509.0 I-band: amorphous carbon23,24 6 1,582.9 G-band: graphitic carbon17,19 7 1,607.7 Microcrystalline graphite20 Table 2. Diamond film Raman peak assignments.
Evidence of non-sp3 disordered carbon was observed for all the grown diamond films in the presence of the D-band (peak 4:1,345.8 cm−1)18. The 29.6 nm Ag-NP substrate contains considerably more disordered carbon than other substrates, where the D-band maximum intensity is 0.259 (diamond line maximum intensity = 1). This is followed by films over the 10.4 nm Ag-NPs with a D-band intensity of 0.05, where both Au substrates display further reduction in D-band intensity (11.0 nm Au-NP: 0.02, 27.1 nm Au-NP: 0.03).
Additionally, growth on Ag-NPs resulted in a higher graphitic carbon content (peak 6, G-band: 1,582.9 cm−1)17,19. Once more, growth over the 29.6 nm Ag-NPs resulted in the highest portion of graphitic carbon with a G-band max intensity of 0.22, whereas growth over 10.4 nm Ag-NPs provided a G-band intensity of 0.023. Conversely, growth over Au-NPs resulted in minimal graphitic carbon for 11.0 nm Au-NP growth (0.005) and none for 27.1 nm Au-NP growth.
Regarding growth over ~10 nm NPs, the presence of microcrystalline graphite (peak 7:1,607.7 cm−1) was identified, which was unobserved in films grown over the larger ~30 nm NPs20. More microcrystalline graphite was present in the growth over the 10.4 nm Ag-NPs (0.023) than in the 11.0 nm Au-NP growth (0.004). Further investigation of the 29.6 nm Ag-NP diamond film revealed three additional Raman peaks not present in other substrates: peaks 1, 2 and 5 were assigned to transpolyacetylene (at the crystal grain boundaries), low-quality diamond, and amorphous carbon (I-band) at 1,164.7, 1,259.0 and 1,509.0 cm−1, respectively17,21−24.
-
Etching was performed using Kapton tape masks to allow SERS testing of various film thicknesses on the same substrate. Following each etch, the etch depth was measured using AFM. The process times and resulting etch thicknesses are provided in Tables S1 and S2. Etching was conducted to produce film thicknesses with thin encapsulation of the NPs to enable the projection of the SERS enhancement field (produced by excitation of the NPs) to the diamond/air interface. Figs. 4, 5 show comparable etched diamond film thicknesses for both Ag- and Au-NPs. Further AFM and SEM images of all the diamond film thicknesses are provided in Figs. S1-S4.
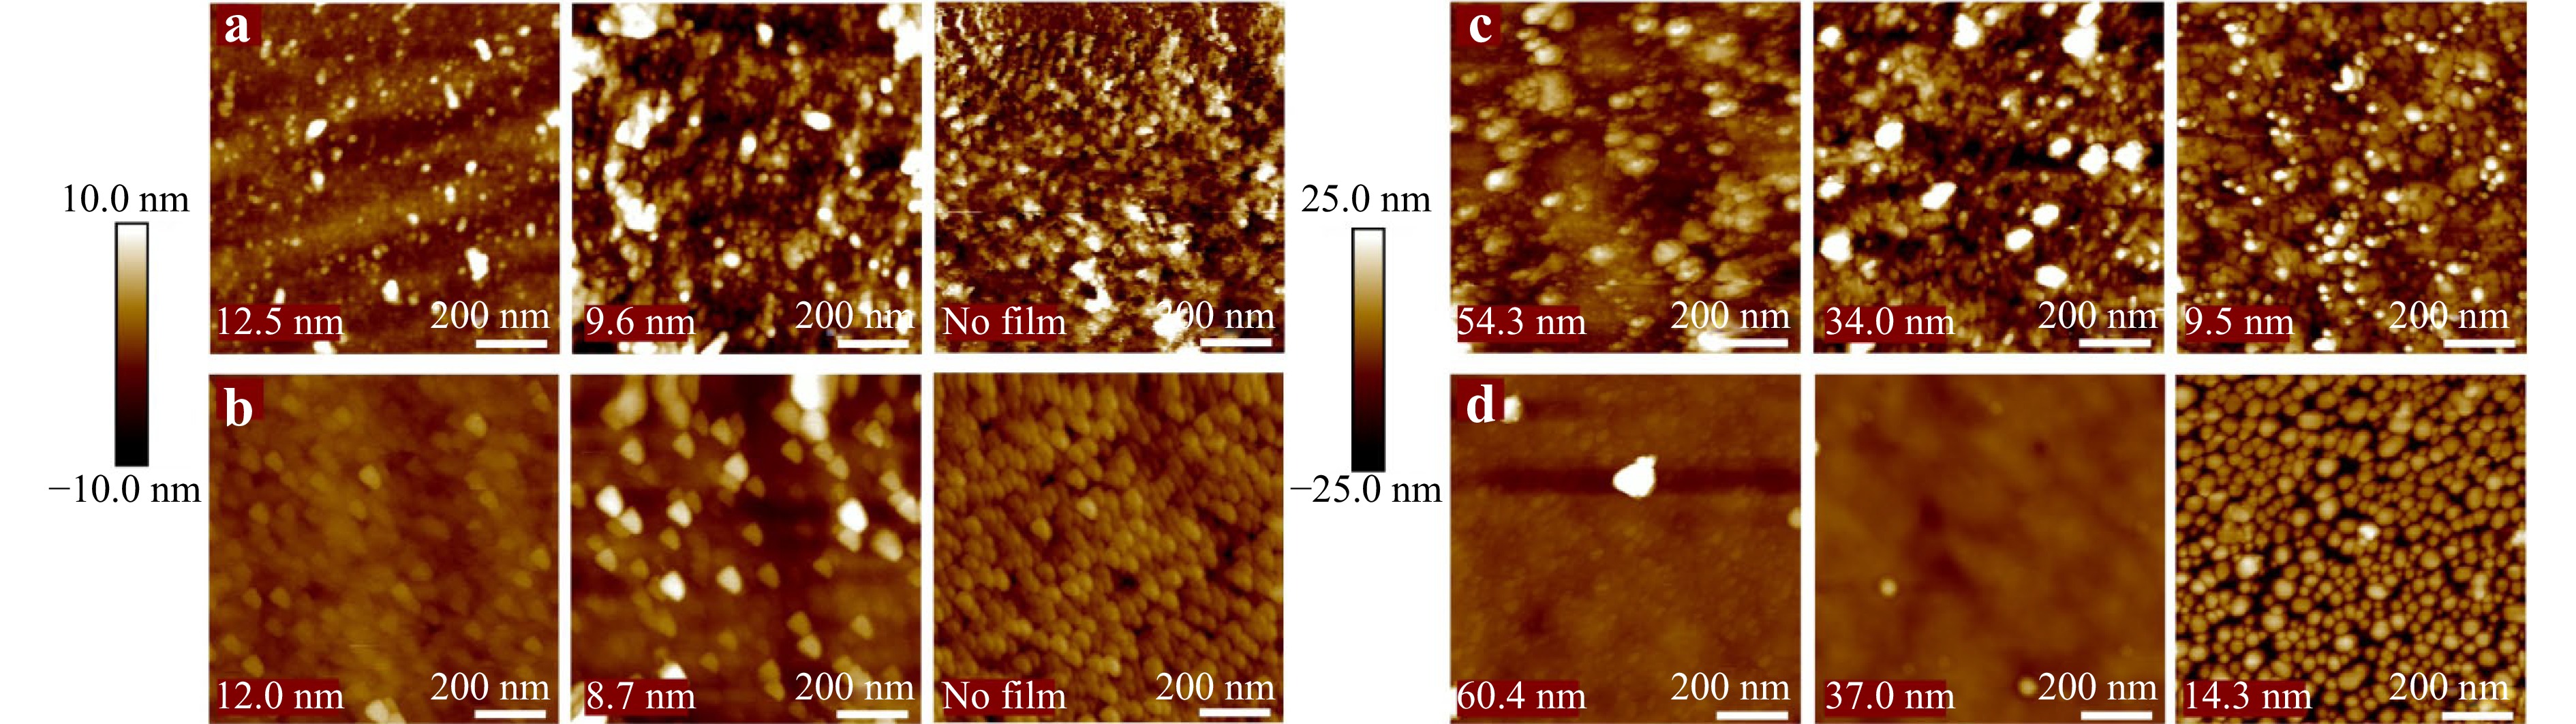
Fig. 4 1 µm AFM scans of etched diamond films over a 10.4 nm Ag-NPs, b 11.0 nm Au-NPs, c 29.6 nm Ag-NPs, and d 27.1 nm Au-NPs. The remaining diamond film thicknesses are provided in the insets of the images, with etching continued until the diamond film was fully removed.
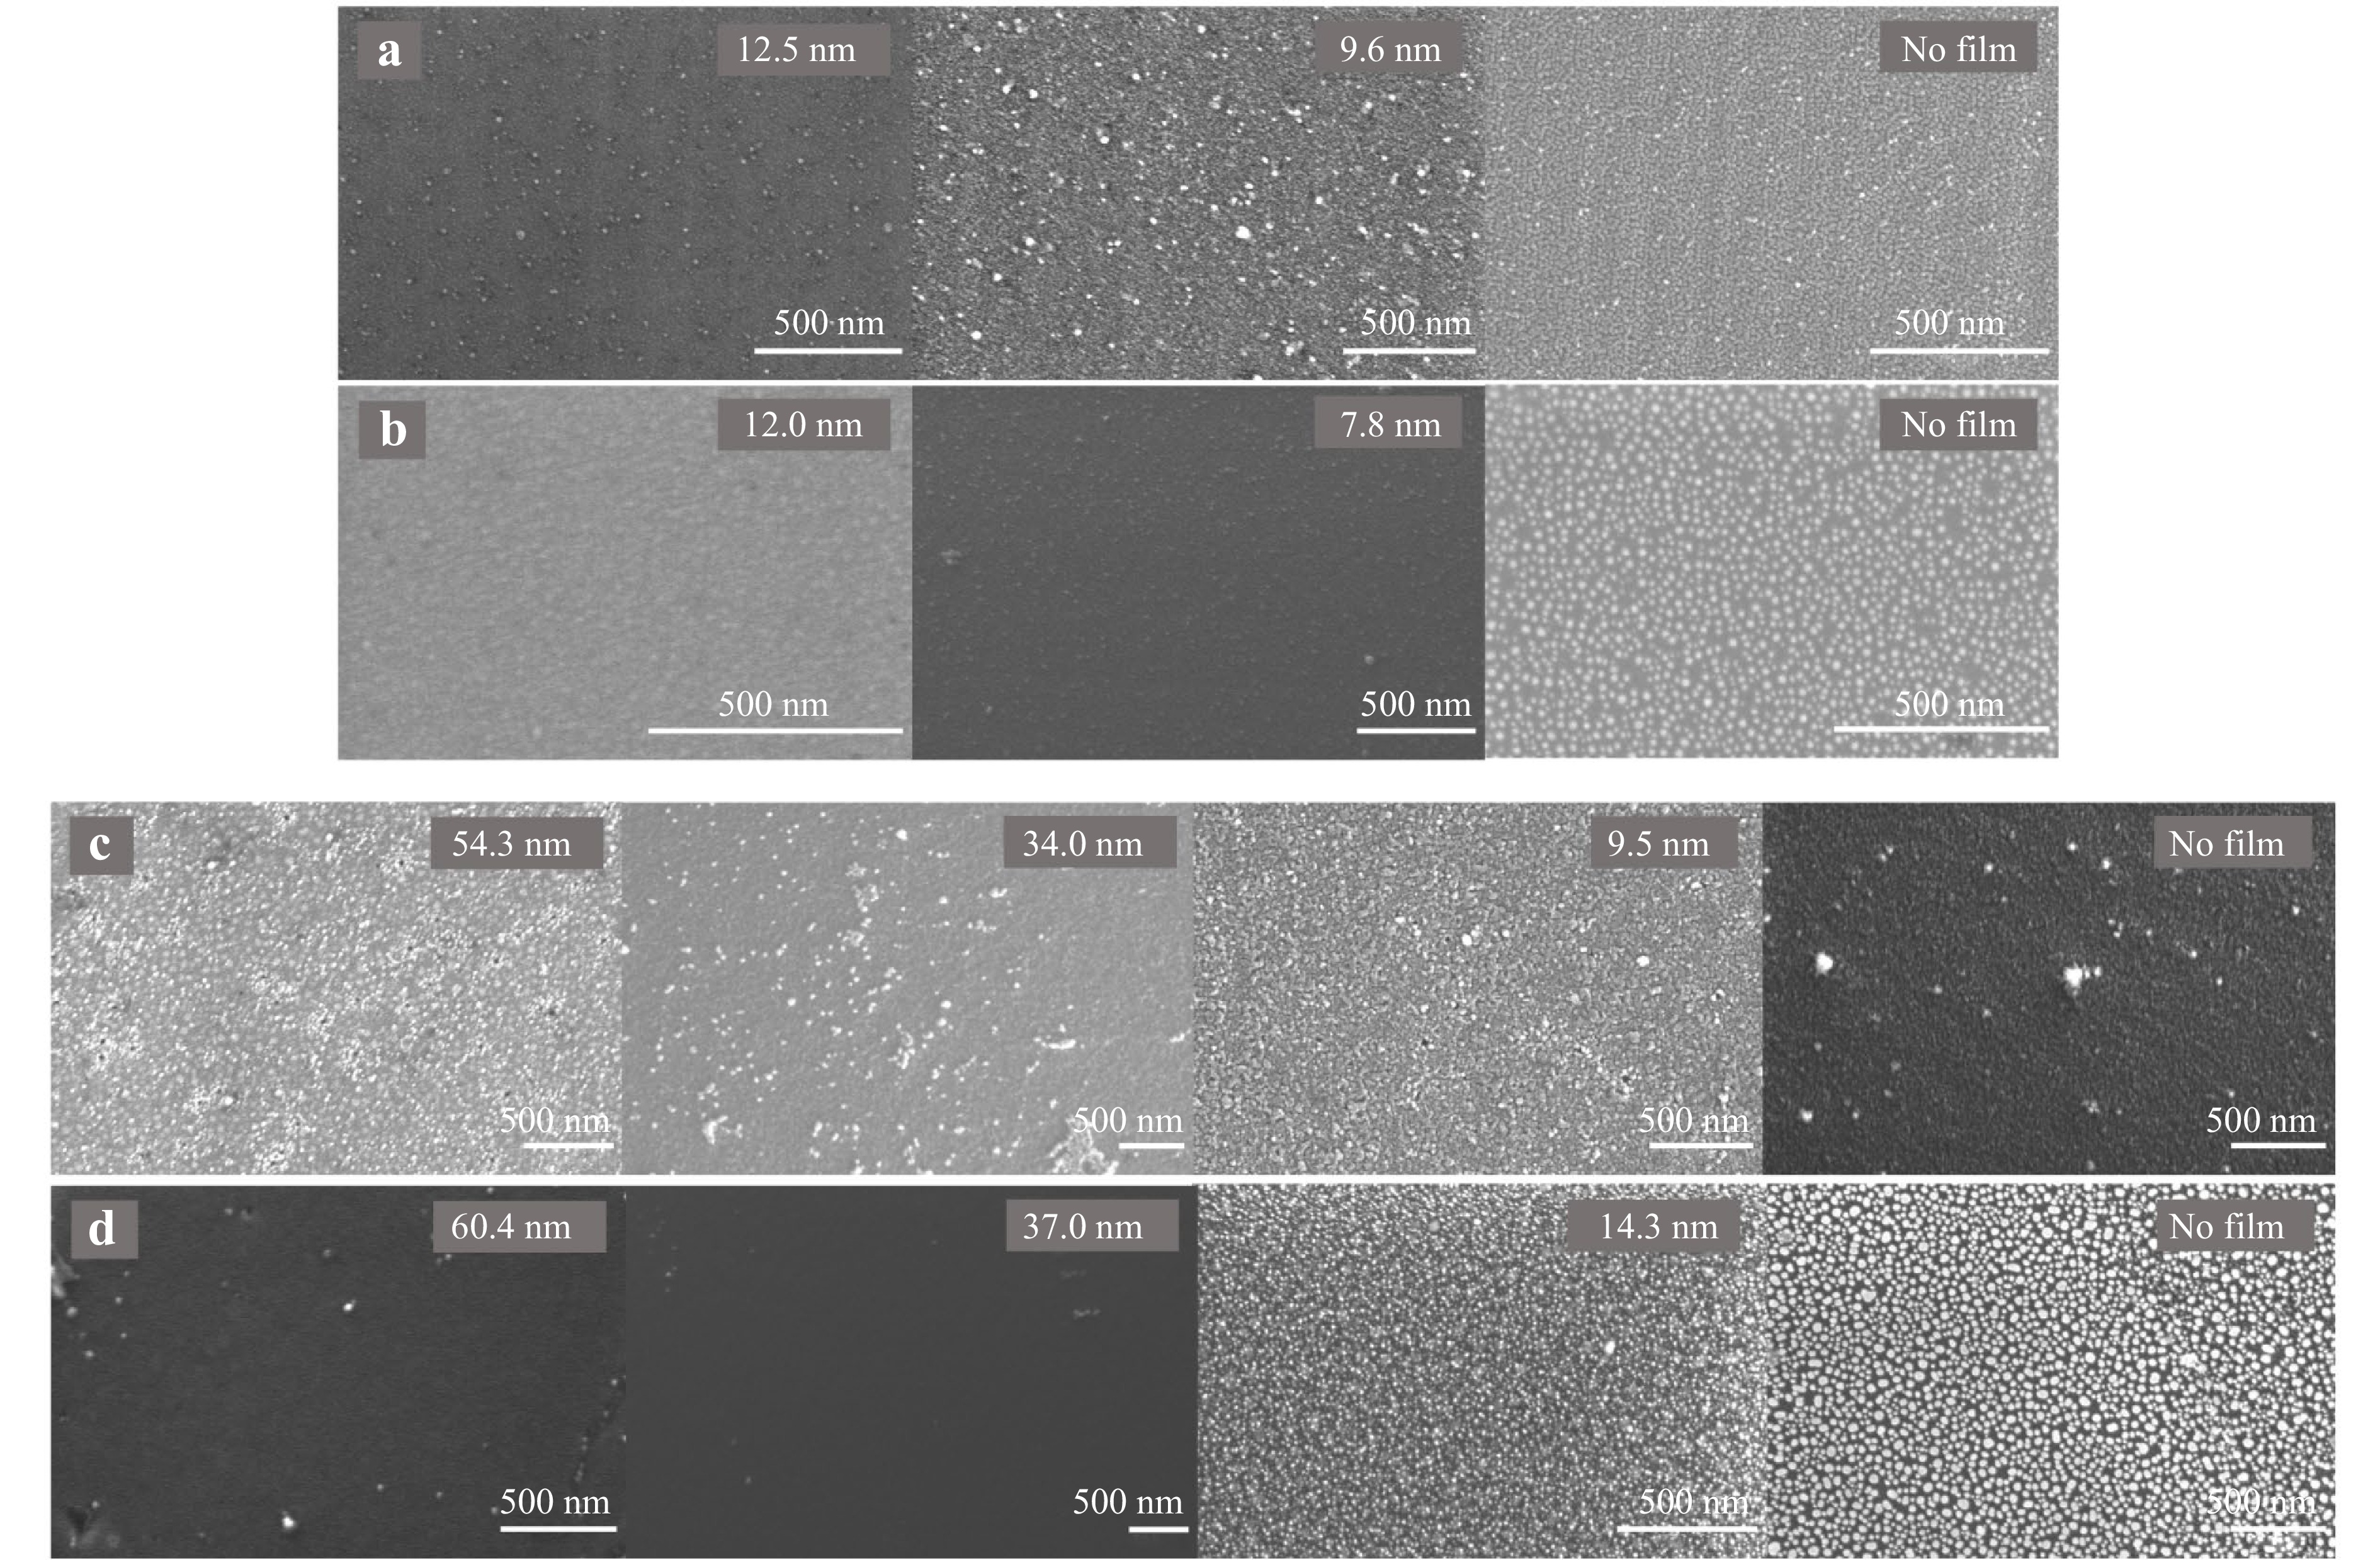
Fig. 5 SEM images of etched diamond films over a 10.4 nm Ag-NPs, b 11.0 nm Au-NPs, c 29.6 nm Ag-NPs, and d 27.1 nm Au-NPs. The remaining diamond film thicknesses are shown in the image insets, with etching continued until the diamond film was fully removed.
Both the 11.0 nm and 27.1 nm Au-NP substrates exposed NPs upon diamond film etching. As expected, the areas appeared relatively smooth, with larger Au-NPs breaching the diamond surface at the corresponding film thicknesses. This trend continued until all the Au-NPs were exposed, resulting in a structure comparable to that fabricated prior to diamond film growth and etching. These results indicate no movement of the Au-NPs in the z-direction.
Conversely, movement in the z-direction was observed for both the 10.4 nm and 29.6 nm Ag-NPs. This is evident in the AFM and SEM images in Figs. 4 and 5. A significant number of Ag-NPs breached the surface at much larger diamond film thicknesses than expected, and the NP shaping and separation also changed. Clear evidence of this can be seen for 29.6 nm Ag-NPs with diamond films of 54.3 nm and 34.0 nm (Figs. 4, 5c). Upon further etching to fully remove the diamond film, a minimal number of Ag-NPs remained in both size regimes (Fig. 5a, c). Prior to SERS testing, the substrates were exposed to an Au etchant (30%–50% KI, 2.5%–10% I2, 3 min) to remove all NPs exposed by diamond film etching. Specifically intended for Au etching, Ag-NPs were also removed by the oxidation of Ag. Any residue was removed by rinsing with deionised (DI) water to ensure the absence of Raman interference. AFM scans are provided in Figs. S5 and S6 of etched areas following etchant exposure.
After the diamond film etching, Raman spectra were captured to investigate the diamond quality within the film. The spectra are shown in Fig. S7. The diamond quality can be correlated with sp2 to sp3 ratio by comparing the 1,582.9 cm−1 graphitic carbon peak to the 1,331.2 cm−1 diamond peak. Graphs displaying this ratio with the remaining diamond film thickness are provided in Fig. 6f, g for ~10 nm and ~30 nm NP films, respectively. A discrepancy can clearly be observed between the Ag-NP and Au-NP diamond overgrowth quality. Growth on Au-NPs led to a minor increase in sp2:sp3 ratio with increasing film thickness, whereas the sp2:sp3 ratio in diamond growth on Ag-NPs increased significantly with the thickening of the diamond film. Notably, the measured films were much smaller than Raman sampling depths. Therefore, the sp2:sp3 ratio may be affected by changing the film thickness, given the contribution from the underlying SCD substrate and not only the film quality. Thus, thinner films may inherently provide a lower sp2:sp3 ratio, given their closer proximity to the SCD substrate.
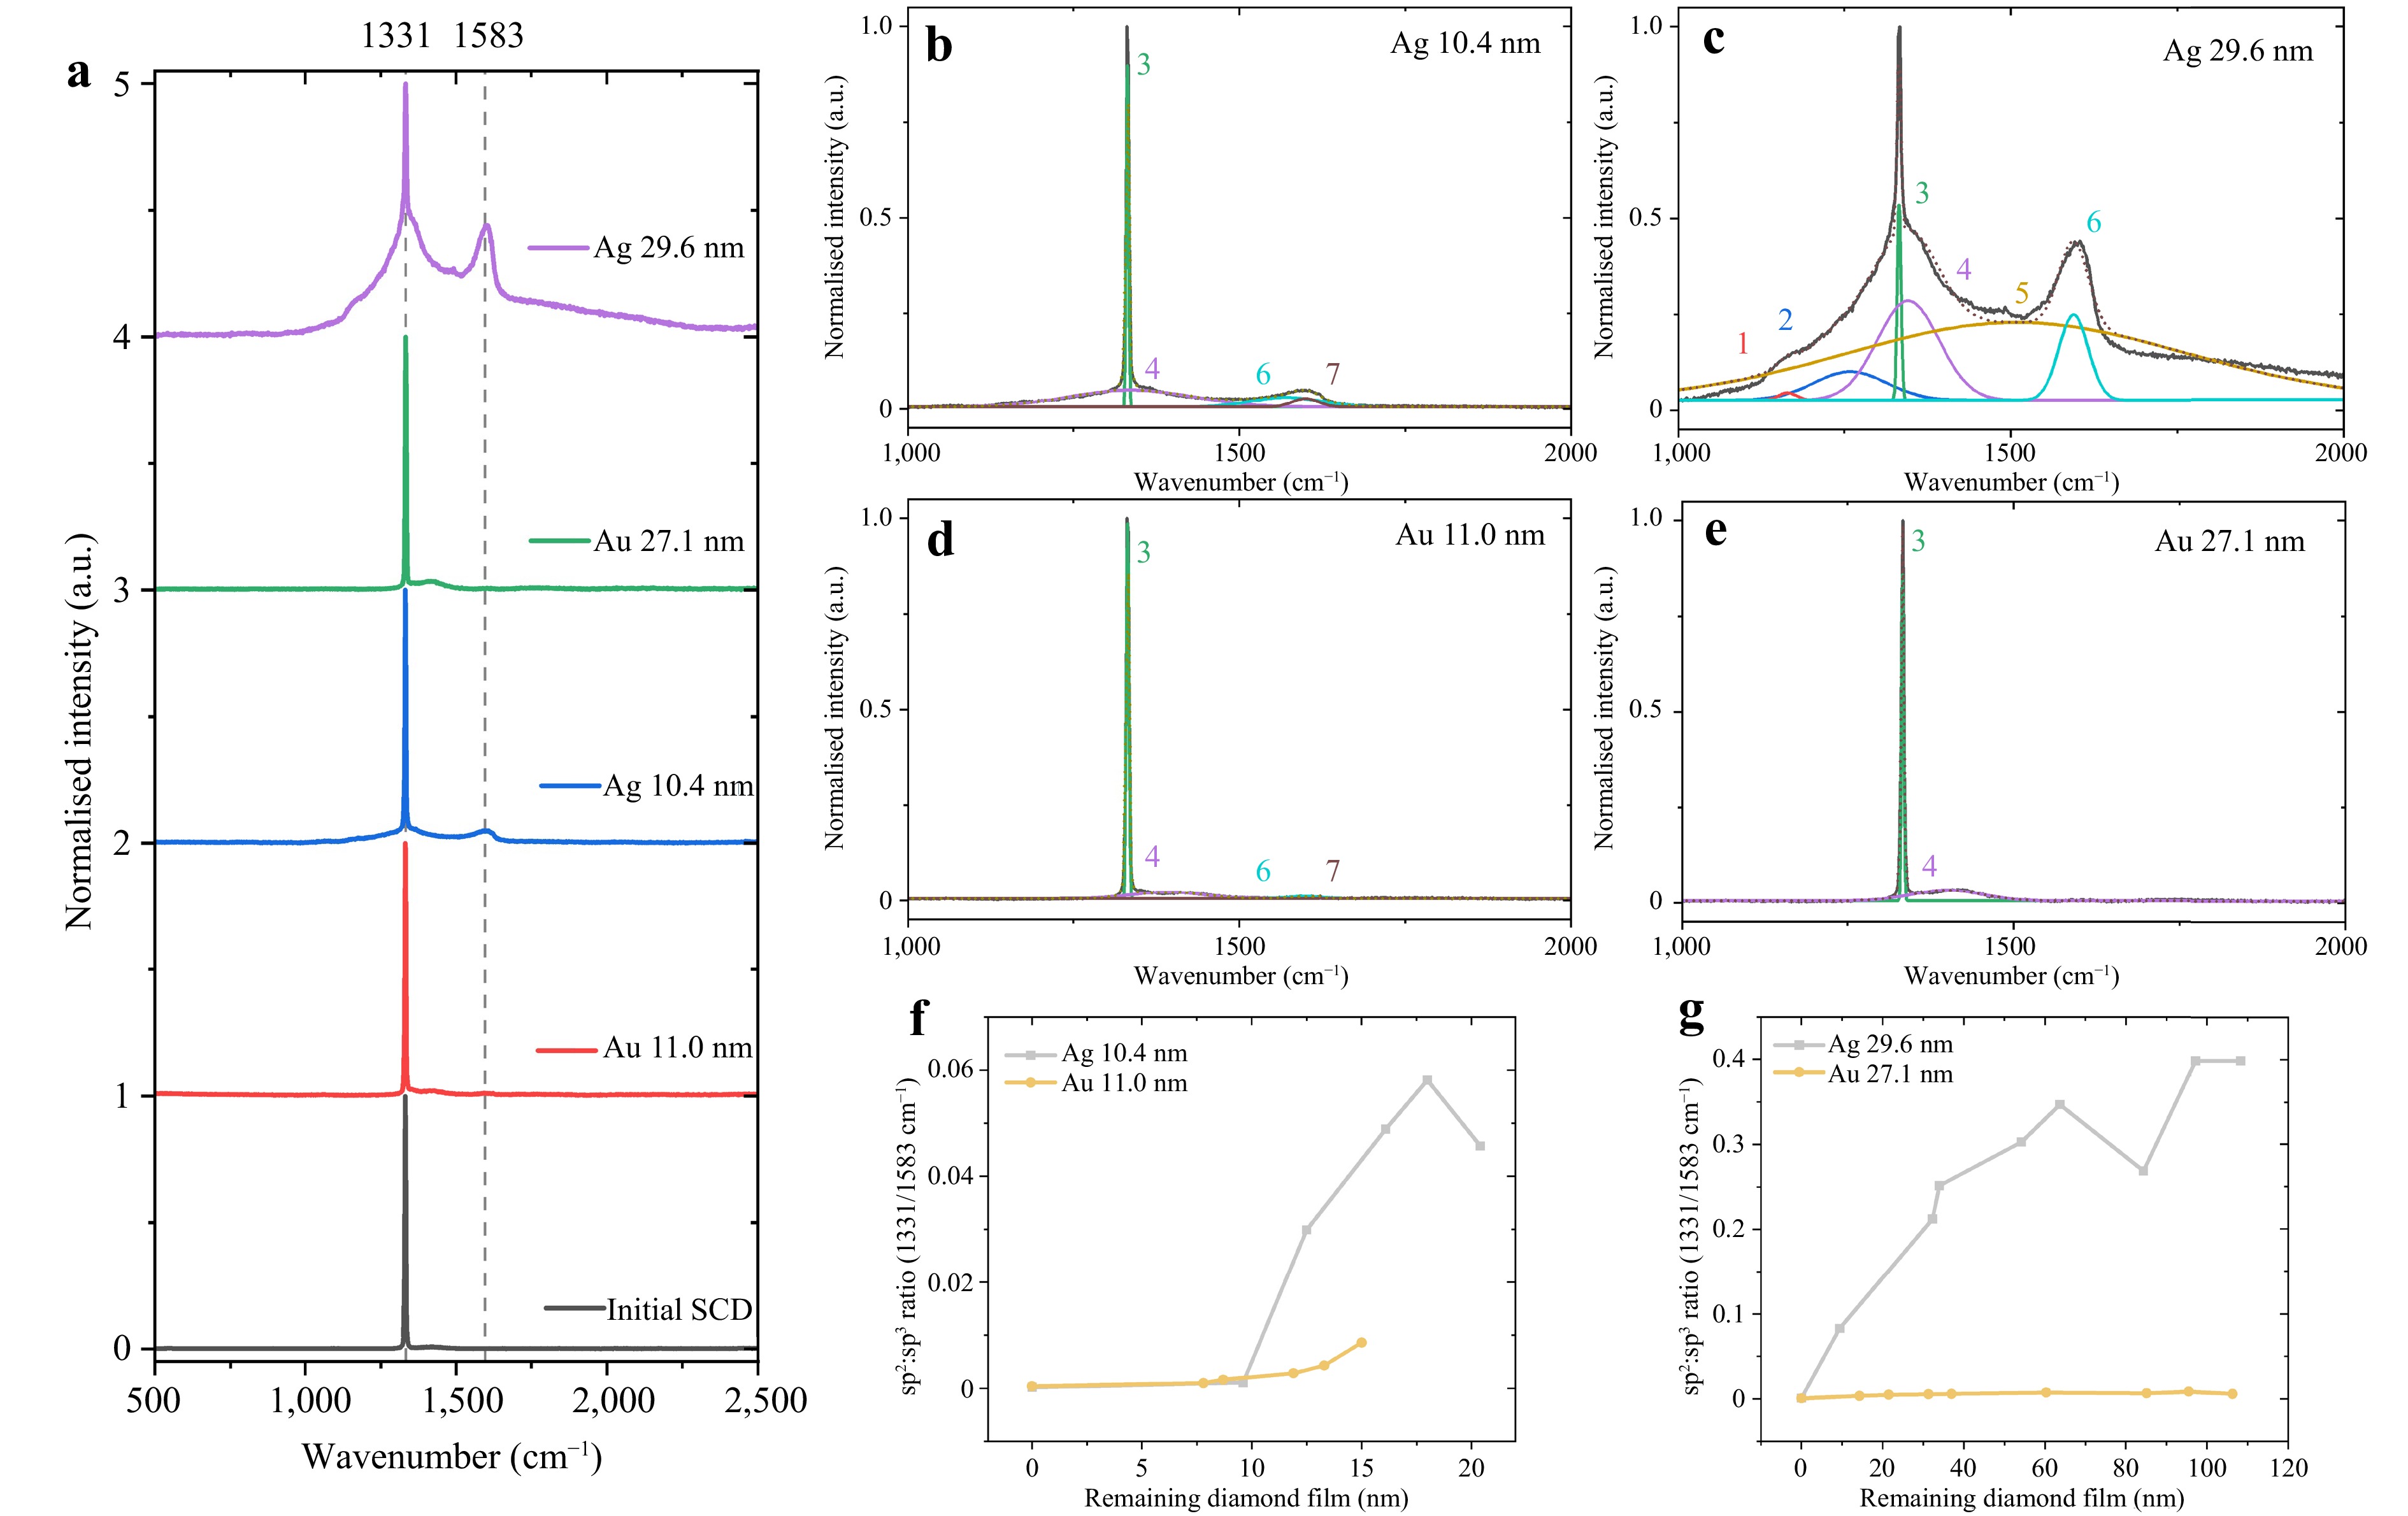
Fig. 6 Carbon content of diamond films encapsulating metallic NPs. a Normalised Raman spectra of grown diamond films subjected to 532 nm excitation where prominent peaks can be seen at 1,332 cm−1 (sp3 diamond peak) for all substrates. Spectra offset in y to facilitate comparison. Peak fitting of Raman spectra is provided for diamond films over b 10.4 nm Ag-NPs, c 29.6 nm Ag-NPs, d 11.0 nm Au-NPs, and e 27.1 nm Au-NPs. Graphs displaying sp2 to sp3 ratio comparing the 1,582.9 cm−1 graphitic carbon peak to the 1,331.2 cm−1 diamond peak with respect to diamond film thickness for f ~10 nm and g ~30 nm diameter NP films.
-
Following diamond film etching, the substrates were functionalised with 1 × 10⁻⁴ M rhodamine 6G (R6G) to investigate SERS enhancement. The captured spectra are shown in Fig. 7. Upon excitation at 532 nm, the 10.4 nm Ag-NP films provided no resolvable R6G peaks with any diamond film thickness (Fig. 7a). Conversely, the 11.0 nm Au-NP diamond substrate produced clearly resolvable peaks with diamond film thicknesses of 13.3, 12.0 and 8.7 nm (Fig. 7b). These peaks were identified at 612 cm−1 as a result of the C-C-C in-plane bending within the rhodamine and at 770 cm−1 as a result of C-H out-of-plane bending25,26. R6G peaks in this spectral area were chosen for investigation given their strength and distance from the diamond and sp2 carbon peaks to prevent overlap. Excitation of the 12.0 nm diamond film generated the greatest average 612 cm−1 peak intensity, and hence, an optimised film over the 11.0 nm Au-NPs. This is followed by the 13.3 nm and 8.7 nm film thicknesses regarding 612 cm−1 intensity. The enhancement capability was quantified by calculating the enhancement factor (EF), provided in Table 3. For the 11.0 nm Au-NP substrate, the optimised EF = 3.1 × 10³ as calculated for the 12.0 nm diamond film (13.3 nm: EF = 2.8 × 10³, 8.7 nm: EF = 2.6 × 10³). A plot of the calculated EF against the diamond film thickness for the ~10 nm NP substrates is shown in Fig. 7c.
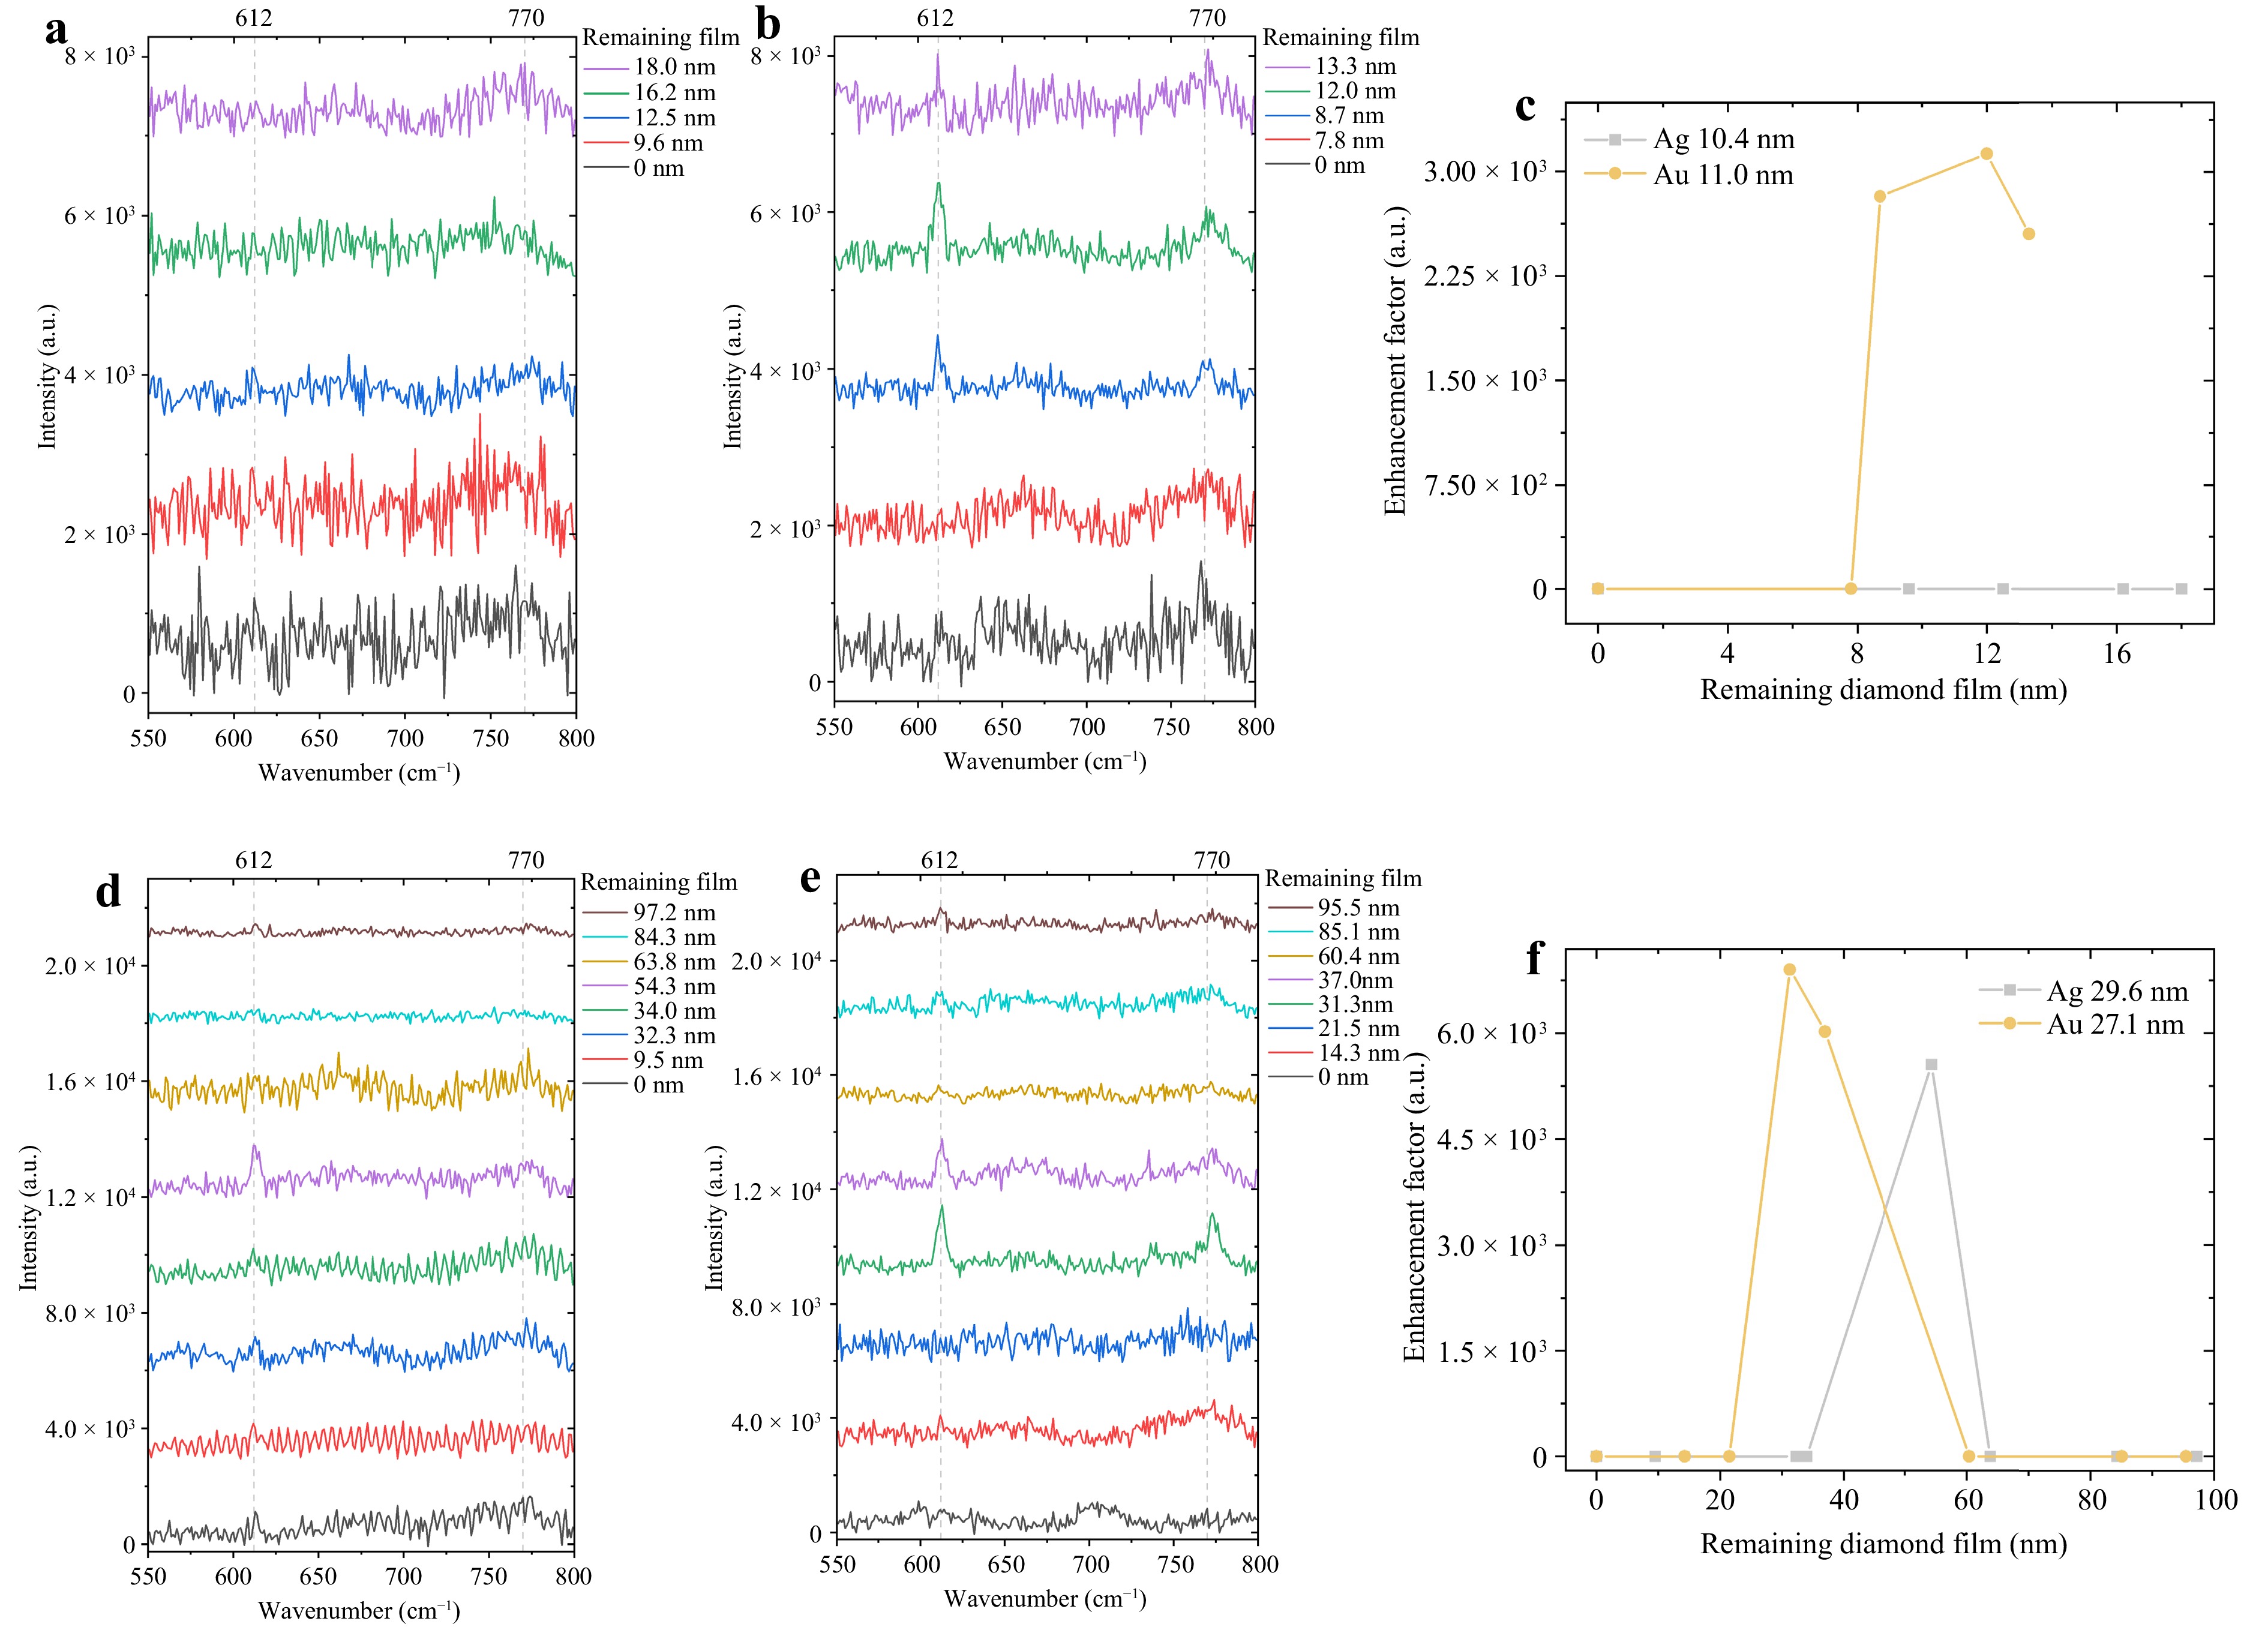
Fig. 7 Raman spectra of 1 × 10⁻⁴ M R6G on diamond SERS substrates with a 10.4 nm Ag-NPs b 11.0 nm Au-NPs d 29.6 nm Ag-NPs e 27.1 nm Au-NPs when excited with 532 nm. Spectra from varied diamond film thicknesses can be seen offset in y with R6G peaks present at 612 cm−1 and 770 cm−1. Enhancement Factors calculated from these measurements are provided in c and f for ~10 nm and ~30 nm diameter NP films respectively.
Substrate Diamond Film Thickness EF 10.4 nm Ag-NPs − − 11.0 nm Au-NP 8.7 nm 2.6 × 10³ 12.0 nm 3.1 × 10³ 13.3 nm 2.8 × 10³ 29.6 nm Ag-NPs 54.3 nm 5.6 × 10³ 27.1 nm Au-NP 31.3 nm 6.9 × 10³ 37.0 nm 6.0 × 10³ Table 3. Enhancement factors of Ag and Au-NPs diamond films with varied film thicknesses.
For substrates with larger ~30 nm NPs, both the 29.6 nm Ag-NP and 27.1 nm Au-NP substrates produced evident R6G peaks (Fig. 7d, e). Clearly resolvable peaks were present when measuring the 29.6 nm Ag-NPs exclusively at a diamond film thickness of 54.3 nm, with EF = 5.6 × 10³. The 27.1 nm Au-NPs provided the greatest R6G enhancement, with peaks present in both the 31.3 and 37.0 nm diamond films. The 31.3 nm exhibited the greatest intensity at 612 cm−1 and, consequently, EF, with EF = 6.9 × 10³ (37.0 nm: EF = 6.0 × 10³). A comparison of EF values is shown in Fig. 7f for ~30 nm NP substrates.
The detection of 1 × 10⁻⁴ M R6G with alternative excitation wavelengths was explored to further investigate the spectral response of diamond SERS. In addition to the initial 532 nm excitation, excitations of 457 nm, 514 nm, and 633 nm were measured for the optimised film thicknesses of 11.0 nm Au-NPs, 29.6 nm Ag-NPs and 27.1 nm Au-NPs. Results showed that only 532 nm excites R6G peaks for the 11.0 nm Au-NP and 29.6 nm Ag-NP films. However, with 27.1 nm Au-NPs (31.3 nm film), the R6G peaks were clearly resolvable with 514 nm excitation, although with less intensity. R6G was not detected when pairing any diamond SERS with either 457 nm or 633 nm excitation. A spectral set is provided in Fig. 8a for the measurement of 27.1 nm Au-NPs (31.3 nm film) at all wavelengths.
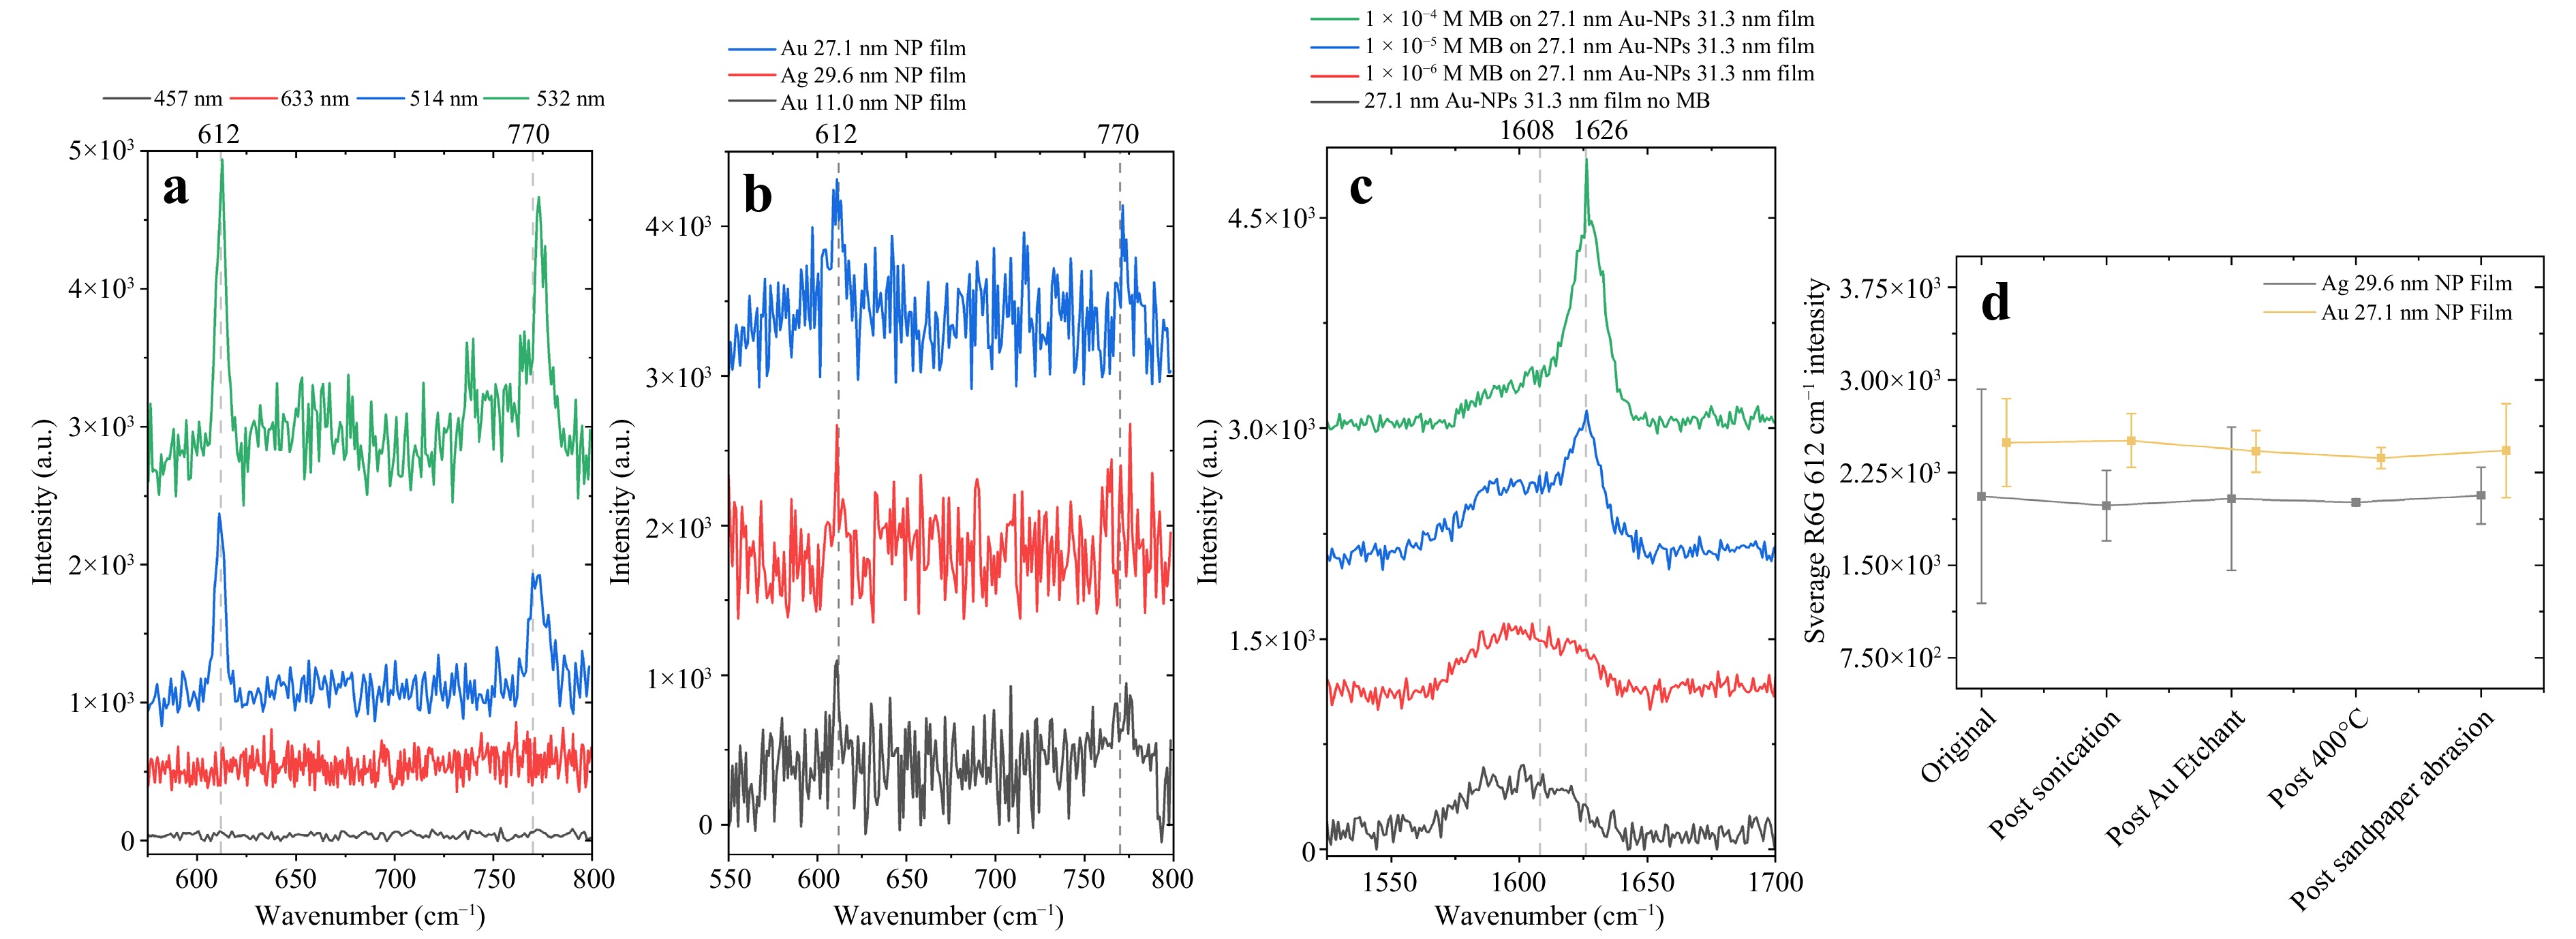
Fig. 8 a Raman spectra of 1 × 10⁻⁴ M R6G on 27.1 nm Au-NPs with 31.3 nm diamond film at varied excitation wavelengths of 457 nm, 514 nm, 532 nm and 633 nm with spectra offset in y. b Substrates limit of detection of 1 × 10⁻⁵ M R6G with 532 nm excitation. Spectra are provided for the etched areas of substrates with the greatest SERS enhancement (11.0 nm Au-NPs: 12.0 nm diamond; 29.6 nm Ag-NPs: 54.3 nm diamond; 27.1 nm Au-NPs: 31.3 nm diamond) offset in y. R6G peaks can be seen at 612 cm−1 and 770 cm−1. c Raman spectra of 1 × 10⁻⁴−1 × 10⁻⁶ M MB on 27.1 nm Au-NPs with 31.3 nm film (532 nm excitation). A pronounced peak at 1,626 cm−1 for 1 × 10⁻⁴ and 1 × 10⁻⁵ M indicates MB. A secondary broad peak at 1,608 cm−1 indicates a minor inclusion of microcrystalline graphite in the film. d Averaged 612 cm−1 R6G peak intensity following robustness tests of sequential extended sonication, exposure to Au etchant, 400 °C heating and 100 sandpaper abrasion cycles. Standard error bars are provided where negligible Raman intensity variation from the original can be seen, all within the standard error.
Following R6G removal, the substrates were exposed to lower concentrations to determine the limit of detection (LOD). Given the inability of the 10.4 nm Ag-NP substrate to detect 1 × 10⁻⁴ M R6G, it was unable to detect lower concentrations, as expected. However, with optimised etches, the 11.0 nm Au-NP (12.0 nm diamond film), 29.6 nm Ag-NP (54.3 nm diamond film), and 27.1 nm Au-NP (31.3 nm diamond film) NP diamond films provided 1 × 10⁻⁵ M detection capability (Fig. 8b). A claim of 10 parts per million LOD can be made for these substrates given that the averaged 612 cm−1 R6G peak intensities (11.0 nm Au-NP 12.0 nm film: 1,098; 29.6 nm Ag-NP 54.3 nm film: 1,171; 27.1 nm Au-NP 31.3 nm film: 1,316) are greater than three times the blank measurement standard deviation27. The standard deviation (11.0 nm Au-NP 12.0 nm film: 54; 29.6 nm Ag-NP 54.3 nm film: 98; 27.1 nm Au-NP 31.3 nm film: 23) is taken from the Raman spectra intensity values of the relevant diamond film measured without analytes. No R6G peaks are present when measuring 1 × 10⁻⁶ M, the spectra of which are shown in Fig. S10.
Given that R6G resonates near 532 nm, an additional analyte control, Methylene Blue (MB), was measured to support the role of the substrate spectral response beyond R6G resonance alone. Measurements were taken of 1 × 10⁻⁴−1 × 10⁻⁶ M MB on 27.1 nm Au-NPs with a 31.3 nm film. As shown in Fig. 8c, with 532 nm excitation, MB was detectable by a pronounced peak at 1,626 cm−1 (C-C stretch of conjugated rings) for 1 × 10⁻⁴ and 1 × 10⁻⁵ M, matching the LOD for R6G28. MB was also measured at 457,514, and 633 nm for 1 × 10⁻⁴ M, where 1,626 cm−1 was only observed at 514 nm (Fig. S11), matching the suitable excitation wavelengths for R6G. The absence of an MB peak with 633 nm excitation is notable, given that MB resonates near 633 nm (Fig. S11), providing evidence that the enhancement mechanism is not solely attributable to R6G resonance effects.
-
To determine diamond SERS substrate longevity and reusability, R6G measurement intensity was investigated after exposure to simulated harsh conditions. Conducted on the etched areas of ~30 nm NP substrates that provide the greatest SERS enhancement (29.6 nm Ag-NPs: 54.3 nm diamond; 27.1 nm Au-NPs: 31.3 nm diamond), these tests comprised sequential exposure to 30 min of sonication, 30 min of Au etchant exposure, 30 min of 400 °C heating in atmosphere, and finally 100 sandpaper (3,000 grit) abrasion cycles. Following the 400 °C annealing, no structural alteration was noted in the Raman spectrum (Fig. S12), indicating resistance to combustion at this temperature. Following each exposure, no significant change in the 612 cm−1 R6G peak intensity was observed, with all variations within the standard error (Fig. 8d). As is common practice for Raman measurements, these intensities were adjusted with the Si reference measurement to account for laser power fluctuations over time. This provides evidence to support the conclusion that diamond SERS is promising for reusable operations while providing chemical, thermal, and physical robustness.
-
Robust SERS has been successfully achieved via thin-film diamond growth over both Ag- and Au-NPs, permitting comparisons between the performance and fabrication of various NP sizes and materials. Ag- and Au-NPs were fabricated on SCD substrates via a H2 plasma dewetting mechanism, resulting in the distribution of sizing and separation. Median sizing can be controlled by varying the initial metal film thickness, allowing the fabrication of Ag-NPs with median diameters of 10.4 and 29.6 nm and Au-NPs of 11.0 and 27.1 nm. This process was chosen because of its procedural simplicity and compatibility with subsequent fabrication steps. Given the NP formation in the diamond growth chamber, future fabrication can be completed consecutively by merely heating the H2 plasma (to dewet the metal film) and then injecting CH4 to commence diamond growth. Furthermore, this method ensured no alteration of the metallic nanostructures prior to growth.
Alternative plasmonic nanostructures such as nanocubes, nanostars or nanorods can be explored for diamond encapsulation, although the fabrication temperature must be considered. It is probable that more complex structures would reform into NPs under the diamond growth chamber conditions. However, lithography techniques such as e-beam lithography or nanoimprint lithography enable templated dewetting of the diamond surface prior to metal deposition. Ultimately, further NP fabrication optimisation could be explored to allow greater control of NP sizing and separation; however, additional process complexity, potential diamond film contamination, and chamber condition suitability should be carefully considered29. Therefore, metallic film dewetting, as established by Li et al.9, is deemed the most suitable approach for this application, particularly when considering scalability.
For alternative applications, a range of Ag-NP sizing regimes have been reported, ranging from 10 nm to 500 nm in diameter, with diamond films ranging from 20 nm to greater than 400 nm9−12. However, for Au-NPs, only one report on diamond overgrowth can be found13. Notably, et al. reported much larger NPs than those considered in this study (100–500 nm diameter) encapsulated with a thick, 415 nm, boron-doped diamond film. Therefore, this study provides a unique Au-NP diamond encapsulation of this size regime (2–75 nm diameter NPs, $ \leqslant $ 108.3 nm diamond film thickness) and is the first investigation to compare Ag- and Au-NP diamond encapsulation.
Performing diamond film growth on the fabricated NPs revealed variations in the diamond growth mechanisms and the quality of the assorted metals and NP sizes. A considerable differentiation can be made for the molecular content of diamond film growth incorporating Ag-NPs when compared to a film incorporating Au-NPs. The Ag-NP films were found to contain a much greater proportion of non-diamond formation, and in the instance of Ag-NPs of a median diameter of 29.6 nm, there was evidence of non-carbon species unique to this substrate (transpolyacetylene, low-quality diamond, and amorphous carbon). The Ag-NP diamond film growth presented a greater inclusion of non-sp3 disordered carbon (D-band) and graphitic carbon (G-band), with the 29.6 nm Ag-NP film exhibiting the greatest non-sp3 content. Additionally, for both metals a greater non-sp3 disordered carbon content occurred in the diamond grown over the larger 29.6 nm Ag and 27.1 nm Au-NPs when comparing to the smaller 10.4 nm Ag and 11.0 nm Au-NPs. A number of studies have reported similar graphitic content (D-, I-, and G-bands) in Ag-NP-encapsulating diamond films9,10,12 and Bellucci et al., who also observed the inclusion of transpolyacetylene.
Two main conclusions can be drawn regarding the diamond film growth quality over the NPs in this study: a greater non-diamond content is produced when growing over (1) Ag-NPs than for Au-NPs and (2) ~30 nm NPs than for ~10 nm NPs. Moreover, the non-diamond content increased with the diamond film thickness (Fig. 6f, g). This highlights the comparable difference between the overgrowth of Ag- and Au-NPs, where, in the case of this study, the Ag-NP substrates produced a diamond film of comparably lower quality. Ultimately, the films encapsulating Au-NPs were found to be of good quality, given the low indication of non-diamond formation, and were notably similar to the initial SCD substrate.
This variation between the Au- and Ag-NP diamond films is believed to be due to the movement of the Ag-NPs in the z-direction during growth. This could be a result of the high growth temperature (560 °C) in comparison to the temperature at which the Ag-NPs will reform (~600 °C). The resultant NP reformation and movement during diamond growth interfere with the extension of the diamond lattice structure, resulting in the formation of non-diamond species. This Ag-NP movement is further evidenced by the presence of large quantities of exposed Ag-NPs with greater (etched) film thicknesses. Furthermore, upon diamond film growth and subsequent removal via RIE, no noticeable alteration in the initial Au-NP structures was observed. Conversely, very little evidence of the initial Ag-NP structure was observed when the diamond film was completely removed. This demonstrates the ability of the diamond growth and etching processes to alter the Ag-NP structures. However, the further pursuit of Ag-NP diamond SERS is of interest, and lower-temperature growth systems could be considered30.
For grown diamond film thickness (20.4 nm on 10.4 nm Ag-NPs, 15.0 nm on 11.0 nm Au-NPs, 108.3 nm on 29.6 nm Ag-NPs, and 106.3 nm on 27.1 nm Au-NPs), thinner diamond film growth may be desirable to encapsulate NPs. However, more growth is required to fully encapsulate due to the introduction of the NPs. Therefore, it was proposed that this was a result of excessive growth in the [100] direction on either side of NPs before growth in the [110] and [111] directions was induced, resulting in growth far above the NP height before encapsulation. This is supported by the AFM scans (Fig. 3), where, based upon scan heights, the depth of pits (where NPs are) deepens before substrate surface smoothing during encapsulation.
Upon completion of the diamond film etching, the SERS responses of areas with varied film thicknesses were investigated using R6G. When the substrate was exposed to the Au etchant, any NPs exposed via diamond film etching were removed, especially the thinnest diamond films, given that the NPs were fully exposed. Therefore, only the fully encapsulated NPs contributed to SERS enhancement. As shown in Fig. 7, no R6G peaks and, consequently, SERS enhancement were observed for the 10.4 nm Ag-NP substrate at any film thickness. This could be due to the inability of Ag-NPs in this size regime to stimulate an enhancement field with the ability to project onto the diamond-air interface. Alternatively, it may simply be that the diamond growth and etching processes unfavourably modified the Ag-NP structures.
However, the larger 29.6 nm Ag-NPs successfully exhibited SERS-enhanced R6G peaks for a single diamond film thickness of 54.3 nm (EF = 5.6 × 10³). Enhancement of only the diamond film of this thickness and no other evidence indicate that Ag-NPs migrate in the z-direction during diamond growth. Conversely, both the Au-NP substrates exhibited SERS enhancement at multiple diamond film thicknesses. The 11.0 nm Au-NPs enhanced the R6G analyte with diamond film thicknesses of 8.7, 12.0 and 13.3 nm, where 12.0 nm provided the greatest EF = 3.1 × 10³. The 27.1 nm Au-NPs provided R6G enhancement with film thicknesses of 31.3 and 37.0 nm, where the 31.3 nm film provided a larger enhancement with EF = 6.9 × 10³. Therefore, this 31.3 nm thick epilayer over 27.1 nm diameter Au-NP diamond film provided an optimised enhancement of the tested substrate configurations.
Although gap effects between NPs can dominate SERS signal intensity with exposed NPs, this can be assumed to be very minor or insignificant because of the prevention of analyte interactions between NPs by the diamond film. The diamond film encapsulating the NPs ensured a monolayer of analyte above the NPs when performing the measurements. Given AFM and SEM characterisation was comprehensive across the area of the substrates, the median diameter and interparticle distance of the plasmonic-enhancing NPs were assumed to be uniform across the substrate prior to growth. However, the large-area SERS spatial uniformity was not fully quantified in this study; therefore, future studies should include Raman mapping or measurements over a large grid of points. Without this, maintaining the NP morphology throughout the growth and diamond film thickness were the main considerations for fabrication at this stage.
When examining the optimised enhancement structure in this study, it can be considered that the main parameter reducing the enhancement is the analyte-NP distance. Given the encapsulation of NPs in diamond, the minimum analyte-NP distance was at the diamond film surface. The distance dependence of SERS can be quantified using Eq. 131, where $ a $ is the NP radius and $ r $ is the analyte-NP surface distance. For the optimised enhancement structure, NPs are 27.1 nm in diameter ($ a = 13.55 $ nm) and encapsulated in 31.3 nm diamond film ($ r = 4.2 $ nm). This provided a theoretical SERS intensity of 6.7% of the intensity at the NP surface. This may then be reduced further by the diamond dielectric; however, it should be noted that diamond is known to have a very low attenuation coefficient at 532 nm ($ \leqslant $ 0.1 cm−1 32). The local thickness was assumed to be uniform and flat when evaluating AFM and SEM characterisation. However, film thickness measurements are taken from AFM step measurements at the etch area edges; therefore, ensuring uniformity is challenging. Should thickness variations occur, this would influence the effective analyte-NP distance.
$$ I_{\rm{SERS}} = \left( \dfrac{a+r}{a} \right)^{-10} $$ (1) Controlling the diamond film roughness may provide greater enhancement mechanisms and surface hot spot density, especially given the diamond light-scattering qualities14−16,33. This can be achieved through altered growth parameters or post-growth-intentional roughening techniques. However, this can compromise the film quality and adversely affect the optical properties of the system.
The diamond film thicknesses providing the greatest enhancement for each substrate (excluding 10.4 nm Ag-NPs, 12.0 nm on 11.0 nm Au-NPs, 54.3 nm on 29.6 nm Ag-NPs, and 31.3 nm on 27.1 nm Au-NPs) were then tested with R6G of lower concentrations, where the LOD was determined to be 1 × 10⁻⁵ M. This is incomparable to the pinnacle of paper-based SERS with R6G LOD down to 1 × 10⁻¹¹ M34, although diamond-based SERS provides reusability and real-world environmental deployment suitability while remaining applicable for automated fabrication. Nevertheless, the LOD reported here is comparable to those of commercially available SERS substrates, although the NPs are encapsulated within diamond films35.
Varying the laser wavelength demonstrated enhancement capability with both 532 nm and 514 nm excitation for R6G. However, the 532 nm excitation provided a greater signal intensity, indicating a substrate resonance closer to 532 nm; hence, it is the most suitable excitation for diamond-encapsulated SERS. Furthermore, the detection of MB provided evidence that the enhancement did not rely exclusively on analyte resonance effects. This was because the excitation wavelengths supporting the detection of MB matched those of R6G (532 nm and 514 nm).
The diamond SERS films were subjected to chemical, thermal, and physical robustness tests to determine their reusability via exposure to extended sonication, extended Au etchant, 400 °C in the atmosphere, and 3,000 G sandpaper abrasion. No perceptible changes in SERS enhancement potential were observed, ultimately proving the robustness of the diamond SERS platform for applications in previously unobtainable SERS application areas. It should be emphasised that all repeated measurement tests were conducted on the same substrate area with no degradation following analyte removal and repeated exposure, suggesting reliable substrate reusability. The reusable diamond SERS measurement protocol is illustrated in Fig. 1f.
Previous approaches towards robust SERS substrates have been reported using steel wire meshes4, SiO2 coatings5, nickel foam cages6, copper foam coatings7, boron nitride coatings8 and diamond-like carbon coatings (DLC)36,37. Each addressed certain SERS robustness challenges, where the steel wire mesh (laser beam heat dissipation), SiO2 coating (tested at 900 °C), and boron nitride coating (tested at 700 °C) provided varying degrees of thermal resistance. Although tested only at 400 °C in this study, diamond has been shown to resist oxidation to > 700°C in the atmosphere, indicating that diamond SERS substrates are suitable for use at very high temperatures38.
Additionally, the boron nitride coatings enabled the possibility of reusing the substrate multiple times following exposure to 15% nitric acid in water, indicating a similar level of chemical resilience to diamond SERS. However, SiO2 and boron nitride coatings cannot address physical robustness issues. DLC coatings have been reported to provide oxidative resilience to Ag-NPs while producing further SERS enhancement. Substrate resilience has yet to be investigated in DLC-coated SERS.
The nickel foam cages exhibited physical robustness and the ability to withstand sandpaper abrasion (3,000 G). Although an initial SERS signal reduction was observed (3%) owing to abrasion, no further reduction in enhancement was observed with further abrasive cycles. Furthermore, the nickel foam-cage SERS substrates resisted damage from sonication (30 mins) with only a minor signal reduction (12%). The copper-foam coatings exhibited similar signal drops after 100 sandpaper abrasion cycles (14%). The diamond SERS substrates exhibited no loss of SERS intensity after the same abrasion and sonication procedures, proving their superior physical robustness.
Overall, although previous studies have independently addressed certain SERS challenges, none have achieved a fully robust system. Moreover, in terms of practical durability, other studies on robust SERS have been conducted on fragile substrate materials. The substrates presented here are covered entirely with diamond, which addresses all the longevity and durability concerns. Diamond provides a chemically, physically, and thermally resilient platform that enables robust and reusable SERS measurements in almost any setting.
-
This study provides the first comprehensive comparison of the suitability of the two most commonly reported plasmonic metals, Ag and Au, for incorporation into thin diamond films. These films were assessed for their application as robust and reusable SERS substrates for the detection of the common test analyte R6G. This evidence supports the conclusion that Au-NPs are preferable to Ag-NPs. The Ag-NPs induced much greater non-diamond formation during film deposition, which appeared to shift in the z-direction. This introduces fabrication challenges, as their durability during growth and subsequent etching is doubtful. Additionally, regarding the application of SERS sensing, Au-NPs for both sizing regimes (~10 nm and ~30 nm median diameter) provided greater analyte enhancement. Au-NPs of median diameter 27.1 nm showed optimised enhancement in a diamond film of thickness 31.3 nm, providing an EF = 6.9 × 10³ and LOD of 1 × 10⁻⁵ M. The plasmonic diamond films were then assessed in terms of robustness and reusability, demonstrating their capability to endure sonication, Au etching, 400 °C (atmosphere), and 3,000 G sandpaper abrasion. This replicates and surpasses the previously reported SERS substrate resilience, while preventing any degradation in SERS response. Furthermore, the continued use of substrates via sonicated solvent analyte removal demonstrated a promising reusable SERS operation, providing comparable enhancement to commercially available substrates. This study substantially improves the current state of reusable and robust SERS substrates with promising application potential in laboratory measurements and beyond.
-
In this study, 4 × 4 × 0.3-mm optical-grade single-crystal diamond {100} substrates (two-side polished) (Chenguang Machinery) were used. An initial cleaning step was performed via submersion in an acid solution (20 g (NH4)2S2O8): 20 ml H2SO4, 200 °C, 20 min) and subsequent rinse solution (10 ml H2O2 : 10 ml H5NO, 10 min) to ensure removal of undesired surface compounds39.
Primary substrate characterisation was performed using Raman spectroscopy (Renishaw InVia Raman Spectrometer, 532 nm excitation) and AFM (Bruker Dimension Icon). Subsequently, an asymmetric Au film ($ \sim $100 nm) was sputtered (Lesker PVD75) on the substrate corners to provide a masked area for diamond deposition measurements. This Au film has a thickness greater than that which would dewet with H2 plasma treatment, ensuring that it will remain continuous and preventing diamond growth in the desired area.
-
Metallic NPs were fabricated via metallic deposition and subsequent annealing. Ag was deposited on the prepared diamond substrates via physical vapour deposition (Edwards A306 metal box evaporator) using an Ag wire. Following deposition, exposure to air drives Ag oxidation; however, this can be disregarded owing to burn-off during annealing (and diamond growth). Au films were deposited on the diamond via sputter coating (EMscope SC500). The thicknesses of the deposited Au and Ag films were varied to control dewetted NP characteristics.
Subsequently, the deposited films were dewetted into NPs using an H2 plasma annealing process (Seki Technotron AX5010 diamond growth reactor). Au and Ag films were annealed under identical conditions. To avoid the evaporation of Ag ($ \sim $600 °C), the plasma was heated to 560 °C. Plasma heating was conducted to this temperature and then immediately decreased via control of pressure and microwave power.
SEM analysis (Carl Zeiss XV1540) was used to investigate the NPs (Fig. 2). To minimise oxidation prior to characterisation, the samples with Ag-NPs were subjected to minimal air exposure. Subsequent SEM images were analysed using ImageJ analysis software to determine the NP diameter and interparticle distance. The ImageJ plugin, nearest distances (ND), was used40.
Both the SEM images and AFM scans indicated that the dewetting process was influenced by the presence of surface defects on the substrate, such as polishing lines. Therefore, a flatter surface is preferred for uniform dewetting. Not all NPs appeared to be fully spherical in the 2D plane, potentially because of the uneven nature of the substrate as a result of the trenches. However, AFM scans confirmed that the majority of NPs were of approximately the same height as the diameter, confirming their spherical nature.
-
Diamond film growth to encapsulate NPs was performed using a Seki Technotron AX5010 diamond growth reactor. A base pressure of 2 × 10⁻⁵ mBar was used for each growth step, with additional H2 flushes to evacuate the chamber of contaminants. Growth was conducted at 560 °C with a microwave power of 625 W and pressure of 35 Torr. A gas mixture of 0.25% CH4 in H2 was used (0.5:199.5 sccm) to enable precise and high-quality diamond growth.
Raman spectroscopy was used to investigate the grown films using a Renishaw InVia Raman system with 532 nm excitation (0.45 mW). Spectra collected over five 20s accumulations were averaged over three different random position measurements across the substrates. Using OriginPro software, the resultant spectra underwent asymmetric least-squares baseline subtraction (asymmetric factor = 0.0001, threshold = 0.001, smoothing factor = 9, and number of iterations = 10) to remove background fluorescence. No additional smoothing or cosmic-ray removal was performed. The baseline subtraction spectra were normalised to 1 and analysed with the origin fit peak function using Gaussian peak shapes and an auto-fit control. An example of fluorescence subtraction and peak fitting is shown in Fig. S8.
-
The diamond films were then etched to investigate the influence of film thickness and obtain the optimised conditions for SERS measurements. Diamond etching was achieved using O2-plasma RIE. Based on previously reported shallow etching, 200 W was used to generate an O2 plasma with a 40 sccm oxygen flow at 10 Pa41.
-
Following diamond film etching, the substrate SERS enhancement was investigated using R6G (Merck, 99% purity) at a concentration of 1 × 10⁻⁴ M. The substrates were exposed to R6G solution for 10 min, rinsed with DI water, and dried with N2. Each measurement consisted of five accumulations of 20 s exposure with a Renishaw InVia Raman system at 1% power (457 nm: 0.3/30 mW, 514 nm: 0.5/50 mW, 532 nm: 0.45/45 mW, 633 nm: 0.3/30 mW). In this setup, a laser beam was collimated, expanded, and coupled to the microscope. The beam was focused on the SERS surface using a 20× Olympus microscope objective (numerical aperture (NA) = 0.75), leading to a diameter of 865 nm. Backscattered Raman spectra were collected using the same microscope objective, optically filtered, dispersed, and analysed using a highly sensitive CCD detector. In this collection, a diffraction grating with 2,400 lines/mm was used. Fluorescence was subtracted by asymmetric least-squares baseline subtraction (asymmetric factor = 0.001, threshold = 0.01, smoothing factor = 3, and number of iterations = 10) using OriginPro software. An example of fluorescence subtraction is shown in Fig. S9. No additional smoothing or cosmic-ray removal was performed. R6G intensity values were averaged from the 612 cm−1 peak height of three different random position measurements across the areas of interest, and the standard error was calculated from the three measurements. To determine the substrate limit of detection (LOD), measurements were taken for further diluted R6G at concentrations 1 × 10⁻⁵ M and 1 × 10⁻⁶ M. Additionally, Methylene Blue (MB) (Merck, $ \geqslant $ 97% purity) was used to investigate SERS response at a concentration of 1 × 10⁻⁴−1 × 10⁻⁶ M, using the same preparation method as for R6G. Analyte removal was performed via consecutive sonication in methanol, acetone, and IPA (5 min each) when required.
SERS enhancement was then quantified via EF calculations using Eq. 231, where $ I_{\rm{SERS}} $ represents SERS intensity, $ I_{\rm{Raman}} $ is the standard Raman intensity (both taken from the 612 cm−1 R6G Raman peak), $ N_{\rm{SERS}} $ is the number of molecules near the SERS nanostructure, and $ N_{\rm{Raman}} $ is the volume which gives rise to $ I_{\rm{Raman}} $. Additionally, $ Re_{\rm{SERS}} $ and $ Re_{\rm{Raman}} $ represent the Si reference considered for equipment variability. An example of this calculation is provided in the SI.
$$ EF = \dfrac{I_{\rm{SERS}}/N_{\rm{SERS}}}{(I_{\rm{Raman}}/N_{\rm{Raman}})\times \dfrac{Re_{\rm{SERS}}}{Re_{\rm{Raman}}}} $$ (2) -
Finally, to examine the robustness and reusability, substrates were sequentially exposed to harsh simulated conditions. 30 mins of sonication (Guyson Kerry KC2 ultrasonic bath) in DI water was conducted, followed by extended Au etchant exposure for 30 mins. Following this, to establish thermal stability, substrates were exposed to 400 °C for 30 mins in atmospheric conditions by means of a hotplate (Thermic Edge). The substrates were then subjected to abrasion using 3,000 grit sandpaper to ascertain their physical robustness. A 20 g weight was affixed to the underside of the substrates with carbon tape for providing a force of 1.25 g·mm−2. Without applying extra pressure to the weighted substrates, they were manually pushed 10 cm along the sandpaper repeatedly for 100 cycles. Under each harsh condition, exposure R6G 1 × 10⁻⁴ M was added to enable SERS measurements. Subsequently, R6G was removed via solvent sonication and re-added upon the next exposure to harsh conditions.
-
Engineering and Physical Sciences Research Council (EPSRC) of the UK and SLB Cambridge Research Ltd, Grant/Award Number: EP/W524335/1. The authors are grateful to the UK’s Engineering and Physical Sciences Research Council (EPSRC) and SLB Cambridge Research Ltd. for the award of a CASE PhD studentship (EP/W524335/1) to KNT, supervised by RBJ. The authors thank Dr. Calum S. Henderson for proofreading the manuscript and Dr. Henderson and Dr. Rebecca J. Watkins for their advice throughout fabrication and analysis. We also thank undergraduate student Edward Young for his assistance with nanoparticle characterisation. The LCN cleanroom is acknowledged for the invaluable support of technicians operating the AFM, SEM and evaporation tools. The Royce Imperial cleanroom is also acknowledged for its assistance with Reactive-ion etching (RIE).

 DownLoad: