






-
In the realm of biomedical imaging, the demand for non-invasive, high-resolution techniques for assessing tissue biomechanics continues to drive innovation. Optical coherence elastography (OCE) has emerged as a promising technique, offering high-resolution, non-invasive imaging for evaluating tissue mechanical properties in vivo1−3. Among various OCE techniques, shear wave-based methods have gained substantial attention due to their ability to generate quantitative elasticity maps4,5 and provide detailed insights into tissue viscoelastic properties6,7. Compared to other elastography modalities, such as magnetic resonance elastography and ultrasound elastography, which typically offer millimeter-scale imaging resolution8,9, OCE is distinguished by its ability to achieve micrometer-scale (~2–10 µm) imaging resolution10−12.
Elastic properties reflect structural integrity, while viscoelastic properties can reveal early or subtle disease progression. Numerous studies have explored the elastic properties of biological tissues using wave-based OCE. These investigations include measurements of the shear modulus and Young's modulus of the cornea13−16, Young's modulus of the porcine liver17, and the elasticity of mouse brain tissue18−20. In purely elastic materials, waves propagate without energy loss, resulting in a single, consistent velocity across all frequencies. However, in viscoelastic materials, loss mechanisms cause frequency-dependent variations in wave speed, a phenomenon known as dispersion21,22. The dispersion curves and viscoelastic properties of biological tissues have been examined in various studies, including the dispersion curve of porcine cornea23−25, viscoelastic characterization of porcine cornea26, and shear viscosity of chicken liver27. Additionally, Poul et al.28 demonstrated that the viscoelastic behavior of bovine liver tissue can be modeled using a two-parameter power-law model for shear wave speed (SWS) dispersion.
Reverberant shear wave fields provide a novel framework for enhancing the characterization of tissue biomechanics in elastography29−31. These fields arise from the superposition of shear waves propagating in multiple directions, including reflections from tissue boundaries and internal heterogeneities. Recent advancements have highlighted the potential of this method for probing complex biological tissues, where conventional single-point techniques may fail to capture the full mechanical behavior32−34.
To accurately analyze the viscoelastic and lossy nature of the biological tissues using shear wave elastography, it is essential to estimate SWS across multiple frequencies35,36. However, several shear wave OCE methods rely on a single excitation frequency, limiting their ability to fully capture complex tissue mechanics, particularly the dispersive viscoelastic properties. Other impulsive excitation methods can be used to impart a band of frequencies within a propagating transient wave10; however these decay rapidly with distance away from the source location.
To address this limitation, we introduce multi-frequency reverberant optical coherence elastography (MFR-OCE). The advantages of MFR-OCE include robust shear wave propagations within a 3D volume and simultaneously across a discrete set of frequencies spanning a broad bandwidth. Given the inherent temporal variability of the viscoelastic properties of tissue ex vivo, used to establish and validate the technique, single-shot measurements ensure robust and reliable results. In vivo, simultaneous measurements will accelerate data collection, enabling the measurement speeds necessary for clinical application. This paper presents the theoretical framework, simulations, experimental setup, and preliminary results of MFR-OCE on homogeneous gelatin phantoms, a phantom with a lesion, porcine corneas, and bovine liver, demonstrating its potential to enhance both elastic and viscoelastic tissue characterization for clinical applications.
Recent advances in multi-frequency elastography using ultrasound and magnetic resonance imaging have significantly improved the quantification of viscoelastic properties in soft tissues. In ultrasound elastography (USE), by analyzing the frequency-dependent propagation of shear waves, shear wave dispersion has been estimated. This approach has shown particular utility in chronic liver disease and liver cirrhosis staging37,38. In the domain of magnetic resonance elastography (MRE), multi-frequency acquisitions have enabled reconstruction of complex mechanical parameters, such as storage and loss moduli, through advanced inversion algorithms39. For instance, Tzschätzsch et al. demonstrated the efficacy of tomographic MRE in the human brain by applying multifrequency wave number recovery and inversion techniques to map viscoelastic parameters with enhanced stability and accuracy40. Despite their valuable contributions, both MRE and ultrasound elastography are limited by relatively low spatial resolution, which restricts their applicability in bulk tissues. Optical coherence elastography (OCE), by contrast, offers non-contact, micron-scale resolution imaging, making it uniquely suited for ophthalmic applications. Its ability to resolve fine biomechanical variations in the cornea, lens, and retina renders OCE an indispensable tool for ocular diagnostics and for monitoring disease progression and treatment response in vivo such as early diagnosis of keratoconus and glaucomatous changes41,42.
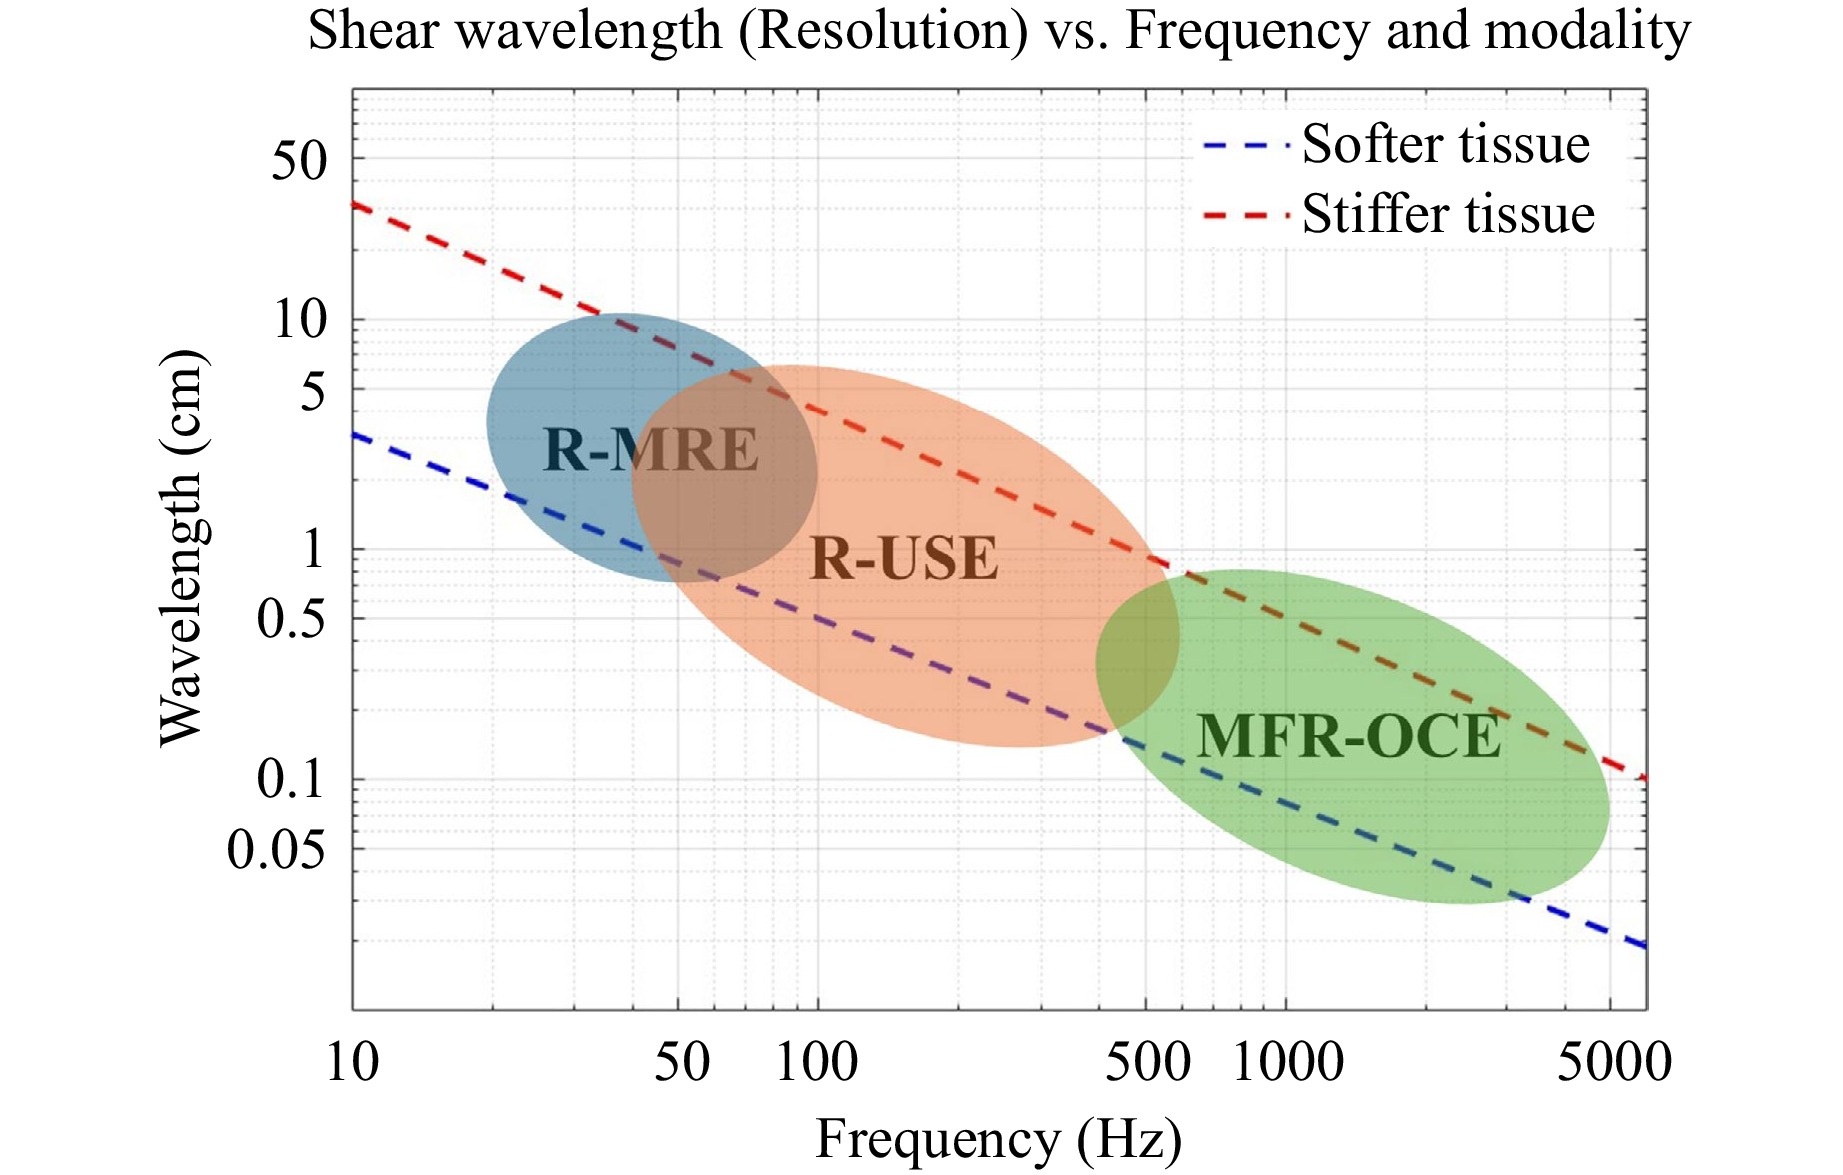
To further underscore the distinguishing features of the proposed MFR-OCE technique, we compare its operational frequency range and corresponding shear wavelength, (related to spatial resolution) with other elastographic modalities. Fig. 1 illustrates the frequency-wavelength domain for three representative techniques: MRE, USE, and MFR-OCE. Each technique operates within a characteristic frequency range: MRE typically between 20–100 Hz; USE from 40–600 Hz, and MFR-OCE within a substantially higher band of 400 Hz–5 kHz. The vertical axis represents the shear wavelength in soft tissues, serving as a representation for spatial resolution. This comparison highlights the unique wavelength regime of MFR-OCE, demonstrating its capacity for achieving micrometer-scale resolution critical for in vivo assessment of biomechanical properties.
-
The angular integral autocorrelation (AIA)45 method was employed to estimate the SWS across various frequencies. Given that the wavelength increases as the frequency decreases, a larger autocorrelation window size was used for lower frequencies to ensure that an adequate number of waves were included in the autocorrelation calculation. Fig. 2 shows the reconstructed 3D SWS maps at different excitation frequencies for the simulated two-sided medium containing softer (1 m/s) and stiffer (2 m/s) regions. The distinct contrast between these regions is clearly visible across all excitation frequencies, confirming that the AIA algorithm accurately differentiates materials with different shear properties. As the frequency increases, the estimated SWS becomes more uniform within each side of the medium, reflecting improved spatial resolution and reduced edge artifacts. Minor variations in SWS at the boundary between the two materials are attributed to the windowing effect, an inherent trade-off between spatial resolution and estimation stability.
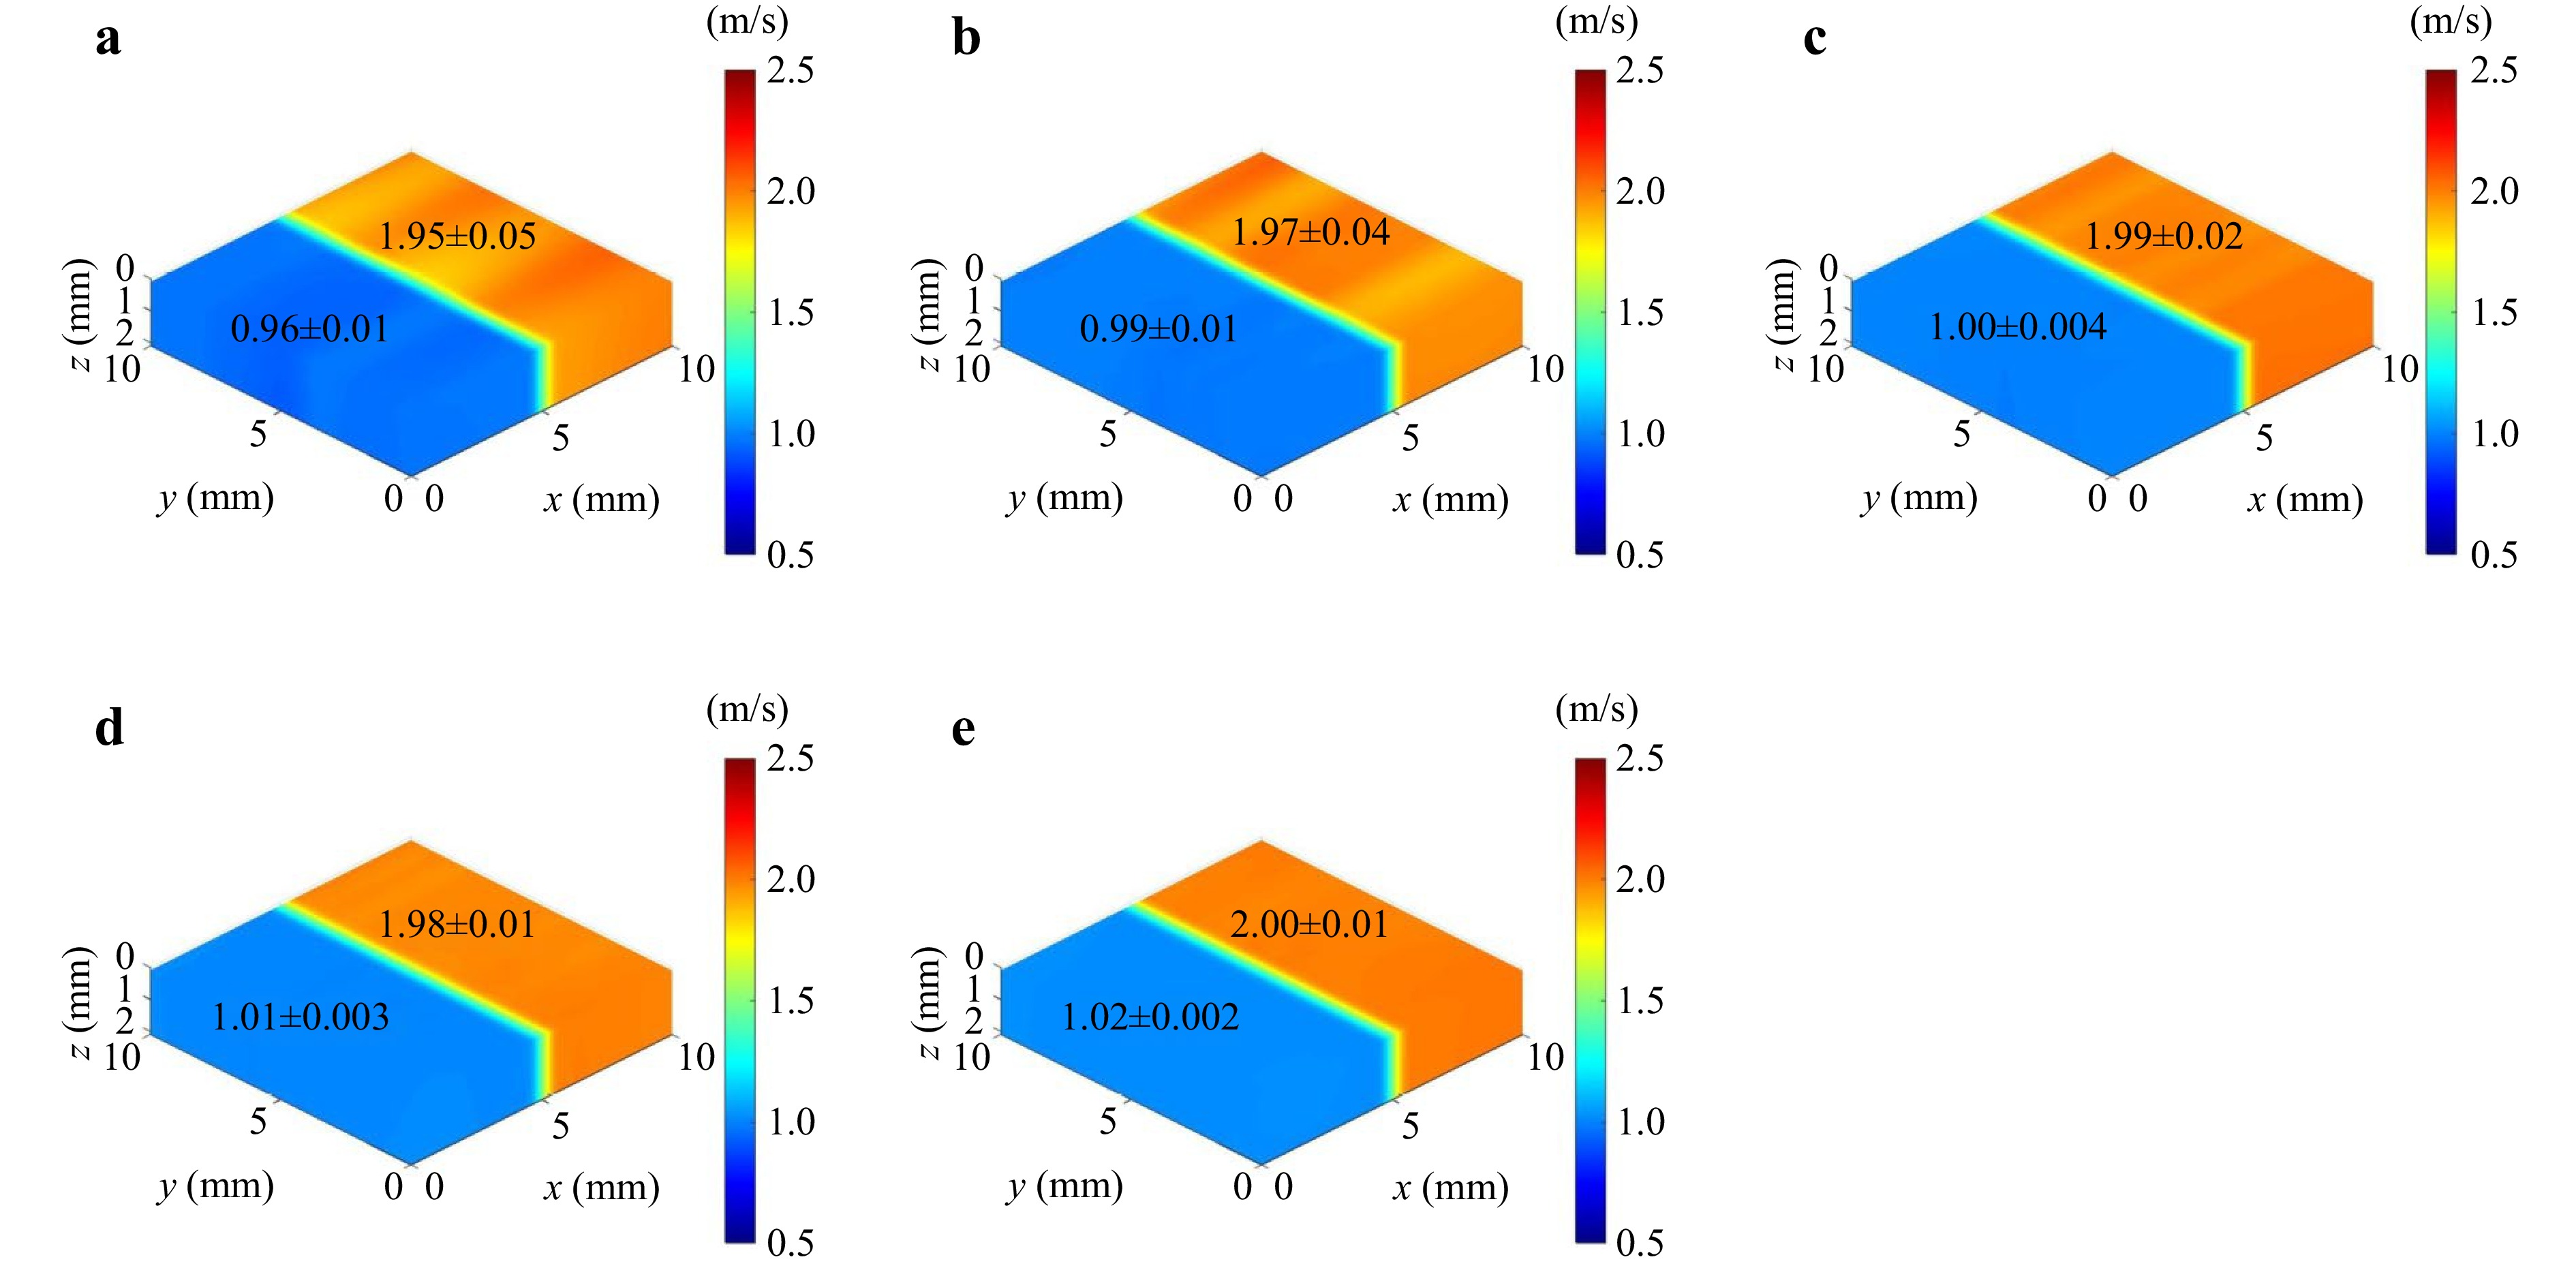
Fig. 2 3D SWS maps obtained from the simulated two-sided medium at different excitation frequencies, i.e., a 500 Hz, b 1 kHz, c 1.5 kHz, d 2 kHz, and e 2.5 kHz, using the AIA method.
Fig. 3 presents the mean SWS for each side of the simulated medium across different excitation frequencies. At all frequencies, the estimated SWS values on both sides closely matched the defined values for the model, with an error of less than 4%. The observed SWS deviation arises primarily from the autocorrelation window and nonlinear curve-fitting in the AIA estimation algorithm, which defines the intrinsic precision of the method, as opposed to being caused by white Gaussian noise45. The power-law exponent was estimated to be 0.01 (higher SWS, orange) and 0.04 (lower SWS, blue), indicating a nearly dispersionless elastic response in the simulated system.
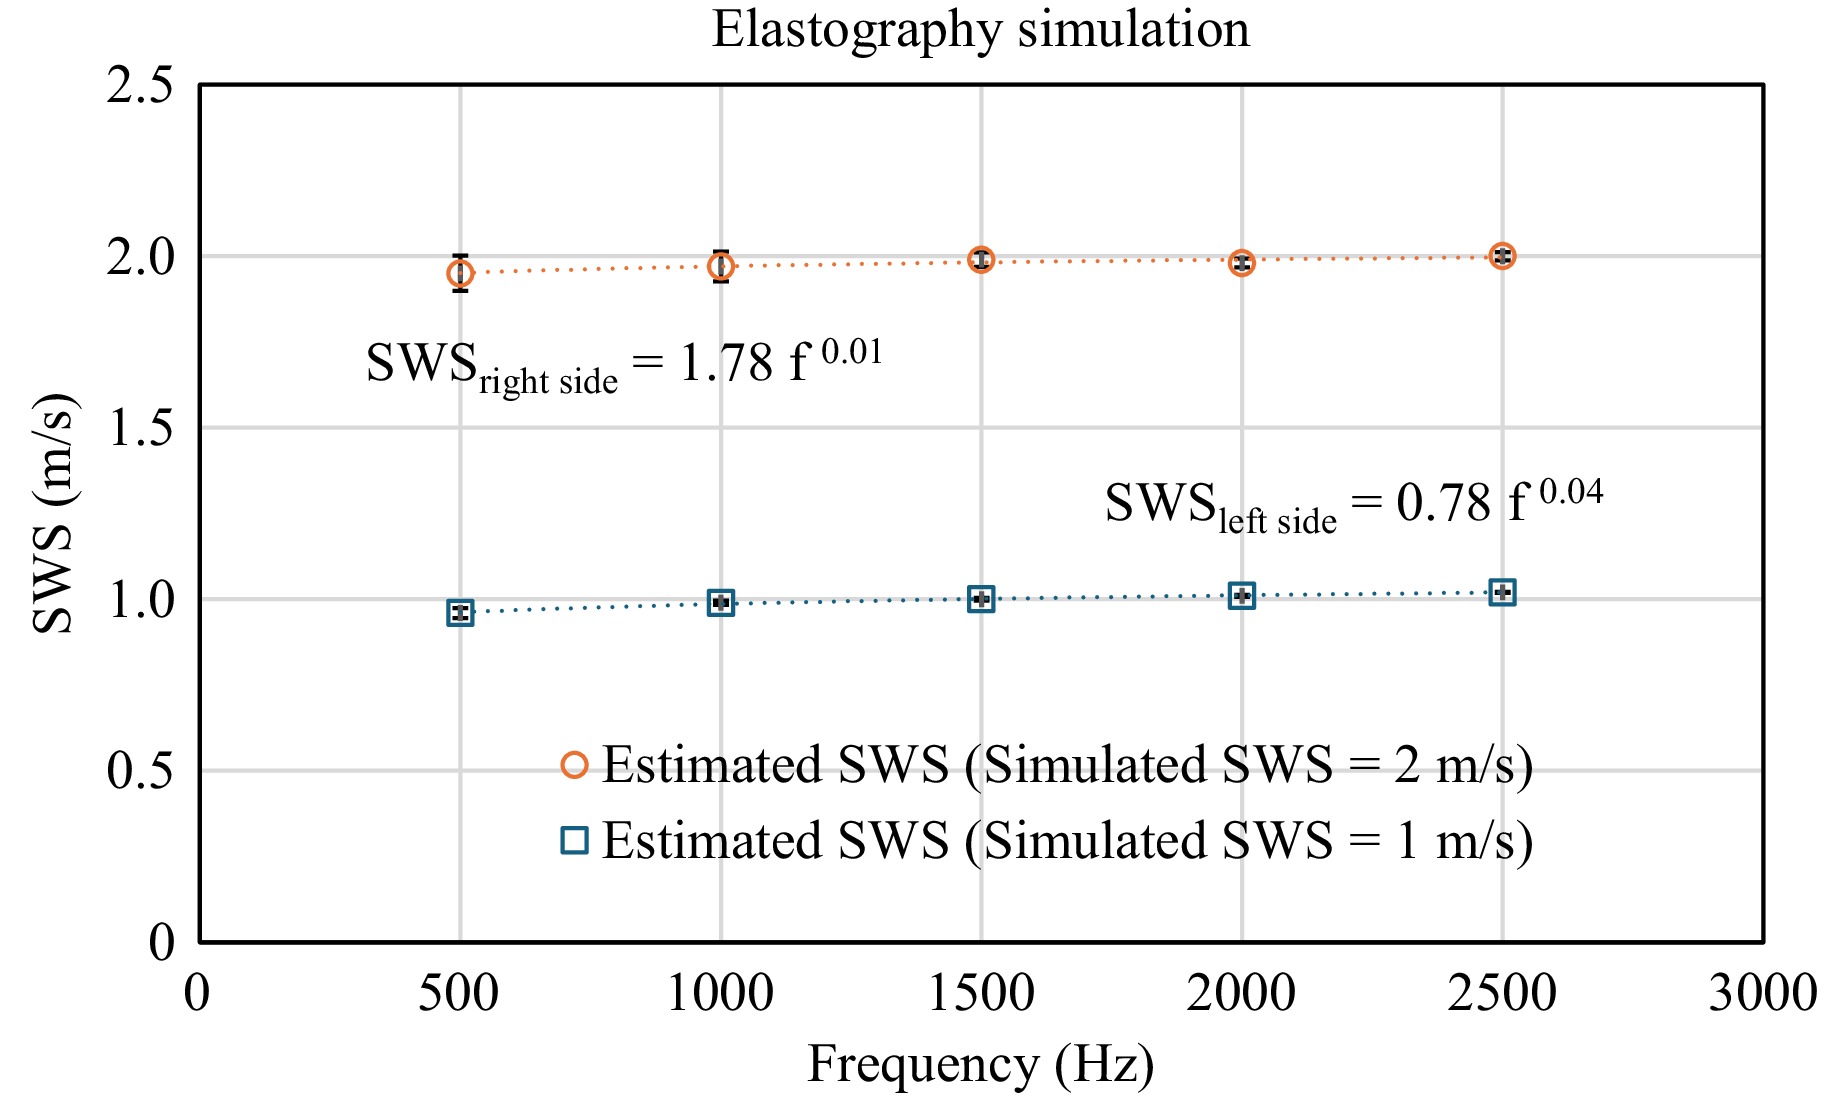
Fig. 3 Mean SWS estimated for the simulated two-sided medium across different excitation frequencies.
-
Fig. 4 presents the results for one of the 5% gelatin phantom samples. To visualize its internal structure, a pie cut was made in the 3D maps. The 3D B-mode scan of the phantom is shown in Fig. 4a. The preload from the multi-pronged arms caused small displacements at various boundary locations, which can be observed on the phantom's surface in Fig. 4a. The wave fields for each individual frequency were extracted from the multi-frequency reverberant shear wave field using bandpass frequency filters, each with a 10 Hz bandwidth centered at the corresponding excitation frequency. Figs. 4b through 4f illustrate the 3D reverberant shear wave fields at frequencies of 500 Hz, 1 kHz, 1.5 kHz, 2 kHz, and 2.5 kHz, respectively. The wavelength in the wave fields decreases as the frequency increases. The shear wave propagation originating from the multi-pronged arms is particularly evident. For a more detailed visualization of each extracted wave field, a 2D cross-section in the xy-plane at a depth of 0.3 mm is shown in Fig. S1.
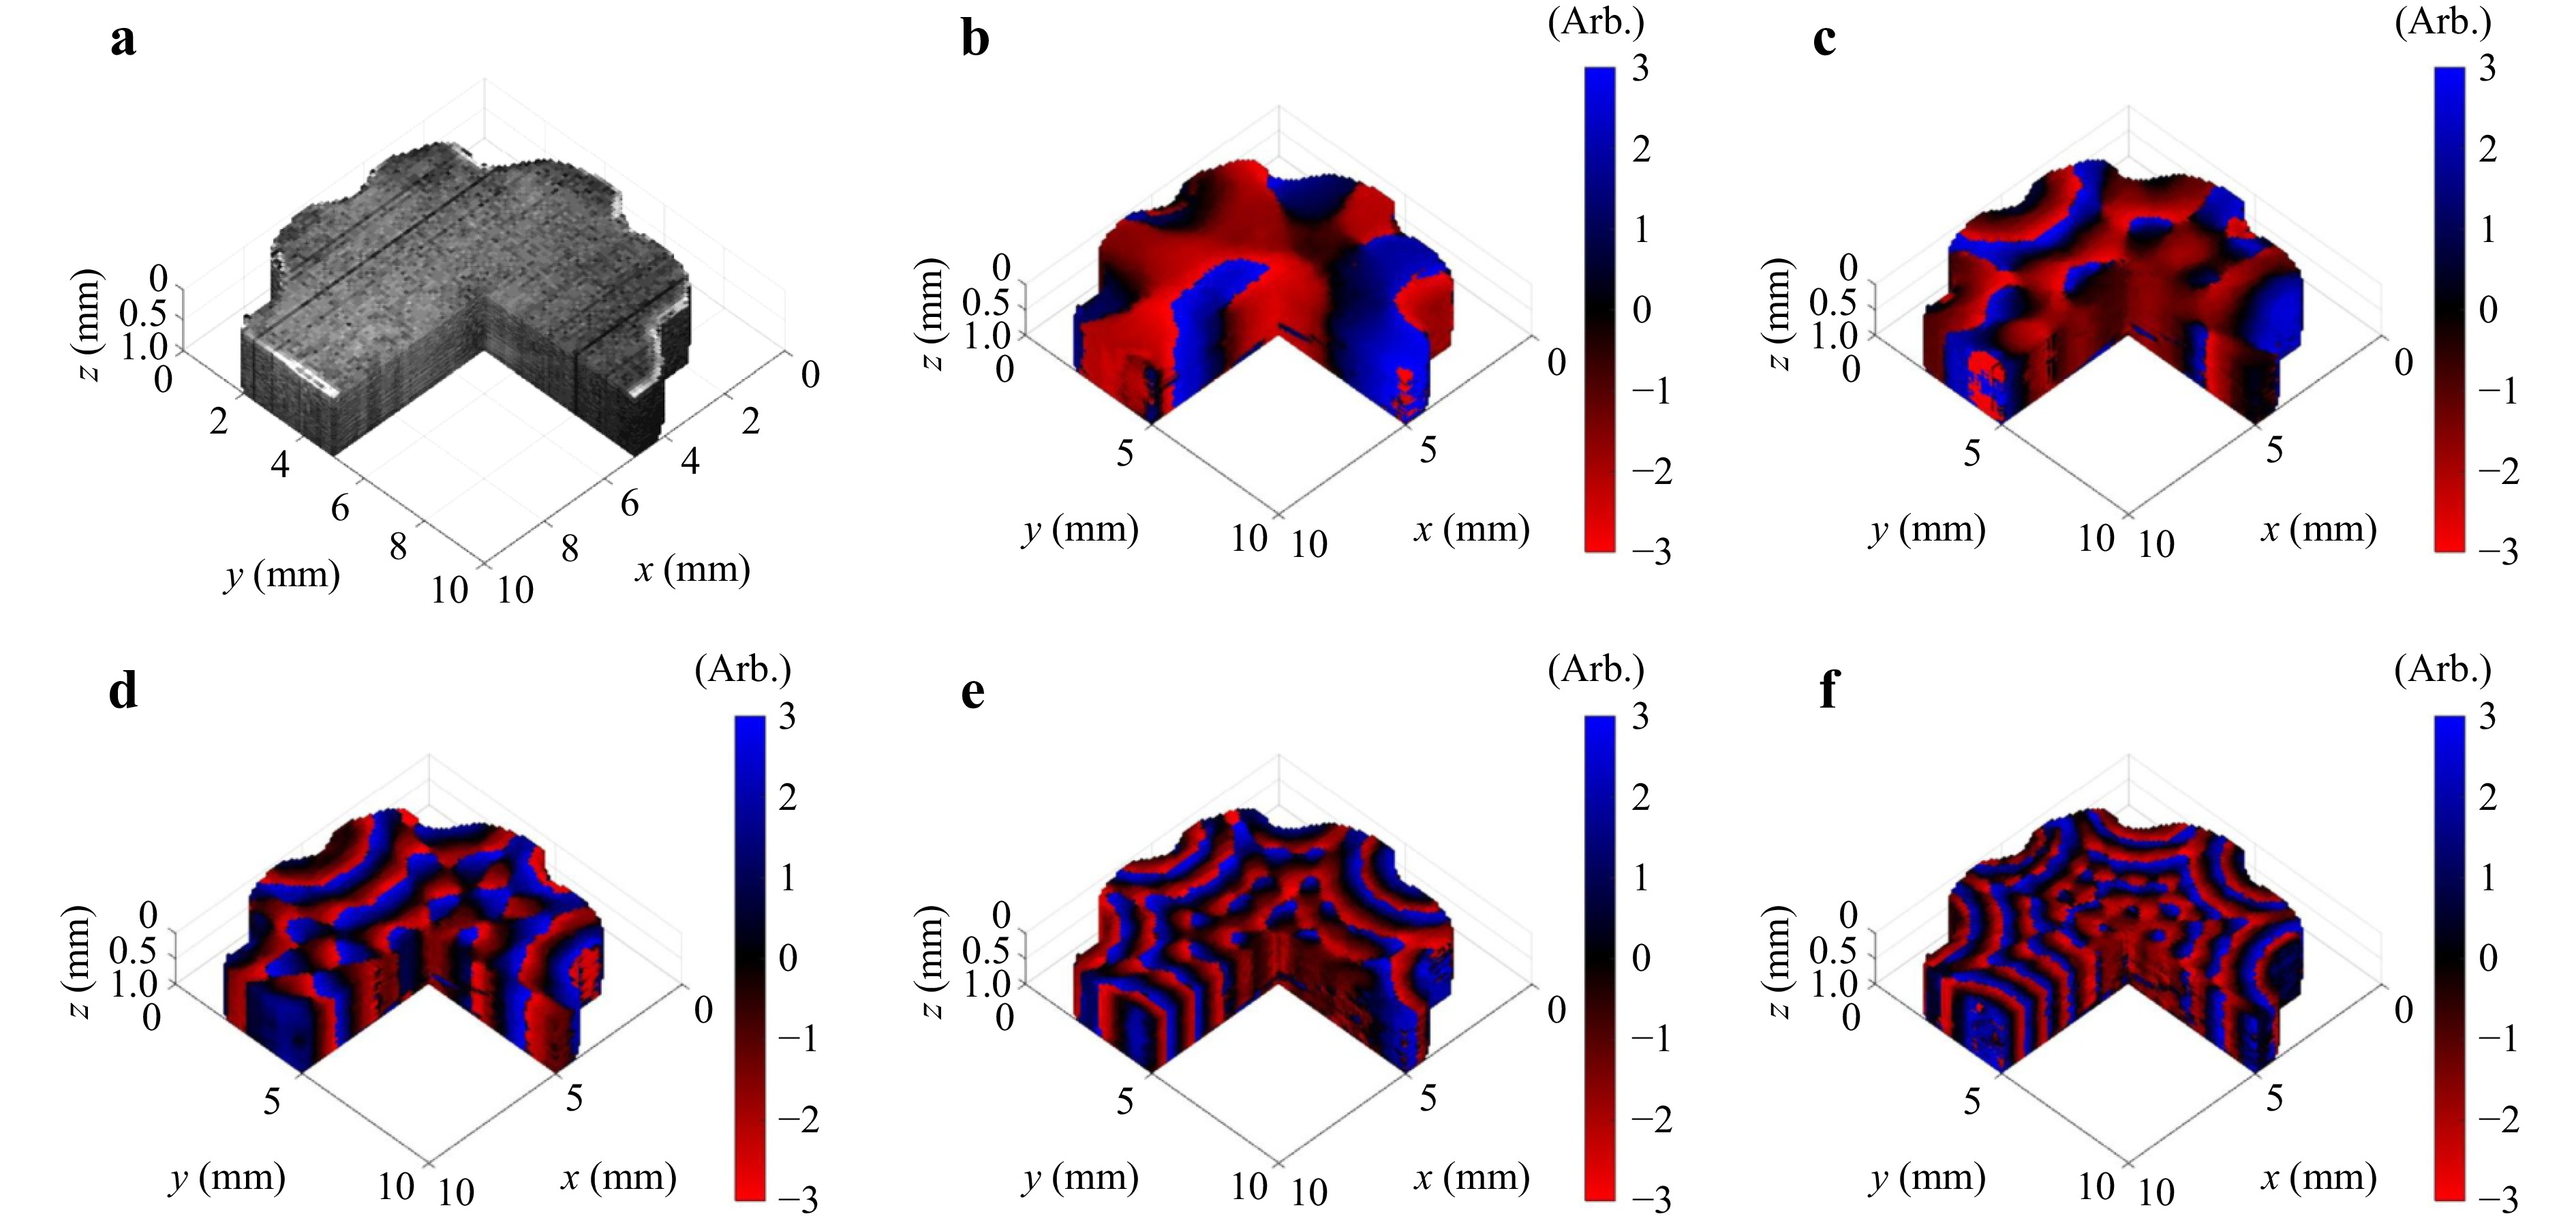
Fig. 4 3D maps with a pie-cut view to visualize the internal structure for a 5% gelatin phantom a B-mode scan and extracted reverberant shear wave field at: b 500 Hz, c 1 kHz, d 1.5 kHz, e 2 kHz, and f 2.5 kHz.
The SWS map for each frequency was estimated using the AIA approach. For 500 Hz and 1 kHz, an autocorrelation window size of 7.9 mm × 7.9 mm was used, whereas a smaller window size of 4.9 mm × 4.9 mm was applied for higher frequencies (1.5 kHz, 2 kHz, and 2.5 kHz). A larger autocorrelation window was generally used to ensure uniform SWS estimates, particularly for lower frequencies, due to their longer wavelengths. Fig. 5 illustrates the estimated SWS at different frequencies, where a slight increase in SWS with increasing frequency was observed, indicating low dispersion behavior in the phantom. Near-field effects from the excitation ring are visible in the reverberant wave fields, particularly near the contact arms (see Fig. 4 and Fig. S1). These local amplitude variations are effectively minimized in the final SWS maps because the AIA method averages the spatial autocorrelation over all directions, and a relatively large autocorrelation window was employed to include several wavelengths within each estimate, yielding spatially uniform results.
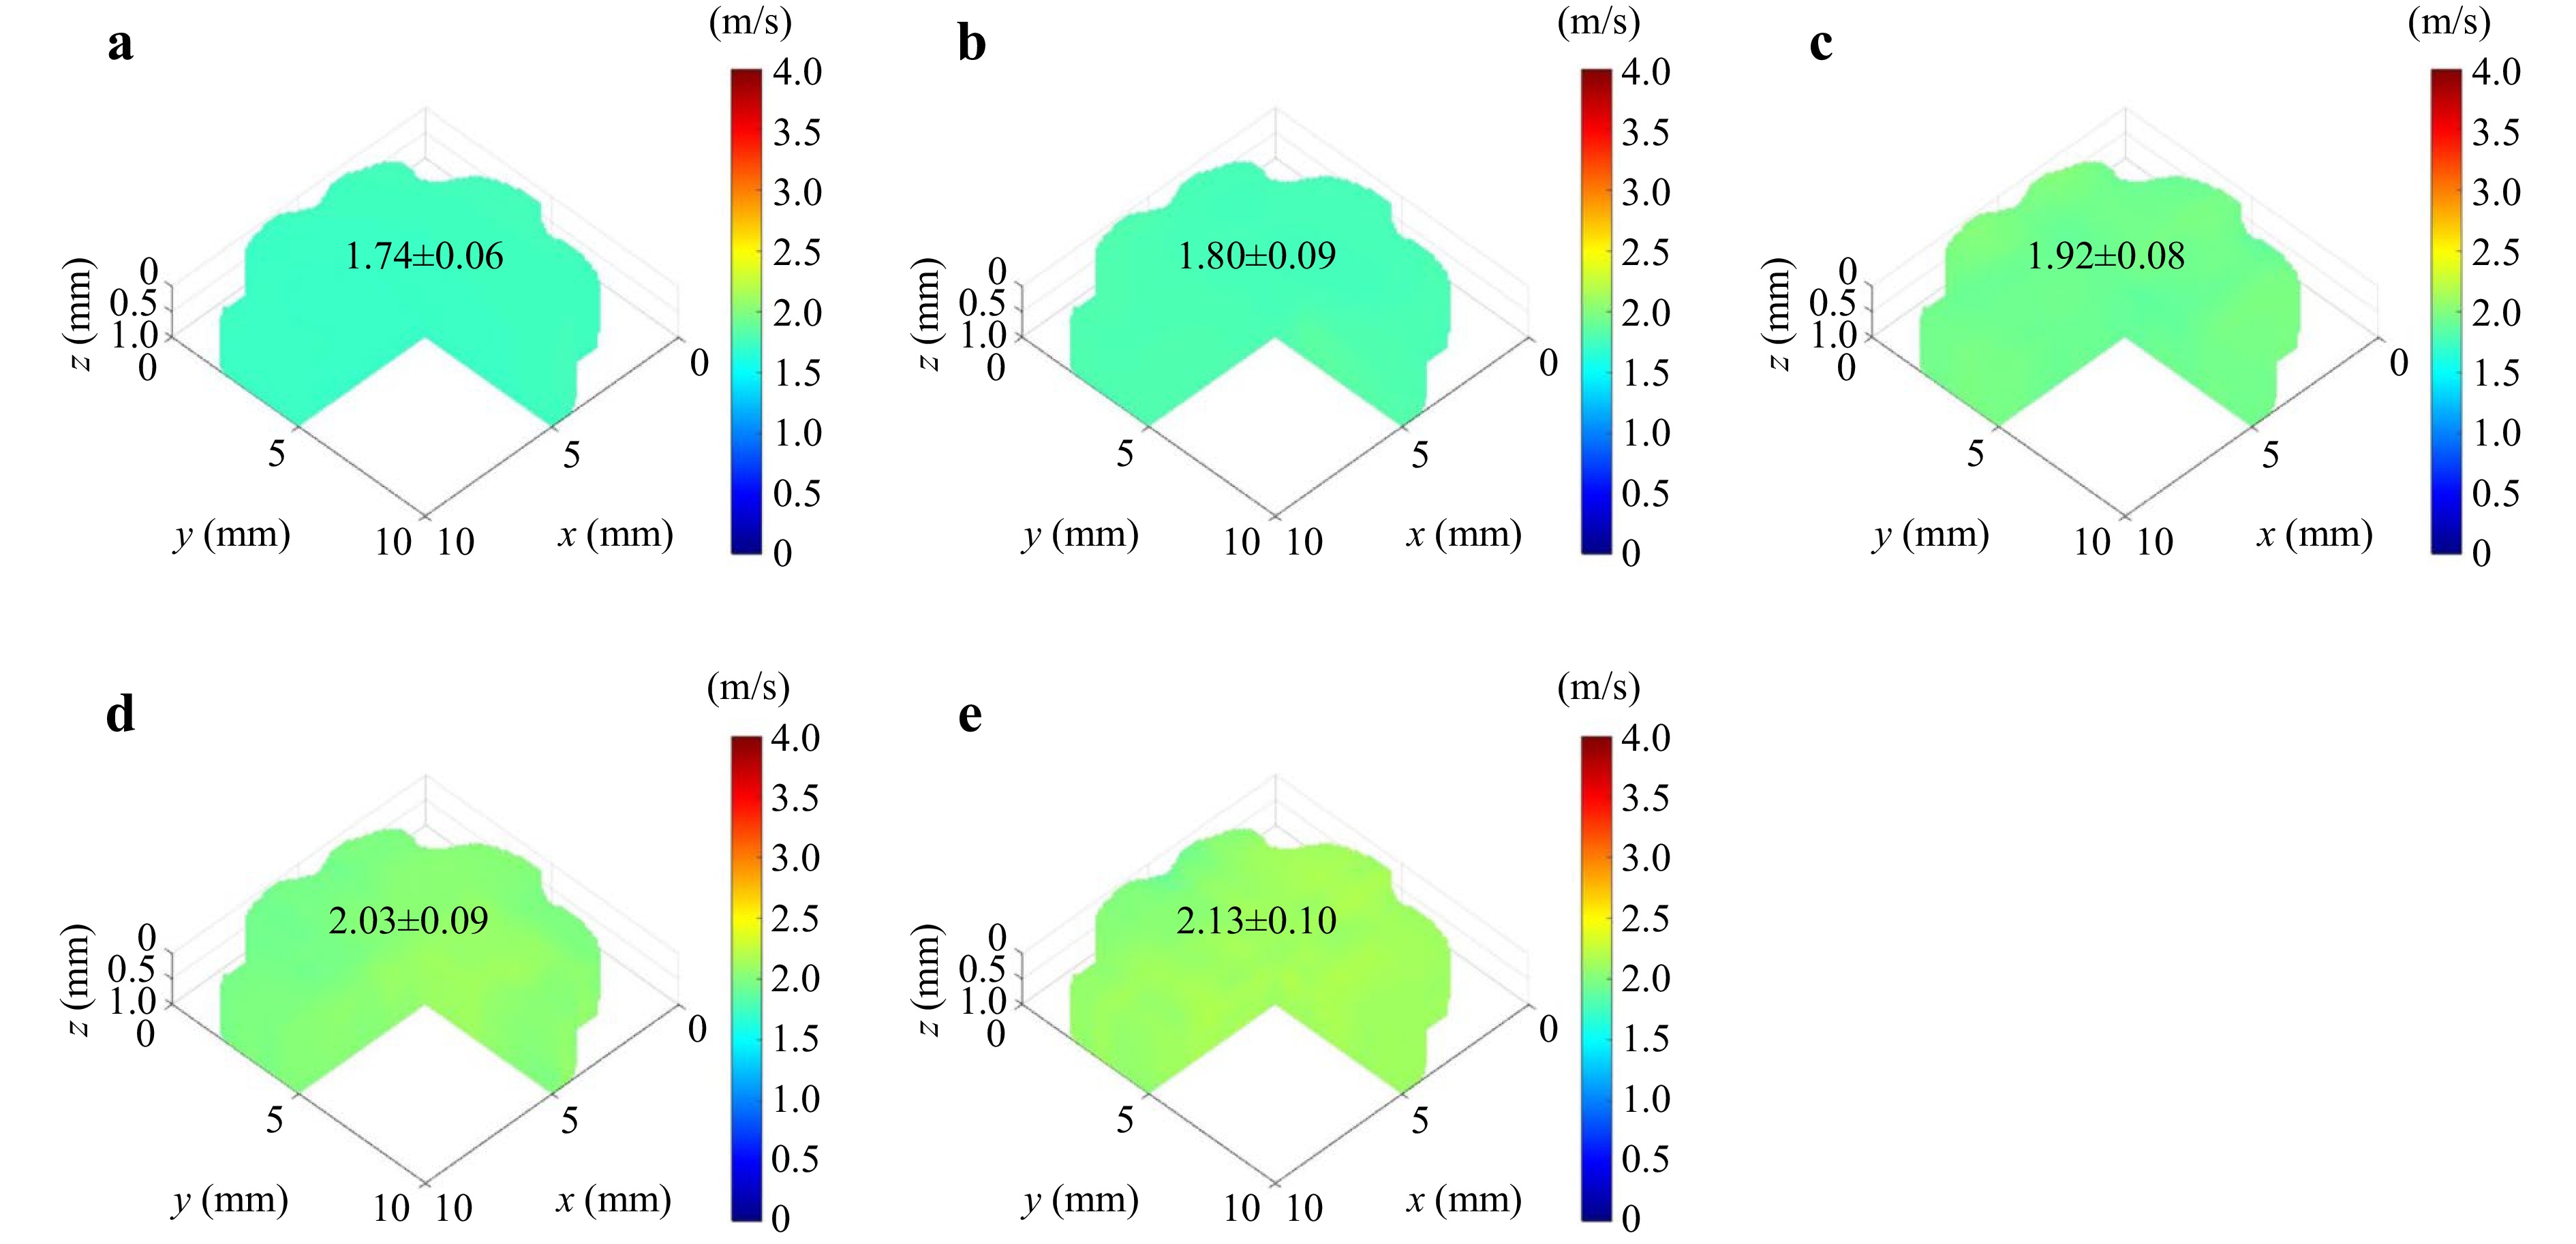
Fig. 5 3D SWS maps estimated using MFR-OCE for a 5% gelatin phantom across different excitation frequencies: a 500 Hz, b 1 kHz, c 1.5 kHz, d 2 kHz, and e 2.5 kHz.
The plot in Fig. 6 displays the mean SWS as a function of frequency (black data points), along with a power-law fitting (black trendline). The estimated SWS values among the four gelatin phantoms are highly consistent across all excitation frequencies. The maximum standard deviation observed is approximately 0.10 m/s at 2.5 kHz, which can be attributed to minor variations in phantom preparation, the intrinsic precision limits of the SWS estimation algorithm, and noise in the measurements. The differences in SWS observed across frequencies within phantoms arise from the dispersion behavior of the viscoelastic material, reflecting the frequency-dependent shear response of phantoms. This frequency dependence is assessed to originate from the addition of 3% concentration of intralipid powder used as optical scatterers, which slightly increased viscous damping and contributed to the observed dispersion. Although the intralipid was introduced solely to enhance optical scattering and not to alter the mechanical properties, we observed a small but measurable increase in viscosity, suggesting that the lipid inclusions introduced minor microstructural heterogeneity within the gelatin matrix. The power-law fit of SWS has an exponent of 0.13, indicating that the phantom exhibits non-purely elastic behavior with a viscosity component. Additionally, the mean SWS estimated from the reverberant shear wave field in the phantom at three single-frequency experiments is presented in Fig. 6 (orange data points). For the single-frequency reverberant OCE measurements, three excitation frequencies (i.e., 1 kHz, 1.5 kHz, and 2 kHz) were chosen as representative points; performing all five single-frequency acquisitions in sequential order would substantially increase the total measurement time and lead to dehydration-related changes in the phantom's mechanical properties. The selected frequencies thus provided an optimal balance between accuracy and experimental stability. The power-law exponent for these single-frequency excitations was found to be 0.12. The close agreement between the mean SWS values from the multi-frequency and single-frequency experiments across all three frequencies, with a less than 3% difference, validates the accuracy of shear wave field extraction in the MFR-OCE experiment. The standard deviation in the multi-frequency measurements appears slightly larger than that of the single-frequency data; however, this variability remains within a very low range (maximum ≈ 0.10 m/s) and does not affect the accuracy of the mean SWS estimates. This small increase is expected because multi-frequency excitation involves the superposition of several frequency components, introducing a modest statistical variation in the reverberant field while still providing accurate and repeatable results across all frequencies.
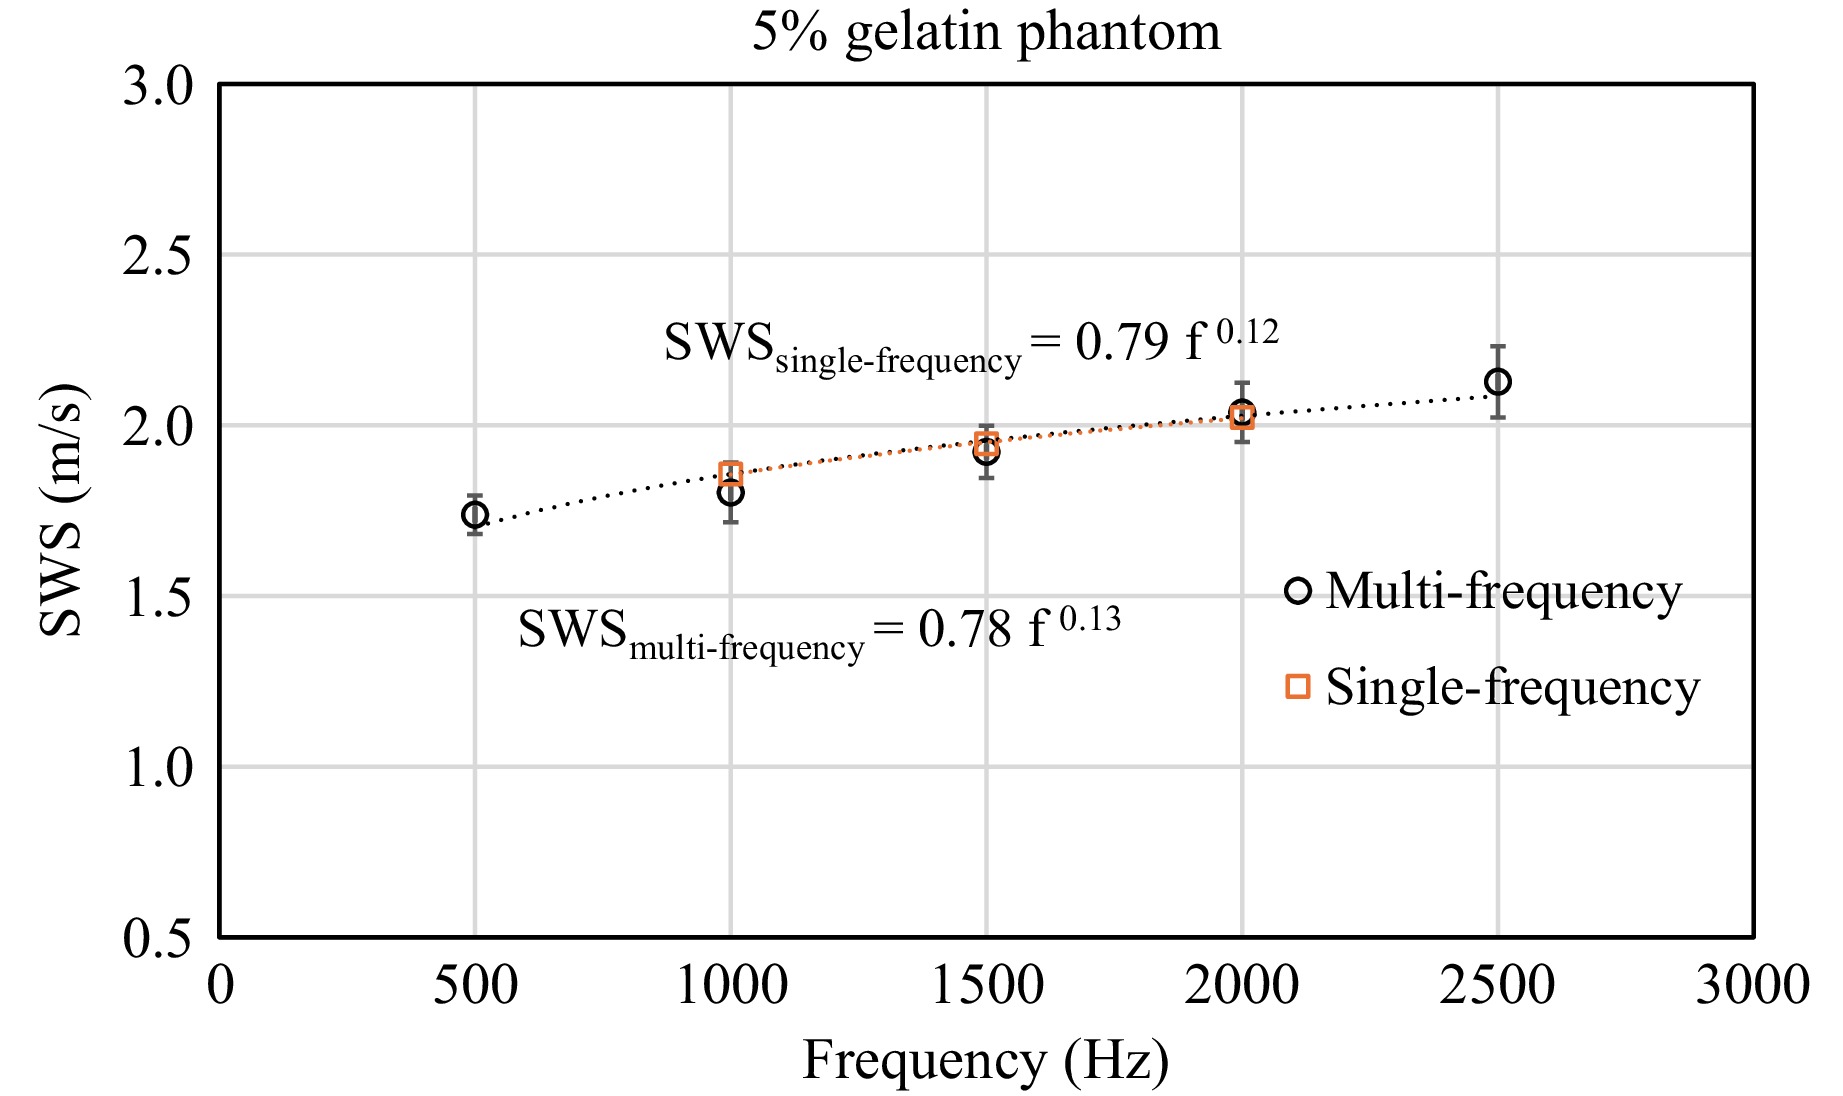
Fig. 6 Mean SWS estimated using MFR-OCE and single-frequency reverberant shear wave OCE for a 5% gelatin phantom across different excitation frequencies along with a power-law fits (black and orange trendlines).
These results are also consistent with previously reported measurements using single-frequency reverberant OCE. Zvietcovich et al. (2019)34 measured a shear wave speed of 2.03 ± 0.14 m/s in a 5% gelatin phantom at 2 kHz, which closely matches our MFR-OCE estimate of 2.04 ± 0.09 m/s. This strong agreement with the literature further confirms the quantitative accuracy of the proposed multi-frequency approach.
Table 1 summarizes the mean SWS values obtained from the 5% gelatin phantoms using both MFR-OCE and single-frequency OCE (SF-OCE). The close numerical agreement between the two methods, with a maximum deviation below 3.2%, quantitatively confirms that the proposed multi-frequency approach provides accurate and consistent SWS estimates while substantially reducing total acquisition time by 80%.
Frequency
(kHz)SWS by MFR-OCE
(m/s)SWS by SF-OCE
(m/s)Difference
(%)0.5 1.74 ± 0.06 – – 1 1.80 ± 0.09 1.86 ± 0.06 3.2 1.5 1.92 ± 0.08 1.95 ± 0.04 1.5 2 2.03 ± 0.09 2.02 ± 0.05 0.5 2.5 2.13 ± 0.10 – – Table 1. Comparison of mean SWS estimated by MFR-OCE and single-frequency OCE in 5% gelatin phantom.
-
Fig. 7 shows the estimated 3D SWS maps on a phantom with a lesion at five excitation frequencies (i.e., 500 Hz, 1 kHz, 15 kHz, 2 kHz, and 2.5 kHz). As the frequency increases, the lesion becomes progressively more distinguishable in the SWS maps. This improvement in lesion visibility with an increase in frequency is attributed to the decrease in shear wavelength, which enhances the spatial resolution of elastographic measurements. Table 2 summarizes the mean and standard deviation of the estimated SWS values within the lesion and background regions across the tested frequencies
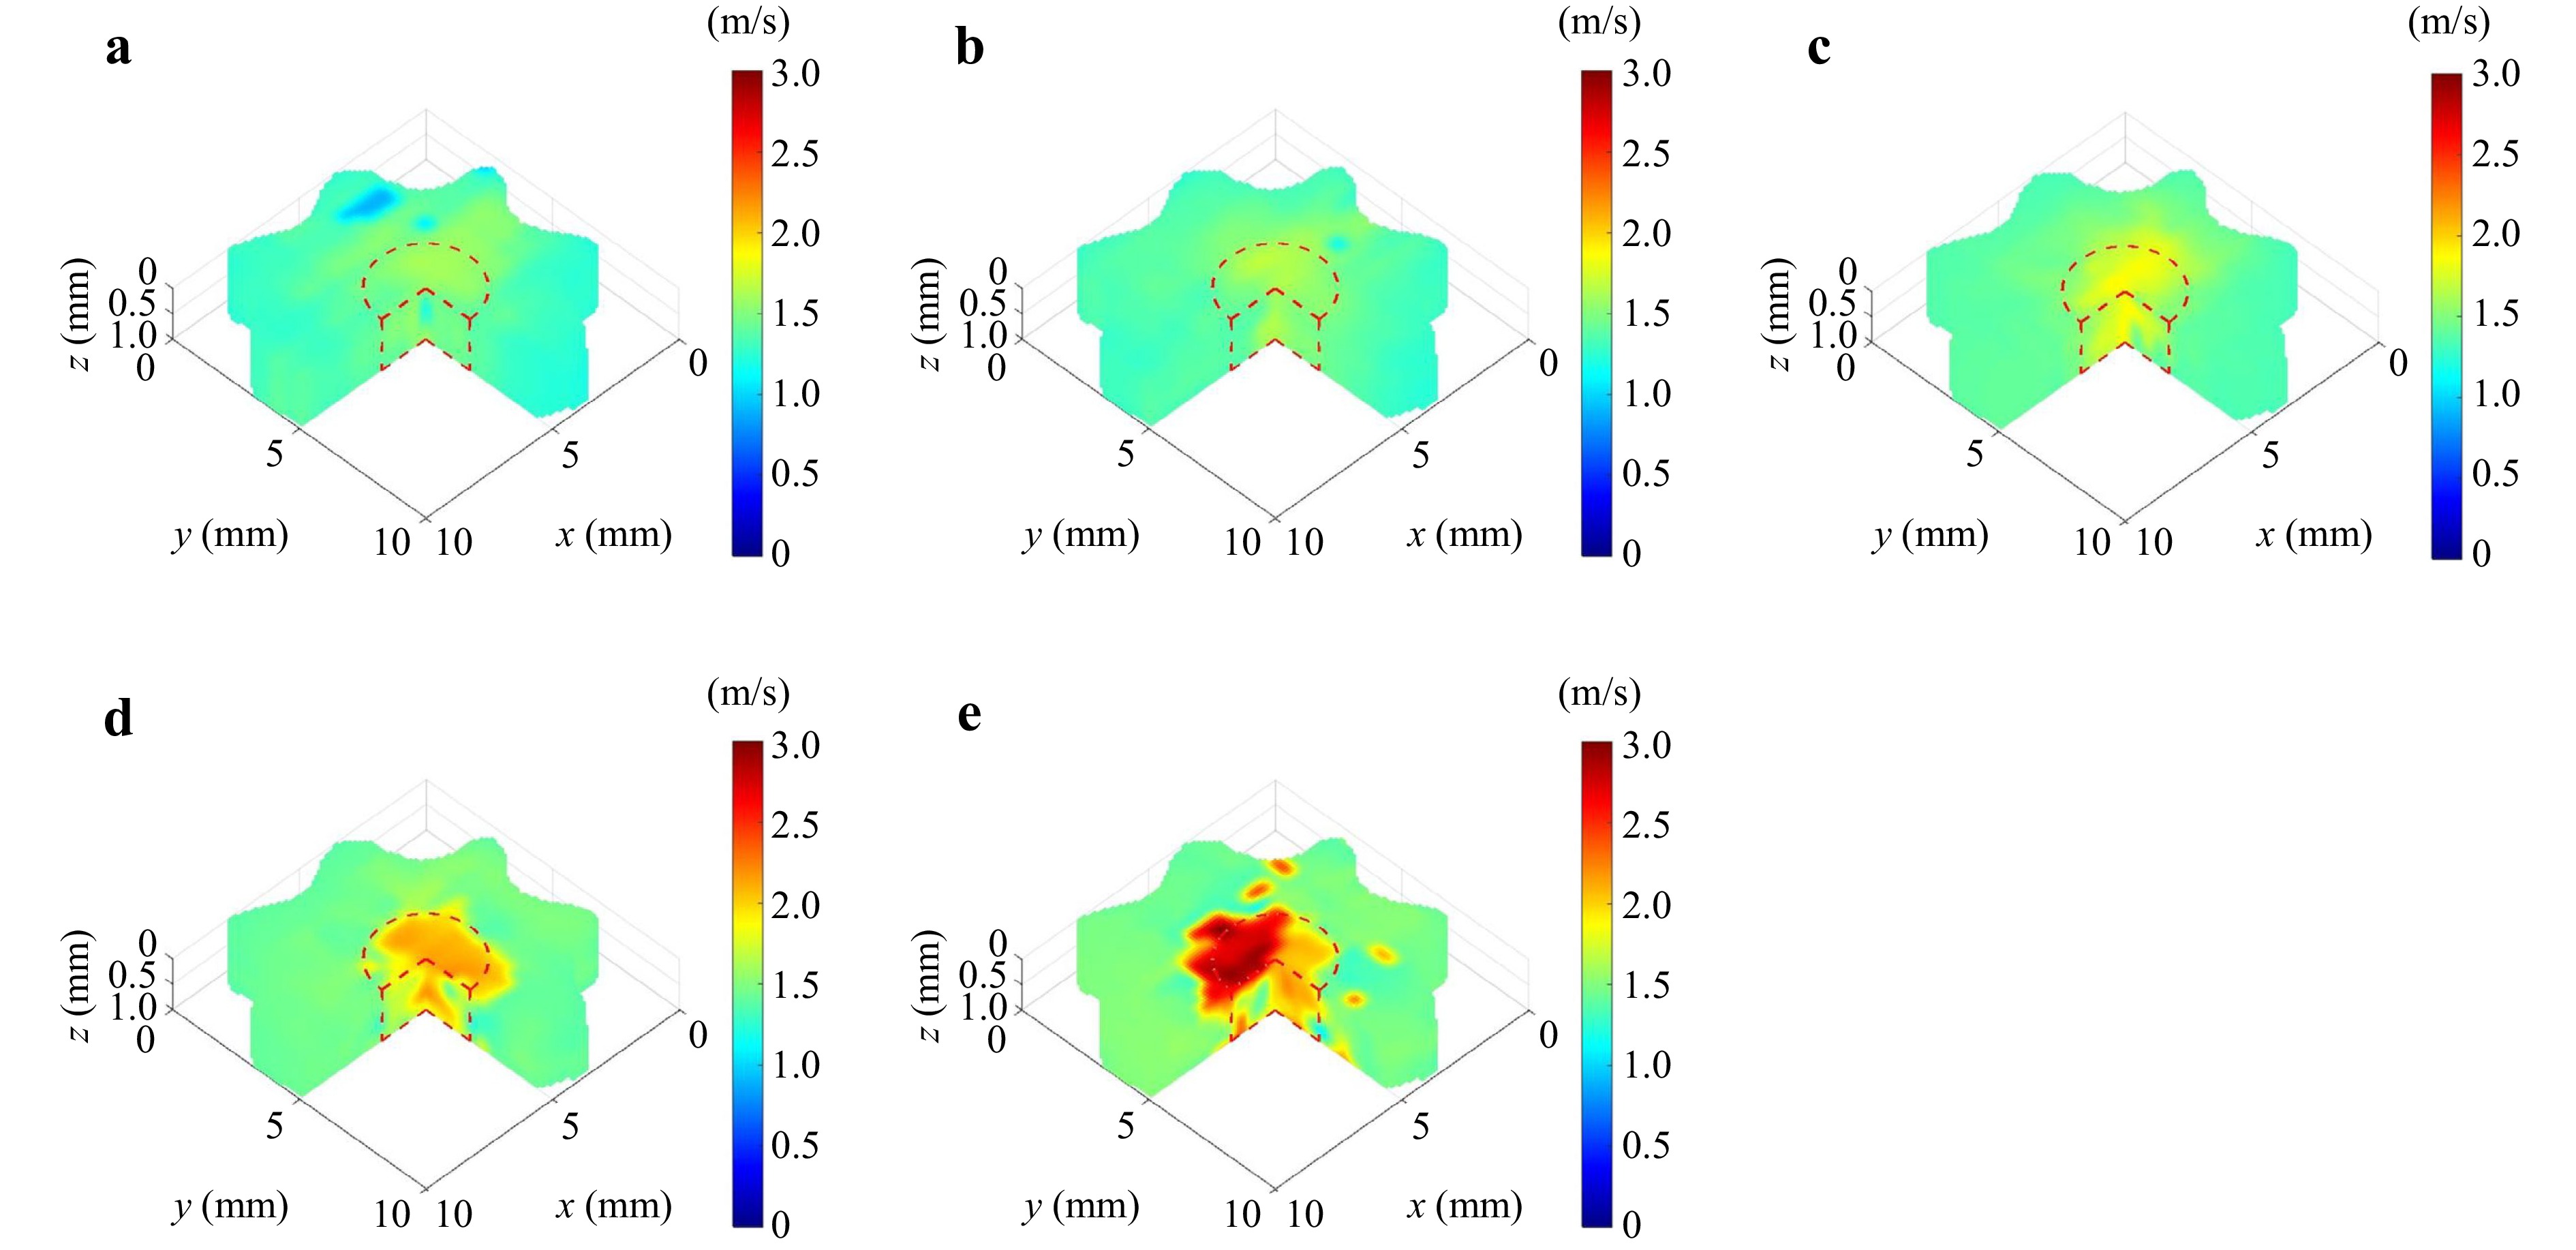
Fig. 7 3D SWS maps estimated using MFR-OCE for a 3% gelatin phantom with a lesion (highlighted with a dashed line) at different excitation frequencies: a 500 Hz, b 1 kHz, c 1.5 kHz, d 2 kHz, and e 2.5 kHz.
Frequency (kHz) SWS in lesion (m/s) SWS in background (m/s) 0.5 1.60 ± 0.11 1.31 ± 0.12 1 1.65 ± 0.12 1.34 ± 0.09 1.5 1.73 ± 0.16 1.40 ± 0.14 2 1.92 ± 0.19 1.43 ± 0.17 2.5 2.32 ± 0.25 1.48 ± 0.21 Table 2. Mean SWS within lesion and background regions estimated by MFR-OCE for a 3% gelatin phantom with a 7% lesion.
-
Fig. 8a presents the 3D B-mode scan of one of the ex vivo porcine cornea samples with a pie cut to reveal its interior. By applying bandpass frequency filters with a bandwidth of 10 Hz, the wave fields for each excitation frequency were estimated. Figs. 8b through 8f show the 3D reverberant shear wave fields at frequencies of 500 Hz, 1 kHz, 1.5 kHz, 2 kHz, and 2.5 kHz, respectively. Generally, the wavelength decreases as the frequency increases. The particle velocity ranges shown in all figures are expressed in arbitrary units (Arb.) and are not directly comparable across samples. The measured amplitude depends on both the excitation strength and the sample's viscoelastic and optical attenuation properties, with softer or less attenuating materials (e.g., gelatin phantoms) exhibiting higher apparent amplitudes than stiffer or more attenuating tissues such as cornea.
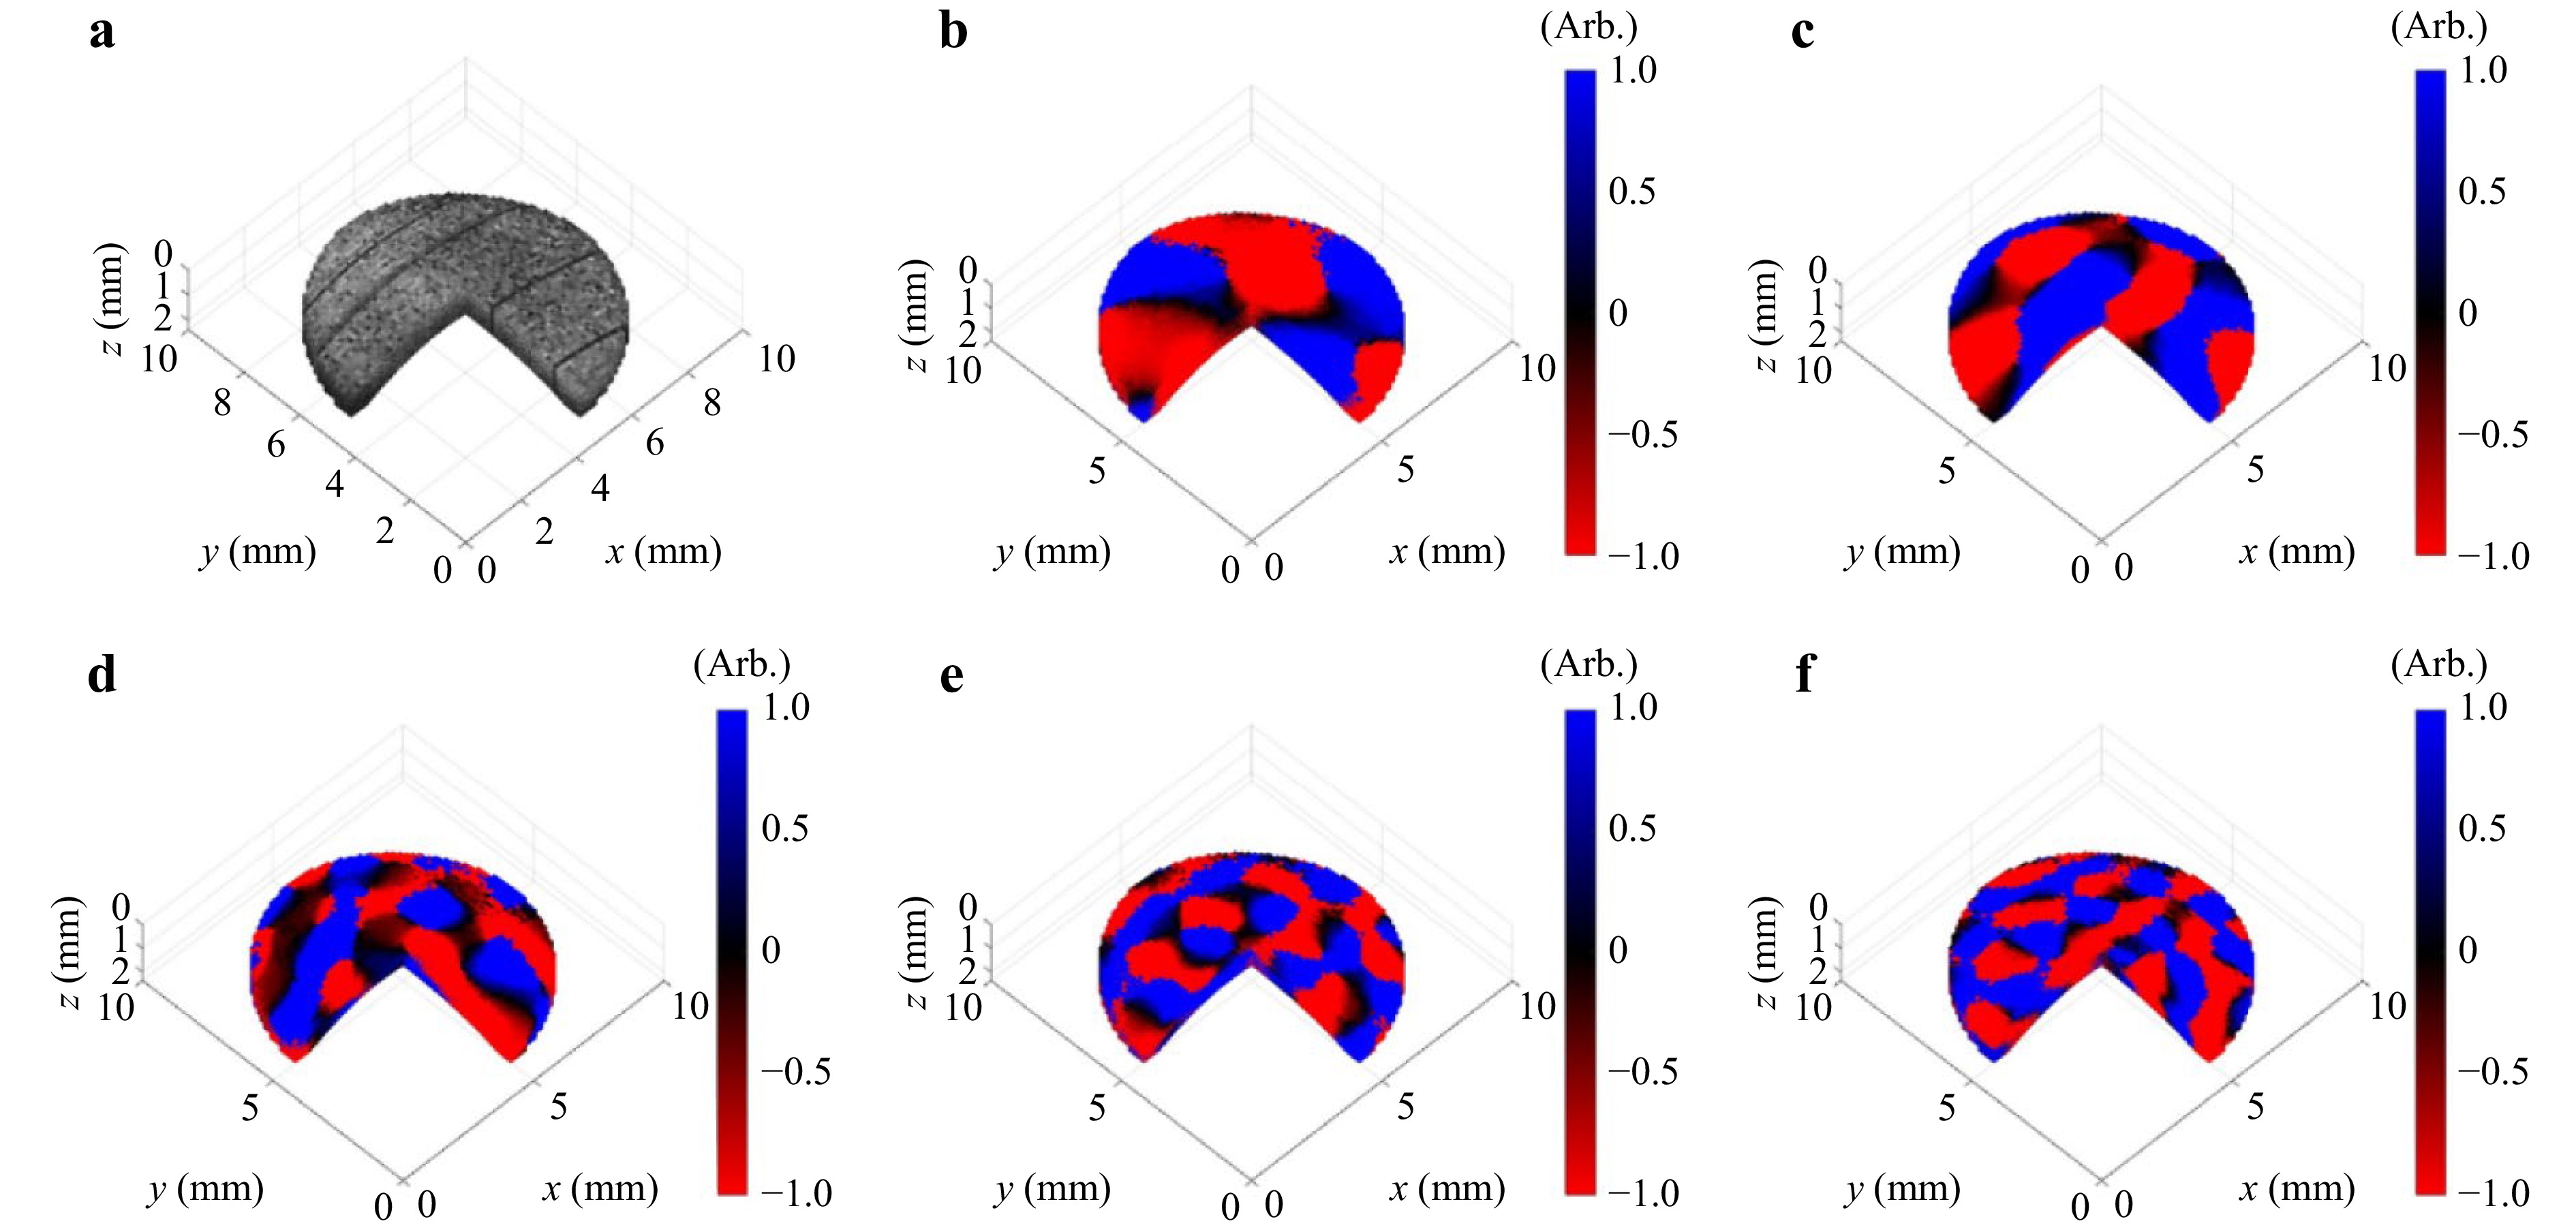
Fig. 8 3D maps with a pie-cut view to visualize the internal structure for an ex vivo porcine cornea sample a B-mode scan and extracted reverberant shear wave field at: b 500 Hz, c 1 kHz, d 1.5 kHz, e 2 kHz, and f 2.5 kHz.
Fig. 9 presents 3D SWS maps estimated using MFR-OCE on an ex vivo porcine cornea sample across different excitation frequencies ranging from 500 Hz to 2.5 kHz. The results demonstrate a clear frequency-dependent increase in SWS, as indicated by the progressive color shift from blue (low SWS) to yellow/red (high SWS) at higher frequencies. This trend suggests that the cornea exhibits dispersion behavior, where shear wave speed increases with frequency, reflecting its biomechanical properties. The SWS distribution appears relatively uniform in the central region of the cornea, with slightly lower values near the periphery, potentially due to variations in tissue structure or boundary effects. At higher frequencies (2 kHz and 2.5 kHz), the increase in SWS becomes more pronounced, indicating a stiffening response with frequency.
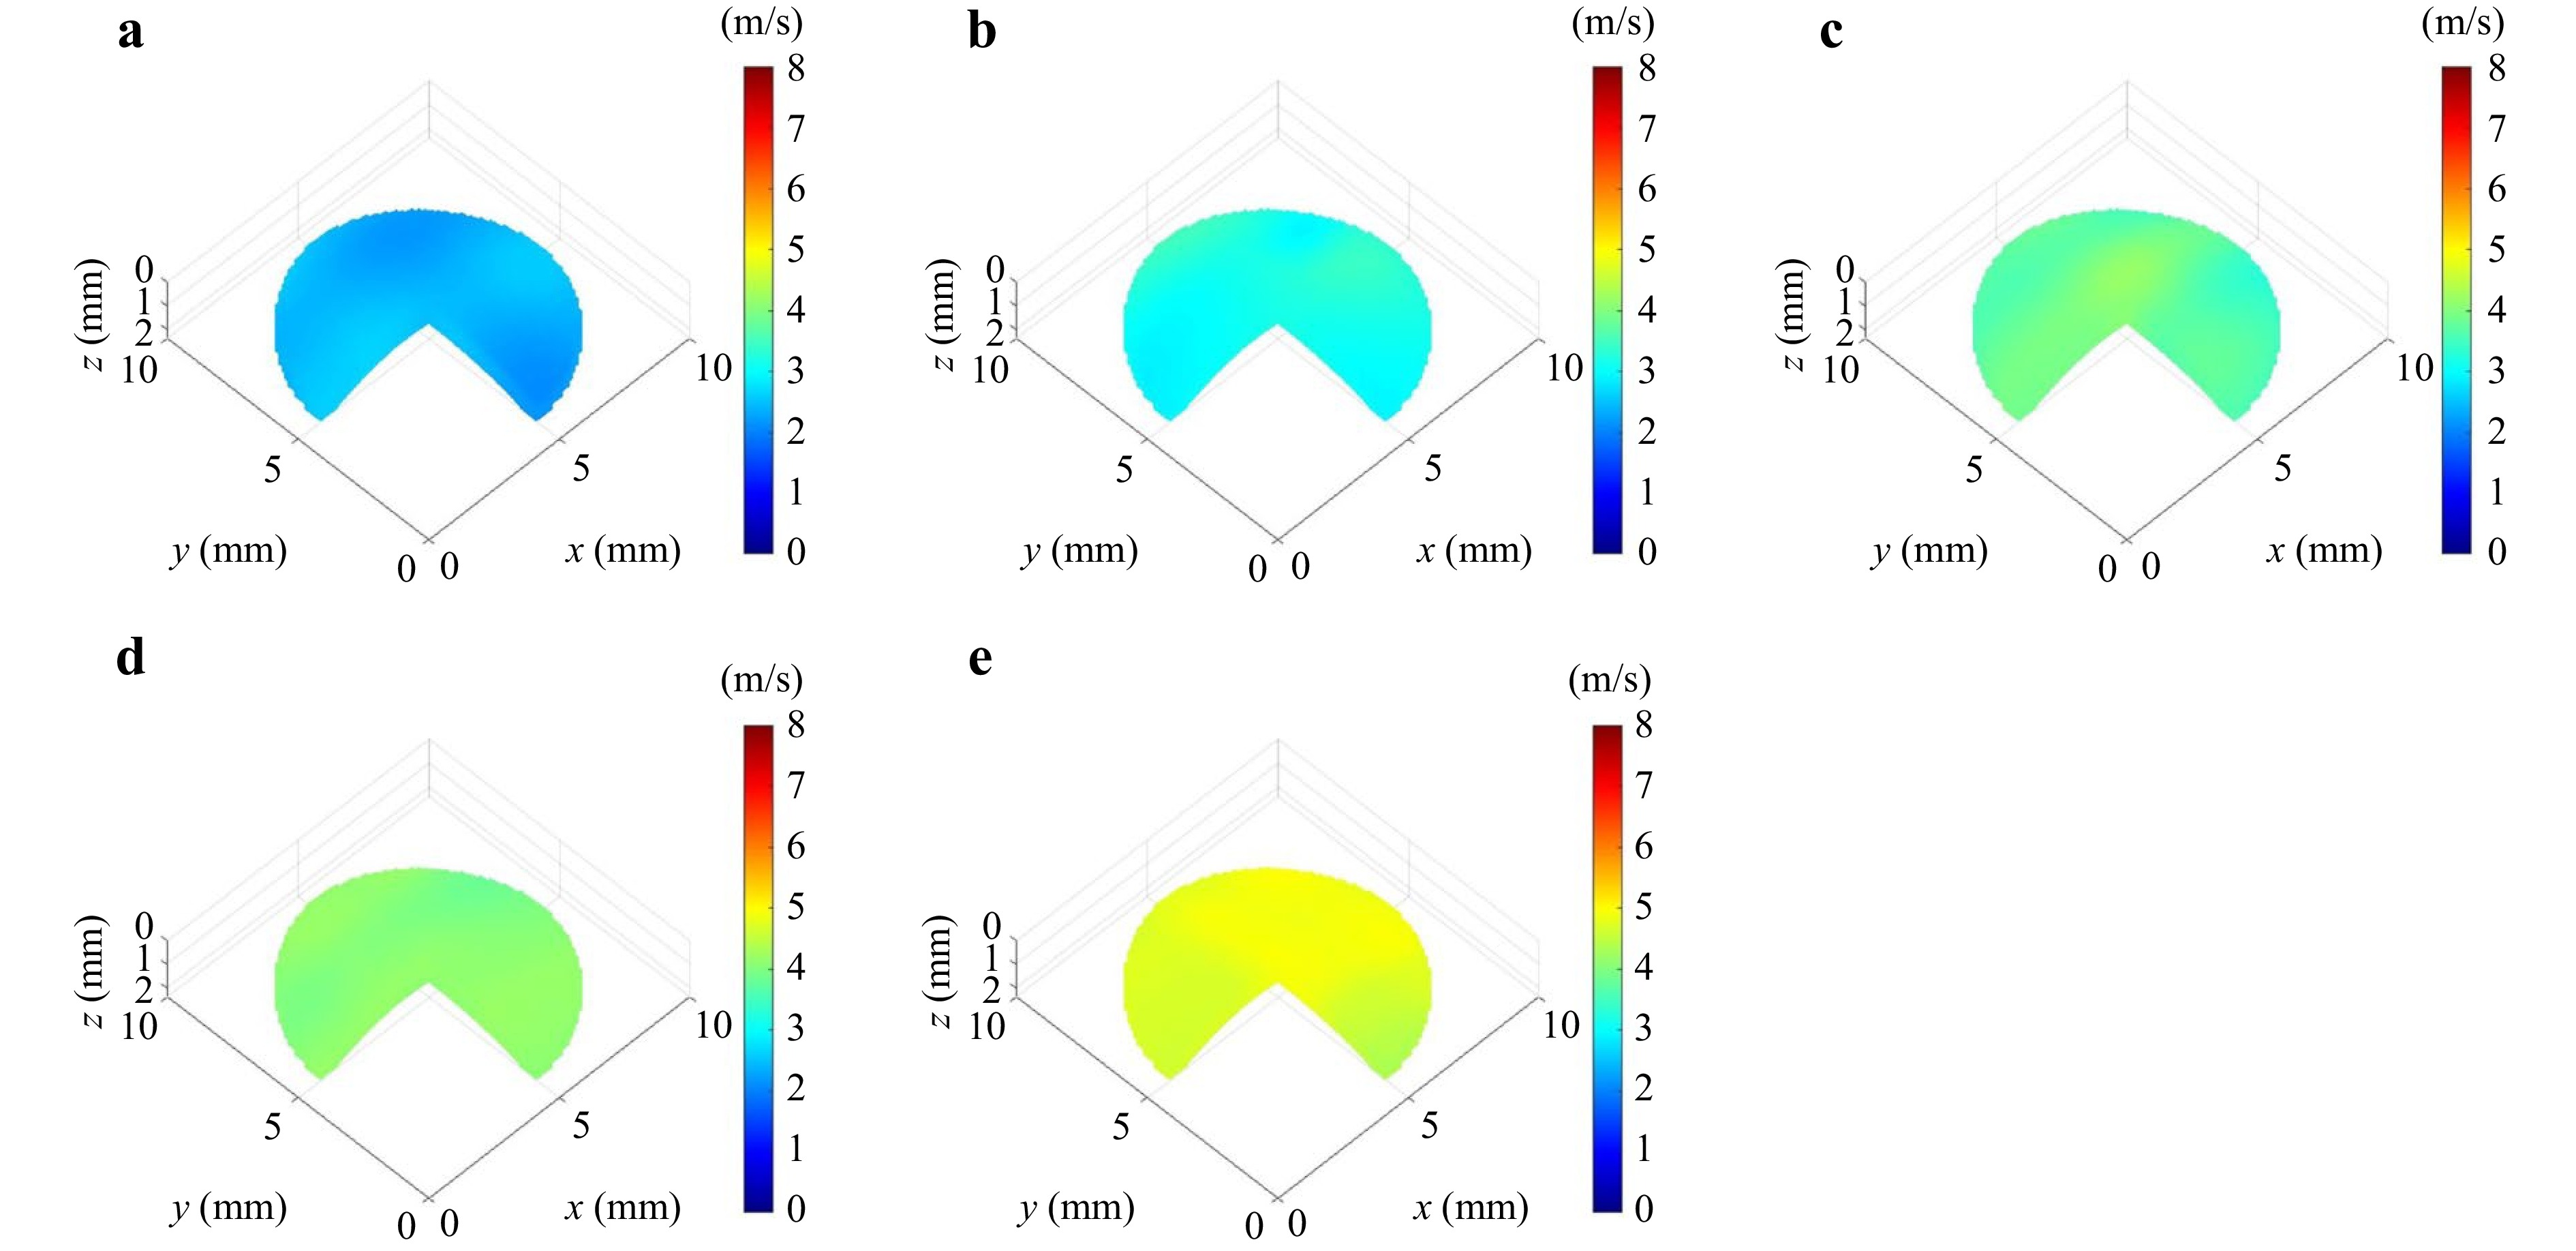
Fig. 9 3D SWS maps estimated using MFR-OCE for an ex vivo porcine cornea sample across different excitation frequencies: a 500 Hz, b 1 kHz, c 1.5 kHz, d 2 kHz, and e 2.5 kHz.
The mean SWS of the porcine cornea, estimated using MFR-OCE, across the excitation frequencies is illustrated in Fig. 10 (data points). A power-law equation with an exponent of 0.33 is fitted with these values (black trendline). The excellent fit demonstrates that the dispersion behavior of the cornea can be accurately described by the power-law model. Measurements were performed on three independent ex vivo porcine corneas (n = 3). The error bars in Fig. 10 represent the standard deviation of the mean SWS across these samples, demonstrating high consistency in frequency-dependent trends. The power-law exponent of 0.33 indicates that the cornea exhibits moderate viscoelastic behavior, meaning that higher-frequency shear waves propagate faster due to the tissue's viscoelastic properties. The error bars represent the variability in the measurements, but the data points align well with the fitted power-law model.
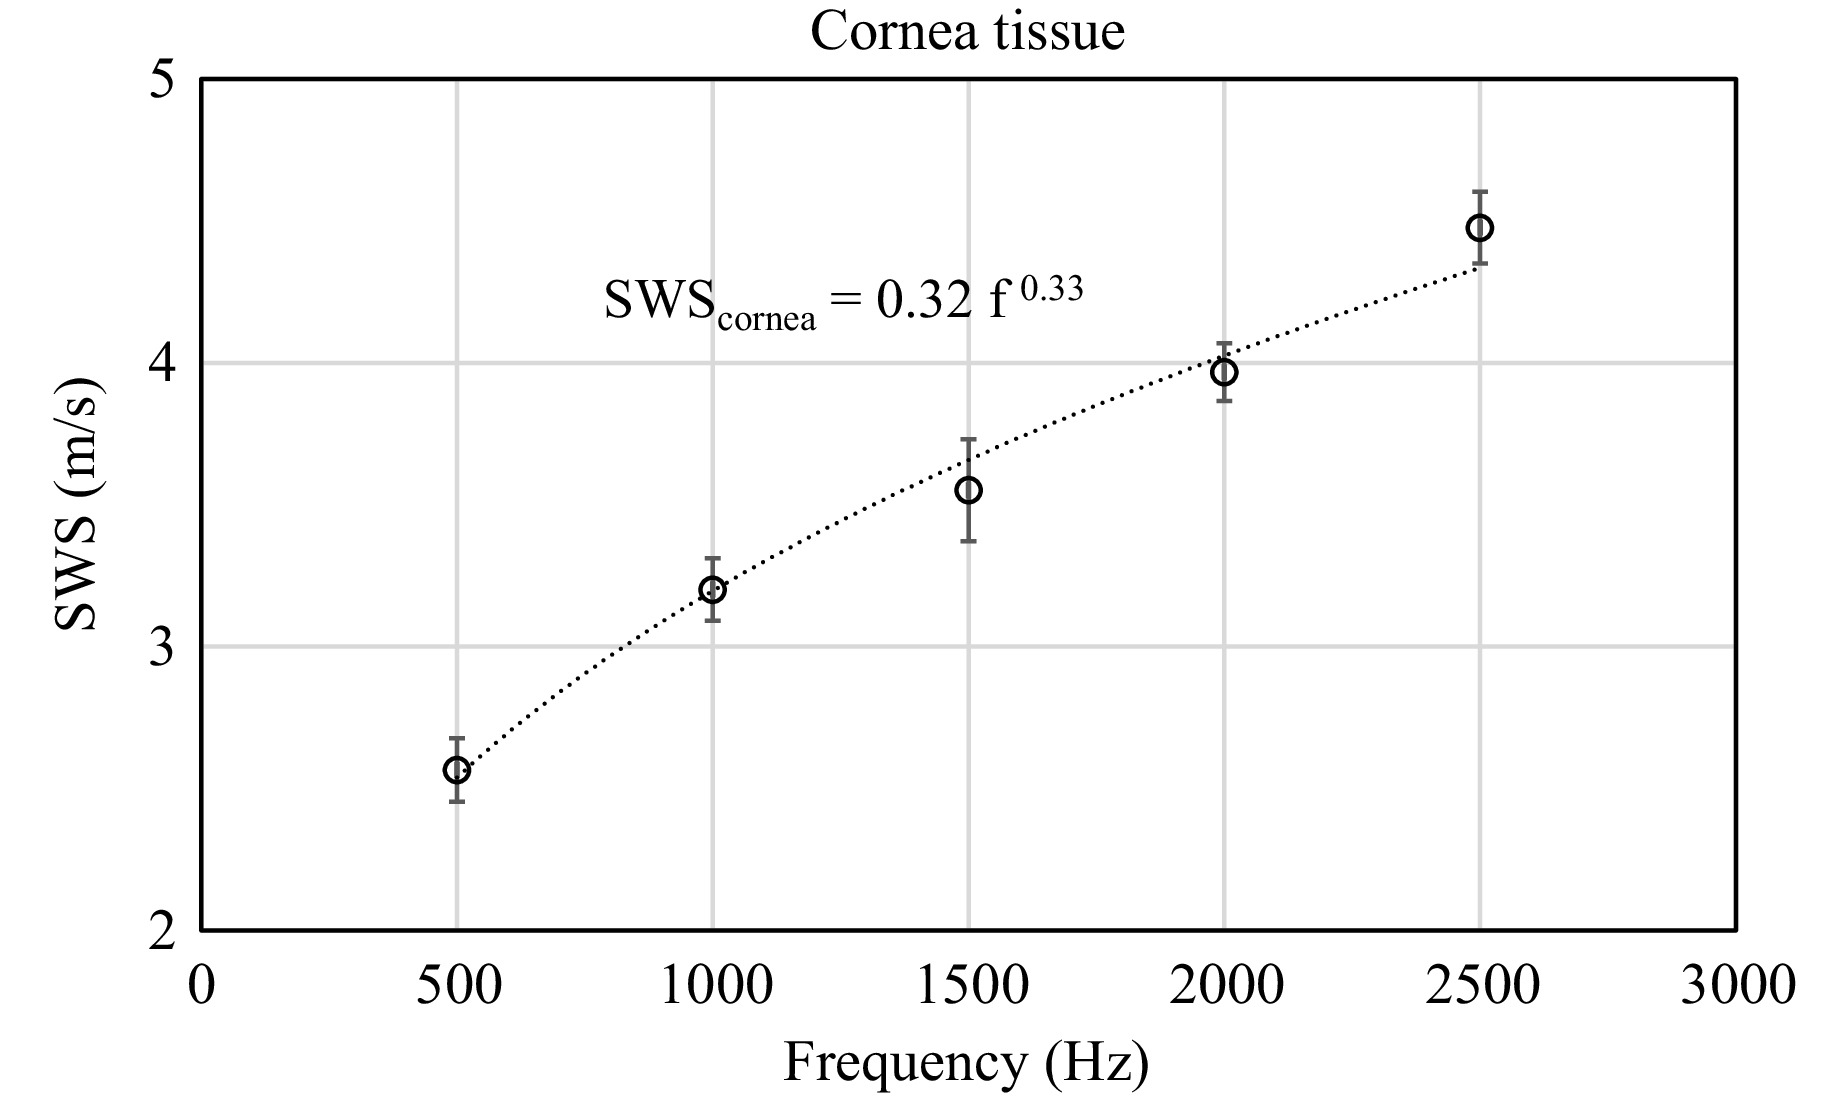
Fig. 10 The mean SWS estimated using MFR-OCE for the porcine cornea samples across different excitation frequencies along with a power-law fit (black trendline).
-
Fig. 11 displays the mean SWS as a function of frequency (data points), along with a power-law fitting (black trendline) for ex vivo bovine liver. There is an excellent fit of the power-law with the estimated SWS across different frequencies, which shows the viscoelastic behavior of liver tissue can be perfectly defined under the power-law equation even in the high-frequency range. The power-law fit of SWS for the bovine liver has an exponent of 0.51, indicating a high viscosity component. The shear wave fields and 3D elastography maps of one of the ex vivo bovine liver samples across different frequencies are presented in Fig. S2 and Fig. S3 respectively.
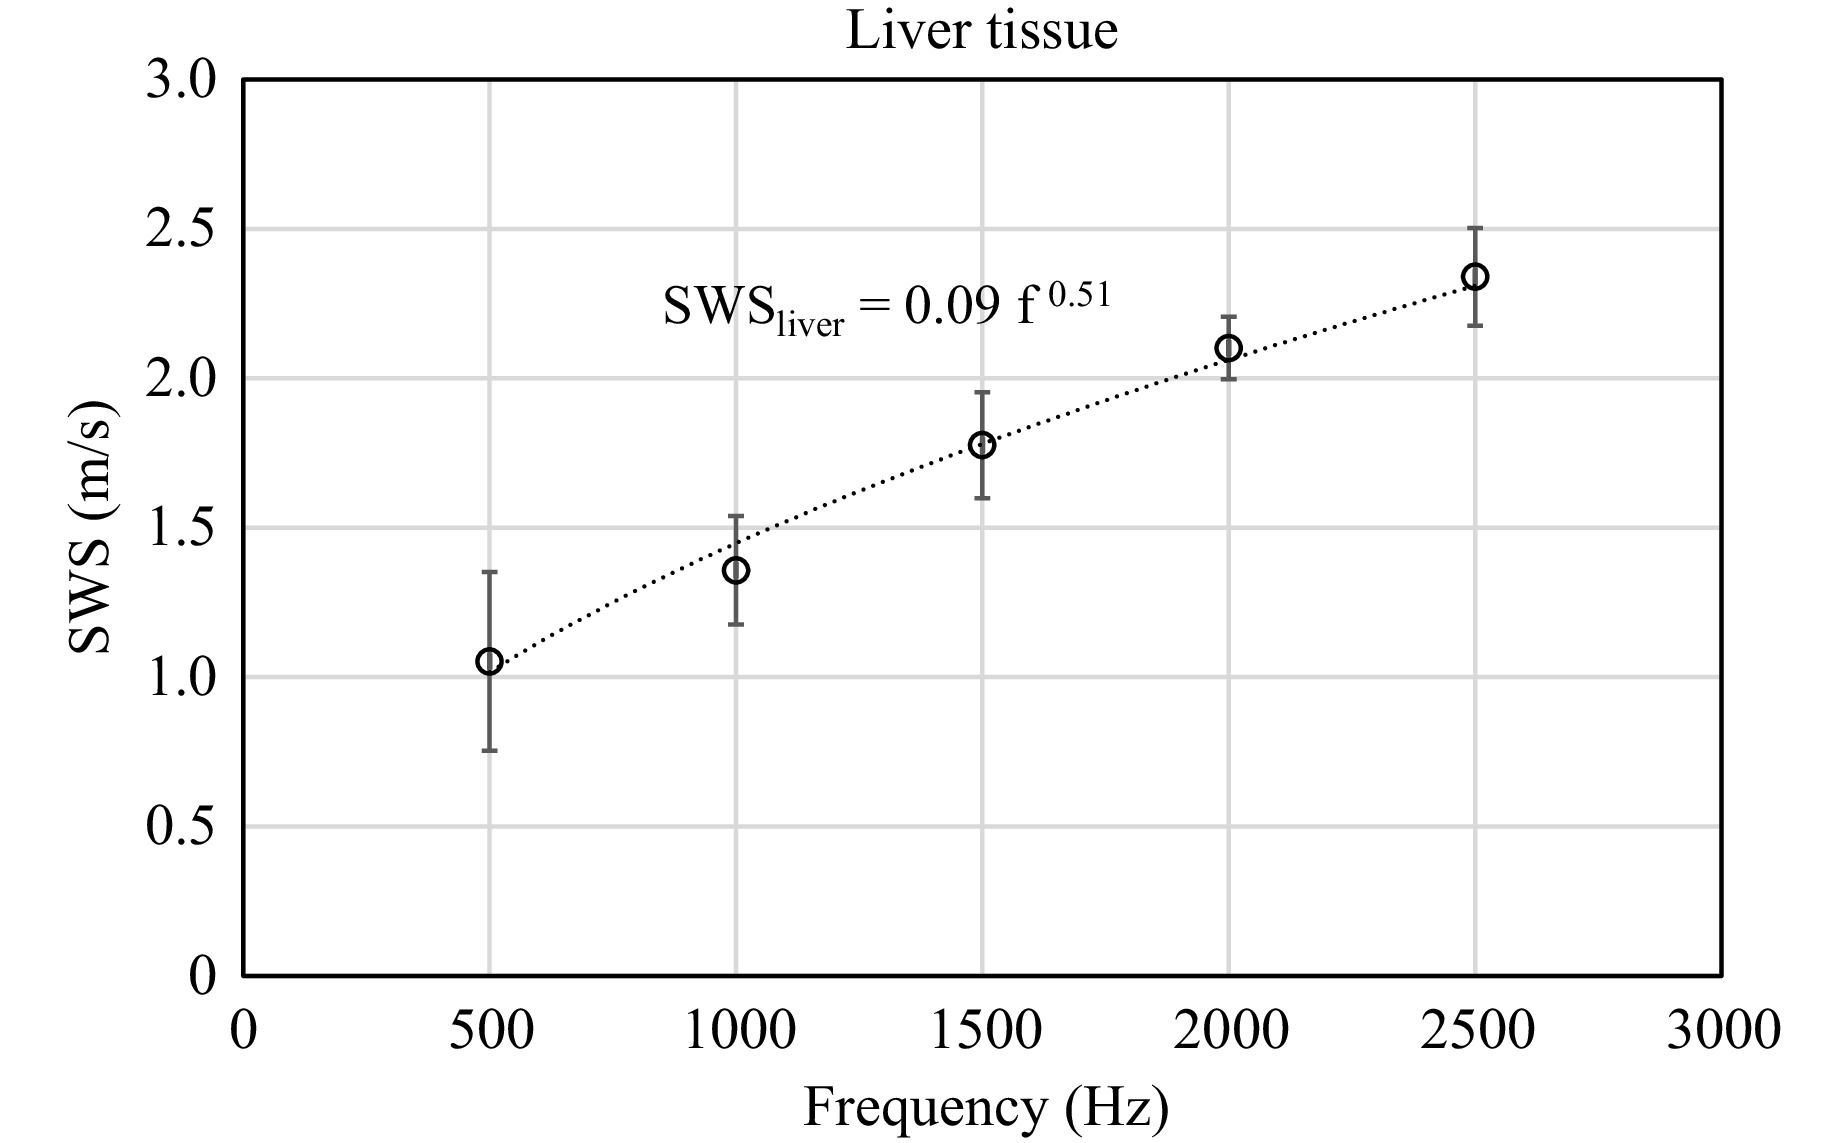
Fig. 11 The mean SWS estimated using multi-frequency OCE for the ex vivo bovine liver across different excitation frequencies, along with a power-law fit (black trendline).
-
The particle velocity within a fully reverberant shear wave field is mathematically represented as46
$$ \boldsymbol{V}\left(\boldsymbol{\varepsilon },t\right)=\displaystyle\sum\limits_{q,l}{\hat{\boldsymbol{n}}}_{ql}{v}_{ql}{e}^{i\left(k{\hat{\boldsymbol{n}}}_{q}.\boldsymbol{\varepsilon }-{\omega }_{0}t\right)}, $$ (1) where $ {\hat{\boldsymbol{n}}}_{q} $ represents the direction of wave propagation, with the index $ q $ denoting a specific instance of the random unit vector $ {\hat{\boldsymbol{n}}}_{q} $. The vector $ {\hat{\boldsymbol{n}}}_{ql} $ indicates the direction of particle velocity for that instance of $ q $, and the index $ l $ identifies a particular instance of the random unit vector $ {\hat{\boldsymbol{n}}}_{ql} $. $ {v}_{ql} $ is an independent, identically distributed random variable representing the magnitude of particle velocity for that instance of $ q $. In the context of the shear wave propagation, $ {\hat{\boldsymbol n}}_{q} $ and $ {\hat{\boldsymbol n}}_{ql} $ are perpendicular, resulting in $ {\hat{\boldsymbol n}}_{q}\cdot {\hat{\boldsymbol n}}_{ql}=0 $. In this expression, $ k $ represents the wavenumber, $ {\omega }_{0} $ denotes angular frequency, $ \boldsymbol{\varepsilon } $ is the position vector, and $ t $ is time.
In OCE, the particle velocity is typically measured along the laser axis, which is perpendicular to the sample surface. Assuming the sensor axis aligns with the z-axis, the recorded particle velocity can be expressed as $ {V}_{z}\left(\boldsymbol{\varepsilon },t\right)=\boldsymbol{V}\left(\boldsymbol{\varepsilon },t\right)\cdot {\hat{\boldsymbol e}}_{z} $, where $ {\hat{\boldsymbol e}}_{z} $ is a unit vector in the z-direction. For the reverberant field $ {V}_{z}\left(\boldsymbol{\varepsilon },{t}_{0}\right) $, closed-form complex analytical solutions can be derived using spatial autocorrelation in the spherical coordinate system as detailed by Aleman-Castañeda et al.47 as
$$ \begin{split} & {B}_{{{V}_{z}}{{V}_{z}}}\left(\Delta \boldsymbol{\varepsilon }\right)=3{\overline{{V}_{z}}}^{2}\left\{\dfrac{{\sin }^{2} {\theta }_{s}}{2}\left[{j}_{0}\left(k\Delta \varepsilon \right)-\dfrac{{j}_{1}\left(k\Delta \varepsilon \right)}{k\Delta \varepsilon }\right]+\right.\\ &\qquad\qquad \left.\text{c}{\text{os}}^{2} {\theta }_{s}\dfrac{{j}_{1}\left(k\Delta \varepsilon \right)}{k\Delta \varepsilon }\right\} \end{split} $$ (2) where $ {B}_{{{V}_{z}}{{V}_{z}}} $ represents the autocorrelation function of $ {V}_{z} $, while $ {\overline{{V}_{z}}}^{2} $ denotes the expected value of the squared particle velocity magnitude $ v_{ql}^{2} $ averaged over both $ q $ and $ l $ instances. The functions $ {j}_{0} $ and $ {j}_{1} $ are spherical Bessel functions of the first kind of zero and first order, respectively, and $ {\theta }_{s} $ denotes the angle between $ \Delta \varepsilon $ and the z-axis. By performing an angular integration of the autocorrelation function over $ {\theta }_{s} $ from 0 to 2π within two-dimensional planes, the angular integral autocorrelation ($ {B}_{\rm{AIA}} $) expressions for the xy, xz, and yz planes are derived as45
$$ {{{B}_{\rm{AIA}}}}_{xy}\left(\Delta \rho \right)=\dfrac{3}{2}{\overline{{V}_{z}}}^{2}\left[{j}_{0}\left(k\Delta \rho \right)-\dfrac{{j}_{1}\left(k\Delta \rho \right)}{k\Delta \rho }\right] $$ (3.a) $$ {{{B}_{\rm{AIA}}}}_{xz}\left(\Delta \rho \right)={{{B}_{\rm{AI}}}}_{yz}\left(\Delta \rho \right)=\dfrac{3}{4}{\overline{{V}_{z}}}^{2}\left[{j}_{0}\left(k\Delta \rho \right)+\dfrac{{j}_{1}\left(k\Delta \rho \right)}{k\Delta \rho }\right] $$ (3.b) where $ \Delta \rho $ represents the one-dimensional lag in the angular integral autocorrelation argument. The local wavenumber $ k $ is extracted by analyzing the 2D autocorrelation function within a localized region of a reverberant field and fitting the resulting autocorrelation profiles to Equation 3.a or 3.b, depending on the plane configuration. Given the excitation frequency ω, the shear wave speed $ {C}_{s} $ is determined using the relation $ {C}_{s}=\omega /k $.
To implement the AIA approach in a multi-frequency reverberant shear wave field, it is essential to extract the particle velocity at each frequency using a bandpass filter. This method enables the separate estimation of SWS for each frequency. By incorporating multiple frequencies into the SWS estimation process, a more comprehensive analysis of shear wave behavior is achieved, leading to deeper insight into tissue dynamics.
The power-law model provides a mathematical framework for characterizing the frequency-dependent dispersion of SWS in viscoelastic bio-materials. Within the Kelvin-Voigt fractional derivative model, this relationship is expressed as
$$ {C}_{s}\left(f\right)={C}_{0}{f}^{\tfrac{a}{2}} $$ (4) where $ f $ is the frequency, $ {C}_{0} $ represents the reference wave speed at a unit reference frequency (e.g., 1 Hz), and $ a $ is the dispersion coefficient28 of the complex shear modulus that reflects the degree of viscoelasticity.
-
The k-Wave toolbox in MATLAB (version 2022b, The MathWorks, Inc., Natick, MA, USA)48 is employed to assess the effectiveness of multi-frequency reverberant shear wave fields for SWS estimation. The simulation involves a two-sided medium, consisting of a softer side with an SWS of 1 m/s and a stiffer side with an SWS of 2 m/s, as depicted in Fig. 12a. The model is constructed as a cube with dimensions of 12 mm × 12 mm × 2.4 mm. Both the softer and stiffer sides are modeled as homogeneous isotropic materials with a density of 1,000 kg/m3.
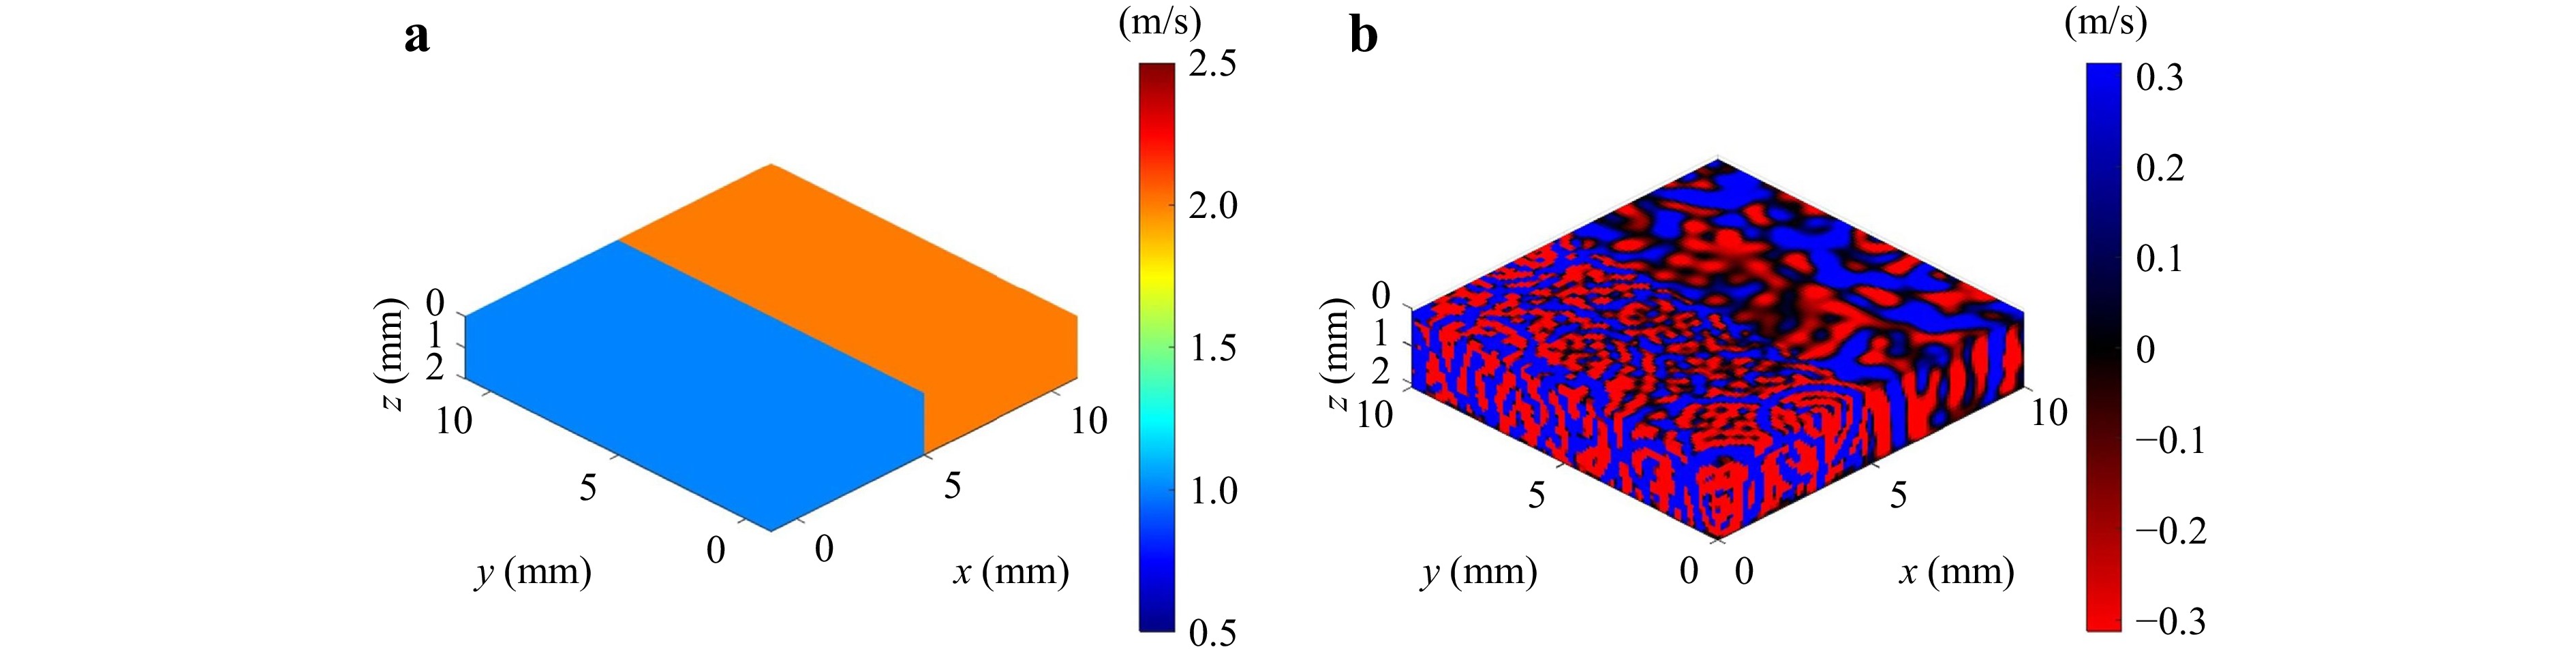
Fig. 12 K-Wave elastography simulation. a A two-sided medium with a softer side (SWS of 1m/s) and stiffer side (SWS of 2m/s). b 3D particle velocity field of the multi-frequency reverberant shear wave field including excitation frequencies of 500 Hz, 1 kHz, 1.5 kHz, 2 kHz, and 2.5 kHz.
In order to generate a multi-frequency reverberant shear wave field, 1,000 point-velocity excitation sources are utilized. The region of interest (ROI) is defined as a smaller cube with dimensions of 10 mm × 10 mm × 2 mm (Fig. 12). To create a source-free reverberant interior within the medium, the excitation sources are placed outside the ROI at random locations near the boundaries. An excitation signal comprising five frequencies (i.e., 500 Hz, 1 kHz, 1.5 kHz, 2 kHz, and 2.5 kHz) with randomly assigned amplitude and phase is applied to these point sources. The wave equations are solved using a time interval of 5 µs over 2,667 time steps, allowing 13.3 ms for wave propagation to reach a steady state and the formation of a fully reverberant shear wave field. White Gaussian noise with a signal-to-noise ratio of 10 dB is added to the shear wave field. Fig. 12b illustrates the 3D particle velocity field of the multi-frequency reverberant shear wave within the two-sided medium, highlighting wavelength variations on each side. The primary purpose of the simulation is to validate the AIA estimation algorithm in a multi-frequency environment and reverberant field. Therefore, we used 1,000 randomly distributed excitation sources to create an ideal reverberant field. In experiments, for practical reasons, we utilized eight activation points to generate a quasi-reverberant field. However, while the wave field in this case is not fully reverberant as shown from observing edge effects on the sample in Fig. 4, the AIA algorithm is found to be robust to these edge effects as shown in in Asemani et al. (2024)45 because it utilizes the integration of all autocorrelation directions in estimations. The simulation was designed to analyze the velocity field only along the sensor axis (z-axis) because OCE measures the axial component of particle motion. To estimate the SWS at different frequencies, the velocity field for each frequency was extracted from the multi-frequency reverberant shear wave field using bandpass frequency filters with a range of 10 Hz centered at 500 Hz, 1 kHz, 1.5 kHz, 2 kHz, and 2.5 kHz.
-
Fig. 13 illustrates the schematic of the MFR-OCE system, which integrates a custom-built, fiber-based, swept-source OCT system with a piezoelectric actuator-based excitation mechanism. The swept-laser source (HSL-2100-HW, Santec, Japan) provides a spectral tuning range of approximately 140 nm centered at 1,310 nm, with a sweep rate of 20 kHz. The main interferometer was a fiber-based Mach-Zehnder interferometer (MZI). A second MZI was incorporated for spectral nonlinearity calibration following the method described by Yao et al.49,50. The overall dispersion mismatch of the system was compensated by implementing a Fourier-domain optical delay line described by Lee et al.51 in the reference arm, which consists of a collimator, grating, lens, and plane mirror.
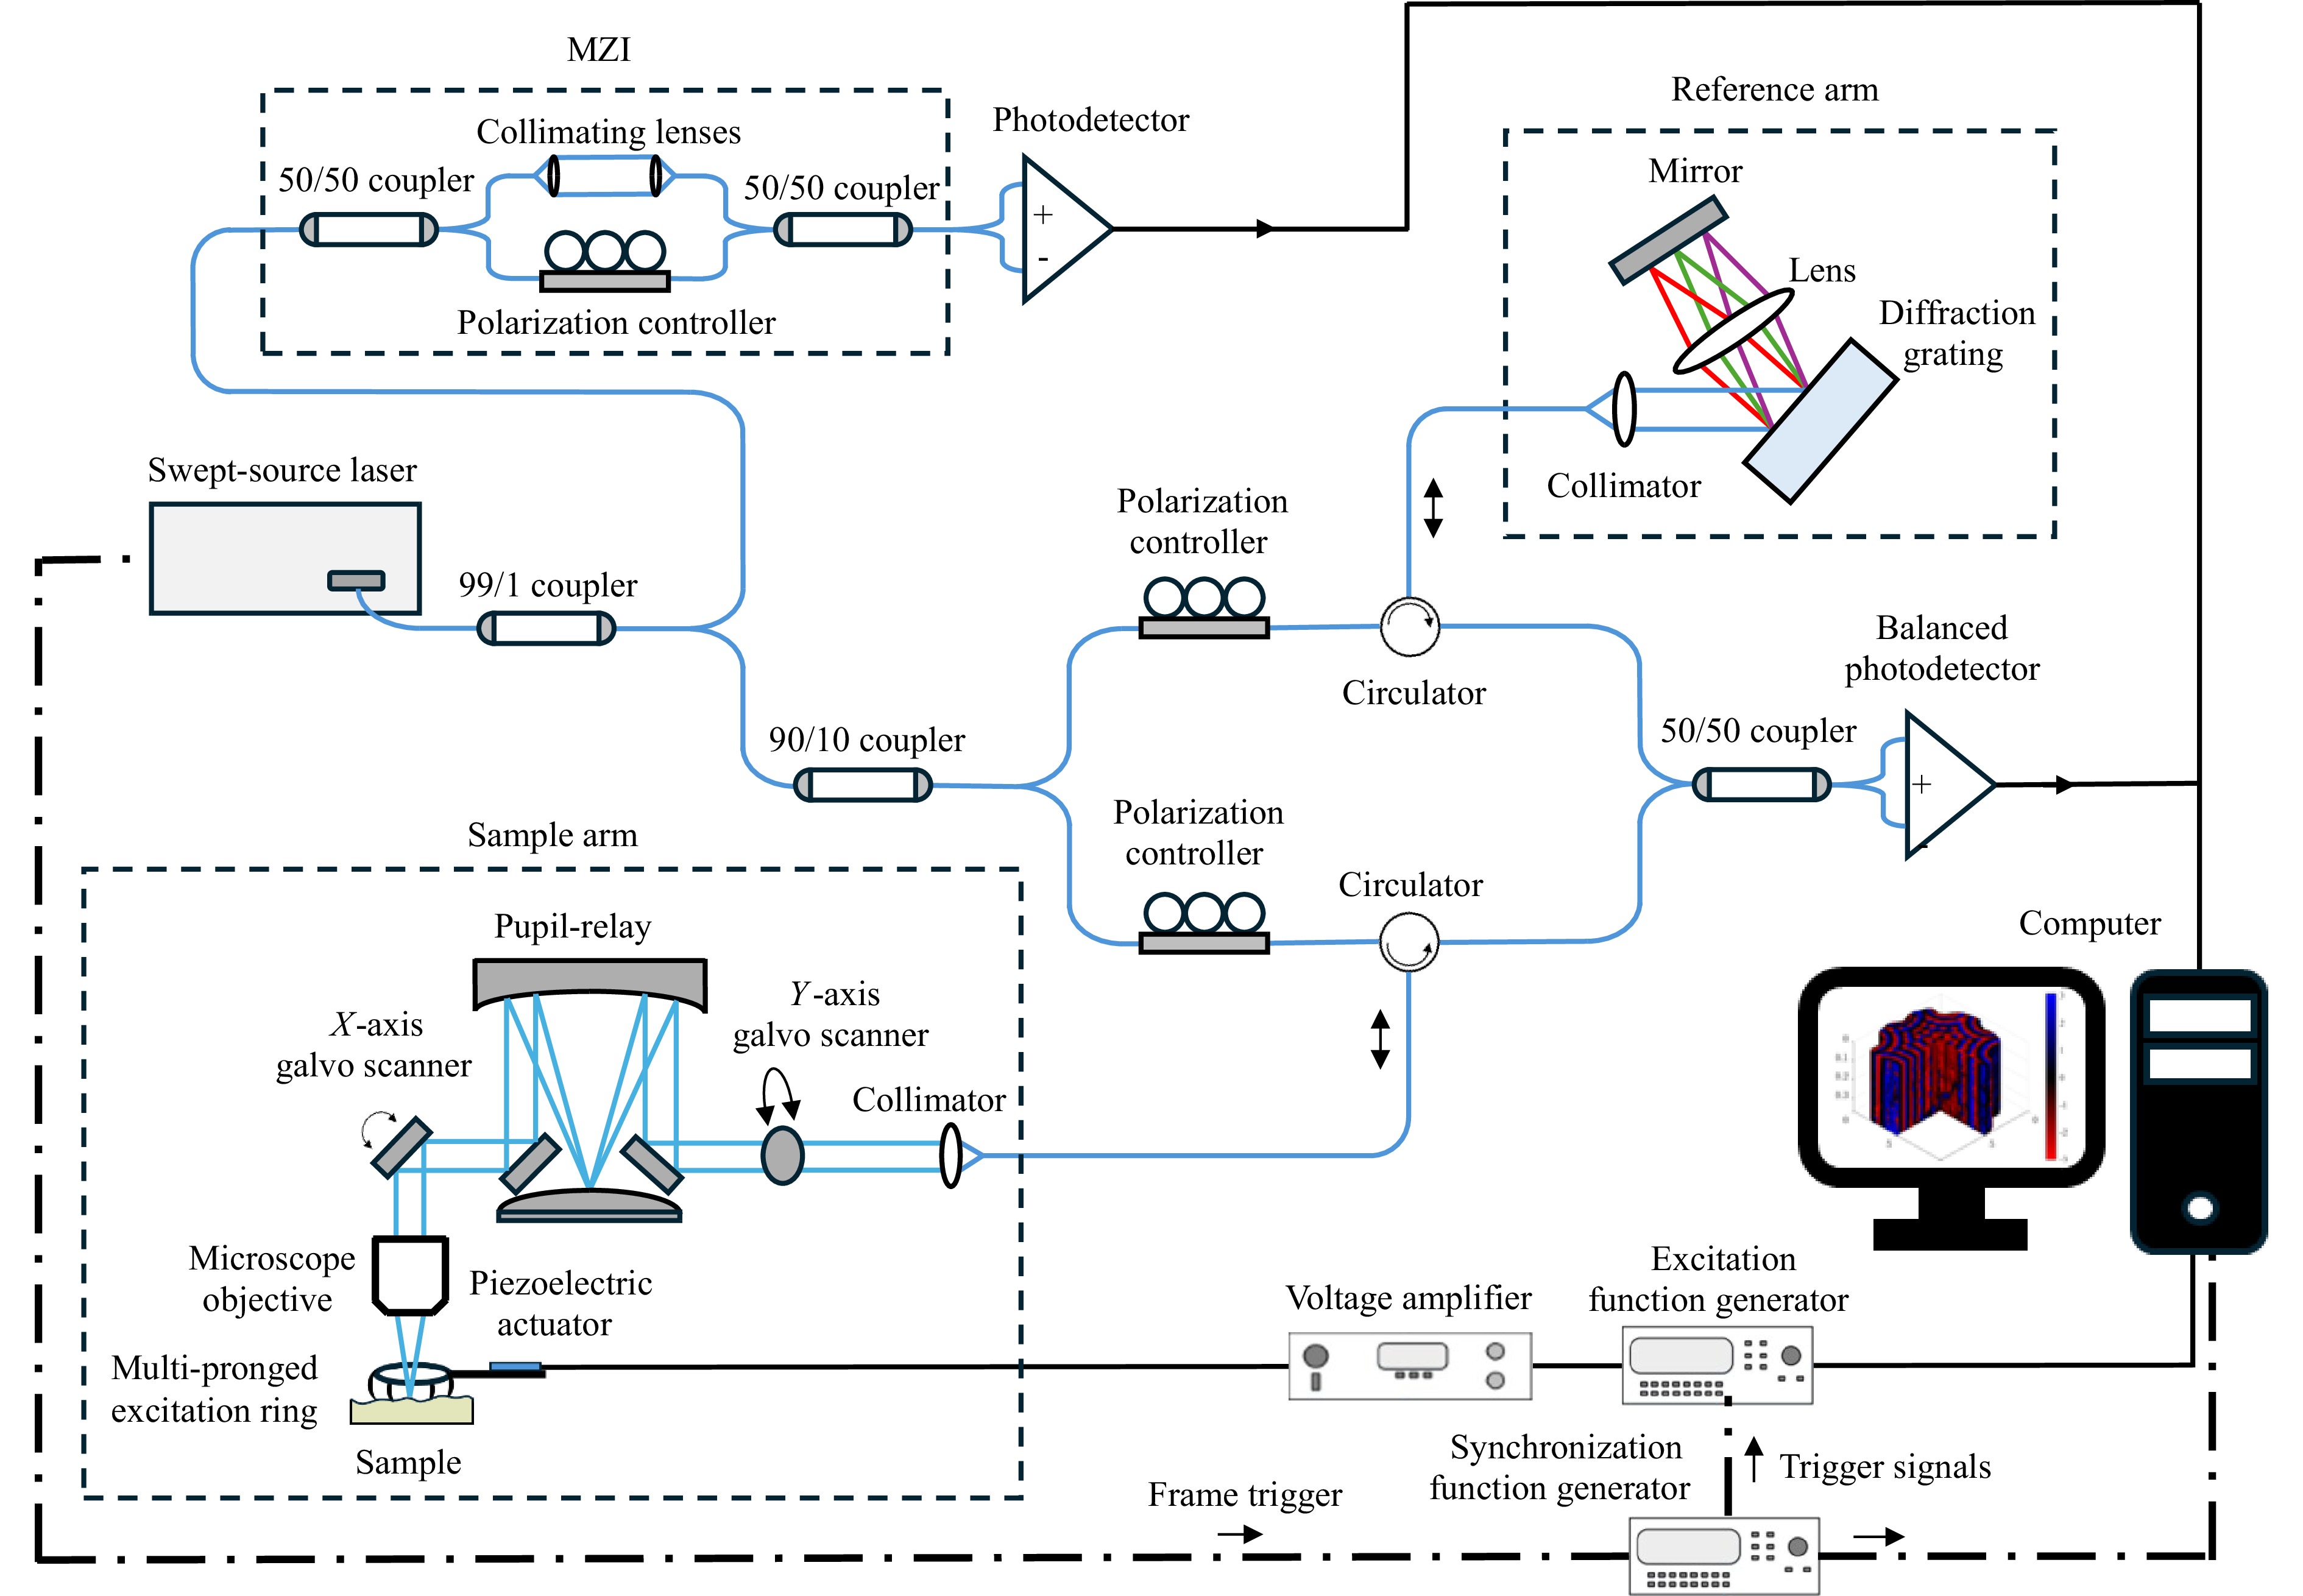
Fig. 13 Detailed schematic of the MFR-OCE system.
The measured depth resolution in air was approximately 6 µm. A microscope objective (model LSM03, Thorlabs, USA) with an effective focal length of 36 mm and a maximum field of view (FOV) of 9.4 × 9.4 mm2 was used for scanning. The sample arm incorporated a custom pupil-relay scanning mechanism to allow for an optical flat across the scanning plane, as detailed by Xu et al.52. The system's lateral resolution was measured to be approximately 20 µm.
Two balanced photodetectors (model 1817-FC, Newport, USA) captured the interference signal between the sample and reference arms and the MZI calibration signal. Each detector had a bandwidth from DC to 80 MHz and a wavelength sensitivity range of 900−1,700 nm. Polarization controllers (Thorlabs FPC030) in both arms were adjusted to maximize fringe contrast. The system sensitivity was measured to be approximately 110 dB.
System control and data acquisition were implemented in LabVIEW software (Version 14, National Instruments, USA). The software also synchronized the swept-source laser, galvo scanners, and mechanical excitation source, and allowed for adjustment of parameters such as the FOV, the number of lateral scanning points (B-mode scan), and the number of spectra to acquire at each lateral position (M-mode scan). A high precision function generator (AFG3021C, Tektronix, USA) coordinated timing between the OCT acquisition and the excitation waveform.
Mechanical excitation was generated using a piezoelectric actuator (driven by a PDu150, PiezoDrive, Australia) connected to a multi-pronged ring coupler. The excitation waveform, comprising five discrete frequencies (500 Hz, 1 kHz, 1.5 kHz, 2 kHz, and 2.5 kHz), was synthesized in MATLAB and imported into a function generator (model 4052, B&K Precision, USA) to generate a synchronized multi-frequency excitation signal. Random initial phases were assigned to each component to prevent constructive interference. This mechanical excitation induced multi-frequency shear waves within the sample.
-
Synchronization is a critical aspect of multi-frequency shear wave elastography as it ensures that the OCT imaging system is synchronized not only with the main excitation signal but also with each individual frequency component. In conventional swept-source OCT, the 3D data acquisition process involves a combination of 2D lateral scanning of the laser beam on a sample's surface within the FOV (B-mode scanning), and depth scanning along the beam propagation direction (axial scan), which is achieved by the sweeping of the laser wavelength. The acquired data is then used to form a 3D tomographic dataset.
In MFR-OCE, each point on the 2D surface is scanned multiple times (multiple sweeps of the laser wavelength to capture sample motion, a so-called “M-mode scanning”. As the waves propagate during the scan, the axial position of tissue particles changes, introducing a Doppler phase shift across the time sampling. Therefore, analyzing the Doppler phase shift on the time-series data acquired through M-mode scanning enables the estimation of SWS. In this study, 100 spectra per M-mode scan and 100 × 100 lateral sampling points per B-mode scan were acquired and processed.
Fig. 14 illustrates the synchronization process in MFR-OCE scanning. The top axes represent B-mode scanning for spatial data acquisition, the middle axes depict mechanical excitation, and the bottom axes show M-mode scanning at each position. At the end of the scan, a 4D dataset is generated, encompassing three spatial dimensions and time. To achieve a consistent and accurate 4D scan of the shear waves, it is essential that the wave field remains identical at each scan position on the 2D surface. This uniformity ensures that the OCT scans can be considered a comprehensive scan, allowing the acquired data to be integrated into a 4D representation of shear wave dynamics in the medium over time. In MFR-OCE, the displacement field corresponding to each excitation frequency is extracted to estimate the SWS. Thus, precise synchronization of all excitation frequencies with the imaging system is crucial for accurate multi-frequency shear wave analysis.
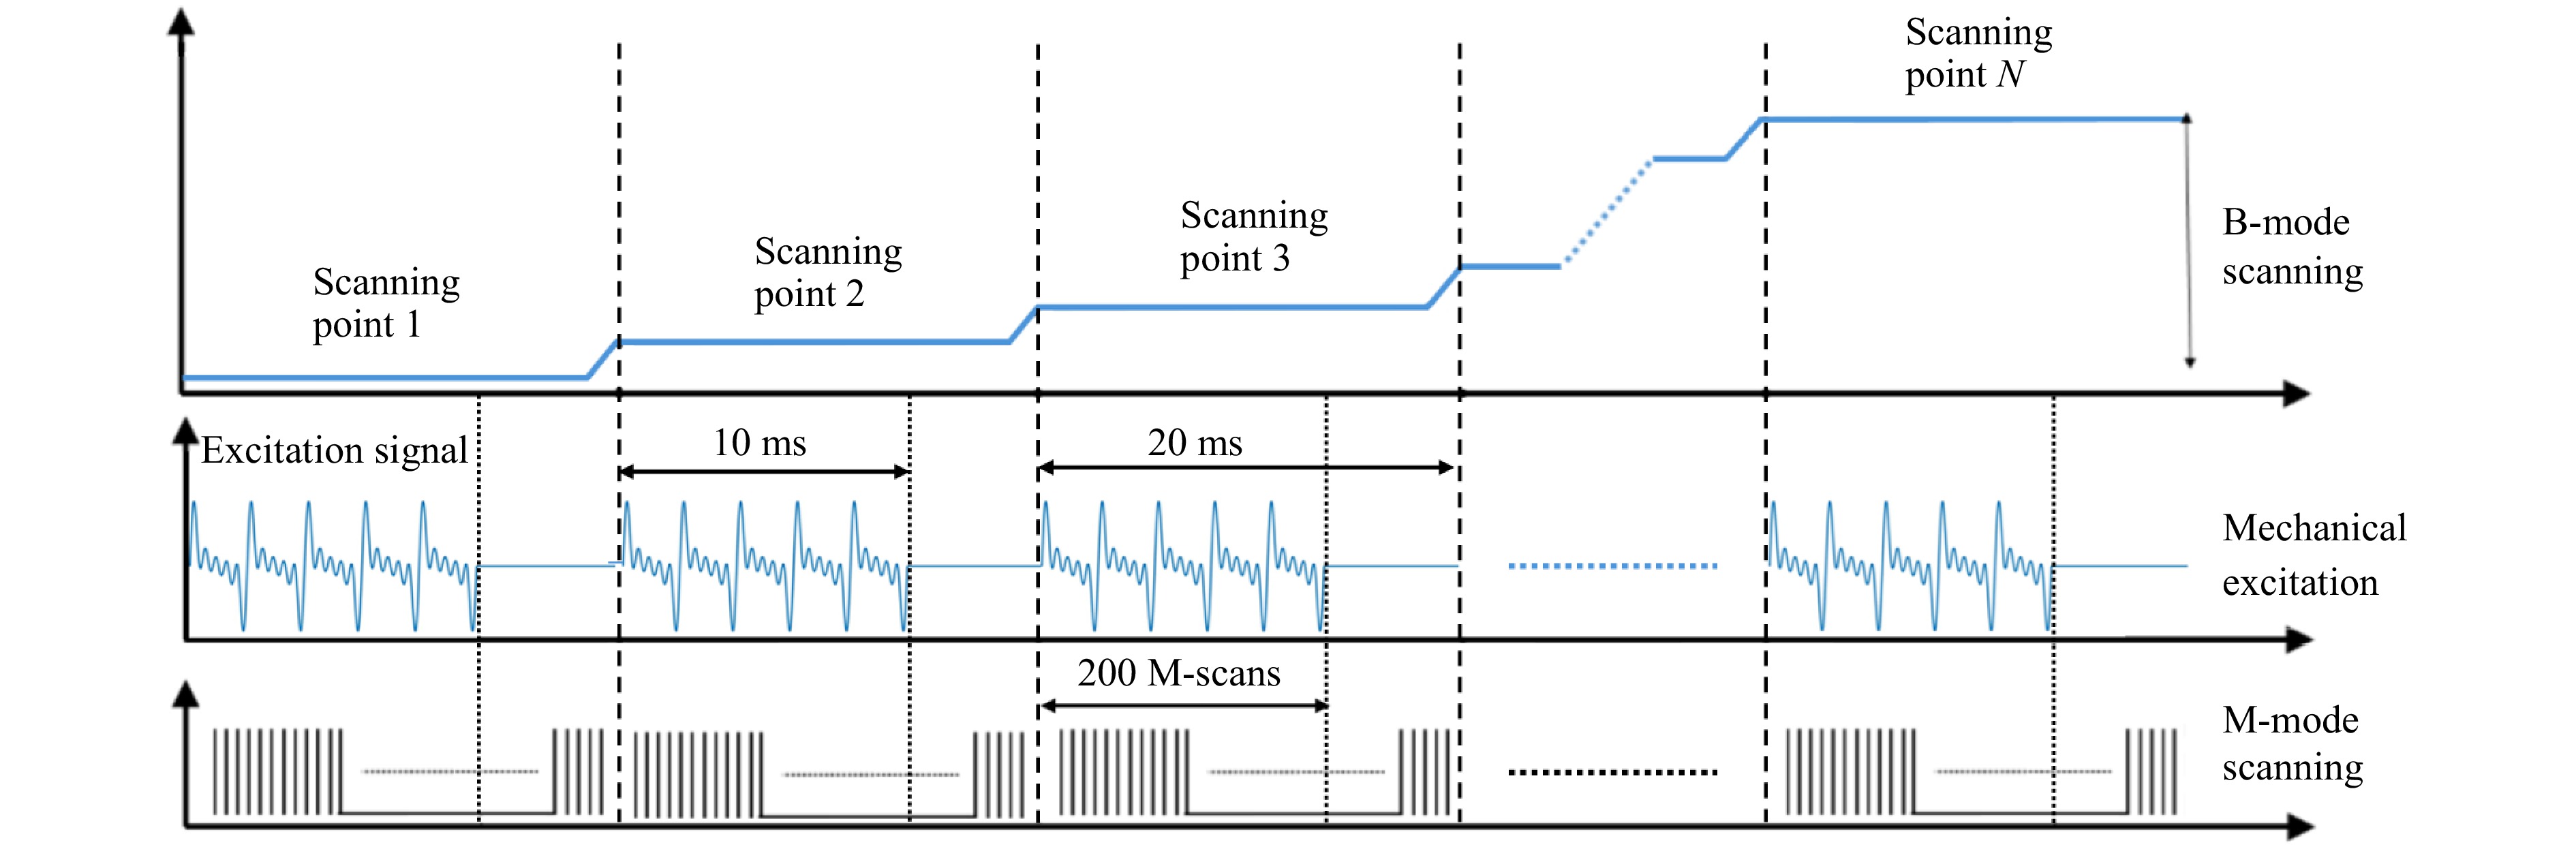
Fig. 14 Timing diagram illustrating the synchronization process between mechanical excitation and the imaging system in MFR-OCE.
As the response of the piezo actuator varies across different frequencies, the amplitude of the induced shear wave field also differs depending on the excitation frequency. Five discrete excitation frequencies (500 Hz, 1 kHz, 1.5 kHz, 2 kHz, and 2.5 kHz) were chosen to cover the operational bandwidth of the piezoelectric actuator while ensuring adequate frequency spacing for independent bandpass filtering in post-processing. A 500 Hz interval provided balanced spectral separation and temporal coherence, allowing efficient reconstruction of individual frequency components while maintaining high SNR and minimal attenuation across the measurement range.
To achieve a nearly uniform shear wave response across all frequencies, the excitation waveform was empirically tuned. The shear wave amplitude at each frequency was estimated from preliminary single-frequency measurements, and frequency-dependent scaling factors were applied to the multi-frequency excitation signal. This iterative tuning ensured that all excitation frequencies (500 Hz–2.5 kHz) produced comparable wave amplitudes in the sample. To quantitatively balance the amplitude of each excitation frequency, the induced shear wave response was first measured in preliminary single-frequency experiments using the OCT phase data. The relative amplitude at each frequency (500 Hz–2.5 kHz) was used to calculate a scaling factor, defined as the inverse of the measured amplitude response. These frequency-dependent scaling factors were then applied to the respective components of the multi-frequency excitation signal, ensuring a nearly uniform vibration amplitude and balanced energy distribution across all frequencies. This tuning procedure minimized frequency-dependent bias in the reverberant field and improved the consistency of SWS estimation.
Fig. 15 illustrates the combination of multiple sinusoidal single-frequency waves ($ {V}_{1}\left(t\right)\;to\;{V}_{n}\left(t\right) $) to generate a multi-frequency excitation waveform ($ {V}_{mf}\left(t\right) $). In the frequency domain, different excitation frequencies are distinguishable by their higher amplitudes ($ A\left(f\right) $).
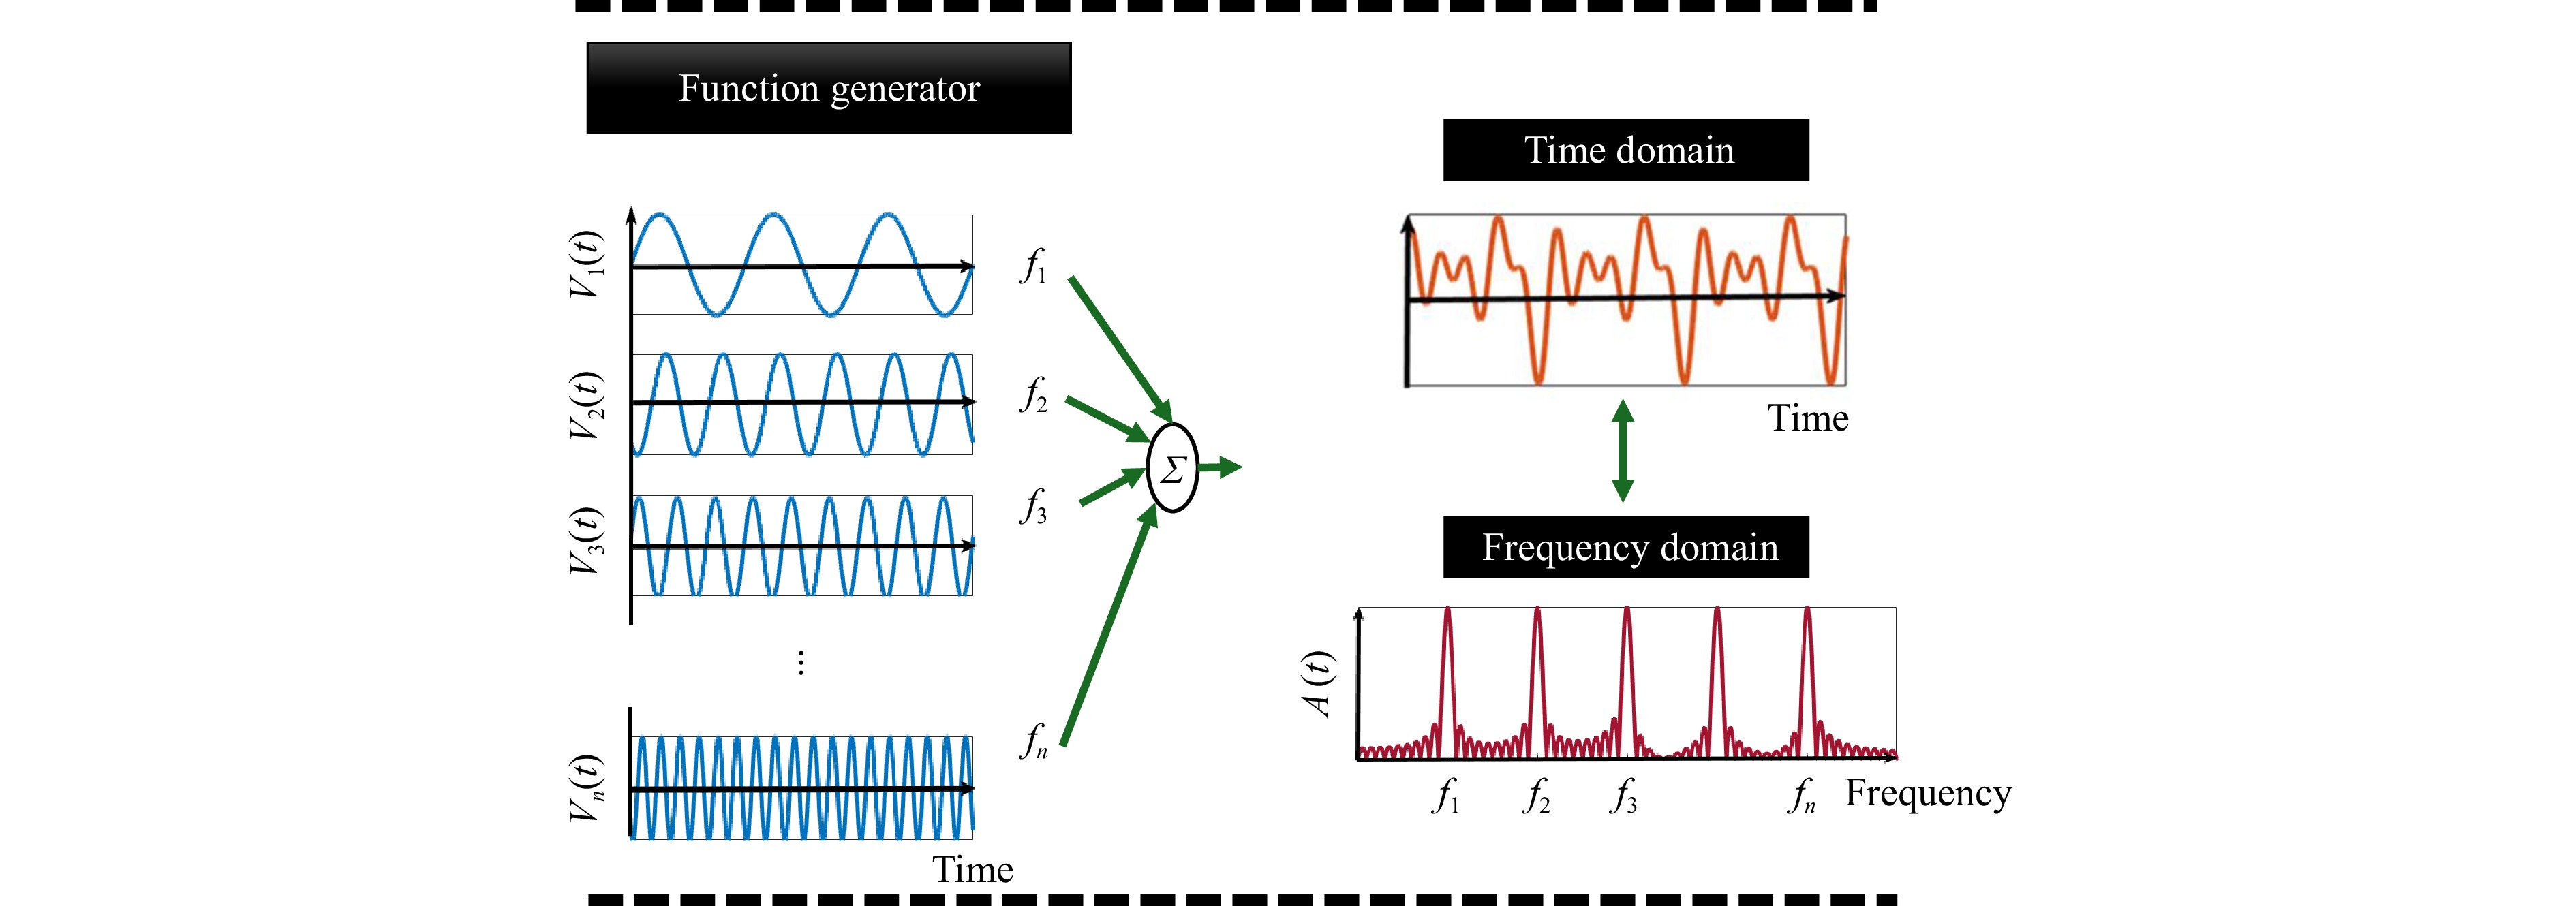
Fig. 15 Generation of a multi-frequency excitation waveform by combining sinusoidal signals with a randomly assigned initial phase.
The scanning trigger frequency was set to 50 Hz, meaning the system scans each point every 20 ms. Consequently, the excitation signal length for each scan point is also 20 ms, as illustrated by the mechanical excitation in Fig. 14. The main key to synchronization lies in the rest period within the excitation signal, where the amplitude drops to zero, allowing the imaging system sufficient time to switch scan points. The multi-frequency excitation signal was thus designed with an active period of 10 ms, followed by a 10 ms interval allocated for scan position adjustment via Galvo scanner tilting. This timing alignment ensures a stable scan for each position. The corresponding low-level region observed in each M-scan arises during a 10 ms rest period, when the excitation amplitude is zero and the OCT beam moves to the next lateral point, allowing phase consistency across the entire scan.
The trigger signal from the function generator ensures that each M-mode acquisition begins at the same temporal phase of the multi-frequency excitation, allowing the entire 3D volume to be reconstructed coherently from phase-aligned measurements. The swept-source laser operates at a sweep rate of 20 kHz, resulting in an M-mode scan every 50 µs, which corresponds to 200 M-mode scans during the 10 ms period. However, only the central 100 M-mode scans are retained for elastography measurements to optimize data processing. The displacement field was obtained using the acquisition method and data postprocessing techniques developed by Zvietcovich et al.34.
-
To generate a reverberant shear wave field, two custom-designed multi-pronged rings with eight arms, arranged around central rings measuring 10 mm and 5 mm in diameter, were employed. The rings were gently placed on the samples to induce reverberant shear waves. This excitation approach was adapted from previously published reverberant OCE configurations34, where multi-pronged contact geometries were used to form stable broadband reverberant fields. In the present study, the concept was extended to a multi-frequency excitation regime using a single piezoelectric actuator to enable simultaneous excitation across five discrete frequencies.
It should be noted that the simulation employed 1,000 randomly distributed point velocity sources, whereas the experimental MFR-OCE setup used an eight-arm multi-pronged excitation ring. This difference reflects the distinct purposes of the simulation and experiment. The simulation was designed to verify the AIA estimation algorithm under idealized reverberant conditions, ensuring that the generated shear wave field was statistically isotropic and source-independent. Using a large number of distributed point sources provided a numerically diffuse excitation pattern that closely approximated a fully developed reverberant field.
In contrast, the experimental implementation was limited by optical access and practical hardware constraints. The multi-pronged ring configuration, adapted from previously validated reverberant OCE studies34, was empirically confirmed to generate a comparable multi-directional reverberant field within the optical FOV. The isotropy and spatial stationarity of the autocorrelation function obtained from experimental data confirmed that this configuration satisfied the same reverberant field conditions assumed in the simulation. Therefore, despite differences in excitation geometry, both approaches provide functionally equivalent conditions for accurate SWS estimation using the AIA method.
The selection of the ROI was optimized for each sample type to ensure a fully developed, source-free reverberant field while maintaining sufficient signal strength and spatial coverage. In the simulation study, a computational domain of 12 mm × 12 mm × 2.4 mm was used, with a 10 mm × 10 mm × 2 mm ROI defined at the center of the model. The excitation sources were placed outside this ROI to avoid direct interference, allowing the interior region to contain only multiply reflected and scattered shear waves. In the MFR-OCE experiments on phantoms and porcine corneas, the FOV was set to 10 mm × 10 mm, with 100 scan points in each direction across the sample. A smaller FOV (5 mm × 5 mm) and a smaller multi-pronged ring (the 5 mm ring) were used in the liver experiments due to higher shear wave attenuation in liver tissue. This smaller imaging window ensured that the reverberant field remained uniform within the analyzed region while maintaining an adequate signal-to-noise ratio. The uniformity of the AIA within the central FOV was used as an internal benchmark to confirm the reverberant condition across all sample types.
The excitation frequencies were selected between 500 Hz and 2.5 kHz to balance spatial resolution, signal attenuation, and system bandwidth. Frequencies below 500 Hz generate shear wavelengths too long to sustain a well-defined reverberant field within the 10 mm FOV, while frequencies above 2.5 kHz experience significant attenuation in soft tissue. A multi-frequency excitation signal comprising five frequencies (i.e., 500 Hz, 1 kHz, 1.5 kHz, 2 kHz, and 2.5 kHz) was applied to the samples. To compare the multi-frequency results with single-frequency results, additional experiments were conducted on phantom samples using single-frequency reverberant shear waves at 1 kHz, 1.5 kHz, and 2 kHz.
-
Gelatin phantoms: Four isotropic, homogeneous gelatin phantoms were prepared using standard methods45. Each phantom consisted of 5% gelatin powder (G1890-1KG, gelatin from porcine skin, Sigma-Aldrich, MO, USA) to provide elastic properties, 3% intralipid powder for optical scattering, 1% salt, and 91% water. The formulation and preparation method were specifically designed to ensure isotropic mechanical behavior, facilitating the investigation of multi-frequency shear wave elastography. The reason for multiple phantoms at 5% concentration was to repeat measurements on fresh phantoms that were each kept in their respective containers before making measurements. To demonstrate the capability of MFR-OCE for lesion visualization, a 3% gelatin phantom containing a 7% gelatin cylindrical lesion (3.5 mm in diameter) was prepared using the same method.
Corneas: Ex vivo porcine whole eye globe samples were sourced from a local slaughterhouse immediately after slaughter and kept under refrigerated conditions during transport. Upon arrival at the laboratory, the eye globes were immersed in a balanced salt solution (BSS). The samples were then allowed to reach room temperature before the experiments commenced. This preparation method ensured the preservation of the cornea's natural biomechanical properties. All experiments were conducted on the day of collection, using only intact eyes with undamaged corneas. Before placement in a custom-built holder, surrounding adipose and muscular tissues were carefully removed. To maintain an intraocular pressure of 15 mmHg, a needle connected to an intravenous fluid bag containing the BSS was inserted through the holder into the eye. To prevent dehydration, the eyes were irrigated with the saline solution at regular intervals.
Liver: A freshly harvested ex vivo bovine liver was obtained from a slaughterhouse immediately post-slaughter and transported under refrigerated conditions. Small samples were excised from the liver for the MFR-OCE experiments. The samples were then brought to room temperature while submerged in saline solution to prevent tissue degeneration and dehydration.
-
The method introduced in this paper, MFR-OCE, demonstrates the effectiveness of multi-frequency reverberant shear wave elastography in both simulated and experimental settings, highlighting its capability for precise SWS estimation in heterogeneous media. The single-shot, combined excitation strategy of MFR-OCE is expected to represent a key advantage for both research and clinical translation. By simultaneously exciting and capturing multiple discrete shear wave frequencies within a single acquisition cycle, MFR-OCE eliminates the need for repeated frequency sweeps that can modify boundary conditions or introduce temporal variability in the tissue's viscoelastic response. This characteristic is particularly critical for (1) ex vivo biological tissue characterization as tissues are susceptible to dehydration and stiffness drift during sequential measurements and (2) for in vivo ophthalmic to synergize with the requirement for rapid image acquisition that will also lower the impact of eye motion on the measurements. The ability to perform multi-frequency estimation in a single, synchronized scan importantly substantially shortens total acquisition time by approximately 80% compared with performing five independent single-frequency scans. This faster acquisition capability is expected to enhance the practicality of MFR-OCE for translation to in vivo and clinical applications where measurement stability and temporal efficiency are essential.
For clarity, Table 3 summarizes the typical operational parameters of MRE, USE, single-frequency OCE (SF-OCE), and MFR-OCE, including frequency range, corresponding shear wavelength, and typical imaging depth. This comparison highlights the unique frequency–wavelength regime of MFR-OCE relative to other modalities, enabling high-resolution elastographic imaging suitable for ophthalmic applications.
Modality Typical frequency range Shear wavelength in soft tissue (mm) Typical imaging depth MRE 20–100 Hz 10–100 mm cm-scale (whole-organ) USE 40–600 Hz 2–70 mm mm–cm scale SF-OCE 500 H–5 kHz 0.3–8 mm ≤ 2 mm MFR-OCE 500–2.5 kHz (expandable to 5 kHz) 0.3–8 mm ≤ 2 mm Table 3. Comparison of operational parameters of MRE, USE, single-frequency OCE, and MFR-OCE
By generating a reverberant shear wave field and analyzing the wave fields using the AIA approach, we accurately measured SWS across multiple frequencies in a simulated two-sided medium, homogeneous gelatin phantoms, a phantom with a small lesion, ex vivo porcine corneas, and an ex vivo bovine liver. The simulations showed that the estimated SWS values closely aligned with the defined model parameters, with less than 4% error across all frequencies. In the homogeneous phantom experiments, consistent SWS and power-law exponent estimation were observed across three different frequencies. The estimated power-law exponent of 0.13 in MFR-OCE indicates the well-known low dispersion, nearly elastic behavior of the gelatin phantom, a benchmark to compare against for tissues. Furthermore, there was close agreement between SWS estimates from single-frequency and multi-frequency excitations, with a less than 3% difference, demonstrating that the MFR-OCE approach effectively isolates individual frequency components and provides accurate SWS estimates. Finally, we demonstrated in a phantom the capacity for lesion visualization of the MFR-OCE technique using a 3.5 mm lesion detectable at high frequencies above 2 kHz. The MFR-OCE results for the porcine cornea and bovine liver samples indicate that MFR-OCE is an effective approach to evaluating the viscoelastic behavior of different tissues. The excellent fit of the power-law model with the estimated results confirmed that the dispersion behavior of both the cornea and liver can be well-defined by the power-law model spanning for the first time in a high-frequency range of 500 Hz to 2.5 kHz. Lower frequencies have the disadvantage of longer wavelengths requiring larger estimation windows, degrading spatial resolution. Higher frequencies have the disadvantage of higher attenuation and higher temporal sampling requirements. The optimal range may vary with the type of sample under study and will need to be determined experimentally. Further research will establish the limits on the bandwidth and spatial-temporal resolution of the MFR-OCE approach. The power-law exponent of 0.33 for the porcine cornea and 0.51 for the bovine liver indicates a moderate and a high viscoelastic behavior for the cornea and the liver, respectively.
For ophthalmic translation, several in vivo challenges will need to be addressed. Ocular motion, cardiac-driven pulsation, and perfusion can introduce phase noise and spatial misalignment during acquisition. These effects can be mitigated starting with the selection of an optimized fixation target53 combined with, if needed, the integration of eye-tracking to enable real-time motion compensation by actively stabilizing the imaging field relative to retinal or corneal landmarks. In parallel, post-processing correction techniques, such as motion registration, phase stabilization, and temporal filtering, can be applied to further improve spatial coherence and reduce motion-induced artifacts in the reconstructed elastograms2,29,54,55.
The current implementation uses contact-coupled excitation and volumetric scanning, while in vivo imaging would require non-contact mechanical stimulation. A promising step toward clinical translation is the non-contact reverberant OCE approach demonstrated by Zevallos-Delgado et al.56, which employs air-coupled ultrasonic transducers to generate reverberant shear waves without physical contact. Such an excitation strategy could be integrated with the MFR-OCE framework to enable rapid, non-contact assessment of tissue biomechanics in vivo. The single-shot multi-frequency capability of MFR-OCE is then envisioned to be highly advantageous for in vivo ophthalmic imaging.
While MFR-OCE demonstrates strong potential for quantitative viscoelastic characterization, the current implementation is constrained by the swept-source repetition rate and galvo scanning speed that currently limit the achievable frame rate for large-area volumetric imaging. Also, high-frequency shear waves (> 3 kHz) experience increased attenuation in highly scattering or viscous tissues, reducing FOV. In addition, reverberant field formation can be influenced by sample geometry and boundary reflections, particularly in small or curved specimens. The system speed limitation can be addressed in future work through the use of a faster swept source (e.g., 200 kHz swept sources are now available or even ultrafast swept source lasers that achieve a 400 MHz sweep rate57) with faster galvos or MEMS, novel architecture with spectral domain line-field OCT, or asynchronous OCE58. It is also important to incorporate adaptive excitation schemes to optimize the usable frequency band for each tissue type.
The present implementation uses the AIA method, which assumes isotropy by averaging over all propagation directions. However, the underlying spatial autocorrelation data can, in principle, be analyzed directionally to investigate anisotropic mechanical behavior. By evaluating direction-dependent correlation functions or wavenumber variations within the reverberant field as demonstrated in a previous reverberant anisotropy study47, the MFR-OCE framework can be extended to estimate angle-dependent shear wave speeds and anisotropy ratios from a single multi-frequency dataset. Such an extension is expected to enable comprehensive characterization of tissue microstructure and represent an important direction for future work.
The overall findings underscore the capacity of MFR-OCE as a robust, high-resolution tool for quantitative tissue characterization, particularly in assessing complex viscoelastic materials. While the present work demonstrates technical feasibility and foundational validation, further optimization and in vivo studies will be required to translate this approach toward clinical implementation, especially in ophthalmology, where the higher speed if MFR-OCE is envisioned to facilitate safe and real-time biomechanical assessment.
-
NIH (Grant Number: R21AG070331), NIH NEI (Grant Number: P30EY001319), University of Rochester Center of Excellence in Data Science for Empire State Development (Grant Number: 2089A015). J.P.R. and P.M. acknowledge financial support by Suranaree University of Technology (SUT) and Office of the Permanent Secretary, Ministry of Higher Education, Science, Research and Innovation (OPS, MHESI) under the Reinventing University 2025: Frontier Research and Innovation Networking for Medical Device Development Program.
Multi-frequency reverberant shear waves for assessing tissue dispersion in optical coherence elastography
- Light: Advanced Manufacturing , Article number: 127 (2026)
- Received: 19 August 2025
- Revised: 26 July 2026
- Accepted: 26 July 2026 Published online: 30 September 2026
doi: https://doi.org/10.37188/lam.2026.127
Abstract: Optical coherence elastography (OCE) is a non-invasive imaging technique for high-resolution assessment of both tissue elasticity and viscoelasticity. Mechanical characterization enhances biomedical imaging by providing functional insights into tissue health beyond structural information alone. Accurate viscoelastic characterization requires estimating shear wave speed (SWS) across multiple frequencies, as dispersion induces frequency-dependent variations in wave speed. In this paper, we introduce a single-shot multi-frequency reverberant OCE (MFR-OCE) approach to enable reliable viscoelastic characterization by simultaneously capturing shear wave dynamics across multiple frequencies. We present the theoretical framework, experimental setup, and validation of MFR-OCE through simulations and experiments on homogeneous gelatin phantoms and one with an inclusion, ex vivo porcine corneas, and ex vivo bovine liver. Simulation results demonstrate that MFR-OCE estimates SWS with errors below 4% compared to ground truth. Phantom experiments show that MFR-OCE and single-frequency OCE yield closely matching SWS estimates, with differences below 3%. Furthermore, frequency-dependent dispersion coefficients observed in both biological tissues and phantoms align with the theoretical viscoelastic power-law model. The gelatin phantoms exhibit a low viscoelastic behavior with a power-law exponent of 0.13, while porcine corneas demonstrate intermediate viscoelastic behavior, with a power-law exponent of 0.33. The bovine liver shows significant frequency dependence, with a power-law exponent of 0.51. These findings demonstrate that MFR-OCE enables comprehensive viscoelastic characterization and is envisioned to provide a foundation for future development of clinically oriented OCE systems.
Research Summary
Optical elastography maps tissue mechanics across frequencies in one shot
A reverberant optical coherence elastography technique that measures tissue mechanics over multiple frequencies in a single acquisition could improve characterization of viscoelastic biological tissues. Hamidreza Asemani and colleagues developed multi-frequency reverberant shear wave optical coherence elastography (MFR-OCE), which simultaneously excites and measures shear waves across several frequencies under identical boundary conditions. The method was first validated in tissue-mimicking phantoms and then extended to bovine liver and porcine cornea samples to demonstrate its applicability in soft and ocular tissues. Unlike conventional single-frequency methods, the approach reduces acquisition time while enabling analysis of frequency-dependent tissue dispersion and viscoelastic behavior. The technique may support improved biomechanical assessment for ophthalmic imaging and broader biomedical applications.
Rights and permissions
Open Access This article is licensed under a Creative Commons Attribution 4.0 International License, which permits use, sharing, adaptation, distribution and reproduction in any medium or format, as long as you give appropriate credit to the original author(s) and the source, provide a link to the Creative Commons license, and indicate if changes were made. The images or other third party material in this article are included in the article′s Creative Commons license, unless indicated otherwise in a credit line to the material. If material is not included in the article′s Creative Commons license and your intended use is not permitted by statutory regulation or exceeds the permitted use, you will need to obtain permission directly from the copyright holder. To view a copy of this license, visit http://creativecommons.org/licenses/by/4.0/.

 DownLoad: