


-
In the past decade, remarkable progress has been made in the development of integrated, compact, and efficient chip-scale terahertz (THz) technologies, which has significantly reduced the THz gap1–6. These advances have laid a solid foundation for the development of high-speed THz wireless communication7–10. Silicon-based integrated technology offers a platform for the large-scale integration and micro-packaging of hybrid THz microsystems11–13. High-resistivity silicon materials have garnered considerable attention in the field of THz applications owing to their mature manufacturing process platform, which is compatible with integrated circuits, low loss, and high stability14. Silicon-based passive waveguide devices, including differentiators, filters, and isolators can be interconnected on unified substrates to form integrated THz circuits. These circuits effectively guide the propagation of THz signals and facilitate signal processing with various functionalities15–18. Insights from the history of electronic integrated circuits and photonic technologies have emphasised the importance of complexity and integration in modern monolithic electronic-photonic platforms19. Silicon-based THz circuits have become an integral part of THz-based electronic technology, facilitating the development of THz-integrated chips and playing a critical role in miniaturised THz communication systems20–22.
Although time-domain differentiators are essential computational components in programmable photonic circuits23–28, they are rarely reported in the THz region. A THz temporal differentiator is significant as a fundamental component in many silicon-based THz circuits and as a basic device for mathematical operations on THz signals29–31. It can also be used for pulse generation, pulse shaping, and differential equations. Microring resonators, which have gained prominence owing to their small size and strong signal processing abilities, have been extensively explored in various optical frequency applications32–34 and are the building blocks for photonic differentiator devices35–38. Continuous improvements in silicon-based integrated technologies have gradually enabled the application of silicon-based photonic structures in the THz domain16–18,39. These photonic technologies reduce the loss of THz signals during propagation and enable the fabrication of THz devices through waveguide technology, thus achieving various passive functionalities. In 2003, Grischkowsky first reported the use of microring resonators for THz pulses, which significantly contributed to THz-based technological developments, particularly in the interaction between THz pulses and dielectric resonators40. In 2008, Liu et al. demonstrated for the first time in the field of optics that microring resonators based on silicon-on-insulator structures could serve as time-domain first-order differentiators36. In 2020, Xie et al. combined microring resonators with THz-based technology and designed an on-chip THz differentiator, offering a potential solution for THz pulse-shaping techniques15. The findings of previous studies conducted in this field possess certain limitations. For instance, the resonator and coupling waveguide were discrete, and the input and output relied on free-space coupling, resulting in relatively low efficiency and challenging alignment, leading to losses of 6 dB or even more that hindered further application of the device. Accurately controlling the distance between the discrete optical fibres used for the input and output and the resonator has proved challenging, impeding large-scale integration, increasing losses, and introducing unwanted mode interference during signal transmission40,41. Currently, a compact and easily integrated time-domain differentiator that produces only low losses for high-speed THz signal processing and can be efficiently packaged and integrated into practical THz applications is required.
In this study, we proposed an on-chip THz temporal differentiator based on an all-silicon microring resonator with a compact and standard waveguide–compatible package and aimed to thoroughly investigate its performance in terms of key metrics. The on-chip integrated resonator was made of a low-loss, high-resistivity silicon material and was designed to operate near the critical coupling resonance region and facilitate the temporal differentiation of the complex envelope of high-speed input signals at specific resonant frequencies. To address the coupling issues between the metal and dielectric waveguides during on-chip packaging, we used a gradient transition structure, which effectively overcame the challenges related to waveguide port interconnection and achieved low insertion loss. This device directly enables the identification of step transitions in high-speed signals and provides a potential solution for ultrafast pulse shaping, waveform generation, and differential equations in THz communications.
-
The fundamental concept of an ideal first-order differentiator (IFOD) involves calculating the first derivative of the complex envelope of an input electric field in the time domain (Fig. 1a). In the frequency domain, the transfer function of an IFOD is represented by $ T\left(\omega \right)=j(\omega -{\omega }_{0}) $, where $ {\omega }_{0} $ and $ \omega $ denote the centre frequency of the differentiator and carrier frequency of the input signal, respectively36,37. The amplitude and phase expressions of the IFOD can be obtained according to the transfer function, and the results are as follows:
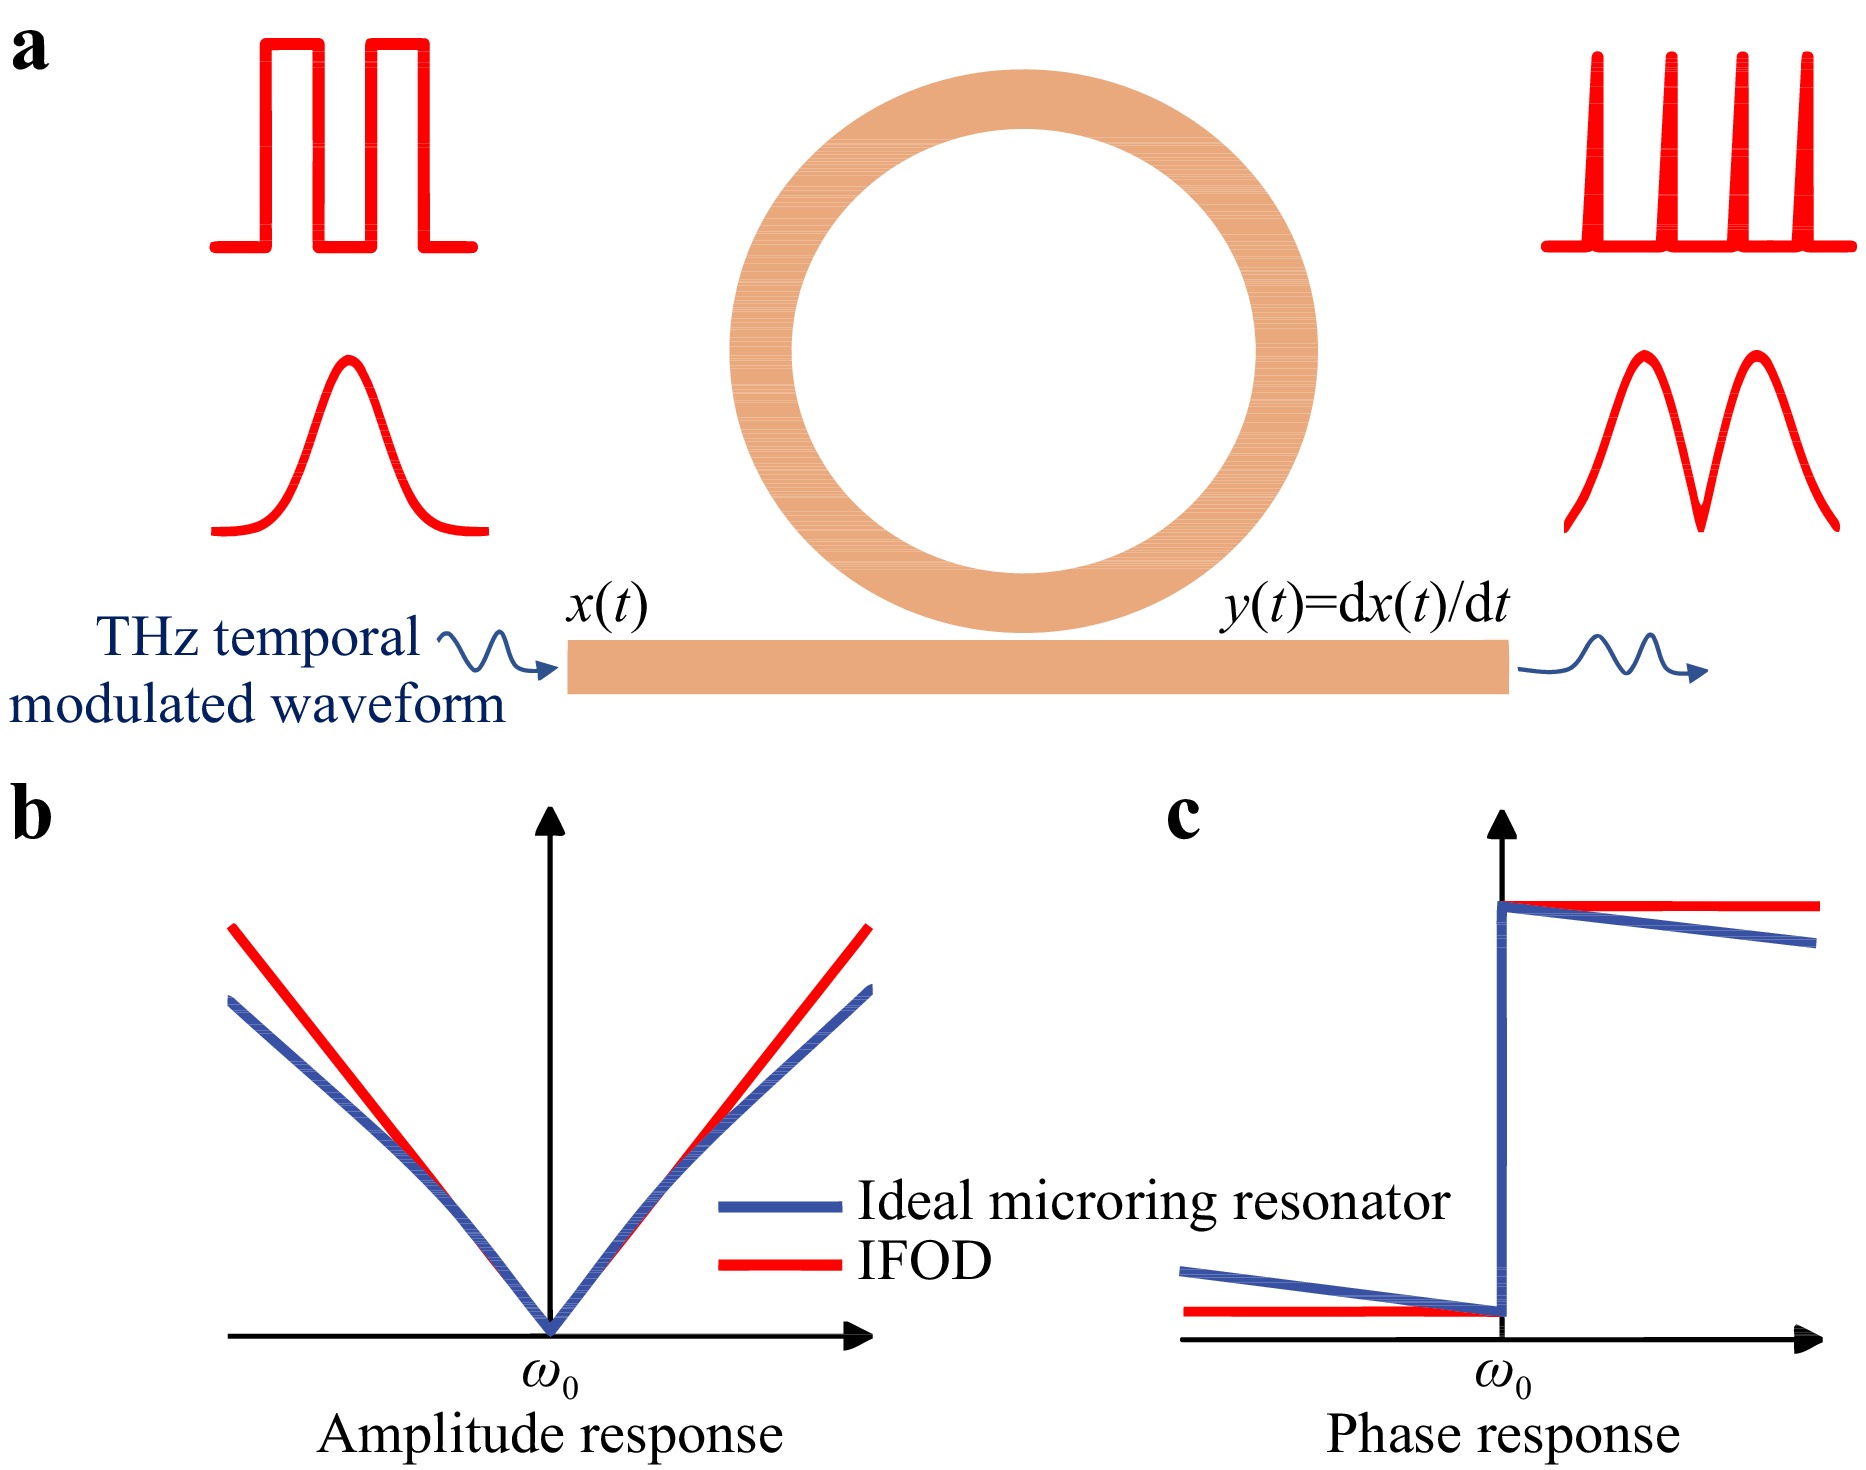
Fig. 1 Single-bus microring resonator operating at the critical coupling point to achieve time-domain first-order differentiation. a Schematic of a differentiator based on a microring resonator. b Amplitude-frequency responses of the microring resonator and IFOD. c Phase-frequency responses of the microring resonator and IFOD.
$$ \begin{array}{c}\left|T\left(\omega \right)\right|=\left|\omega -{\omega }_{0}\right|\end{array} $$ (1) $$\angle T\left(\omega \right)=\left\{\begin{array}{*{20}{l}}-\dfrac{{\text π }}{2},&\omega < {\omega }_{0}\\ \dfrac{{\text π }}{2},&\omega > {\omega }_{0}\end{array}\right. $$ (2) Eq. 1 indicates that the amplitude spectrum of the IFOD is symmetric about the centre frequency and exhibits a decrease and an increase to its left and right, respectively. Eq. 2 shows that the phase spectrum undergoes a phase shift of π at the centre frequency, and the phase varies linearly with frequency on both sides of the phase jump. By analysing the theoretical formulas related to microring resonators, we can demonstrate that a single-bus microring resonator can approximate a first-order time-domain differentiator (Supplementary Note 1). The lines plotted in Fig. 1b, c show the amplitude-frequency and phase-frequency responses of the single-bus microring resonator compared to those of the IFOD. The blue line represents the amplitude and phase responses of a THz microring resonator operating at the critical coupling frequency $ {\omega }_{0} $. A complete phase shift of π occurs, and the phase response varies linearly near the phase jump point. The amplitude response follows a Lorentzian shape,which is symmetric about the centre frequency. The red line represents the amplitude and phase responses of the IFOD near the centre frequency $ {\omega }_{0} $ and it reveals that the microring resonator in the critical coupling state and IFOD exhibit highly similar amplitude and phase responses. Consequently, a single-bus microring resonator can be effectively used as a differentiator to achieve a certain gain and constant output.
-
Fig. 2a shows a schematic of the core chip of the device fabricated on a 200-μm-thick double-side high-resistivity polished silicon wafer (ρ > 10000 Ω.cm). The chip has a ridge waveguide design comprising a circular waveguide and straight bus waveguide, where the waveguide mode couples from the straight waveguide to the circular waveguide. The coupling strength depends on the gap distance (g) between the straight and circular waveguides; the value of g should be set to 8 μm to achieve critical coupling. Fig. 2a also shows the cross-sectional view of the straight waveguide in the microring resonator, where h1 and h2 represent the substrate thickness and height of the ridge waveguide, respectively. Both the straight and circular waveguides possessed a width of w. The specific parameters used were: h1 = 60 μm, h2 = 140 μm, and w = 210 μm. Additional details regarding the estimation of the waveguide dimensions are provided in Supplementary Note 2.
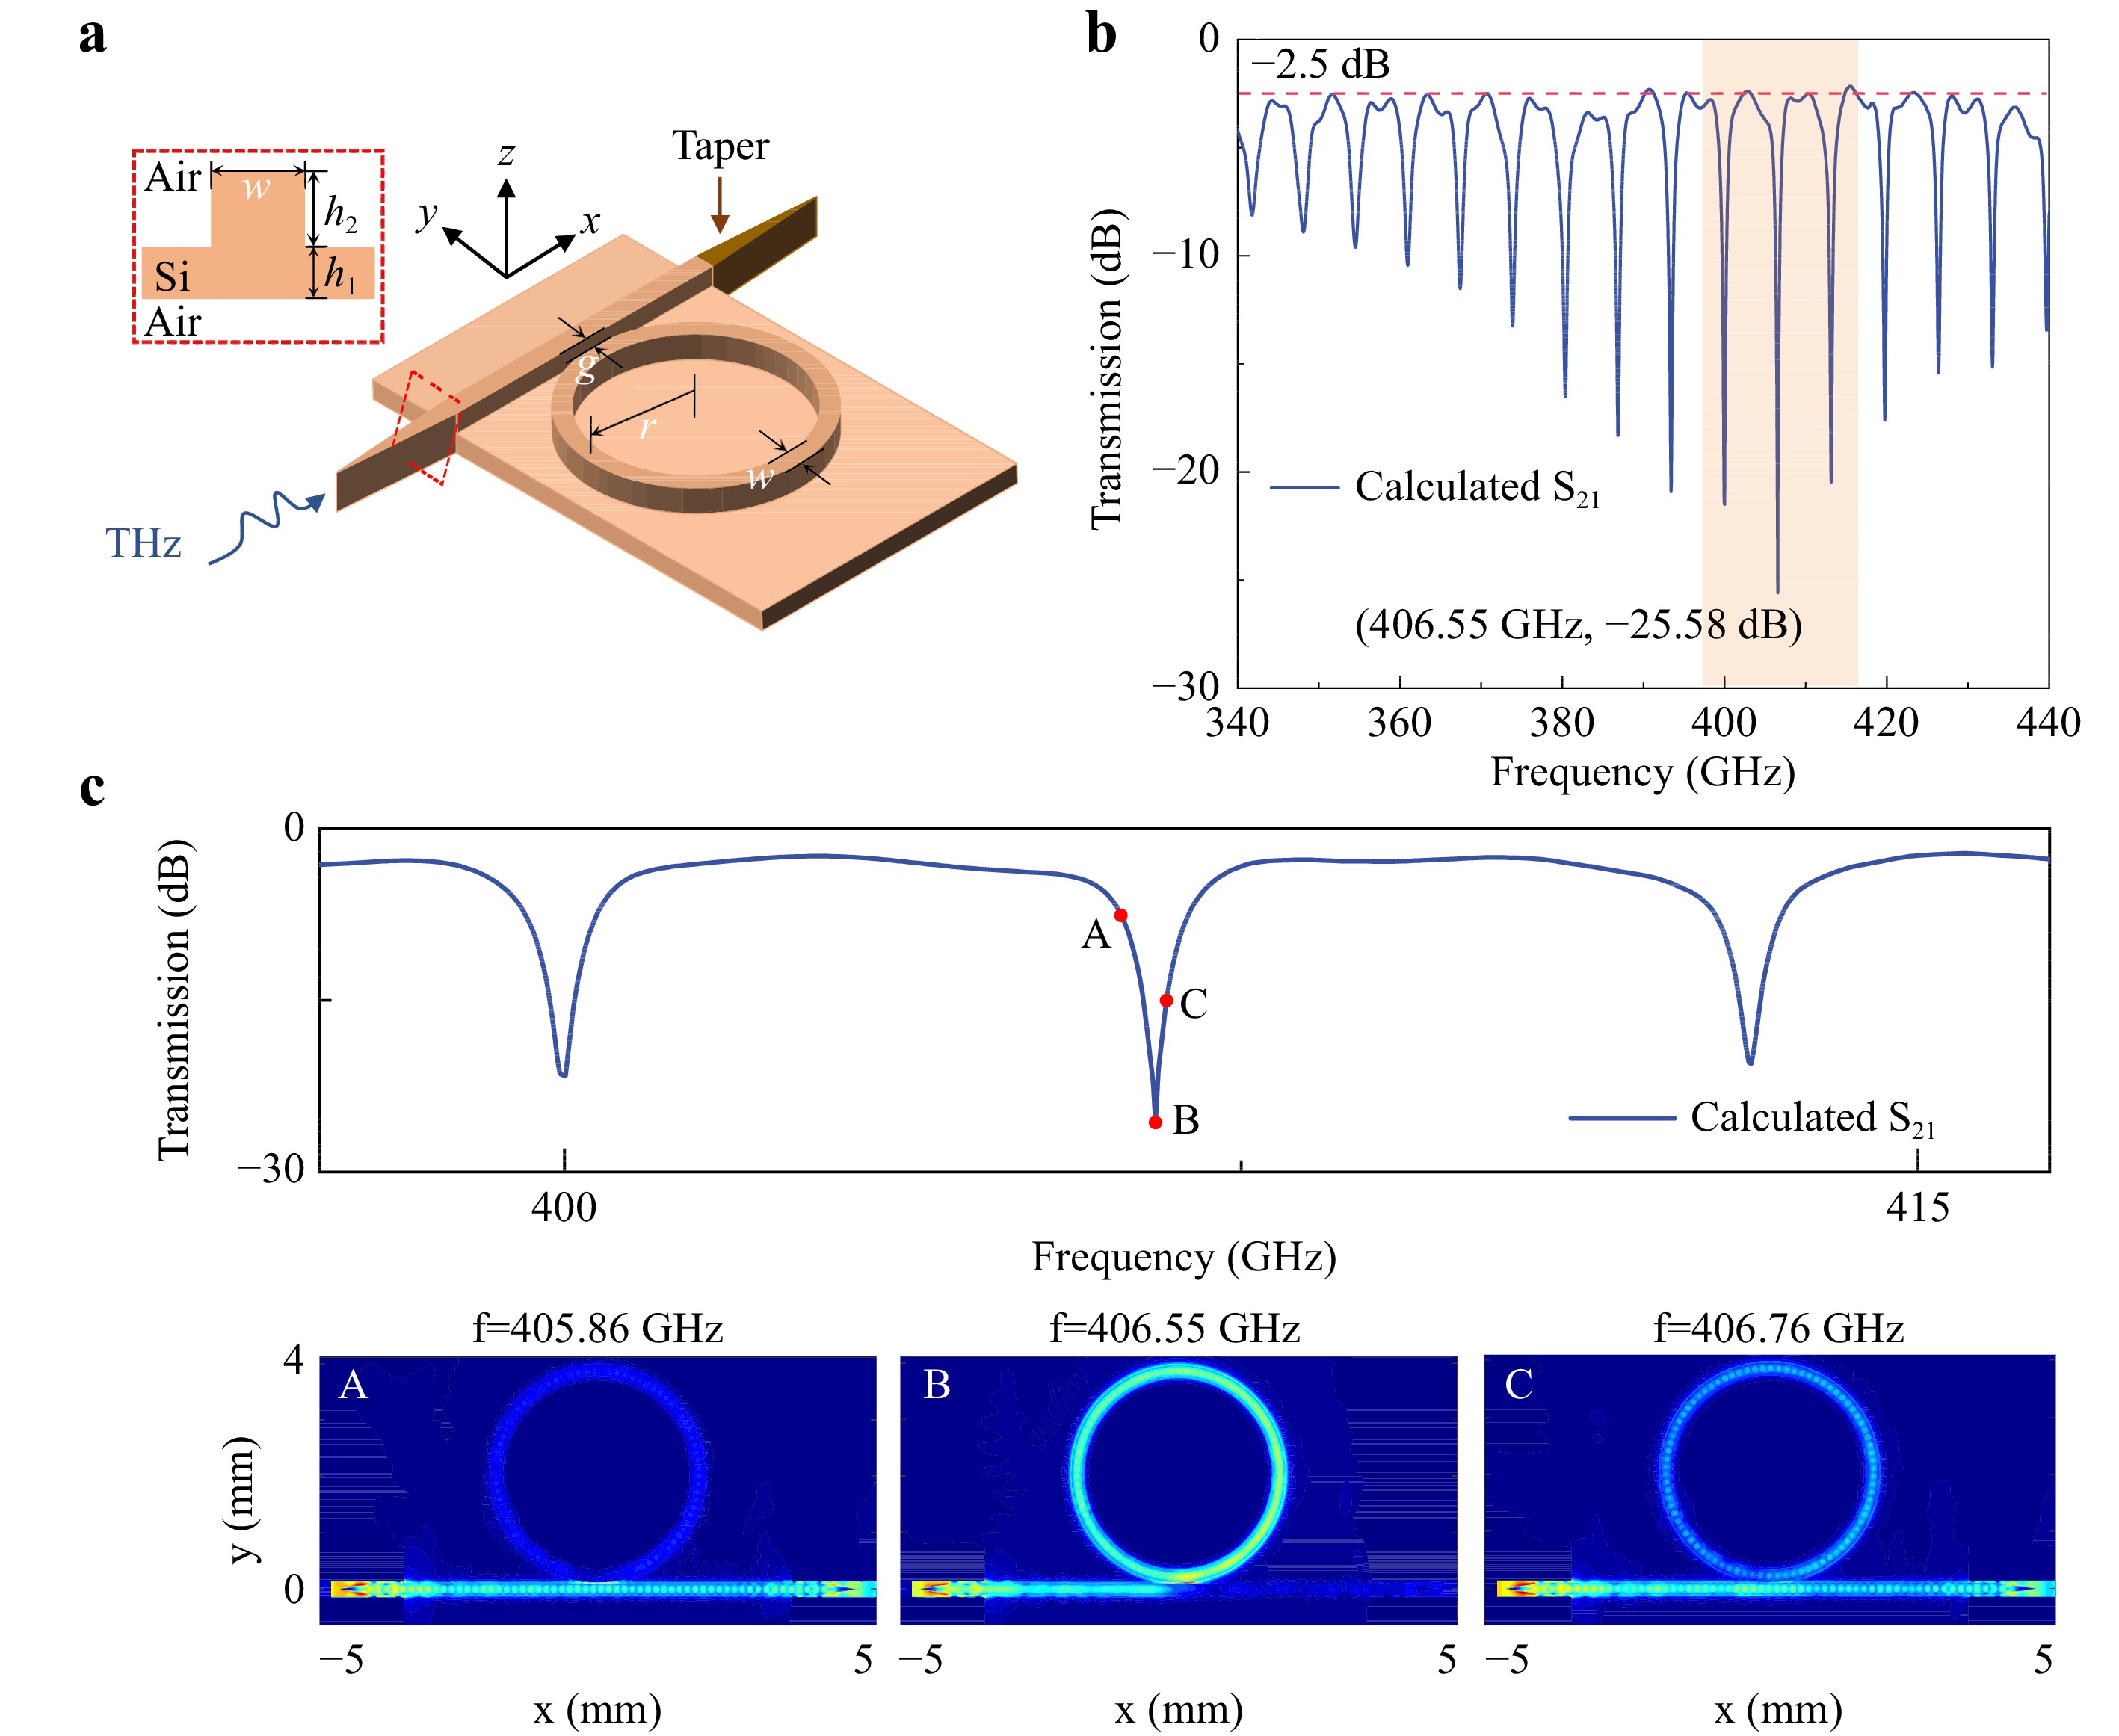
Fig. 2 Schematic of the designed differentiator based on a microring waveguide resonator. a Schematic of the differentiator. The red dashed box in the upper left corner indicates a ridge waveguide cross-section. b Calculated transmission amplitude response of the designed waveguide-coupled microring resonator. c Electric field intensity distributions of the microring resonator cross-section at frequencies of 406.31 GHz, 406.55 GHz, and 406.76 GHz, showing the electric field intensity in the X-Y plane at the same height in the Z-direction.
To reduce coupling losses when energy entered the dielectric waveguide, a tapered structure was designed on the same silicon chip at the input/output. The dimensions of the taper were constrained by the size of the straight waveguide, wherein the height and width of one end were fixed, while achieving a gradient on the width (w) at the other end, resulting in a tapered angle. The taper angle was set to 9.5° to ensure the minimal port reflectance and maximum coupling efficiency (Supplement Note 3). The THz signal was coupled into or out of the standard WR2.2 rectangular metal waveguide using a tapered Si waveguide, which further reduced insertion loss.
The electric field distribution in the waveguide was computed to investigate the resonant characteristics of the designed differentiator. Fig. 2b shows the calculated transmission (S21) characteristics of the differentiator. The results indicate that the tapered waveguide chip theoretically behaves as a resonant cavity and exhibits resonance phenomena within 340–440 GHz, with a free spectral range (FSR) of approximately 6 GHz. Based on the resonance curve, the device exhibited a minimum insertion loss of 2.5 dB. At 406.55 GHz, the resonance peak reaches its maximum depth, corresponding to the critical coupling of the microring. In this state, almost all of the energy enters the microring waveguide, resulting in resonance with an extinction ratio of 25.58 dB.
To gain further insight into the resonance behaviour and coupling efficiency of the waveguide-coupled microring resonator, the electric field intensity distribution across the microring resonator cross section at frequencies close to 406.55 GHz was demonstrated (Fig. 2cA–cC). At 405.86 GHz, most of the energy was not coupled into the ring waveguide, resulting in the absence of resonance and direct propagation through the straight waveguide. Conversely, at 406.55 GHz, nearly all the energy was coupled to the ring waveguide, which generates a strong resonant response. At 406.76 GHz, a portion of the energy was coupled to the ring waveguide, resulting in resonance, whereas the remaining energy was directed through the straight waveguide. Furthermore, observations from Fig. 2cA–cC revealed the efficient coupling of energy through the WR2.2 rectangular metal waveguide into the dielectric waveguide with the incorporated taper and subsequent transmission into the microring waveguide chip. The integration of the taper with a rectangular metal waveguide ensured the effective transmission of THz signals while reducing the coupling and transmission losses, as demonstrated by the low insertion loss of 2.5 dB obtained from calculations.
-
The microring resonator waveguide chip was fabricated using the deep Si etching process (see “Methods”). A standard rectangular metal waveguide enclosure was designed to package the chip. The waveguide chip was assembled and packaged within a standard WR2.2 waveguide module, which effectively reduced mode splitting caused by external perturbations entering the microring resonator. Fig. 3a presents a top-view photograph of the packaged chip, where the green dashed box shows the amplification details of the tapered structure, while the red dashed box contains the amplification details of the coupling region between the straight and ring waveguides.
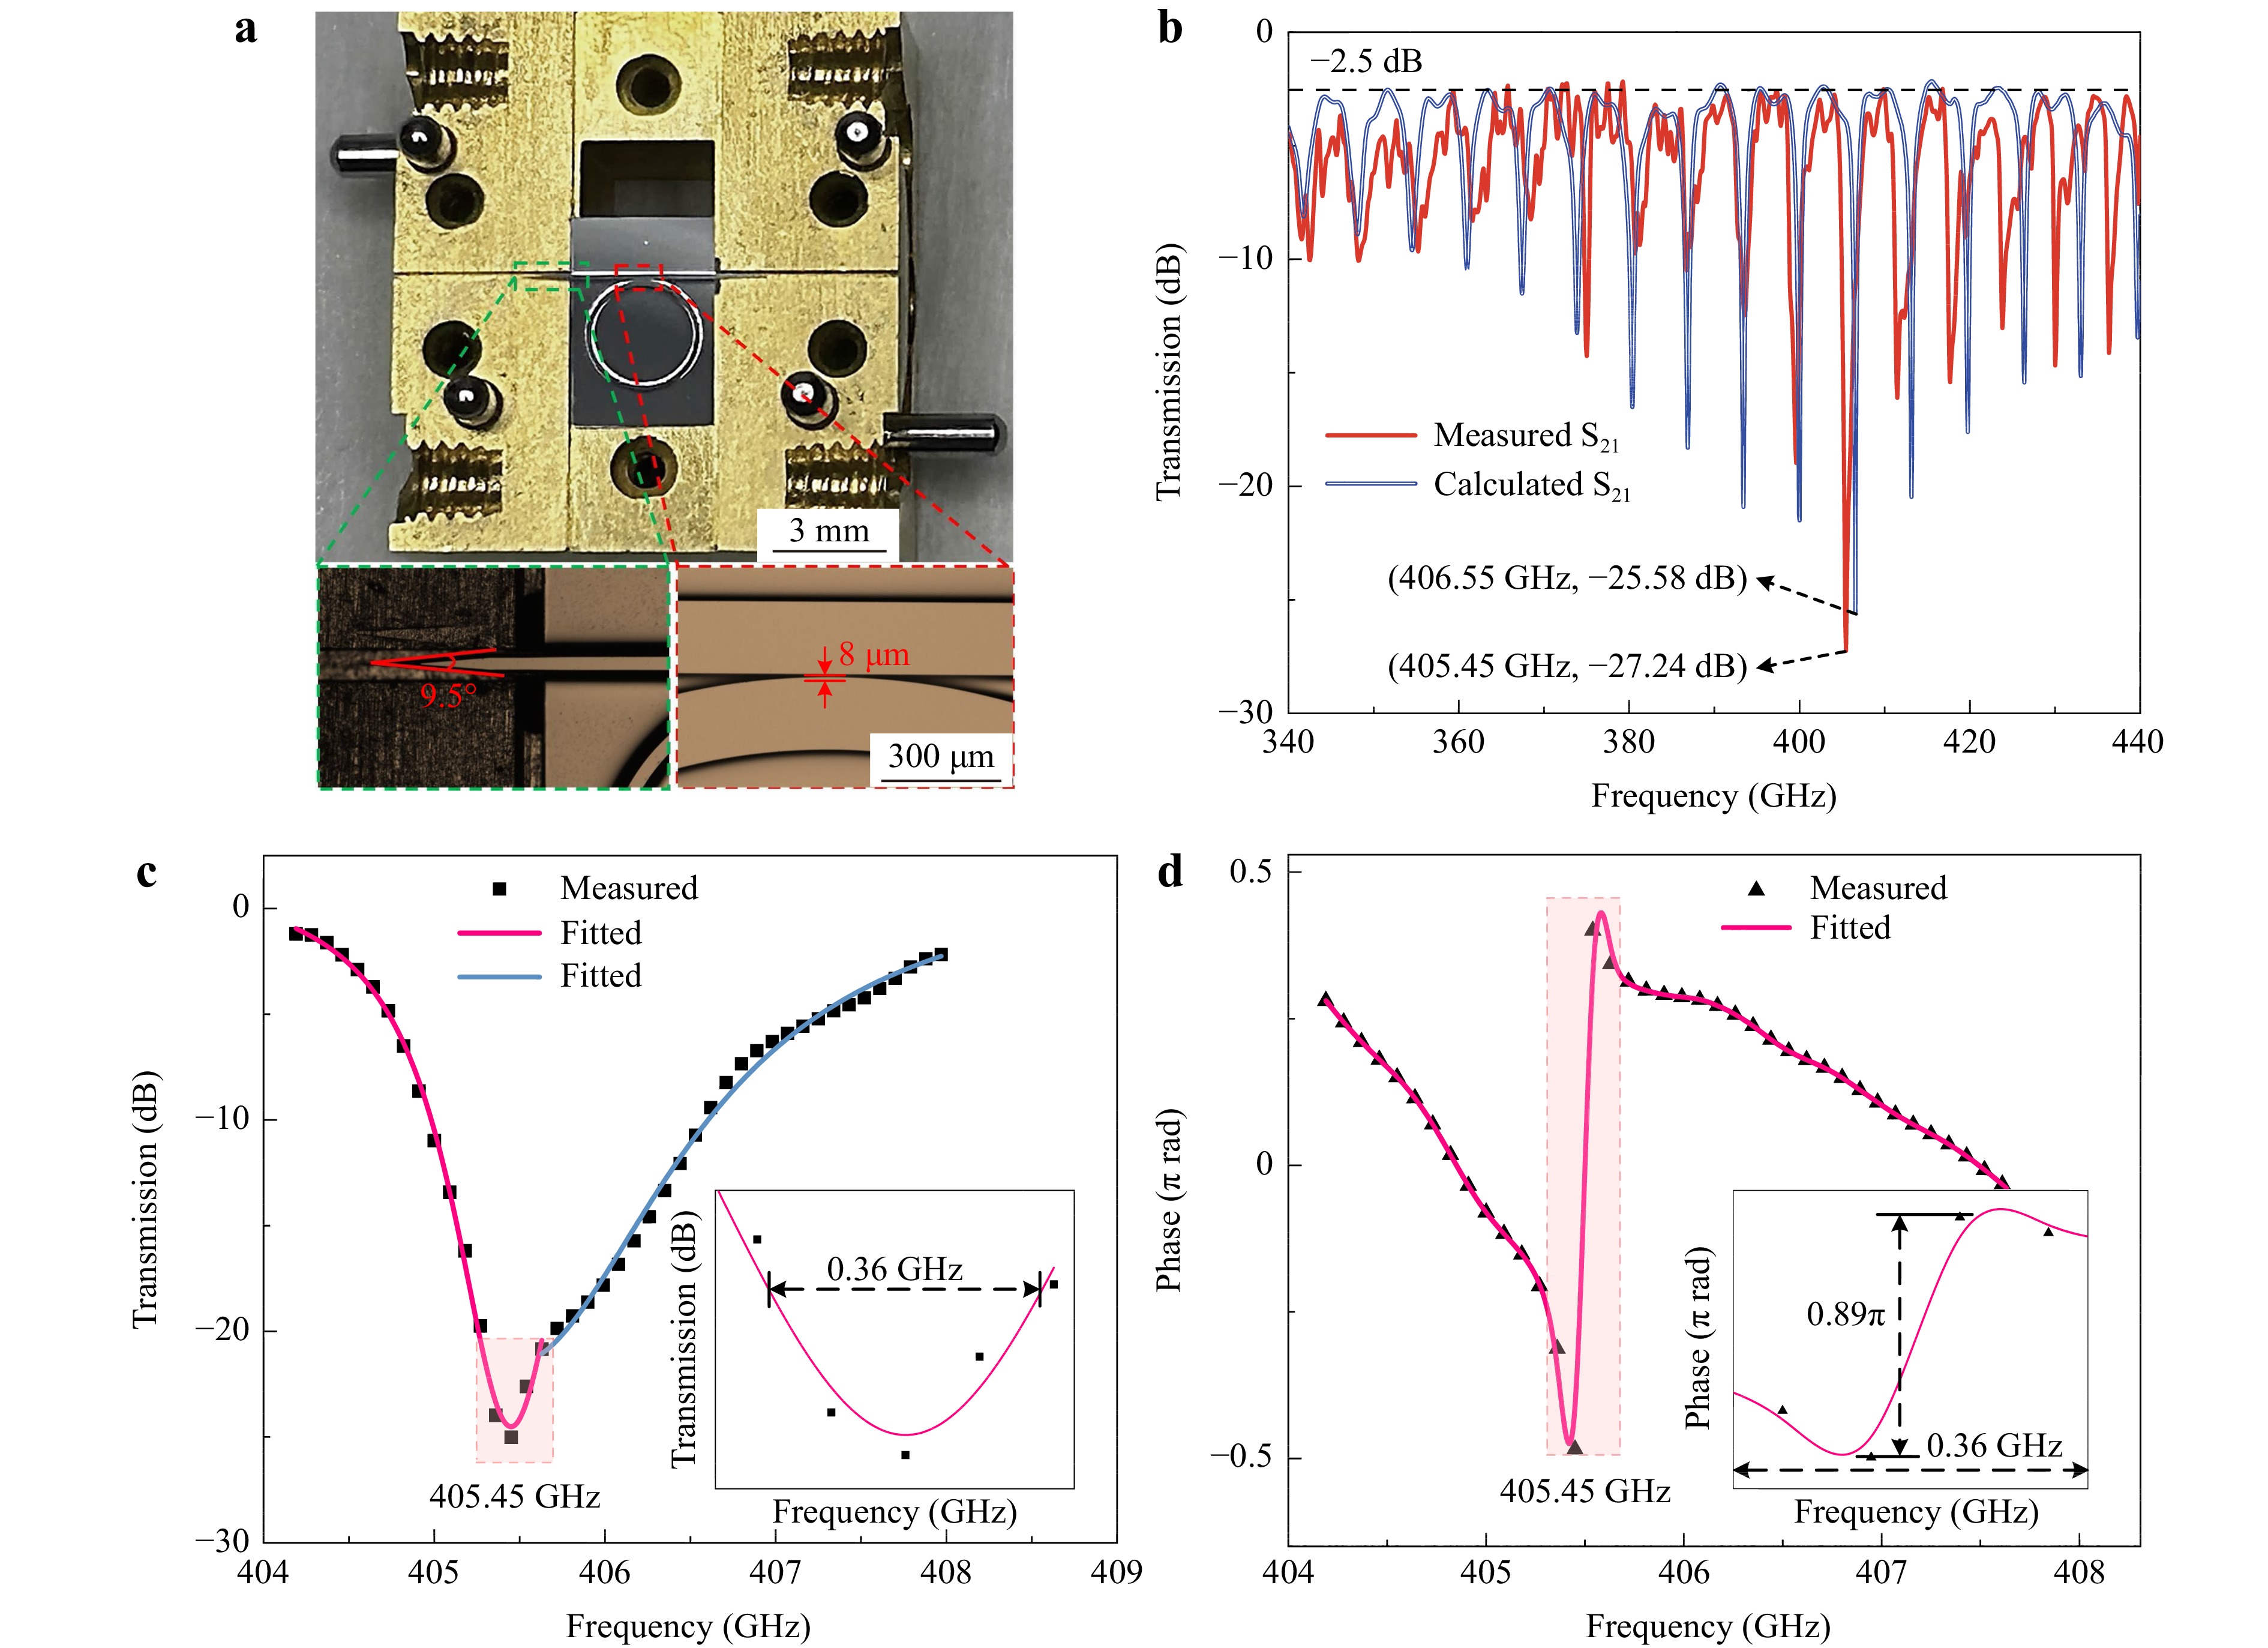
Fig. 3 Transmission characteristics of the differentiator chip. a Top-view photograph of the packaged chip. b Comparison of the measured and simulated transmission amplitude-frequency curves, wherein the blue and red lines represent the simulation and experimental results, respectively. c,d Measured amplitude-frequency and phase-frequency responses corresponding to the resonance peak at the critical coupling point. The 3 dB bandwidth of the resonance peak occurs at 2.5 GHz. The black dashed line indicates phase jump and linear change. The image in the bottom right corner shows an enlarged view of the phase-frequency curve in the shaded region, with a frequency span of 0.36 GHz.
To characterise the transmission of the differentiator chip, a network analyser with a standard waveguide flange (WR2.2) was used to measure the amplitude and phase spectra (S21) during signal transmission by the device. Fig. 3b shows the measured amplitude spectrum (red line) of S21 compared to the simulated results (blue line). The tested resonant frequencies around the critical coupling resonance point are consistent with the simulated results. The measured critical coupling frequency is 405.45 GHz, with an extinction ratio of 27 dB, an FSR of approximately 5.5 GHz, and a quality factor (Q) of approximately 355. These values suggest that the resonance peak is consistent with the Lorentzian fit. The insertion loss of the waveguide chip was 2.5 dB, which was consistent with the simulation results and significantly lower than the losses of 6–10 dB reported in the literature15. Notably, the measured transmission exhibited fluctuations and frequency deviations, which may originate from dimensional variations during fabrication, such as etching depth discrepancies or non-smooth waveguide walls. These can lead to inaccuracies in the coupling distances and result in differences between the measured and simulated results. Fig. 3c shows the amplitude spectrum of the measured resonance peak at the critical coupling point (405.45 GHz), as indicated by the square black dots. The overall resonance peak deviates from the standard Lorentzian shape and lacks strict symmetry with respect to the centre frequency. By segmenting the measured data and fitting them by Lorentzian functions with different function parameters, the red and blue solid lines achieve impressive fitting accuracies of 99%. The magnified amplitude spectrum near the resonance point (shown in the bottom right corner) reveals a region around the centre frequency of approximately 0.36 GHz, which exhibits central symmetry and satisfies the requirements of the amplitude spectrum of the ideal first-order time-domain differentiator. In Fig. 3d, the phase spectrum of the measured resonance peak at the critical coupling frequency is shown by triangular black dots. The red curve which is obtained by fitting the data points of the phase-frequency response with a function, achieves an accuracy of 98%. An ideal first-order time-domain differentiator necessitates a phase jump at the centre frequency and a linear phase variation around the jump point. The bottom right corner of Fig. 3d shows an enlarged view of the region highlighted in red, representing the portion of the fitted phase-frequency response curve that is consistent with this description. The frequency domain width of this section is approximately 0.36 GHz, which is consistent with the symmetric portion in the measured amplitude-frequency response. The differentiator had an operational bandwidth of 0.36 GHz and performed temporal differentiation on the input signals with a maximum bandwidth of 0.36 GHz. Notably, the signal processing speed in this study surpassed those in previous studies by a factor of at least seven15. These results emphasise the significance of the all-silicon microring resonator chip as an excellent platform for terahertz differentiation.
-
Fig. 4 shows the experimental setup used to confirm the differential properties of the microring resonator waveguide chip. Various waveform signals were generated by applying a combination of an arbitrary waveform generator (AWG), radio frequency and pulse signal generator (RF and PSG), and a frequency multiplier (SGX Module). The AWG triggered the external modulation modes of the RF and PSG, thereby producing a modulated continuous wave. For example, the AWG was configured to generate a periodic square wave with a frequency of 10 kHz. The continuous carrier wave generated by the RF and PSG operated at a power of 6.9 dBm and frequency of 11.2625 GHz. Subsequently, the periodic square wave was modulated onto the carrier wave. After passing through the frequency multiplier module with a multiplication factor of 36, the frequency of the carrier wave was set to 405.45 GHz, which corresponds to the critical coupling frequency of the device. The modulated electromagnetic wave signal was coupled to the straight waveguide of the device, and the final output signals were received by a detector and observed using an oscilloscope.
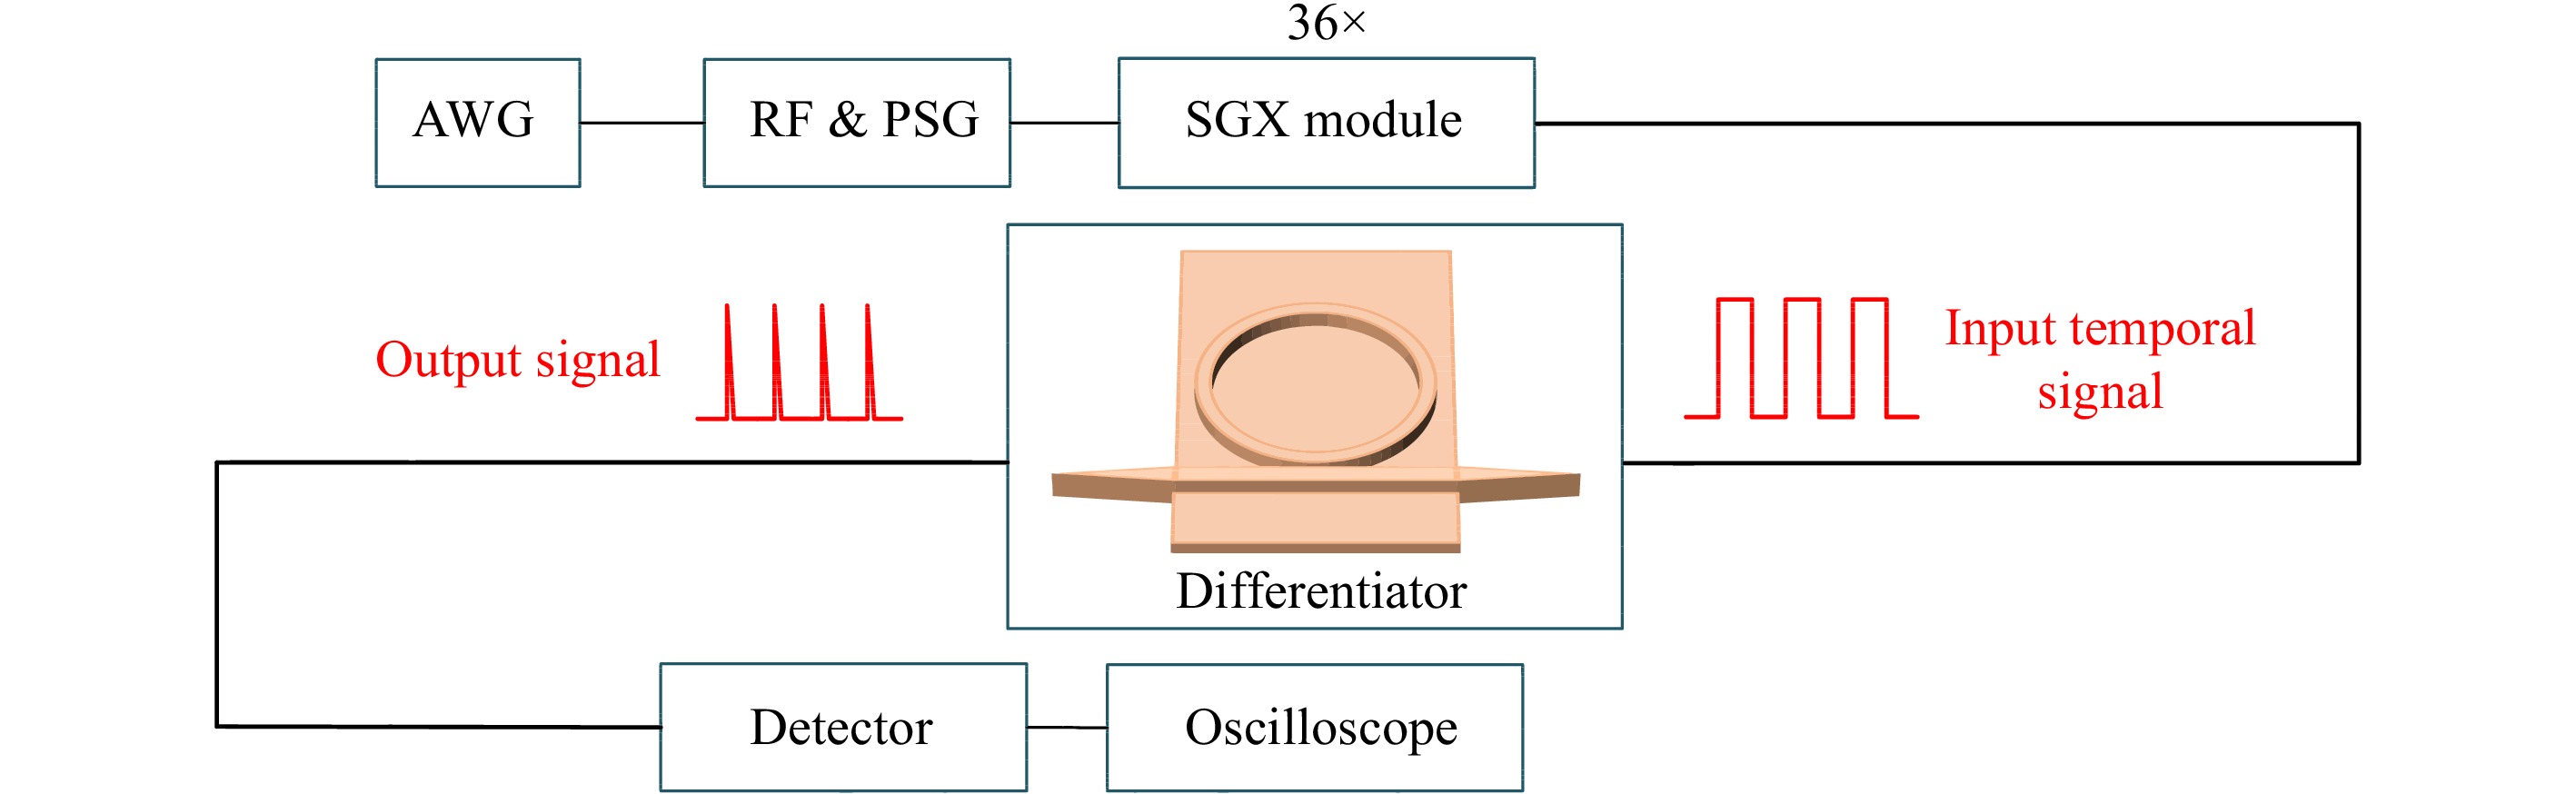
Fig. 4 Schematic of the experimental setup for testing the temporal differentiation characteristics. AWG: arbitrary waveform generator; RF and PSG: radio frequency source and analog signal generator; SGX module: signal generator frequency multiplier module.
-
To determine whether the device can differentiate temporal THz signals, the AWG was set to output Gaussian pulse waveforms at a frequency of 100 kHz. Fig. 5a shows the normalised voltage amplitude-frequency plot of the output temporal waveform obtained when the device was subjected to a Gaussian pulse input. The red dashed line indicates the normalised amplitude of the waveform when the operating frequency of the carrier signal was 405.45 GHz. The orange solid and blue lines represent the calculated mathematically differentiated waveform obtained from the input Gaussian waveform and the waveform observed at the output of the device using an oscilloscope, respectively. As expected, the measured results are consistent with the differentiated calculations. However, the amplitude of the differentiated result corresponding to the falling edge of the Gaussian waveform was lower than that of the rising edge. This phenomenon corresponds to the measured transmission performance of the device. Considering fabrication errors, the phase shift at the critical coupling point deviates from π (0.89π in this case), resulting in a fractional-order differentiation of approximately 0.89. The orange curve depicts the calculated results of performing a 0.89-order differentiation on a 100 kHz Gaussian pulse waveform. Fig. 5b shows the calculated results of performing a 0.89-order differentiation on a 100 kHz square wave. The red dashed and blue solid lines represent the square waveform and the calculated results of its differentiation. Additionally, the results indicated that, although the input signal was not directly differentiated by a first-order operation, impulse-like signals were produced at the rising and falling edges, similar to the outcome expected from first-order differentiation. Therefore, the waveguide chip possesses the ability to perform THz-domain differentiation and is a promising edge detector capable of detecting abrupt transitions by generating pulses.
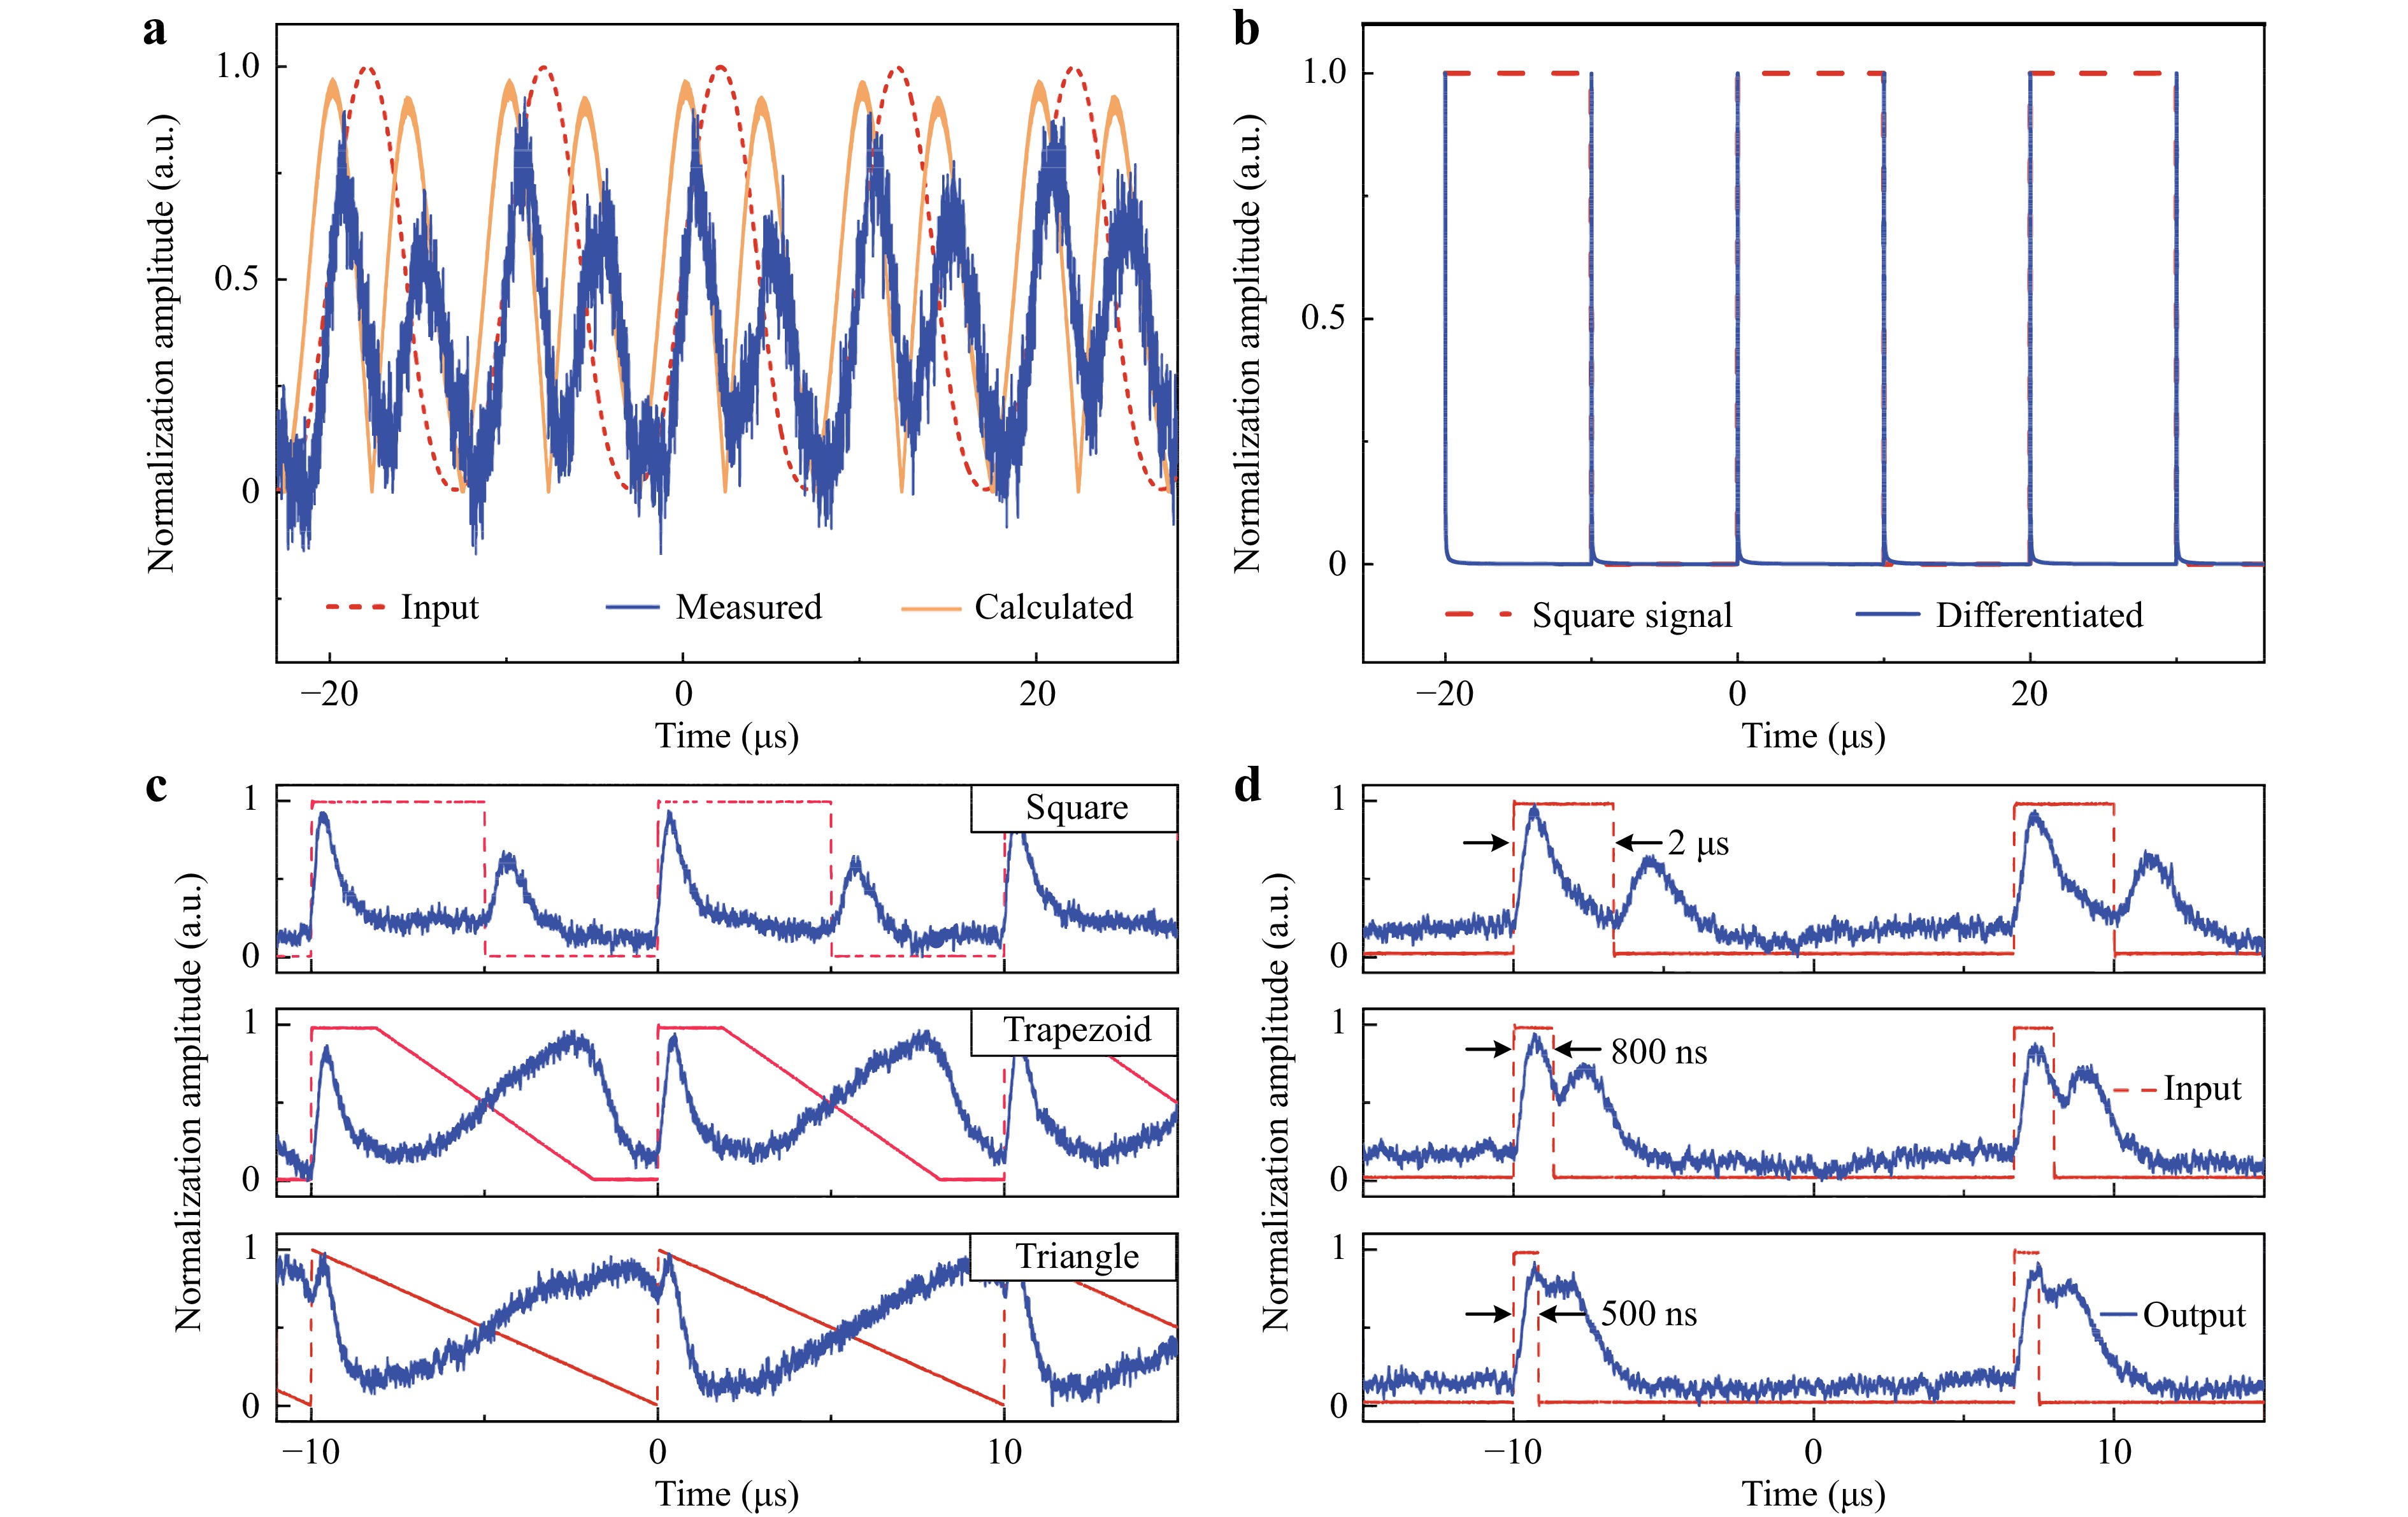
Fig. 5 Performance characterization of the temporal differentiator. a Gaussian pulse with a frequency of 100 kHz and the corresponding differentiation result. b Square wave with a frequency of 100 kHz and 50% duty cycle, and the corresponding differentiation result. c From top to bottom: square wave, trapezoidal pulse, and sawtooth pulse with a frequency of 100 kHz, along with the corresponding differentiation results. The red and blue waveforms represent the input signal and output of the device, respectively. d From top to bottom: input square pulses with a pulse width of 2 μs, 800 ns, and 500 ns, respectively, along with the corresponding differentiation results. The red and blue waveforms represent the input signal and output observed on the oscilloscope, respectively.
-
To further confirm the differential performance and potential edge detection capabilities of the device, experiments were conducted on waveforms with step-like edges, namely square, trapezoidal, and sawtooth pulses (Fig. 5c, from top to bottom). The frequency of the signal generator was set to 100 kHz, while the operating frequency of the carrier signal remained at 405.45 GHz. The red waveform and blue line represent the voltage amplitude of the input waveform and waveform output to the oscilloscope after passing through the differentiator chip, respectively. As expected, the device successfully differentiated the electric-field envelope of the input signal and generated regular impulse signals at the corresponding step edges. The energy efficiency of the differentiator was 0.7%, which was measured based on the ratio of the average pulse power between the resonator output and input signal.
-
Fig. 5d shows square pulses with different time-domain widths and their corresponding differential results, which reveal the high-speed characteristics of the differentiator. The device exhibits excellent response when subjected to square pulses with a width of 2 μs. When the input pulse width is reduced to 800 ns, the measured pulse depth slightly decreases owing to the bandwidth limitation of the detector used in the experiment, which has an upper bandwidth limit of 250 kHz although they are easily distinguishable from each other. However, when the input pulse width is further reduced to 500 ns, two pulses are still observable at the output, despite the significant interference between adjacent pulses owing to the bandwidth limitation of the detector. Consequently, the peak values of the pulses are less distinct. The experiments demonstrated that the manufactured differentiator can process input signals at a rate of approximately 1.25 MHz (1/800 ns). Future studies should focus on improving the measured bandwidth performance of devices by refining the experimental setup to approach the theoretical limit of 0.36 GHz. Overall, the fabricated all-silicon THz differentiator effectively processed high-speed input signals and generated regular pulses through its differential effects to detect step edges in the signal. Thus, this device serves as a model for signal processing in THz communication systems.
-
To demonstrate the signal processing applications of the differentiator in THz communication systems, pseudorandom binary sequence (PRBS) signals with data rates of 10 kbps, 50 kbps, and 100 kbps were fed into the device. The output results in Fig. 6a suggest that at each rising and falling edge of the PRBS signal, the differentiator yields regular pulses as outputs. These pulses serve as indicators for detecting step-type edges in the signal and have potential applications in THz radar systems, such as pulse radar transmitter systems. The pulse repetition interval (PRI) is an important parameter in pulse radars and is the focus of interception and measurement in radar electronic warfare. A, pulse radars typically utilise methods involving non-fixed PRIs such as sliding and jittering PRI to make the pulse repetition interval unpredictable, which enhance the anti-reconnaissance and anti-interference potential of devices. Pulses with pseudo-random intervals generated based on the PRBS code have variable PRIs, which can potentially enhance the anti-parameter ambiguity and anti-interference abilities of radar systems. Furthermore, the advantages of silicon-based differentiators make them highly suitable for use as transmitters in THz pulse radars. The high integration ability of Si-based differentiators may be used to generate and control THz pulses in a compact space. Considering the adjustability of silicon-based integrated differentiators, these devices are suitable for radar systems in various fields, including range finding, speed measurement, military, aerospace, and meteorology. Regarding the application prospects of this device (Fig. 6b), PRBS pulses were generated by the all-silicon THz differentiator and applied to the transmitter of the THz pulse radar. The excellent autocorrelation and anti-interference performance of the tightly packaged silicon-based waveguides further enhanced the anti-interference ability of the transmitter, which facilitated reliable target detection in complex environments for the pulsed radar system. In addition, impulses with random intervals can serve as noise sources, particularly in certain analog and digital systems. These random pulses can serve as a random signal source for testing and evaluating the anti-noise performance of the system.
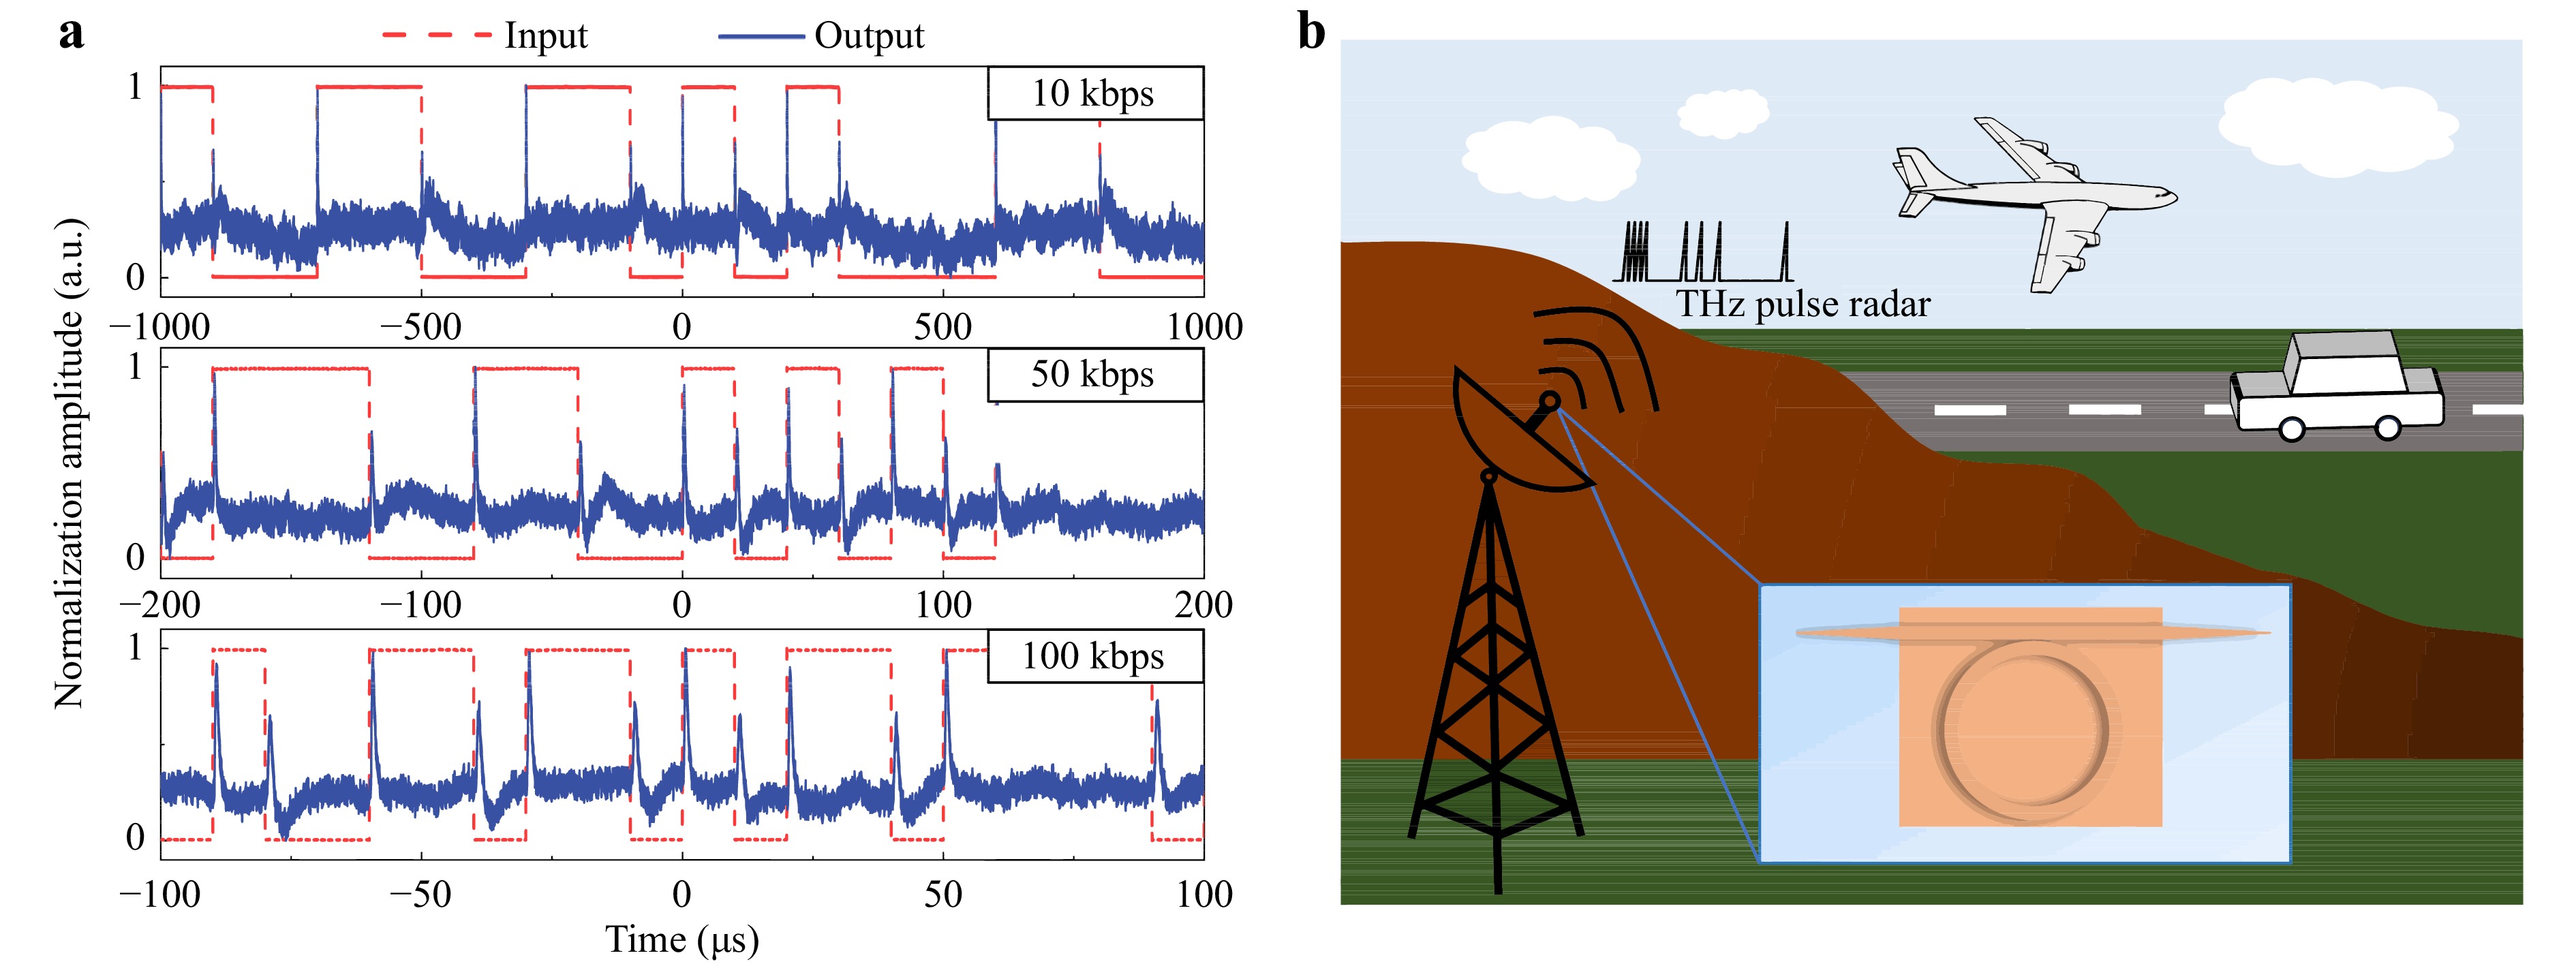
Fig. 6 Signal processing ability of the differentiator. a From top to bottom: pseudorandom binary sequence waveforms with data rates of 10 kbps, 50 kbps, and 100 kbps along with their differentiation results. The red and blue waveforms represent the input signal and output waveform from the oscilloscope, respectively. b Application scenario of the proposed differentiator in a pulsed radar for range finding and speed measurement.
-
In summary, we successfully developed a THz differentiator on a Si chip. The calculated and measured resonant characteristics of the devices were thoroughly analysed, and the results exhibited excellent agreement. The tapers at both ends of the straight waveguide ensured that the packaged differentiator module achieved a low insertion loss of 2.5 dB. In addition, the experimental results suggested that the differentiator could handle various periodic waveforms. The differentiator was operated at a bandwidth of 0.36 GHz and an energy efficiency of 0.7%. The excellent performance metrics of the differentiator suggest that it can be utilised in various applications. The results provide a foundation for the further exploration of THz integrated circuits and signal-processing devices.
-
The manufacturing process of the differentiator chips primarily comprises the following steps. First, a 4-inch commercial high resistance silicon wafer (ρ >10 kΩ·cm) with a thickness of 350 μm was thinned to 200 μm. In the second step, the wafer was photolithographed and deeply etched using Microelectromechanical systems (MEMS) technology. The photoresist was spin coated on the surface of the wafer, and the microring resonator waveguide pattern was exposed by the machine (SUSS MicroTec, MA6). Subsequently, deep silicon etching was performed by an inductively coupled plasma (ICP) etching system, with an etching depth of 140 μm. Third, photolithography and deep silicon etching were performed on the back of the sample. The etched area acted as a cutting groove in the die of the chip, which was used to separate the device from the wafer substrate. The back of the silicon sample was coated with a photoresist, and the etched area was exposed along the contour of the device using backside lithography. Deep silicon etching was performed using the same ICP etching system, with an etching depth of 60 μm. Finally, the differentiator chip detached from the silicon chip.
-
1. S-parameter measurement: The S-parameters of the packaged differentiator were measured using a THz network analyser. The THz Vector Network Analyzer (VNA) consisted of a network analyser and a set of 325–500 GHz frequency extenders. The THz wave was output from the WR2.2 hollow waveguide and efficiently coupled to the differentiator chip using the WR2.2 waveguide package.
2. Time-domain waveform measurement: The THz signal generated by the multiplier was modulated by signals with rectangular or Gaussian wave shapes and then directly connected to the differentiator chip through the WR2.2 standard waveguide. The output differential THz signal was measured using a direct detector from the company of Virginia Diodes (VDI), and the response voltage of the detector was observed using an oscilloscope (Tektronix MSO64B).
-
Electromagnetic simulation software (Ansys Lumerical FDTD) was used to calculate the transmission and insertion losses of the differentiator. The electric field profiles of the microring waveguide resonator at different frequencies were also calculated. The default silicon material provided in the software material library was used for the model.
-
We acknowledge support from the Innovation Program for Quantum Science and Technology (No. 2021ZD0303401), Fundamental Research Funds for the Central Universities, National Natural Science Foundation of China (Grant Nos. 62271245, 62227820, 62271242, 62071214, 62004093, 12033002, 62035014, 62288101, and 11227904), National Key R&D Program of China (Grant No. 2018YFB1801504), Excellent Youth Natural Science Foundation of Jiangsu Province (Grant No. BK20200060), Priority Academic Program Development of Jiangsu Higher Education Institutions, Key Lab of Optoelectronic Devices and Systems with Extreme Performance, and Jiangsu Key Laboratory of Advanced Techniques for Manipulating Electromagnetic Waves.
All-silicon low-loss THz temporal differentiator based on microring waveguide resonator platform
- Yunjie Rui1,
- Shuyu Zhou1,
-
Xuecou Tu1, 2, *, ,
 ,
, - Xu Yan1,
- Bingnan Yan1,
- Chen Zhang1,
- Ziyao Ye1,
- Huilin Zhang1,
- Jingya Xie4,
- Qing-Yuan Zhao1, 3,
- La-Bao Zhang1, 2,
- Xiao-Qing Jia1, 2,
- Huabing Wang1, 3,
- Lin Kang1, 2,
- Jian Chen1, 3,
- Peiheng Wu1, 2
- Light: Advanced Manufacturing 5, Article number: (2024)
- Received: 22 September 2023
- Revised: 12 March 2024
- Accepted: 14 March 2024 Published online: 24 April 2024
doi: https://doi.org/10.37188/lam.2024.017
Abstract: Microring resonators have been widely used in passive optical devices such as wavelength division multiplexers, differentiators, and integrators. Research on terahertz (THz) components has been accelerated by these photonics technologies. Compact and integrated time-domain differentiators that enable low-loss, high-speed THz signal processing are necessary for THz applications. In this study, an on-chip THz temporal differentiator based on all-silicon photonic technology was developed. This device primarily consisted of a microring waveguide resonator and was packaged with standard waveguide compatibility. It performed time-domain differentiation on input signals at a frequency of 405.45 GHz with an insertion loss of 2.5 dB and a working bandwidth of 0.36 GHz. Various periodic waveforms could be handled by this differentiator. This device could work as an edge detector, which detected step-like edges in high-speed input signals through differential effects. This development holds significant promise for future THz data processing technologies and THz communication systems.
Research Summary
Terahertz differentiator:an low loss on-chip THz signal processing module
A terahertz (THz) time-domain differentiator, which is a crucial element in the future THz signal processing, finding significant applications in areas such as THz pulse generation, pulse shaping, and differential equation solving. Microring resonators, which have gained prominence owing to their small size and strong signal processing abilities, have been extensively explored in various optical frequency applications. Xuecou Tu and his team from Nanjing University in China have made a breakthrough in on-chip THz device on a microring waveguide resonator platform. The all-silicon, low-loss and well packaged THz differentiator chip performed as an edge detector, which detected step-like edges in high-speed input signals through the differential effects. This development holds significant promise for future THz data processing technologies and THz microsystems, such as THz radar, 6G networks and so on.
Rights and permissions
Open Access This article is licensed under a Creative Commons Attribution 4.0 International License, which permits use, sharing, adaptation, distribution and reproduction in any medium or format, as long as you give appropriate credit to the original author(s) and the source, provide a link to the Creative Commons license, and indicate if changes were made. The images or other third party material in this article are included in the article′s Creative Commons license, unless indicated otherwise in a credit line to the material. If material is not included in the article′s Creative Commons license and your intended use is not permitted by statutory regulation or exceeds the permitted use, you will need to obtain permission directly from the copyright holder. To view a copy of this license, visit http://creativecommons.org/licenses/by/4.0/.

 DownLoad: