-
The primary symptoms of brain tumors are non-specific, including headaches, paresthesia, dementia, seizures, personality disorders, and sometimes gait disturbances, which often hinder early diagnosis1,2. Primary brain neoplasms may originate from brain parenchymal cells, meninges, cranial nerves, the hypophysial gland, or the pineal gland, thus possessing a vast diversity of origins with overlapping radiological features. This necessitates pathological assessment of the tissues obtained from surgery. A significant challenge arises with tumors in eloquent areas where open surgery is not feasible, leading to an increased risk of misdiagnosis due to tumor heterogeneity in stereotactic biopsies3−8. The biopsy may not sample the most aggressive part of the tumor, and immunohistochemistry (IHC) results may be indefinite or inapplicable due to the limited tissue available9−11. Therefore, developing label-free imaging techniques that can be translated into clinical assessments as intra-operative probes or methods to differentiate tumor specimens based on their cellular origin parameters could significantly improve diagnostic accuracy. Polarimetric imaging has enhanced the pathological investigation of tumoral tissues. Numerous studies have explored the potential of polarimetric Mueller matrix microscopy to distinguish cancerous and non-cancerous tissues or cancerous tissues of different pathological origins12−19. The advent of multispectral polarimetric imaging has further enhanced the precision of diagnosing tumor residues and detecting cancer regression after neoadjuvant chemotherapy20, 21. Polarimetric imaging, as a label-free technique, addresses the drawbacks of conventional pathological assessments, such as the need for sample fixation, the lack of localizing potential due to its ex vivo nature, and the background results that can be indistinguishable from true positive patterns. Consequently, polarimetric imaging has prompted a ground-breaking change in the context of cancer diagnosis, namely, label-free and fast procedures, accurate and easy-to-interpret results, lack of operator dependency, in vivo applicability, and reproducibility.
Polarimetric imaging plays a crucial role in the analysis of biological tissue samples, revealing valuable details about their optical characteristics18, 22, 23. The Mueller matrix, a key component in polarimetric analysis, is composed of 16 elements that encapsulate the polarizing effects of the sample on light24−26. Although the Mueller matrix contains rich structural information about materials, in most samples, all polarization effects occur together and in no particular order, resulting in each polarization phenomenon being covertly stored within the elements of the Mueller matrix. Therefore, often a set of different elements collectively represents a polarization characteristic in a sample, and a single element alone cannot provide complete information. Consequently, direct access to information can be challenging due to the lack of a clear correlation between each element of the matrix and the microstructures of the sample. Hence, the most important challenge after calculating the Mueller matrix is the interpretation and analysis of the recorded information. For this purpose, various decomposition methods have been developed, such as the Lu-Chipman decomposition, Cloude-Pottier decomposition, and others27, 28. Each method reveals different aspects of the sample’s polarization properties, but none can single-handedly provide a comprehensive understanding. Consequently, a holistic approach that combines multiple decomposition methods may be required to achieve a more complete grasp of the polarization information29, 30. Polarimetry is extensively employed with a variety of light sources, including lamps, light-emitting diodes (LEDs), and lasers, offering significant advantages in diverse applications. However, unlike other sources typically used in polarimetric imaging, coherent sources, like lasers, may provide superior contrast and polarization control. Coherent light is instrumental due to its high degree of polarization (DoP), essential for accurately capturing polarization parameters including DoP, degree of linear polarization (DoLP), and degree of circular polarization (DoCP)16, 27, 31, 32. These parameters are critical in distinctly characterizing and differentiating tissue properties, a necessity in applications like biomedical imaging and remote sensing. The utilization of coherent light in biomedical contexts, including studies on brain neoplasms, aligns with safety standards when operated within controlled parameters and exposure limits. On the other hand, incoherent light sources, despite offering noise and speckle-free imagery, often fall short in providing high-quality, high-contrast images of tissues. Moreover, most tissue samples tend to diffuse coherent light, impeding image formation. Consequently, conventional imaging-based methods may not be ideally suited for tissue studies30, 33.
Dynamic laser speckle analysis (DLSA) has emerged as a promising technique, proving its efficacy in both material and life sciences34−37. This method analyzes laser speckle patterns, which are fluctuations in intensity caused by coherent light scattering from a surface or medium, providing detailed information about a sample's dynamic properties38, 39. Since the invention of the laser, the speckle phenomenon has been extensively investigated, with studies focusing on reflections from living objects and transitive samples35, 40. Dynamic speckle, appearing as randomly granular patterns due to coherent light illumination, results from scatterer movement, optical path changes, internal evolution, or combinations of factors. The dynamic activity of speckle patterns is a useful, non-destructive method for studying various activities such as ripening, drying, osmosis, Brownian motion, lipid phase separation, crumpled papers, and pitting phenomena35, 41−45. The statistical characteristics of dynamic speckle have been extensively treated in various studies46−49, with many studies assigning numbers to characterize activity and correlate with measurements of interest39,50−52. Visual methodologies are often favored over numerical approaches in biological samples due to their capability to produce comprehensive two-dimensional (2D) activity maps across the entire field. Prominent visual techniques for extracting data from speckle patterns include Fujii’s method, Generalized Difference (GD), Weighted Generalized Difference, Mean Windowed Difference (MWD), Structural Function, and the Modified Structural Function (MSF), among others. The Fujii technique has been identified as particularly effective for the visual analysis of dynamic speckle data, as supported by recent studies53−56.
In this study, we present a novel approach that synergizes polarimetry and DLSA to leverage the strengths of both methods. This integration could potentially overcome some limitations of current imaging and diagnostic techniques, offering a more robust and comprehensive analysis of tissue samples. Our methodology retains the benefits of using a coherent light source for polarimetry while effectively bypassing its shortcomings by shifting the focus to variations in laser speckle patterns across the recorded images as indicators of tissue polarization properties. By applying a range of statistical post-processing techniques, primarily tailored for DLSA, to the series of polarimetric images, we effectively address the challenges associated with Mueller matrices and conventional decomposition methods in data interpretation. This novel approach has the potential to improve the accuracy and efficiency of diagnosing various medical conditions, particularly in oncology.
-
The proposed polarization-driven DLSA is used to distinguish glioblastoma, the most aggressive subtype of brain neoplasms, from other space-occupying tumoral lesions of the brain, including meningioma, medulloblastoma, subependymomas, and low-grade gliomas. Glioblastoma is characterized by increased microvascular density, necrosis, and high cellular proliferation. In contrast-enhanced T1-weighted magnetic resonance imaging (MRI) data, areas of heterogeneous contrast enhancement with cysts or necrotic niches are present, and in T2/fluid-attenuated inversion recovery (FLAIR) images, extensive vasogenic edema is observed. Meningiomas are tumors originating from the meninges (e.g., dura or arachnoid) surrounding the brain, located extra-axially, with homogeneous contrast enhancement in T1-weighted MRI and may also be surrounded by vasogenic edema. Meningiomas are mostly located at the cerebellopontine angle, making tissue diagnosis difficult. Medulloblastomas are tumors frequently seen in the posterior fossa with prominent contrast enhancement on T1-weighted MRI. Subependymomas are glial tumors originating from ependymal cells of the cerebral ventricles and usually enhance after intravenous (IV) contrast administration in MRI evaluations. Low-grade gliomas are slow-growing tumors originating from glial cells with low malignant potential and a non-contrast enhancing nature in MRI investigations.
We conduct a proof-of-concept experiment to differentiate five different brain neoplasms tested in Hematoxylin and Eosin (H&E)-stained slides: glioblastoma multiforme (GBM), ependymoma, meningioma, medulloblastoma, and low-grade glioma. GBM is a highly aggressive type of brain tumor characterized by rapid growth and a tendency to spread quickly. Ependymomas arise from the ependymal cells lining the ventricles of the brain and the center of the spinal cord. Meningiomas are common brain tumors arising from the meninges, the membranous layers surrounding the brain and spinal cord. Medulloblastomas are highly malignant primary brain tumors originating in the cerebellum, common in children. Low-grade gliomas are slower-growing brain tumors with lower malignant potential. Representative histopathological images of the brain tumors under this study are shown in Fig. 1. These images are standard in the pathology field, providing a clear view of the tissue structures and their pathological characteristics. However, they do not capture the polarization characteristics.
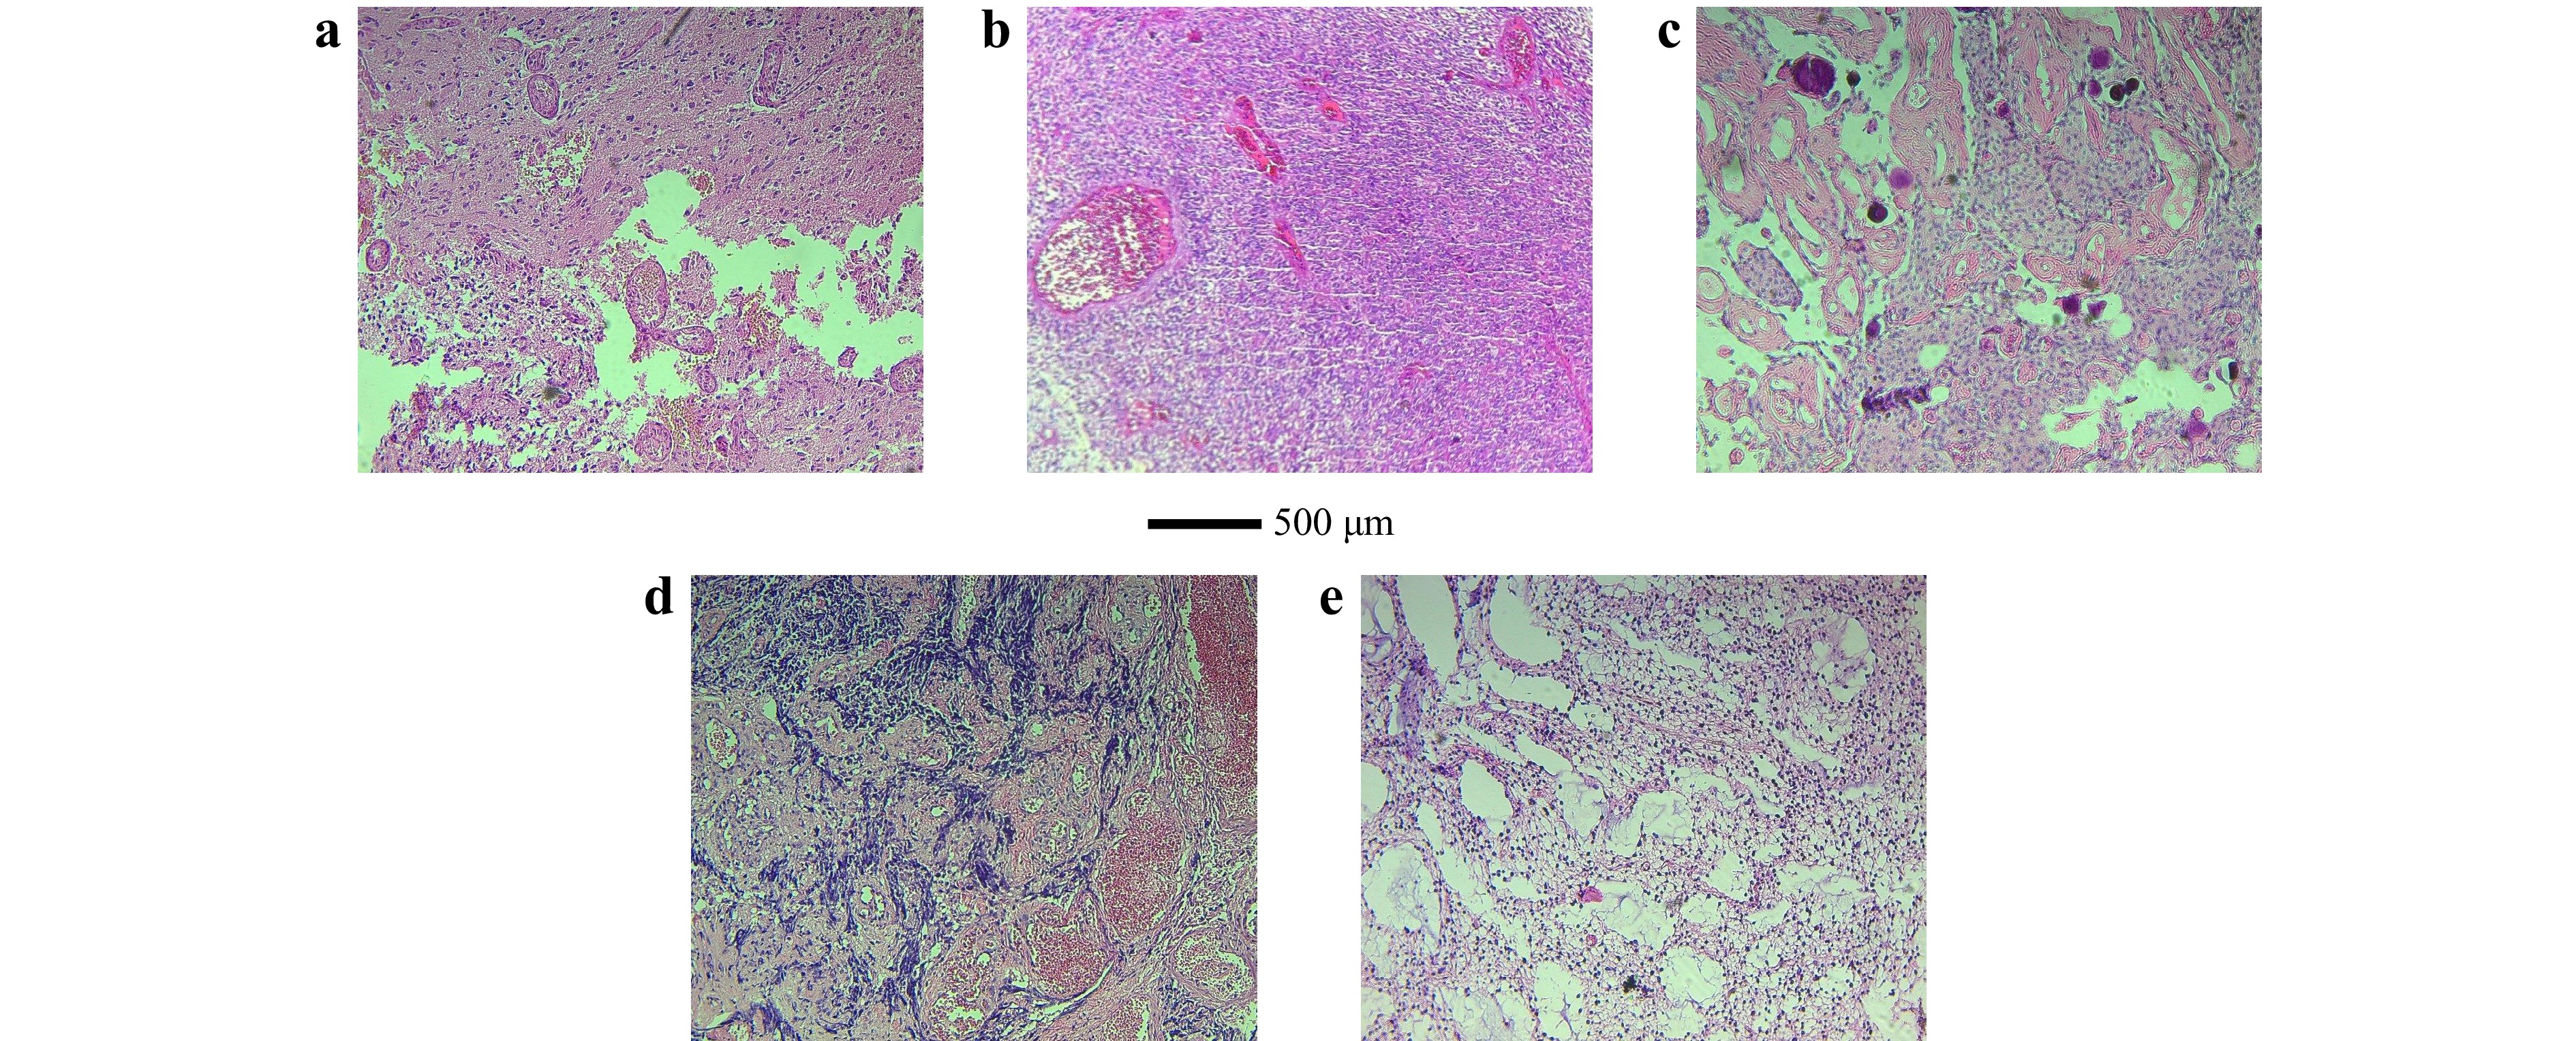
Fig. 1 Representative histopathological images with corresponding diagnostic immunohistochemical staining of the tumor types studied: a GBM, b ependymoma, c meningioma, d medulloblastoma, e low-grade glioma.
The polarization characteristics of different tissue samples are influenced by their unique microstructural and compositional properties. Each type of brain tumor may have distinct optical properties, such as varying degrees of birefringence, scattering coefficients, and absorption rates, which affect how polarized light interacts with the tissue. For instance, GBM exhibits higher heterogeneity in cellular and extracellular structures compared to low-grade gliomas, leading to more complex polarization patterns. Meningiomas, being more fibrous, show distinct birefringent properties, while medulloblastomas, with their denser cellular packing, result in different scattering patterns18, 30. Our method leverages these inherent differences by combining polarimetric imaging, which captures the polarization state changes, with adapted DLSA. This synergy allows us to differentiate tissues based on their unique responses to polarized light. The proposed non-invasive, label-free technique may be used to distinguish the aforementioned intracranial pathologies and can be further extended to preclinical and clinical assessments.
-
This study was reviewed and approved by the Ethics Committee of the Iran University of Medical Sciences, Tehran, Iran (IR_IUMS.REC.1397.1237). All procedures were performed in strict adherence to the Declaration of Helsinki – WMA – The World Medical Association 2018.
-
Patients were enrolled in a cohort investigation of referred cases to Firoozgar Hospital, Tehran, Iran, in 2022. These patients presented with symptoms and signs of space-occupying tumoral brain lesions, which were newly diagnosed following MRI investigations, surgical intervention, and definitive pathological evaluation of tissues obtained from surgical procedures.
-
The surgical procedures included open or endoscopic, total or subtotal resection of the tumor following MRI investigations. Tissue samples were obtained for precise pathological analyses. No corticosteroids or anticonvulsants were prescribed prior to surgery.
-
Pathological investigations involved the immediate fixation of samples in formalin post-surgery, followed by paraffin embedding and sectioning. In cases where a definitive diagnosis was not achieved through direct analysis of the H&E-stained slides, IHC results from the pathology department of Firoozgar Hospital, Tehran, Iran, were utilized to reach conclusive final diagnoses, serving as the gold standard technique.
-
As previously discussed, while incoherent light sources typically yield noise- and speckle-free images, they often lack the high contrast and quality required for detailed tissue imaging. On the other hand, most tissue samples diffuse coherent light, hindering clear image formation. This challenge prompted us to adopt a novel approach, committed to leveraging polarimetric images while diverting attention to laser speckle patterns, rather than relying solely on the imaging aspect. Our proposed optical setup for polarization-driven DLSA, depicted in Fig. 2, comprises a coherent light source, a spatial filter (SF), a polarization state generator (PSG), a polarization state analyzer (PSA), and an image sensor. Unwanted spatial frequencies of a diode laser (532 nm, 100 mW) are eliminated by the SF unit, with its pinhole positioned at the focal plane of a collimating lens (L, focal length: 5 cm) to ensure uniform intensity across the illumination. The expanded and collimated beam passes through the PSG, consisting of a linear polarizer (LP) and a quarter-wave plate (QWP), to generate an arbitrary polarization state for irradiation. Post-interaction with the sample, diffused light is analyzed through the PSA, which mirrors the PSG’s optical configuration. A digital camera (DCC1545M, Thorlabs) with an 8-bit dynamic range and a 5.2 µm pixel pitch is placed 10 cm from the sample plane. It captures polarimetric images with a resolution of 1280 pixels by 1024 pixels, where each pixel represents an area of 230 nm by 230 nm.
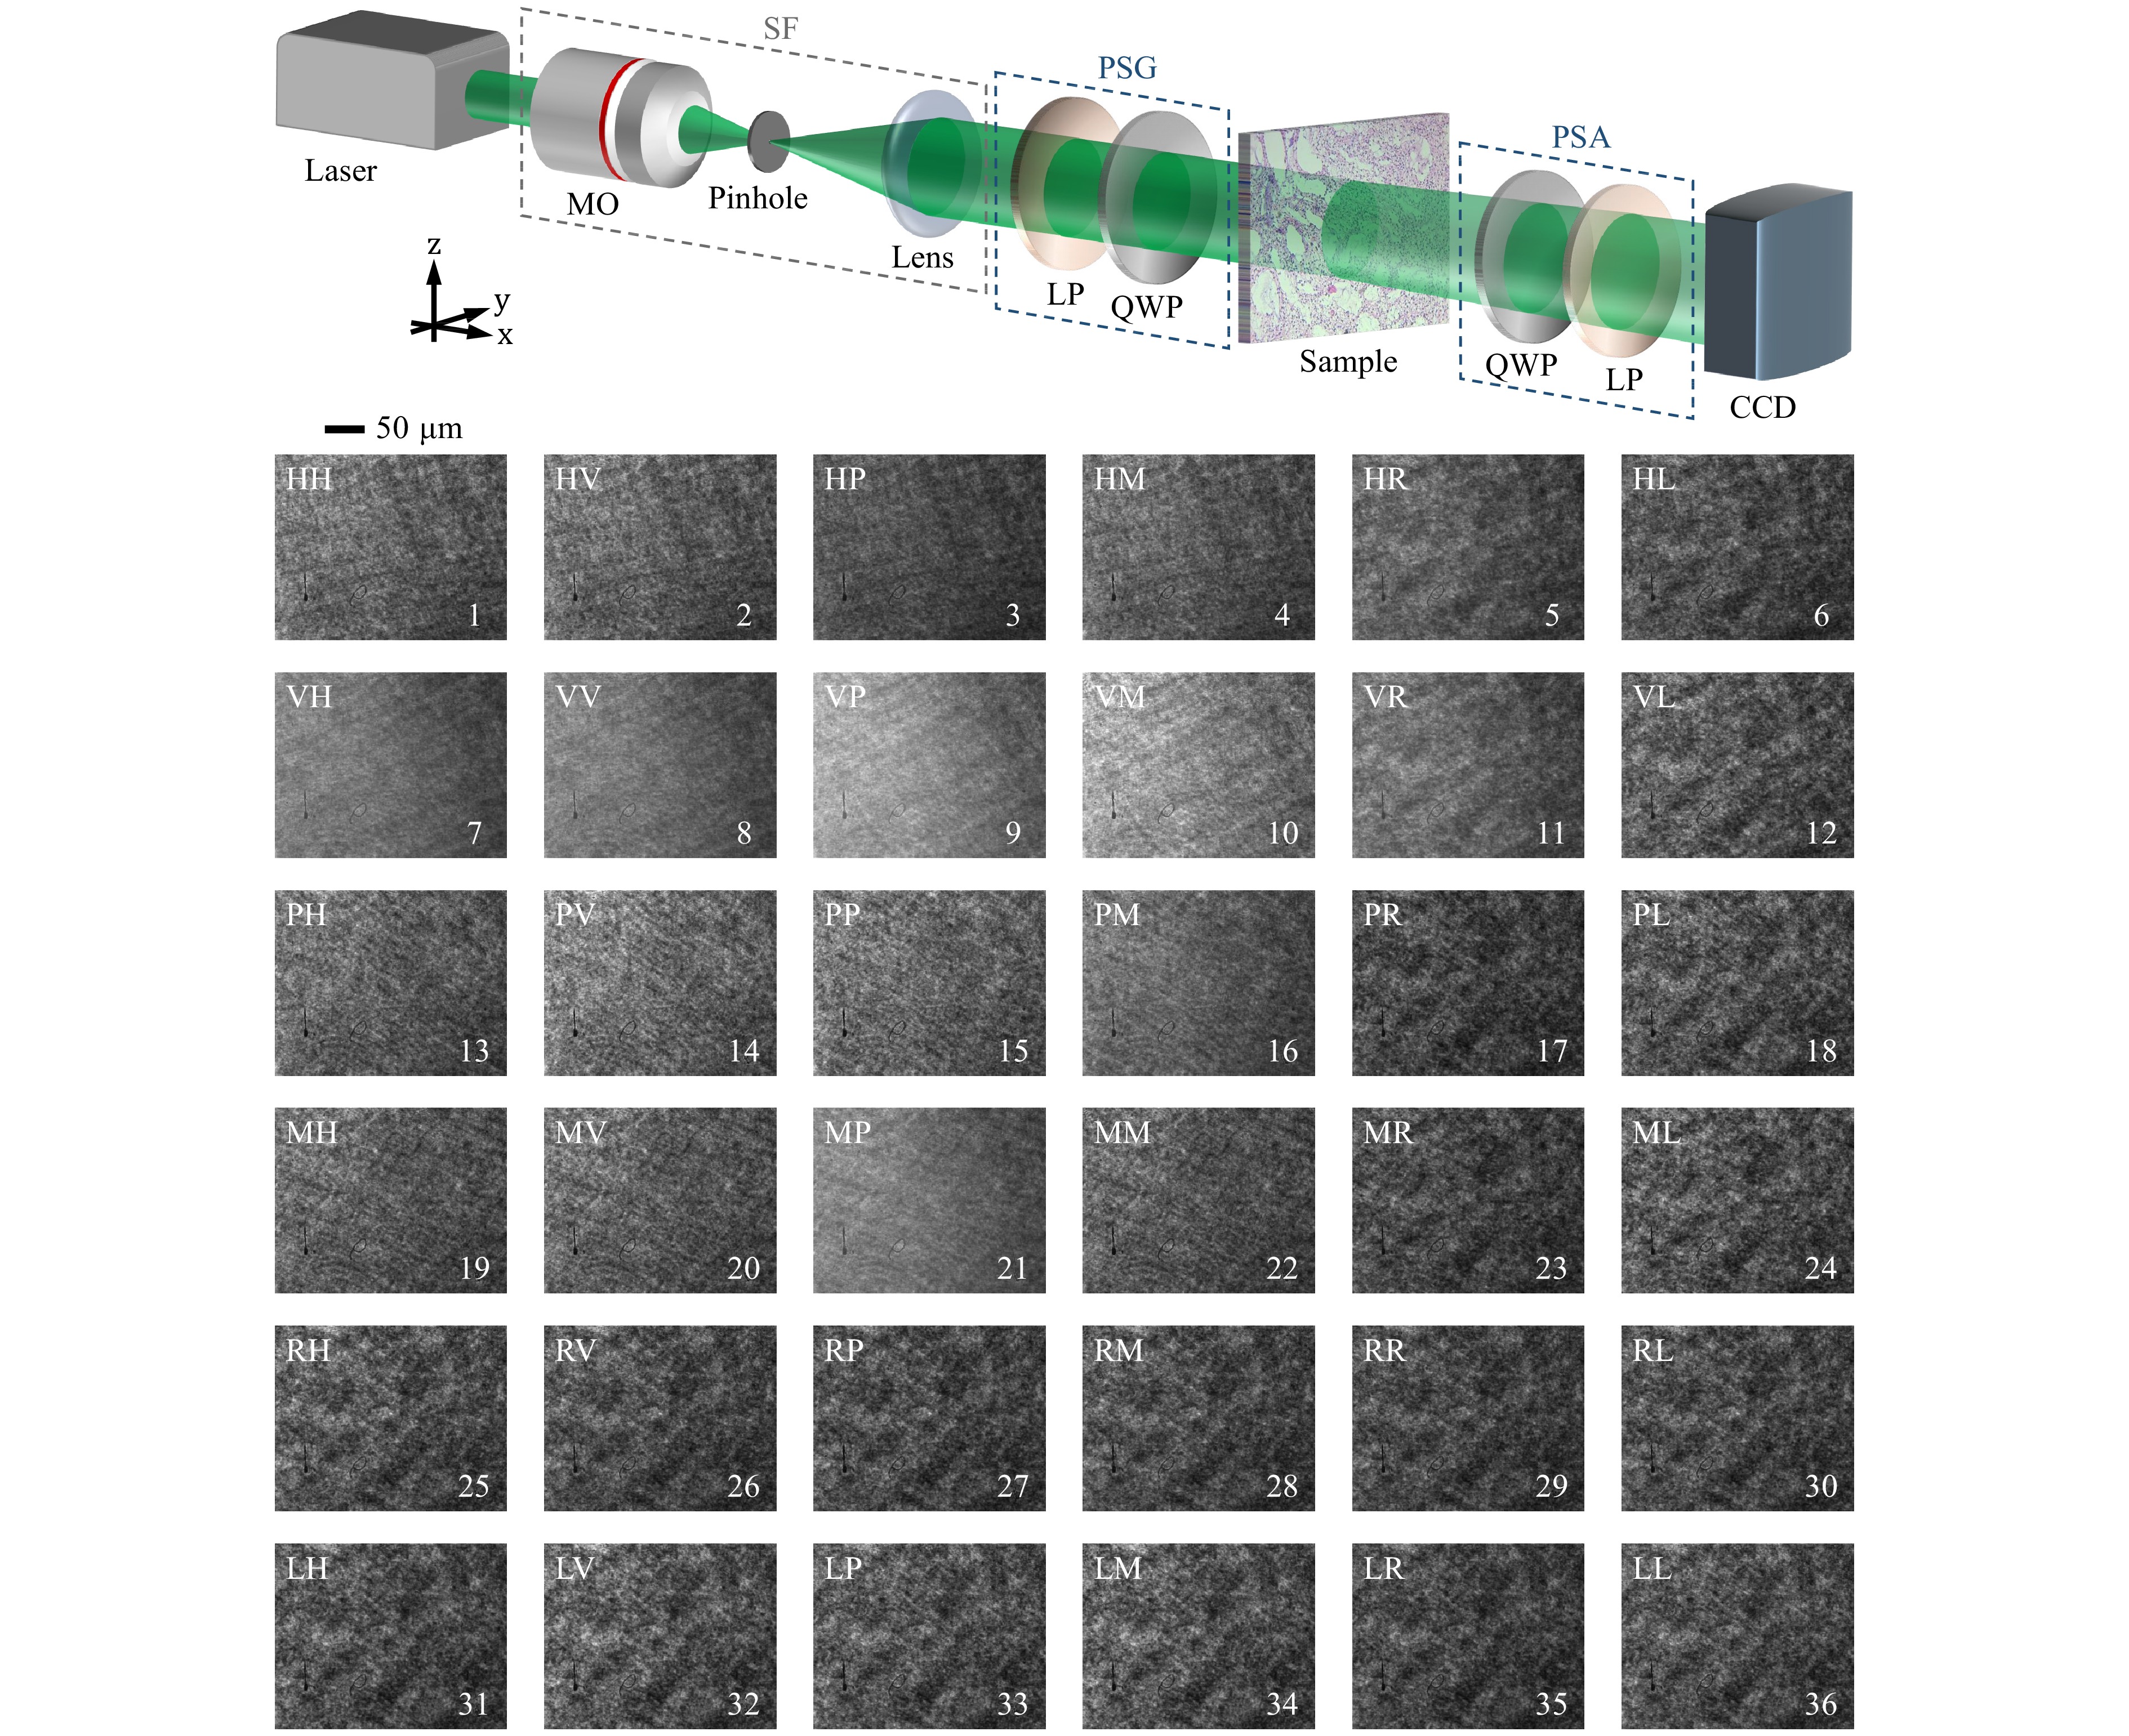
Fig. 2 Schematic of the optical setup for polarization-driven DLSA: SF - spatial filter, MO - microscope objective, LP - linear polarizer, QWP - quarter-wave plate. Displayed below the setup, as an example, are 36 parametric images representing speckle data recorded from one of the samples (low-grade glioma) under investigation. These sequence intensity images are produced by generating six polarization states for the incident light: horizontal linear (H), vertical linear (V), 45$ ^\circ $ linear (P), -45$ ^\circ $ linear (M), left circular (L), and right circular (R). Corresponding polarization states are used for the scattered light, adjusted using the PSG and PSA units as shown in Table 1. The first and second indices indicate the input and output polarization states, respectively. For instance, HV denotes horizontal input and vertical output polarization.
We produce six polarization states for the incident light: horizontal linear (H), vertical linear (V), 45° linear (P), −45° linear (M), left circular (L), and right circular (R). Each time, the same six polarization states are applied to the scattered light in the PSA unit. Hence, 36 parametric images ($ I_{HH}, I_{HV}, I_{HP}, ..., I_{LL} $) of a sample are obtained sequentially by properly adjusting the polarizers and retarders in the PSG and PSA units. The procedure is summarized in Table 1. The first and second indices denote the input and output states of polarization, respectively. For example, the term HV indicates a horizontal state for the input and a vertical state for the output polarizations. The alterations in the polarization-related properties of a specimen cause variations in the speckle pattern observed in the recorded images. The entire imaging process for each sample is completed in 10 minutes. We consider these intensity images as a sequence of speckle pattern data. Collecting such data from a low-grade glioma sample is shown in Fig. 2 as an example. The collected raw images are then subjected to DLSA. The reconstructed 16 Mueller matrix images in the conventional approach may also be used for this purpose towards a robust interpretation57. It is important to emphasize that in this context, “dynamic” refers to changes in the speckle pattern across the sequence of polarimetric images resulting from variations in the sample’s polarimetric responses during polarimetry. This differs from the conventional association with temporal dynamics, as in this context, we focus on sequence-based variations instead of time-varying data. We employ MATLAB (MathWorks, Inc., Natick, MA) to adapt and apply a set of numerical and graphical statistical methods to the polarimetric images, which primarily are customized for DLSA. This allows us to differentiate tissue types based on their unique polarization-influenced speckle traits.
PSA/PSG H V P M R L H $ I_{HH} $ $ I_{HV} $ $ I_{HP} $ $ I_{HM} $ $ I_{HR} $ $ I_{HL} $ V $ I_{VH} $ $ I_{VV} $ $ I_{VP} $ $ I_{VM} $ $ I_{VR} $ $ I_{VL} $ P $ I_{PH} $ $ I_{PV} $ $ I_{PP} $ $ I_{PM} $ $ I_{PR} $ $ I_{PL} $ M $ I_{MH} $ $ I_{MV} $ $ I_{MP} $ $ I_{MM} $ $ I_{MR} $ $ I_{ML} $ R $ I_{RH} $ $ I_{RV} $ $ I_{RP} $ $ I_{RM} $ $ I_{RR} $ $ I_{RL} $ L $ I_{LH} $ $ I_{LV} $ $ I_{LP} $ $ I_{LM} $ $ I_{LR} $ $ I_{LL} $ Table 1. Procedure for collecting 36 polarimetric intensity images as successive speckle data in polarization-driven DLSA. Rows and columns represent polarization states for incident and scattered light, respectively: H: Horizontal, V: Vertical, P: +45° linear, M: −45°, R: Right circular, and L: Left circular polarizations.
-
When a laser beam illuminates a rough surface, it forms a random interference pattern called laser speckle. DLSA is an optical technique that captures and analyzes temporal changes in the speckle pattern. Changes within the sample, such as cellular activity or tissue growth, alter the speckle pattern. These changes are recorded as a series of frames and tracked over time. A set of numerical and graphical statistical methods is then applied to these frames for analysis48, 53. DLSA serves as an effective tool for investigating the characteristics of active materials, providing valuable information about the sample’s activity, especially in the case of biomaterials. The analysis of sample activity can reveal various phenomena related to the sample35−37, 58−60.
We synergize polarimetric imaging with dynamic laser speckle analysis to enhance the differentiation of tissue samples. Unlike traditional temporal dynamics, this approach focuses on sequence-based variations, analyzing changes in speckle patterns throughout a collection of polarimetric images. These intensity images capture spatial fluctuations associated with the sample's polarimetric responses during the polarimetric experiment. Coherent light with different polarization states interacts with the tissue samples through absorption, reflection, and scattering, influencing the formed speckle pattern. The intensity and wavelength of the laser remain stable throughout the process, ensuring that any detected changes in the speckle patterns is attributed to internal features28, 29, 61, 62. We consider the images as a series of speckle frames and apply various post-processing techniques to the consecutive images, primarily customized for DLSA.
The Time History Speckle Pattern (THSP) creates a 2D matrix from the collection of speckle images. A set of $ M $ points or pixels is randomly selected in each pattern of the consecutive images. These points are then arranged side by side to form a new $ M \times N $ pixel matrix. In this study, the rows ($ M $) represent the pixels, while the columns ($ N $) show their intensity changes across the polarimetric images, with $ N $ denoting the number of images. The THSP serves as an indicator for any changes in the polarimetric responses within a sample during polarimetry, which manifest as intensity variations in the horizontal direction. Higher intensity variations in the THSP line correspond to samples with higher activity levels38, 63−65. The THSP concept is commonly employed to derive numerical results such as the gray-level co-occurrence matrix (GLCM), inertia moment (IM), and auto-correlation (AC). Additionally, certain statistical parameters, such as contrast, homogeneity, and roughness, can be determined independently of THSP.
The GLCM is an intermediary matrix used to evaluate the dispersion of consecutive pixels in a THSP of $ M$ points through $ N$ speckle patterns. It is defined as:
$$ {\rm{GLCM}}(i,j) = \sum\limits_{m = 1}^M {\sum\limits_{n = 1}^{N - 1} {\left\{ {\begin{array}{*{20}{l}} {1,}&{{\rm{if\ THSP}}(m,n) = i\ {\rm{ and}}}\\& {\rm{THSP}}(m,n + 1) = j\\ {0,}&{{\rm{otherwise}}} \end{array}} \right.} } $$ (1) This matrix represents a transition histogram of intensities. Thus, $ \mathrm{GLCM}(i, j)$ indicates the number of times a transition from intensity level $ i$ to $ j$ occurs50,53,66−70. GLCM values may be normalized to create what is often referred to as the modified GLCM. This normalization enables the depiction of transition probability matrices between intensity values within the (THSP)34,71,72. The modified GLCM is used to find the probability mass function of the regular difference of intensities between two neighboring pixels in a THSP. While high raw GLCM values indicate frequent transitions between specific intensity levels, it is the normalized GLCM values that provide a meaningful depiction of these probabilities, enriching the understanding of the sample's characteristics. In this context, $ i $ and $ j $ represent the intensities of neighboring pixels. This normalization helps calculate the probability of an intensity jump from level $ i $ to $ j $, such that $ P_r((j - i) = w) $, where $ w $ represents the intensity jump value from $ j = i + w $, with $ -255 \leqslant w \leqslant 255 $53 (for an 8-bit image).
The AC function calculates the average correlation between the intensity of pixels in two consecutive speckle patterns across the sequence of polarimetric images. For this, the THSP matrix is used to calculate the AC curve65,73:
$$ \mathrm{AC}(i,j) = \langle \mathrm{THSP}(:,i),\mathrm{THSP}(:,i+j)\rangle $$ (2) There is a relationship between the speckle intensity AC and the mean square displacement ($ \langle{\Delta r^2(i,j)}\rangle $), which is crucial for determining the dissemination of statistical data in biological samples. The AC function of THSP is directly related to the ($ \langle{\Delta r^2(i,j)}\rangle $) of the scatterers between the $ i $ and the $ i + j $ polarimetric images. THSP(:,$ i $) and THSP(:,$ i+j $) refer to the pixels of THSP in the $ i $ and the $ i + j $ images, respectively73−76:
$$ \mathrm{AC}(i,j) = e^{-2k\gamma\sqrt{\langle{\Delta r^2(i,j)}\rangle}} $$ (3) The wave vector $ k $ and parameter $ \gamma $, which depends on the polarization state of light, are used to calculate the mean square displacements (MSD) of contributing scatterers of samples that produce speckle patterns. To obtain MSD, curves are fitted to experimental data.
The randomness of the speckle pattern can be determined by examining its entropy, which has been studied and generalized through the Shannon entropy (SE) concept. This method has proven useful in the image correlation method for quality valuation of the speckle pattern. SE is calculated by estimating the probability density function of the intensity of the speckle pattern, which changes with the intensity distribution randomness. The intensity probability density function, $ p(I) $, of a random intensity distribution can be written as77:
$$ p(I) = \frac{4I}{\langle I \rangle}\; \exp{\frac{-2I}{\langle I \rangle}} $$ (4) $ \langle \rangle $ indicates the ensemble average of the variable. The intensity SE distribution can be derived from the function of the intensity normalized probability density, described as $ Np(I) = \langle I \rangle p(I) $, and using77:
$$ \mathrm{SE} = -\sum\limits_{I} Np(I) \; \log Np(I) $$ (5) where SE represents the intensity distribution with the summation taken over the intensity. It is important to note that $ I $ unequivocally represents the intensities of the images in the datapack as a 3D matrix.
The Average Difference (AD), also known as the Fujii method, may be used to show graphical analysis outcomes48,53. This method produces a result with a relative value, as shown in Eq. 6:
$$ \mathrm{AD} = \sum\limits_{k} \frac{|I_{k} - I_{k-1}|}{I_{k} + I_{k-1}} $$ (6) where $ I_k $ represents an image (intensity matrix) taken at instant $ k $. This method enhances the differences in areas of the image that are dark, making the final image clearer than other graphical methods.
The motion history image (MHI) is a valuable tool for analyzing the activity level of samples by identifying movements over time within a series of images. MHI distinguishes between static and dynamic patterns in pixel intensity, providing precise information about recent motion. By examining the timestamps of pixels across an image sequence, MHI accurately tracks and analyzes object movements, offering a comprehensive understanding of motion sequences. To achieve this, intensity matrices are grouped into a 3D matrix known as a datapack, and the dynamics of the object are revealed by subtracting sequential speckle patterns. This method effectively determines an object’s movement48,53,78. To generate the MHI, we first calculate the difference between consecutive frames to detect motion. This is done by deriving the $ S_l(i,j)$ matrix for each of the $ N$ speckle patterns (images) by subtracting it from the previous pattern:
$$ S_{ l}(i,j) = I_l(i,j) - I_{l-1}(i,j) $$ (7) where $ I_l(i,j)$ and $ I_{l-1}(i,j)$ represent the intensity of pixel $ (i,j)$ at moments $ l$ and $ l-1$, respectively. Subsequently, these matrices are converted into binary patterns by applying a suitable threshold to distinguish significant motion from noise:
$$ {T_l}(i,j) = \left\{ {\begin{array}{*{20}{l}} {1,}&{{\rm{if }}\ |{S_l}(i,j)| > {S_T}}\\ {0,}&{{\rm{if }}\ |{S_l}(i,j)| \leqslant {S_T}} \end{array}} \right. $$ (8) where $ T_l(i,j)$ is the threshold image of $ S_l$ at each moment $ l$, and $ S_{T}$ is the activity threshold parameter ($ 0 \leqslant S_{T} \leqslant 255$). This threshold helps to filter out small changes and noise, only highlighting significant changes as motion. Therefore, MHI specifically considers pixel activity with intensity levels above $ S_{T}$. Finally, the MHI matrix is generated from $ T_l(i,j)$ by:
$$ \mathrm{MHI} = 255 \sum\limits_{k = 0}^{N-1} T_{l-k}\; h_k $$ (9) where $ h_k$ is given by:
$$ h_k = \frac{N-k}{N(N+1)/2} $$ (10) It is important to note that the $ h_k$ value is a crucial weighting parameter that is solely based on the age of the image. Therefore, it is essential to consider this value while determining the relevance and importance of the image in any given context. Polarization-driven DLSA shifts the focus from temporal changes to sequence-based variations and applies the adapted methods to the collection of polarimetric images.
-
To show the effectiveness of the presented polarization-driven DLSA approach, we tested it on patients with tumor lesions from different cell types that cannot be distinguished through radiological analysis alone. Fig. 3a−e show the THSP matrices of the five different types of brain tumors under our study. These THSPs are formed by tracking the intensity values from 3000 randomly selected pixels in the collection of 36 polarimetric images of each sample. The results show that significant differences in the speckle patterns can be observed among different types of tumors, indicating variations in their polarization characteristics.
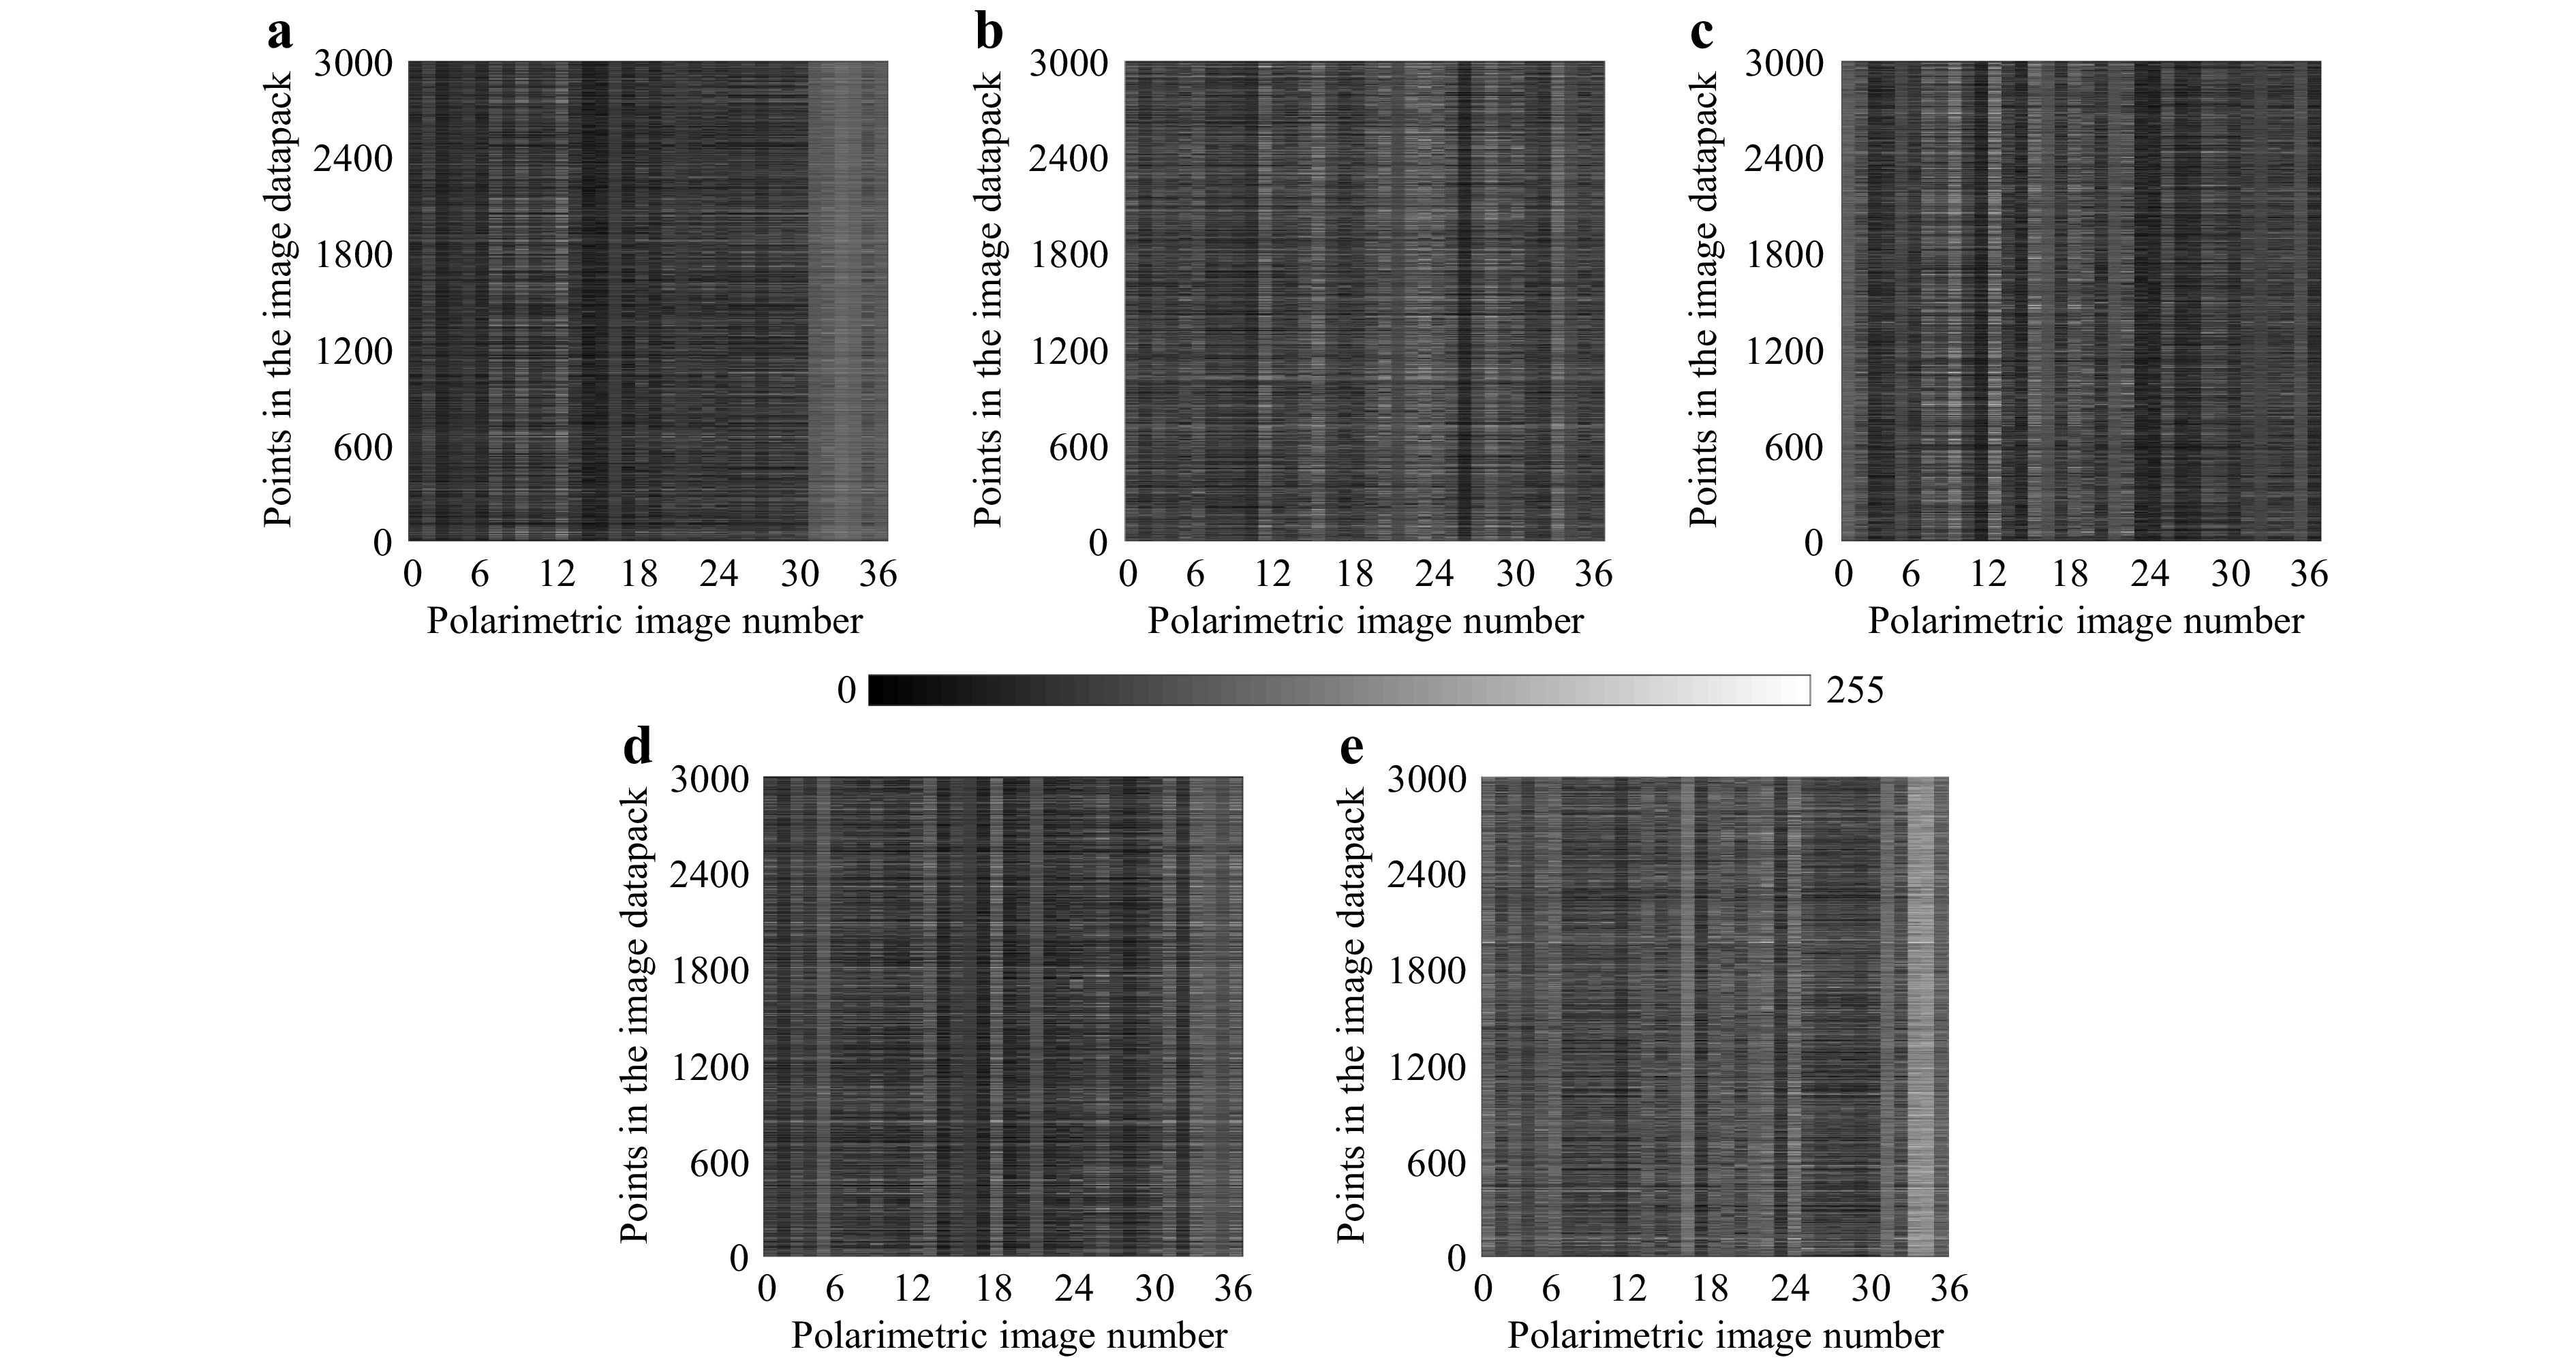
Fig. 3 Time History Speckle Pattern (THSP) formed by tracking 3000 random points across the 36 polarimetric images (image datapack points) of a GBM, b ependymoma, c meningioma, d medulloblastoma, e low-grade glioma. The grayscale intensity represents the variation in polarization states across the image sequence, providing a visual representation of the dynamic changes in speckle patterns. The differences in the patterns indicate distinctions among the tissue samples.
A deeper exploration of these polarimetric variations is facilitated through the computation of the associated GLCMs for each sample. Fig. 4a−e show the 3D and 2D visualizations of the GLCM derived from the THSP matrices, where the intensity levels $ i $ and $ j $ are denoted as per Eq. 1. For a sensitive sample to different polarization states, the intensity values evolve across the polarimetric measurement, the non-zero elements near the main diagonal increase, and the matrix takes on a cloud-like appearance. Conversely, for a low-activity sample, the matrix values are concentrated around the main diagonal. This dispersion indicates that departures from the diagonal are more frequent and varied across samples, implying heterogeneity in their polarization characteristics. For example, the higher dispersion in the low-grade glioma case in Fig. 4e represents a higher polarization activity, as seen in the corresponding THSP of Fig. 3e. The number of different intensity transitions observed in the GLCM varies among samples, highlighting the unique way each sample responds to polarimetric changes.
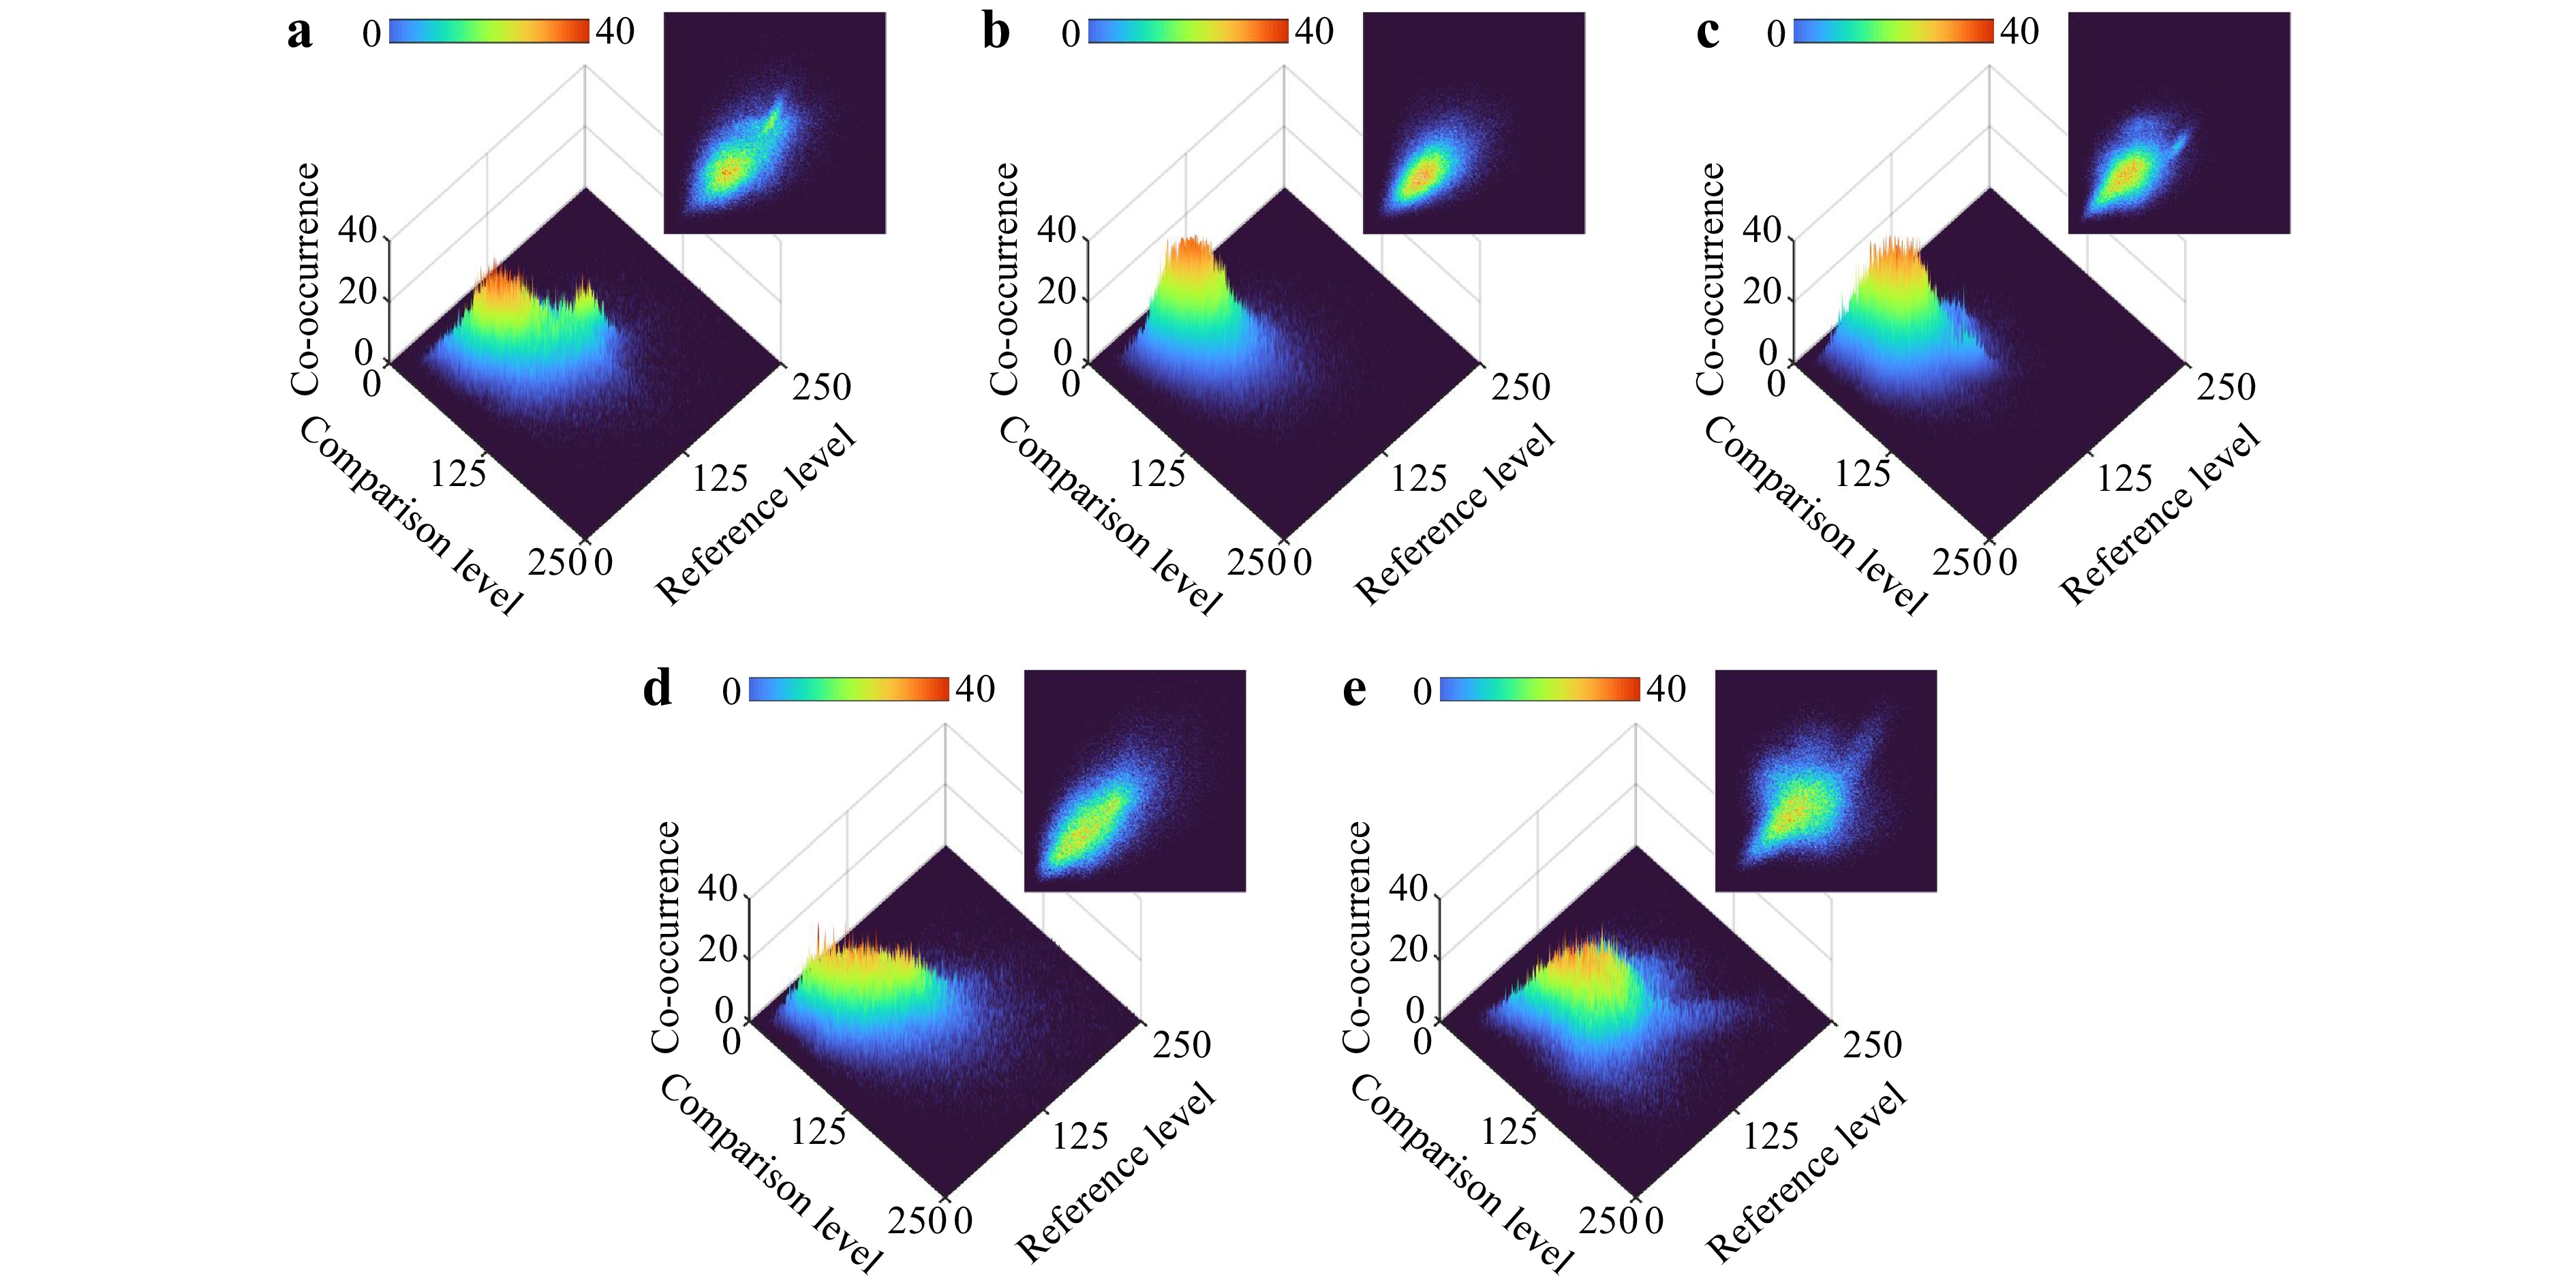
Fig. 4 3D and 2D demonstration of the gray-level co-occurrence matrix (GLCM) derived from the THSPs shown in Fig. 3 for a GBM, b ependymoma, c meningioma, d medulloblastoma, and e low-grade glioma. The sensitivity of a sample to different polarization states is reflected in the dispersion of the cloud-like pattern over the main diagonal.
The regular probability mass function of the polarimetric image collection for the samples is shown in Fig. 5, illustrating the intensity jumps between pixels. These jumps are attributed to fluctuations in speckle patterns due to variations in the polarization responses of each sample to different polarization configurations. The probability mass function reveals the statistical distribution of these intensity jumps, reflecting the heterogeneity in the polarization characteristics of the tissue samples. Notable observations from Fig. 5 include variations in the full width at half maximum (FWHM) and kurtosis values among different tumor types. These parameters characterize the speckle pattern distributions, indicating the polarization properties of the tissues. For example, FWHM values denote the breadth of intensity jump distributions, while kurtosis values indicate their peakedness. These metrics provide information about the scattering medium, as the interaction of scatterers in the tissues during the polarimetric experiments reveals distinct scattering behaviors.
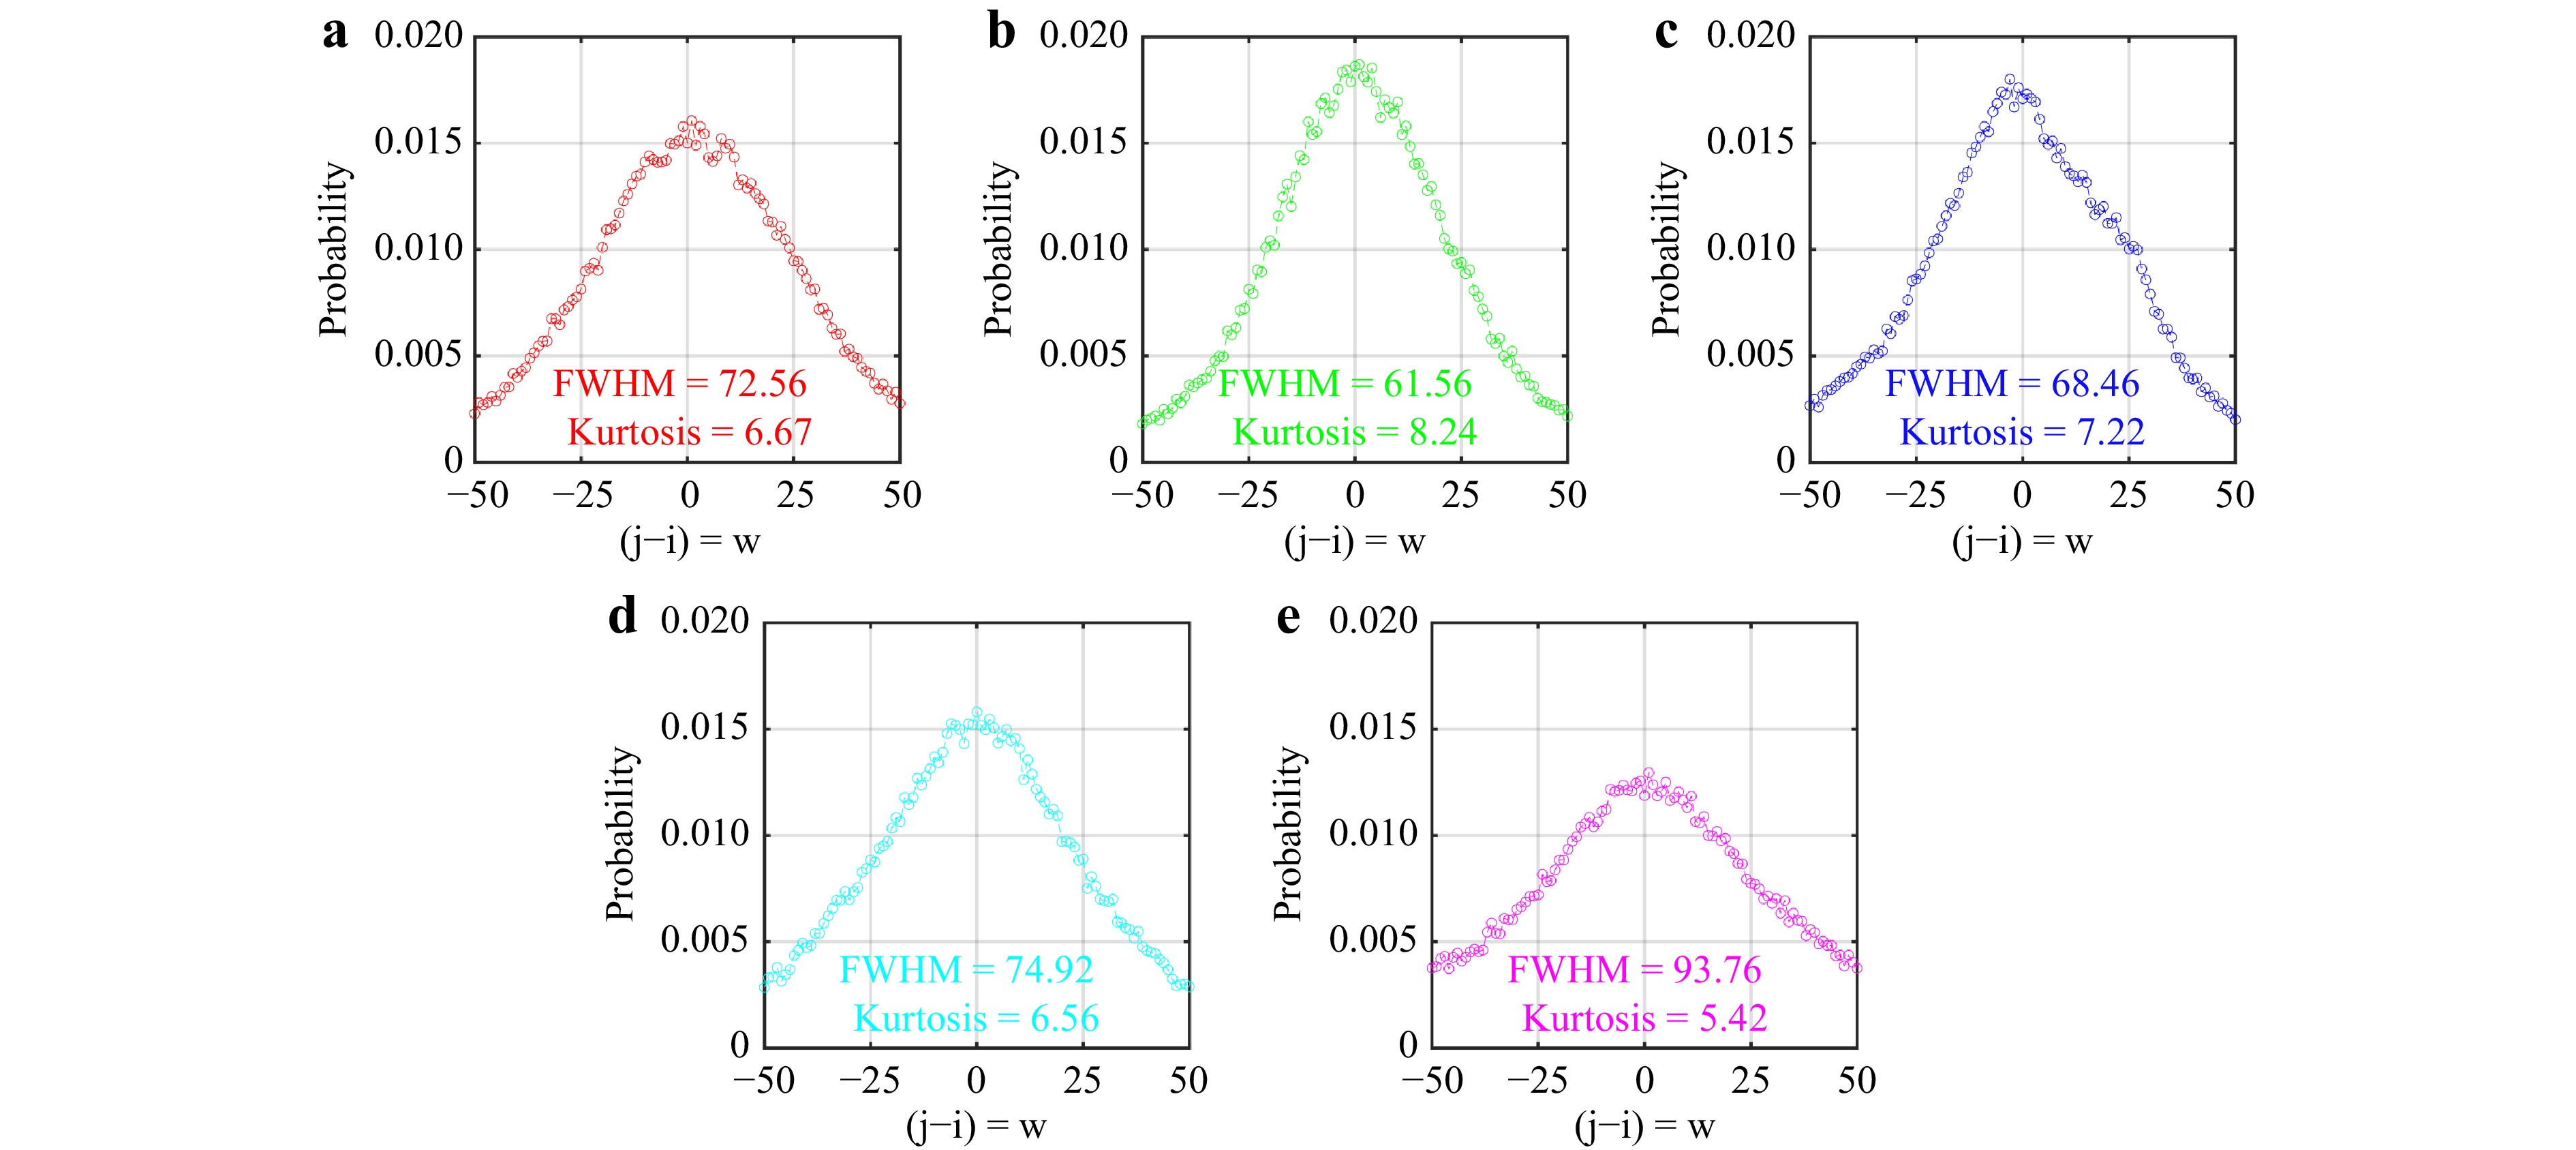
Fig. 5 Regular probability mass function of the collection of polarimetric images for different types of brain tumors: a GBM, b ependymoma, c meningioma, d medulloblastoma, and e low-grade glioma. The graphs show the distribution of intensity jumps between pixels ($ j-i = w$), with FWHM and kurtosis values indicated for each tumor type, highlighting the statistical dispersion and heterogeneity in their polarization responses.
The speckle intensity AC curve is obtained by measuring the correlation between pixel intensities in the first image and subsequent images across the sequence of polarimetric images, using the constructed THSPs. This approach emphasizes sequence-based intervals rather than conventional time intervals. Fig. 6 shows the AC variations as a function of the image sequence step throughout the 36 polarimetric images for each of the samples. For each set of calculated AC values, an exponential function is fitted according to Eq. 3. The fitted functions are depicted by the corresponding color lines for the different evaluation samples, with the resulting fitting parameters shown in the legend of Fig. 6. According to Eq. 3, a linear variation is expected throughout the recorded successive polarimetric images for $ 2k\gamma\sqrt{MS D} $. Since $ \gamma $ is a parameter that depends on the polarization state of light, Fig. 6 can serve as an indicator of polarization characteristics in different samples.
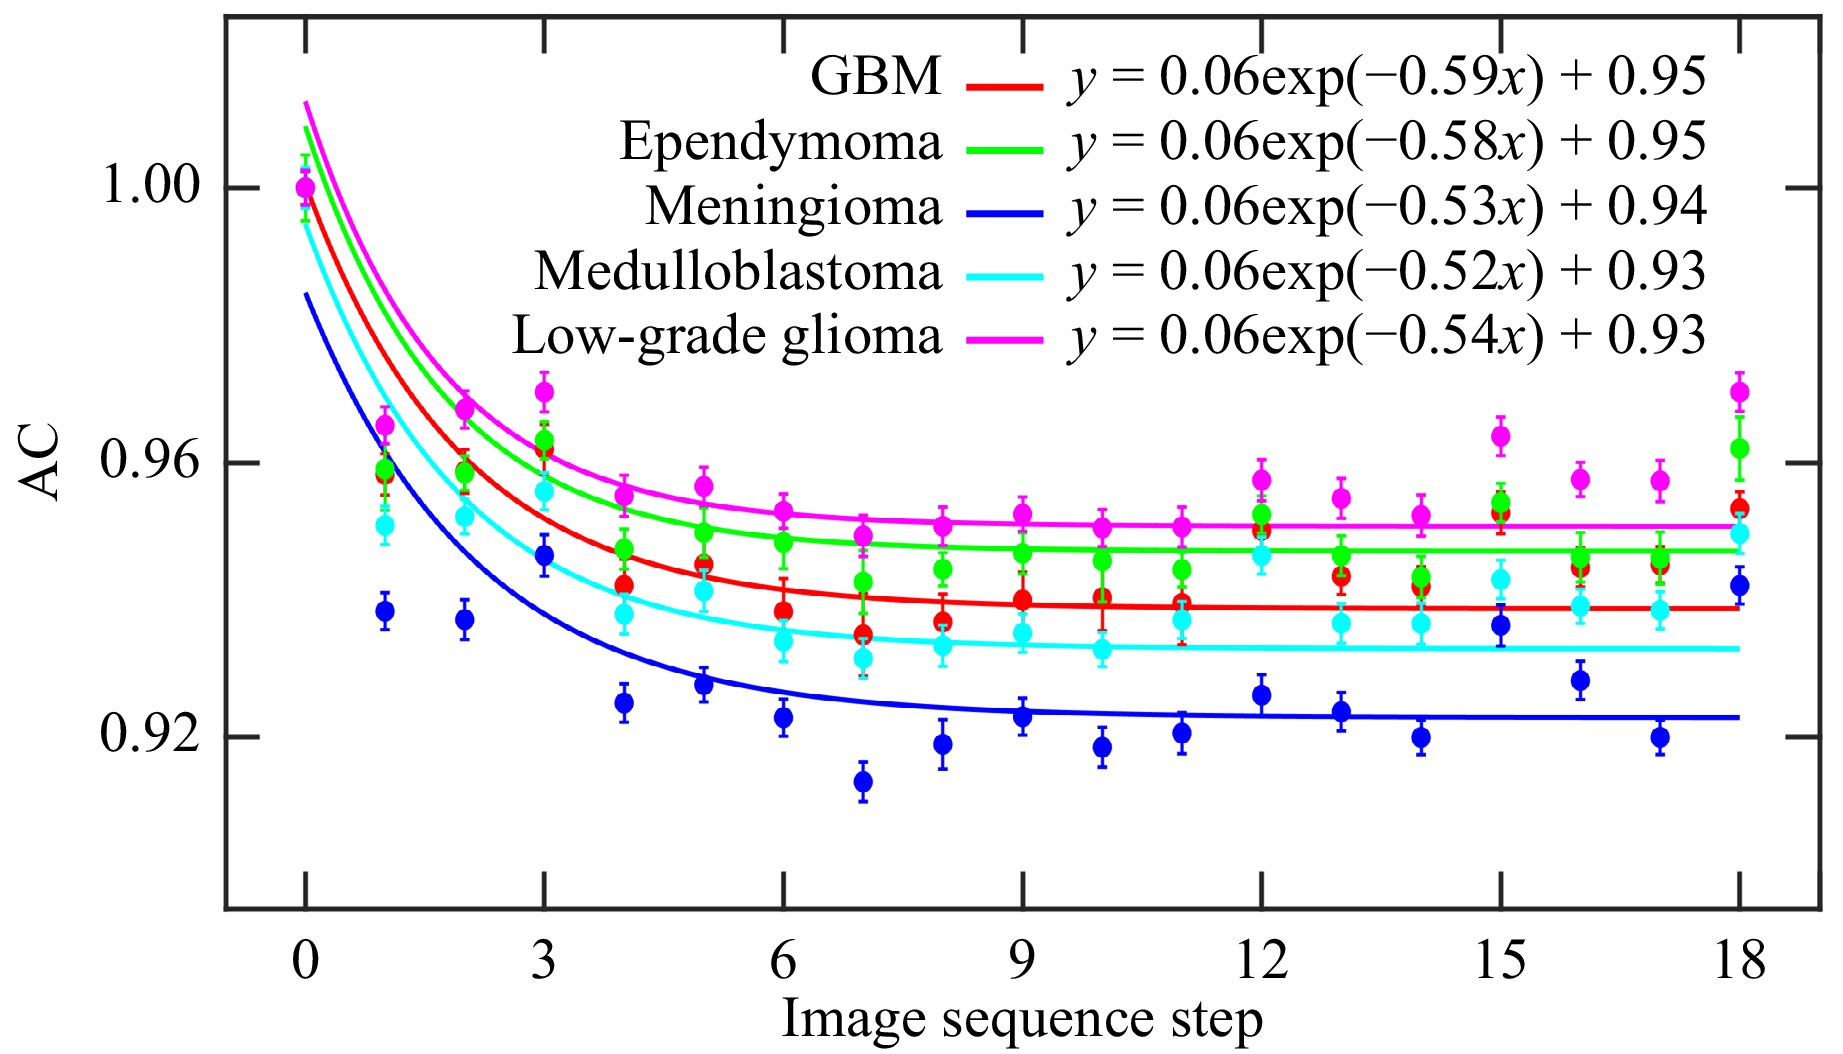
Fig. 6 Autocorrelation function (AC) of the polarimetric images for each of the samples. Exponential functions fitted to the data are shown in the corresponding colors, with the fitting parameters included in the legend.
The SE curve is obtained by measuring the pixel intensities in the first image with subsequent images across the sequence of polarimetric images, using the constructed THSPs. The mean entropy value corresponding to each polarimetric image is determined by considering the entire image set (datapack). Fig. 7 shows the SE and standard deviation (STD) variations of tissue samples. Different SE and STD values indicate different degrees of polarization (DoP)77. It has been shown that the STD and SE of intensity increase with DoP, as a higher DoP leads to greater contrast in the intensity distribution, resulting in higher STD and SE values77. The observed variations in SE and STD can be explained by the fact that both parameters quantify fluctuations in the intensity distribution. It has been shown that the SE increases quadratically with the DoP, indicating a change in the randomness of the intensity distribution77. Additionally, the relationship between SE and STD is linear, as both metrics increase with the DoP due to the enhanced contrast and randomness in the intensity distribution, highlighting that both metrics effectively measure the intensity distribution’s fluctuation. These variations of SE and STD as functions of DoP reveal valuable details about the polarization characteristics of the tissue samples

Fig. 7 a Shannon entropy (SE) and b standard deviation (STD) variations for different types of brain tumors. These metrics show the differences in the degree of polarization (DoP) and intensity fluctuations in the samples during polarimetric measurement. Error bars indicate the variability within the data.
The Fujii method can be considered a technique to show the point-by-point effects of speckle patterns of the laser beam on the sample and the local detection of tissue polarimetric characteristics. This method computes the sum of the absolute intensity differences between consecutive images by summing up the intensity differences between each pair in the collection of consecutive images, as explained earlier in subsection 2.6. In an obtained Fujii map, the highest pixel value signifies the most significant change at lower intensities. This method produces a single image where the pixel value is determined by the difference in intensity at that specific position. The highest pixel value represents the maximum change in intensity and is therefore referred to as the maximum activity at that position. The activity map is obtained by summing up the absolute value of all differences between consecutive images and then normalizing the result with the sum of both images48, 53. This process can effectively provide an activity map of the polarimetric images for all pixels. Fig. 8 compares Fujii 2D maps and associated intensity histograms of the brain tumors, extracted from the 36 polarimetric images for each. Pseudo-colors in the Fujii 2D maps indicate the sensitivity levels of each region within the samples to changes in the polarization states during polarimetric measurement. For example, in the provided maps, the sensitivity levels are color-coded in the Jet colormap, ranging from blue for low sensitivity to red for high sensitivity.
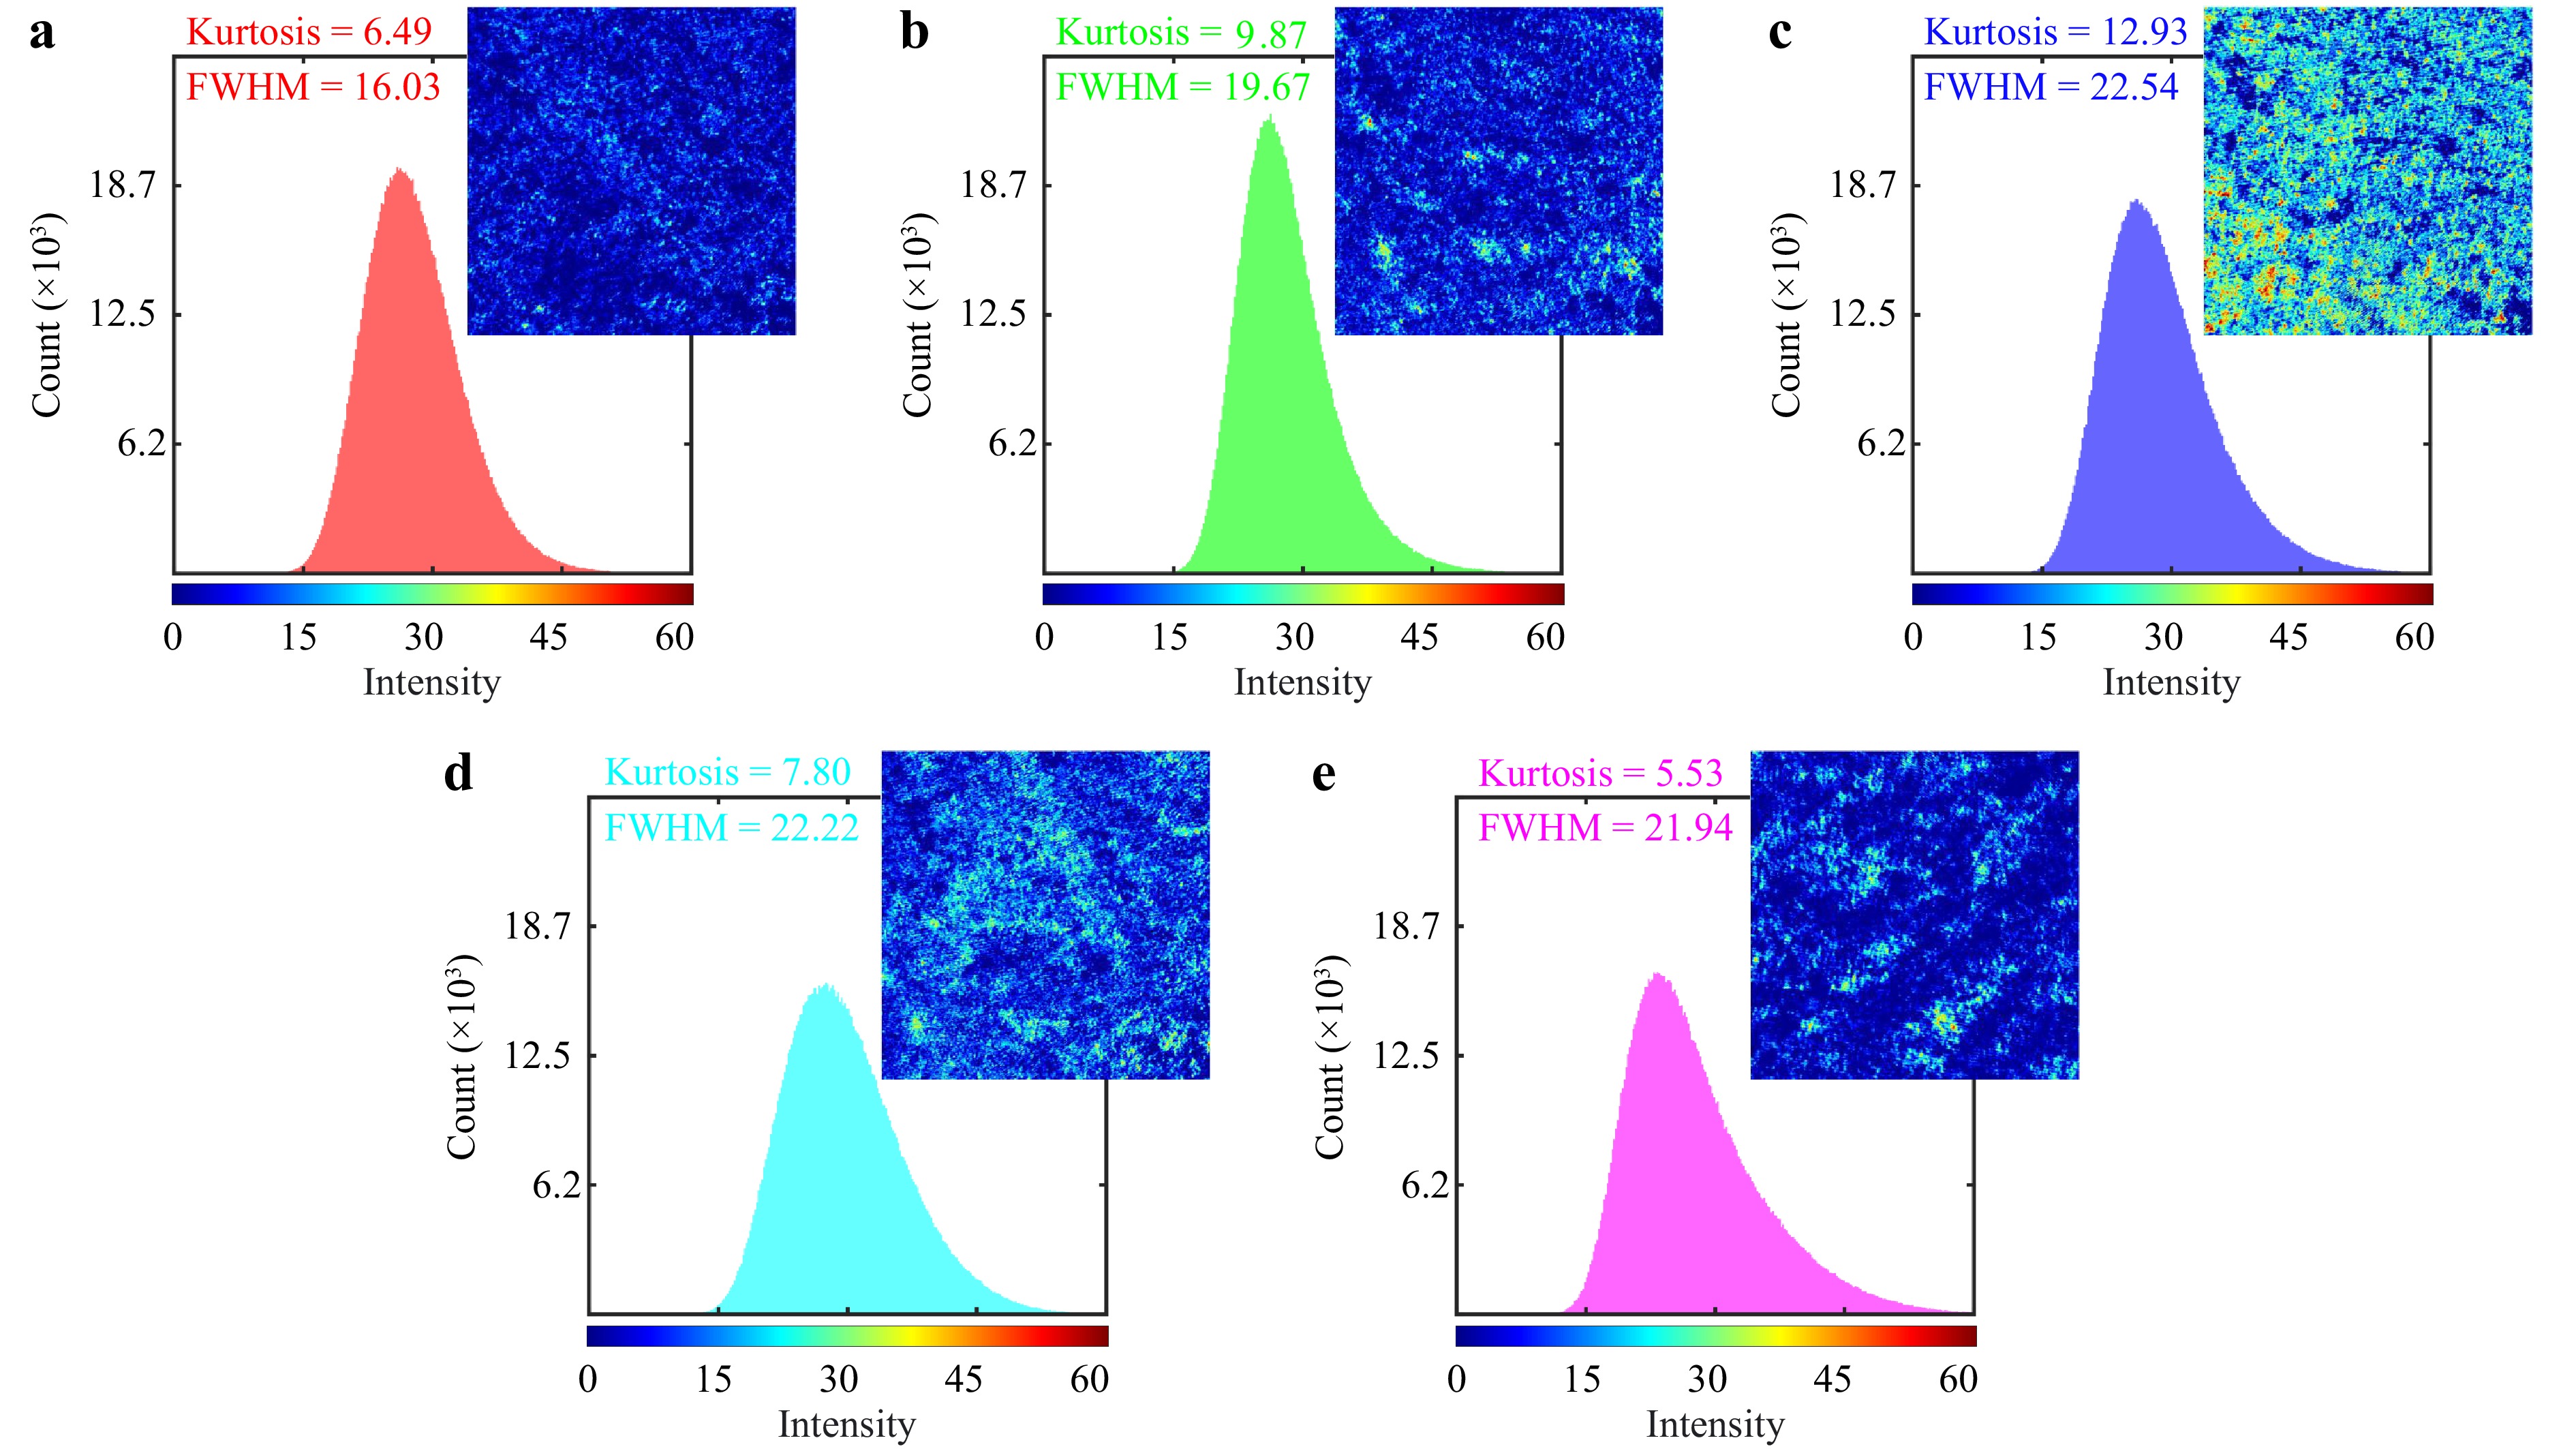
Fig. 8 Fujii 2D maps and associated intensity histograms for a GBM, b ependymoma, c meningioma, d medulloblastoma, and e low-grade glioma, extracted from the sequence of the polarimetric images for each of the samples. Each map's dimensions are 1280 pixels by 1024 pixels. The results, along with the computed FWHM of the histograms and kurtosis values of the maps, help distinguish among the different tumor types.
Furthermore, we applied the MHI visualization technique to the set of polarimetric images collected from each sample. Fig. 9 presents a comparative analysis of the MHI for the five different types of brain tumors. This innovative application of MHI allows us to track how each polarization state impacts different regions in the sample during a polarimetric experiment, all within a single map. As discussed, conventional methods may conflate the effects of various polarization states, obscuring the contribution of individual states. In contrast, our adapted MHI method assigns distinct color codes to these impacts, effectively visualizing which regions predominantly respond to specific types of polarization. For instance, within the Jet color map, regions are tracked and color-coded from blue to red, where blue represents areas primarily influenced by H polarization, and red highlights regions most responsive to L polarization.
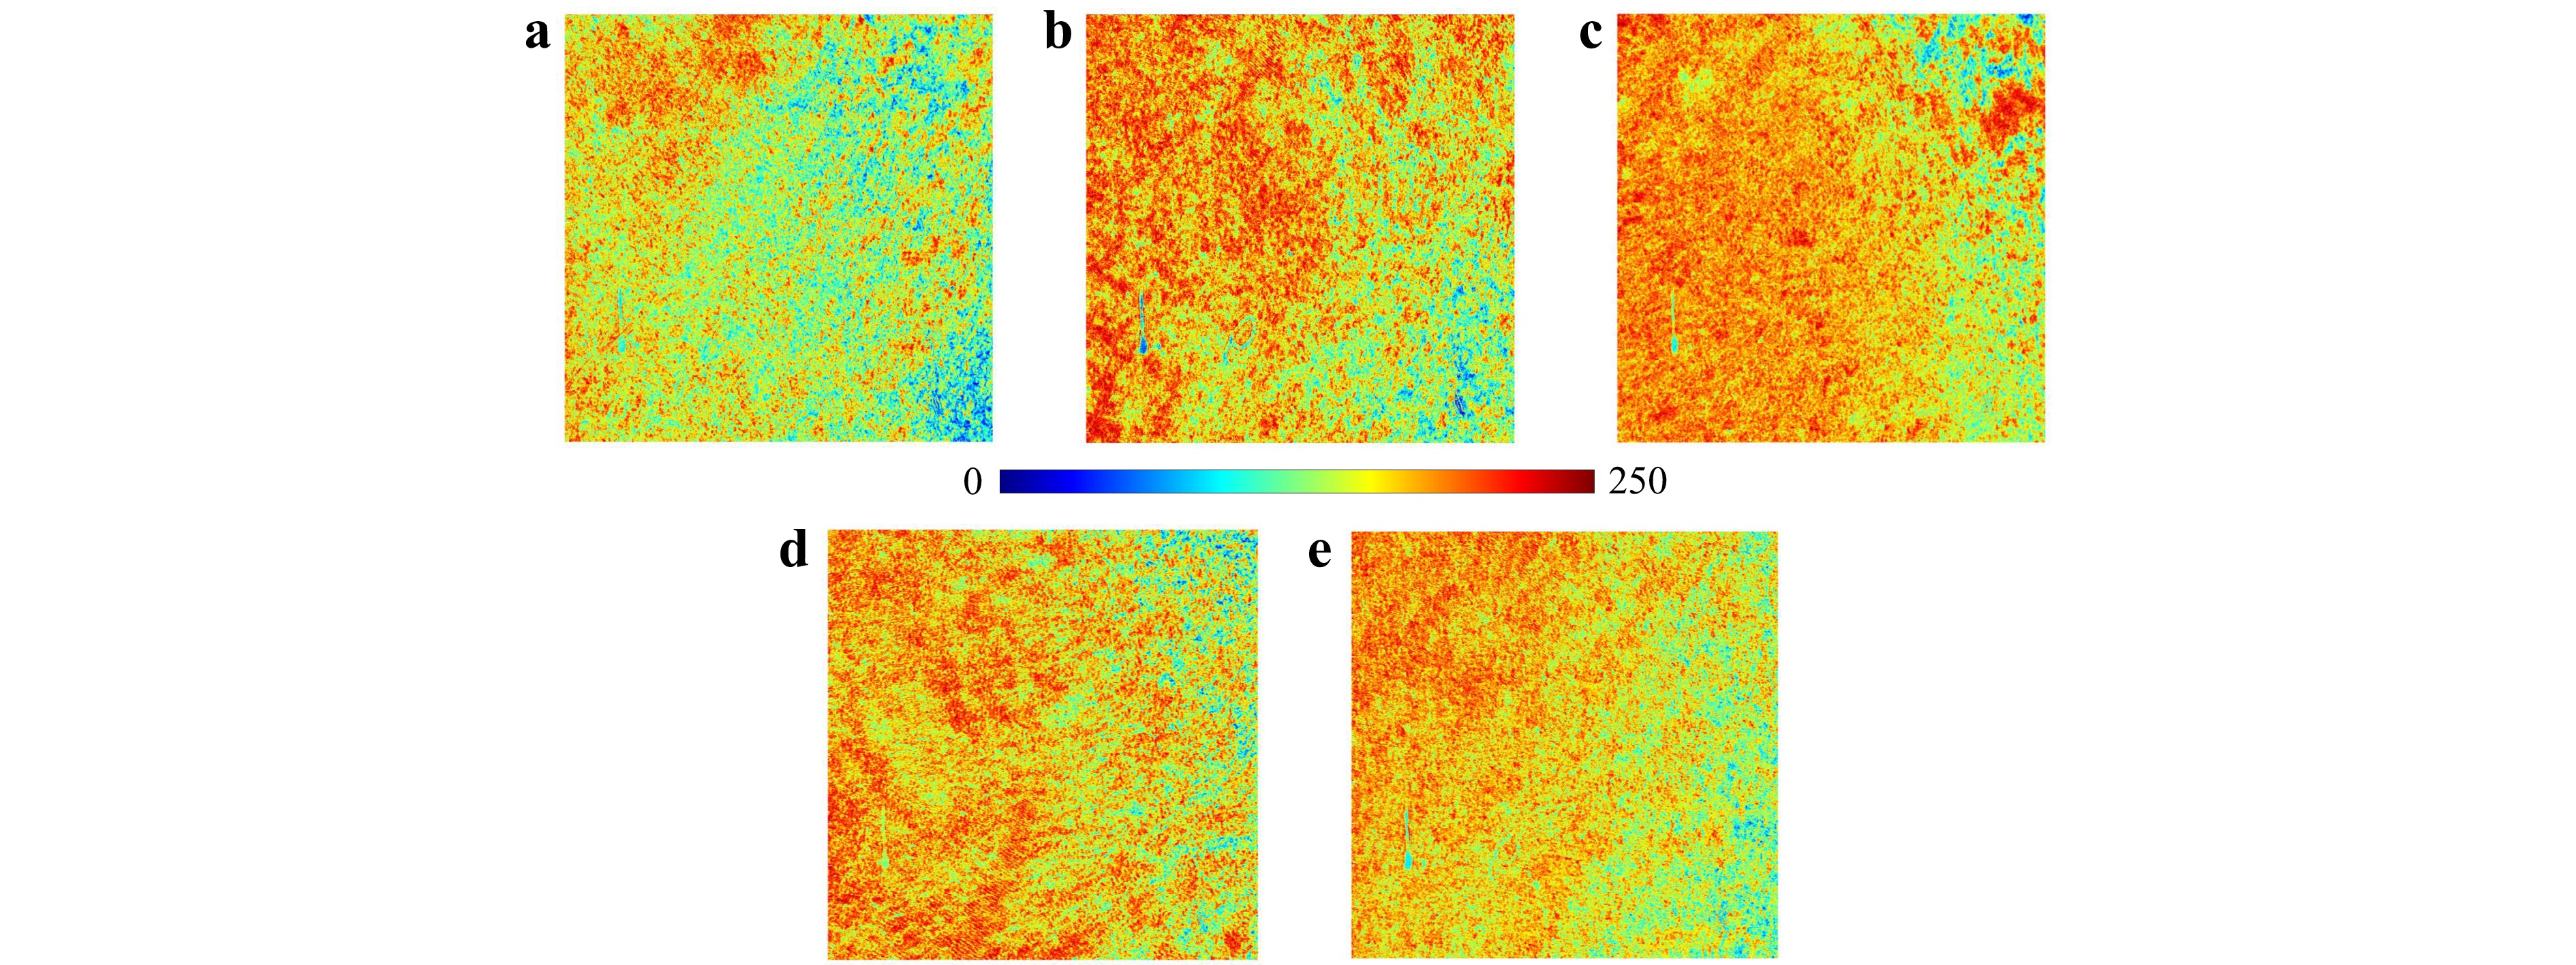
Fig. 9 The motion history image (MHI) for a GBM, b ependymoma, c meningioma, d medulloblastoma, and e low-grade glioma, generated from the sequence of polarimetric images. Each map has dimensions of 1280 pixels by 1024 pixels, with each pixel representing an area of 230 nm by 230 nm. These images color-coded the influence of distinct polarization states on specific regions in the samples during polarimetry, highlighting the contrasts and similarities among the samples.
We successfully tested our presented polarization-driven DLSA to differentiate various types of brain neoplasms in H&E-stained slides. The results demonstrate that this approach could further aid in the label-free diagnosis of tissues, providing accurate results comparable to conventional immunostaining methods, which are often associated with uncertainties. Our method can potentially be translated into the operating room to enhance the detection of white matter tracts during neurosurgery and achieve maximal resection of tumoral tissues, thereby minimizing the risk of recurrence and surgery-related morbidities. These preliminary results shed light on the underlying histopathological and mechanical tissue property differences among diverse types of brain neoplasms, aiding in distinguishing between diseased and healthy tissues19,79,80. As a prospect, small amounts of tissue could be analyzed intraoperatively using the presented polarization-driven DLSA for optimal surgical margin resection. This method could also help estimate the origin of tumoral cells and their histopathological nature as a label-free, real-time method. It is particularly suitable for patients with tumors in eloquent areas or deep-seated lesions where total tumor resection is not feasible. Building on previous evidence, laser speckle analysis has long been used as a strategy to assess viscoelastic tissue properties and precisely map pathological changes in tissues during carcinogenesis76,81. However, we acknowledge that this preliminary study faced limitations regarding sample size and issues related to pathological fixation (i.e., paraffin embedding), as previously reported82. We believe that this preliminary work, if translated into the clinic, could enhance the diagnostic process, improve surgical resection of tumoral tissues, and ultimately benefit patient outcomes.
-
We synergized the benefits of conventional polarimetry with DLSA, introducing an efficient optical approach to tissue analysis. We implemented the primary setup in transmission mode, but it can be easily adapted to reflection mode, enhancing its potential applications in diverse diagnostic settings. The simplicity, cost-effectiveness, non-invasivity, and rapid execution of this technique render it a highly promising tool for oncological diagnostics. Our approach addresses existing challenges in polarimetric imaging, such as image formation-related shortcomings and the complexity in data interpretation due to mixed tissue polarization characteristics within Mueller matrix elements and decomposition methods. The effectiveness of the proposed polarization-driven DLSA approach was demonstrated by differentiating among various types of brain tumors. Variations in polarimetric responses within the sample during polarimetric measurement cause changes in the speckle patterns observed in the recorded sequence of polarimetric images. We considered these intensity images as series of speckle frames, applying a variety of adapted numerical and graphical statistical post-processing methods tailored for DLSA.
The results showed significant discriminations among the tissue samples, reflecting variations in their polarization characteristics. The THSP method effectively represented sequence-based fluctuations in polarimetric responses within a sample by tracking intensity changes across the polarimetric images. GLCM quantitatively demonstrated the dispersion and transition frequencies of intensity values, highlighting the heterogeneity in the samples' polarization responses. The regular probability mass function provided a meaningful depiction of the statistical distributions, enriching the understanding of the polarization characteristics. The AC curves illustrated the correlation between pixel intensities across the sequence of images, serving as indicators of polarization characteristics. SE and STD values indicated different DoP for different tissue samples, with higher values corresponding to greater contrast and randomness in the intensity distribution. Additionally, the Fujii method produced detailed activity maps that highlighted the sensitivity levels of different regions within the samples to various polarization states. The MHI offered a traceable visualization of the variations in polarimetric responses within a sample in a single color-coded map, effectively distinguishing regions most affected by specific polarization configurations during polarimetric measurement.
The encouraging outcomes of our research mark a significant step forward in the field of medical diagnostics, opening new possibilities for non-invasive and efficient cancer tissue analysis. Future research will build on this foundation, focusing on the medical aspects and detailed clinical validation. Our goal is to broaden the scope of this methodology to encompass a larger variety and number of samples, and to involve machine learning and artificial intelligence-based classification, thereby expanding its application to more clinically oriented settings83.
-
V. A. would like to thank Prof. Joseph O'Sullivan, co-director of the Imaging Science program at Washington University in St. Louis, for his invaluable support and guidance.
Polarization-driven dynamic laser speckle analysis for brain neoplasms differentiation
- Light: Advanced Manufacturing 5, Article number: (2024)
- Received: 01 March 2023
- Revised: 05 August 2024
- Accepted: 06 August 2024 Published online: 12 November 2024
doi: https://doi.org/10.37188/lam.2024.043
Abstract: Early diagnosis of brain tumors is often hindered by non-specific symptoms, particularly in eloquent brain regions where open surgery for tissue sampling is unfeasible. This limitation increases the risk of misdiagnosis due to tumor heterogeneity in stereotactic biopsies. Label-free diagnostic methods, including intraoperative probes and cellular origin analysis techniques, hold promise for improving diagnostic accuracy. Polarimetry offers valuable information on the polarization properties of biomedical samples, yet it may not fully reveal specific structural characteristics. The interpretative scope of polarimetric data is sometimes constrained by the limitations of existing decomposition methods. On the other hand, dynamic laser speckle analysis (DLSA), a burgeoning technique, not only does not account for the polarimetric attributes but also is known for tracking only the temporal activity of the dynamic samples. This study bridges these gaps by synergizing conventional polarimetric imaging with DLSA for an in-depth examination of sample polarization properties. The effectiveness of our system is shown by analyzing the collection of polarimetric images of various tissue samples, utilizing a variety of adapted numerical and graphical statistical post-processing methods.
Research Summary
A simple yet efficient approach to tissue analysis synergizing optical techniques
This study synergizes polarimetry with dynamic laser speckle analysis, presenting a powerful non-invasive approach to tissue analysis. The concept is proved by differentiating different types of brain tumors. Variations in polarimetric responses within a tissue sample during polarimetric measurement cause changes in the speckle patterns observed in the recorded sequence of polarimetric images. This collection of intensity patterns is taken as a series of speckle frames, which are then analyzed using a variety of numerical and graphical statistical post-processing methods. The encouraging outcomes of our research mark a significant step forward in the field of medical diagnostics, opening new possibilities for label-free cancer tissue analysis.
Rights and permissions
Open Access This article is licensed under a Creative Commons Attribution 4.0 International License, which permits use, sharing, adaptation, distribution and reproduction in any medium or format, as long as you give appropriate credit to the original author(s) and the source, provide a link to the Creative Commons license, and indicate if changes were made. The images or other third party material in this article are included in the article′s Creative Commons license, unless indicated otherwise in a credit line to the material. If material is not included in the article′s Creative Commons license and your intended use is not permitted by statutory regulation or exceeds the permitted use, you will need to obtain permission directly from the copyright holder. To view a copy of this license, visit http://creativecommons.org/licenses/by/4.0/.





 DownLoad: