


-
Detecting and sensing infrared radiation is extremely important in various applications, such as optical communication, imaging and spectroscopy1–4. Mature semiconductor technologies, such as silicon in 400-1100 nm, InGaAs in 800-1600 nm, and HgCdTe in 3-5 μm, dominate the infrared photodetector market. A proper semiconductor material can be selected to cover a specific spectral band with unmatchable sensitivity, but without the chance to efficiently operate outside it. In the last few decades, this scenario has motivated the scientific research to exploit advances in nanofabrication of low dimensional structures to address this issue, as well as to increase the performance, lower the cost, simplify the fabrication processes, and reduce the size. High responsivities have been achieved with InAs nanowires and carbon nanotubes but these solutions still present different challenges5–7, especially the one aimed at spectrally broadening their operation. Although different approaches have been proposed for 2D materials with encouraging results for broadband infrared photodetection8,9, the take-home message is that methodologies to be adopted for broadening the operating spectral range compromises ineluctably the responsivity of the sensing element in the whole sensing band. For example, graphene-based infrared photodetectors have gathered special attention due to their gapless band structure10, making them highly suitable for broadband detection, but they are still characterized by low optical absorption which limits the ultimate responsivity11. In any case, photodetectors based on low dimensional structures are still far from mass production due to various issues, such as high output variability in material fabrication and processing9, that still need to be addressed.
A different approach can be identified in the surface and/or bulk modification of 3D-crystals to tailor their mechanical, electrical, and optical properties12–16. This strategy has been widely employed in photovoltaics applications, for enhancing the solar absorptance of photoconductive crystals. Many studies report on Black Silicon17–25, namely the enhancement of optical absorption of silicon in different spectral regions, from the visible to the far infrared range, through a surface functionalization of the crystal.
Ultra-fast pulsed laser processing represents one of the most promising techniques for tailoring the surface properties of a 3D-crystal. With respect to other methods based on photolithography or chemical etching, ultra-fast pulsed laser processing has various advantages: it is contactless, does not require pre-treatments or chemical processing of the crystal surface and its resolution is limited only by the depth of focus of the laser optics, with the potentiality to achieve fast processing over large areas26–28. This technique has been fully exploited in the surface texturing of diamond to extend and improve its optical absorption in the 0.2-2 μm spectral interval, still for photovoltaic applications29,30.
The idea behind this work is to use the same blackening approach widely used on silicon and on other photoactive mediums used for infrared photodetection, with the aim of extending the spectral range of the optical absorption over their natural absorption interval, without altering other figures of merit of photodetection, such as the responsivity and the response time. The optimal candidate is the quartz tuning fork (QTF), recently used as photodetector in tunable diode laser spectroscopy (TDLAS)31–33; this technique is also known as light-induced thermoelastic spectroscopy (LITES)34. The relevance of quartz as sensing element is strictly related to its piezoelectric properties. Several works have modelled the thermoelastic-piezoelectric phenomena for real cases, starting from various generalized thermoelasticity theories35–37. Photodetection in QTF is based on the thermoelastic conversion of absorbed radiation within the quartz in a polarization field, exploiting the piezoelectric nature of quartz38. The strong absorption at wavelengths greater than 5 μm allowed the achievement of responsivities up to 3 × 10³ V/W39,40. The blackening approach could be used in this case to extend the absorption of quartz also for wavelengths below 5 μm, where this material is almost transparent, without altering the performance at longer wavelengths.
In this work, we report on the realization of Black Quartz through ultra-fast laser surface processing. A femto-second (fs) pulsed laser was used to create matrices-like patterns of round craters on the surfaces of quartz crystal wafers. These matrices patterns had the goal of make the quartz transmittance low and flat in the wavelength range of interest. Finally, a proof of concept was demonstrated through implementation of two laser-textured QTF as photodetector in a LITES setup for detection of two water vapor absorption features at 1.39 μm and 7.38 μm.
-
The crystalline α-quartz with z-cut has a direct bandgap at the Γ point equal to 6.3 eV, causing a high optical absorption at wavelengths λ shorter than 200 nm. For λ > 200 nm, the quartz remains highly transparent until the first high broadband absorption vibrational mode appears around 6 µm40. The transmittance spectrum of a 0.25 mm-thick z-cut α-quartz sample, with dimensions of 25.4 mm × 25.4 mm and a 2° rotation along the x-axis, is shown in Fig. 1. The spectrum was recorded in the near- and mid-infrared regions using a Nicolet iS50 Fourier transform spectrometer.
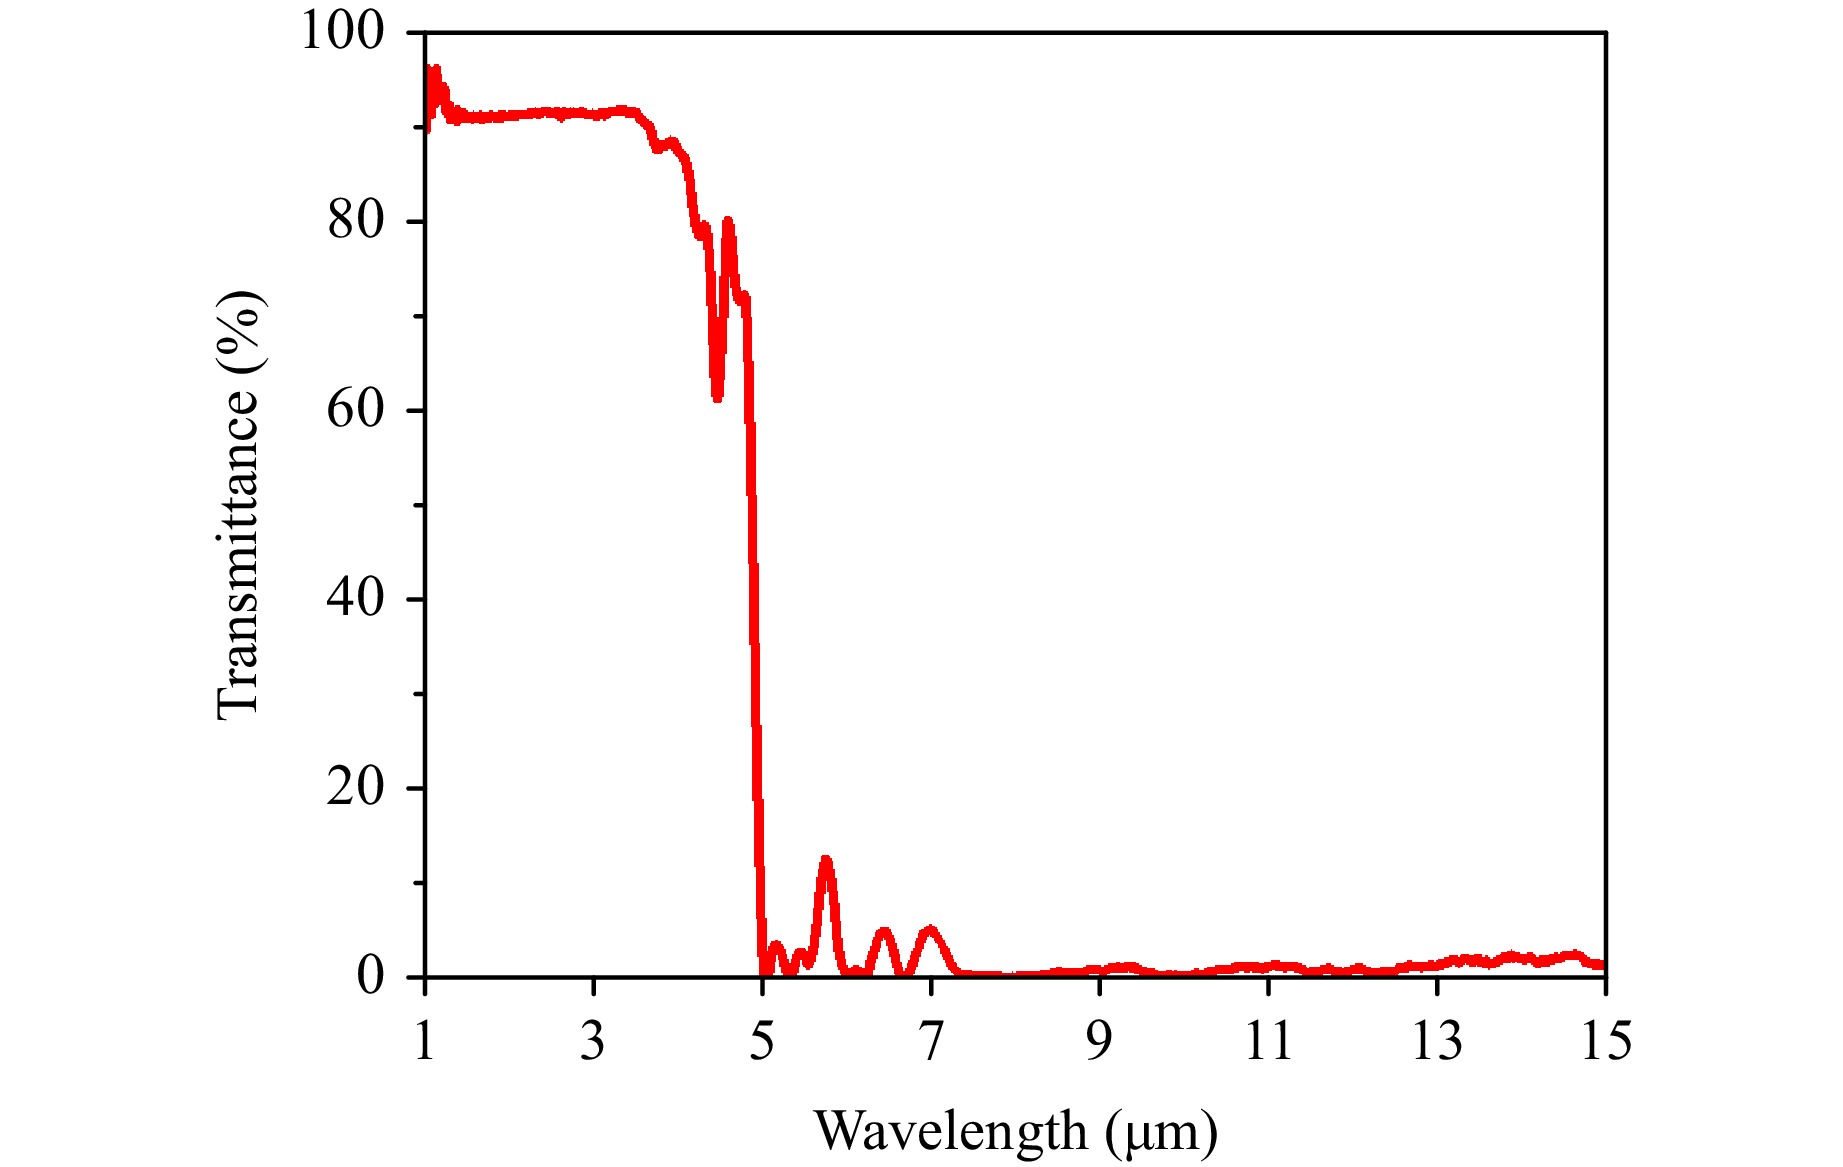
Fig. 1 Transmission spectrum of 0.25 mm-thick z-cut α-quartz.
The spectral dependence of the transmittivity in the range 1.0-15 µm shows a switching behaviour between transparency and opacity, with a sharp edge in the range 4-5 µm. At λ > 5 µm (named hereafter as the opaque region), the crystal is highly opaque meaning that all the electromagnetic infrared energy is deposited in the sample. Conversely, at λ < 4 µm (named hereafter as the transparent region), the optical properties change, and the quartz becomes highly transparent.
The enhancement of optical absorption in the near infrared range in a z-cut α-quartz has been obtained with surface micro structuring through irradiation by femtosecond (fs) laser pulses. The quartz was textured in ambient air with a pattern consisting of a localized matrix of ablated craters in an overall area of ~300 × 300 μm2.
Since the surface texturization was performed in open air, the potential incorporation of nitrogen atoms into the laser-textured surfaces cannot be entirely ruled out41. To investigate this, an energy-dispersive x-ray analysis (EDX) analysis on both laser-textured quartz and pristine material was performed. The results showed no significant differences between the spectrum of the textured and pristine samples, indicating that, if any external species were incorporated into the sample, their concentrations were too low to be detected. This surface treatment creates an array of micro-structures, resulting in a strong modification of the optical absorption properties arising from various phenomena occurring simultaneously. For example, localized lattice rearrangements during texturing process create surface defects which in turn lead to the formation of additional energy levels within quartz band-gap region, creating new excitation pathways for the carriers from the valence band to the conduction band29,42. Other phenomena occurring in enhancement absorption could be attributed to changes and distortions of the material band structure, as well as creation of lattice structural defects43,44. Also, the change of morphology reduces the reflectance of light on the surface, enhancing light absorption via multiple surface-confined reflections18. This light trapping effect on the surface is significantly promoted and enhanced by craters dimension (~30 μm), which is one order of magnitude greater than the target wavelength (1-5 μm)45,46.
Experimental optimization. The surface texturing of quartz was realized by designing localized matrices of craters using the setup shown at the beginning of the Materials and Methods section. A preliminary investigation was mandatory to establish the best operating conditions, namely the number N of laser pulses per crater and the centre-to-centre distance h between two consecutive craters. The values of laser fluence F (J/cm2) and N were chosen in order to be well above the threshold ablation of quartz47. The craters were analysed by studying the diameter D and the depth d trends, both as function of the number of pulses N.
Seven matrices were realized with different combinations of N and h, to investigate different craters depth and density. The laser fluence and the laser repetition rate were fixed at F = 10 J/cm2 and fR = 60 kHz for all matrices. In Table 1, the working parameters for each matrix are listed, together with the diameters and depths of the corresponding craters. The results of the characterization, in terms of depths and diameters of the craters, are also reported in Figs. S1 a and b (supplementary information), respectively.
Matrix N h [μm] D [μm] d [μm] M1 10 100 27.10 2.33 M2 10 50 27.10 2.33 M3 10 35 27.10 2.33 M4 20 50 32.45 5.86 M5 50 50 35.93 14.98 M 100 50 36.22 19.95 M* 100 40 36.22 19.95 Table 1. N (number of pulses) and h (center-to center distance) combination for each matrix, with the corresponding crater diameters D and depths d.
The optical transmission of each matrix was measured by using the setup reported in Fig. S2 (supplementary information) by employing five representative laser sources (Table S1 supplementary information) in the infrared range at the following wavelengths: 1.4, 3.3, 4.5, 5.2, 7.8 and 10.6 μm. With an area of approximatively 300 μm × 300 μm to be investigated, broadband light sources are not suitable because they cannot get a perfect collimation and a perfectly focused spot, since the focal spot size changes with the wavelength. The drawback is that some wavelengths might be focused on the textured area while others outside, compromising the reliability of the acquired spectrum. The optical transmission values are reported in Fig. S3 (supplementary information) as a function of the laser wavelength. For all matrices, the textured area does not alter the transmittivity of the quartz crystal for wavelengths longer than 5 μm, remaining always < 2%. Conversely, the surface texturing reduces the transmittivity at the shorter wavelengths. An absolute measurement of the spectral absorbance A of the textured area is not feasible because the dimensions of the textured area are too small to allow efficient use of an integrating sphere, which requires sample sizes of at least a few cm2. However, useful insights can be drawn regarding the reflectance R. For pure quartz in the 1-5 μm spectral range, the reflectance is generally below 10%48. Moreover, it is well established in the literature that blackening the surface further reduces the material’s reflectance45. According to the energy conservation law, the absorbance is related to the transmittance T through the relation A = (1 − T) − R. Before texturing, R is significantly smaller than (1 − T) and can therefore be neglected. After texturing, R decreases even further and A increases, allowing R to be neglected once again. Consequently, (1 − T) can be used as a reliable parameter to quantify the increase in absorbance resulting from surface texturization.
The matrices M and M*, which have the higher crater density, showed the highest absorbance values with respect to pristine quartz. In Fig. 2 are shown a representative cut-out of 2 × 2 craters of the textured areas (Fig. 2a, b) and the calculated 1-T values (Fig. 2c).
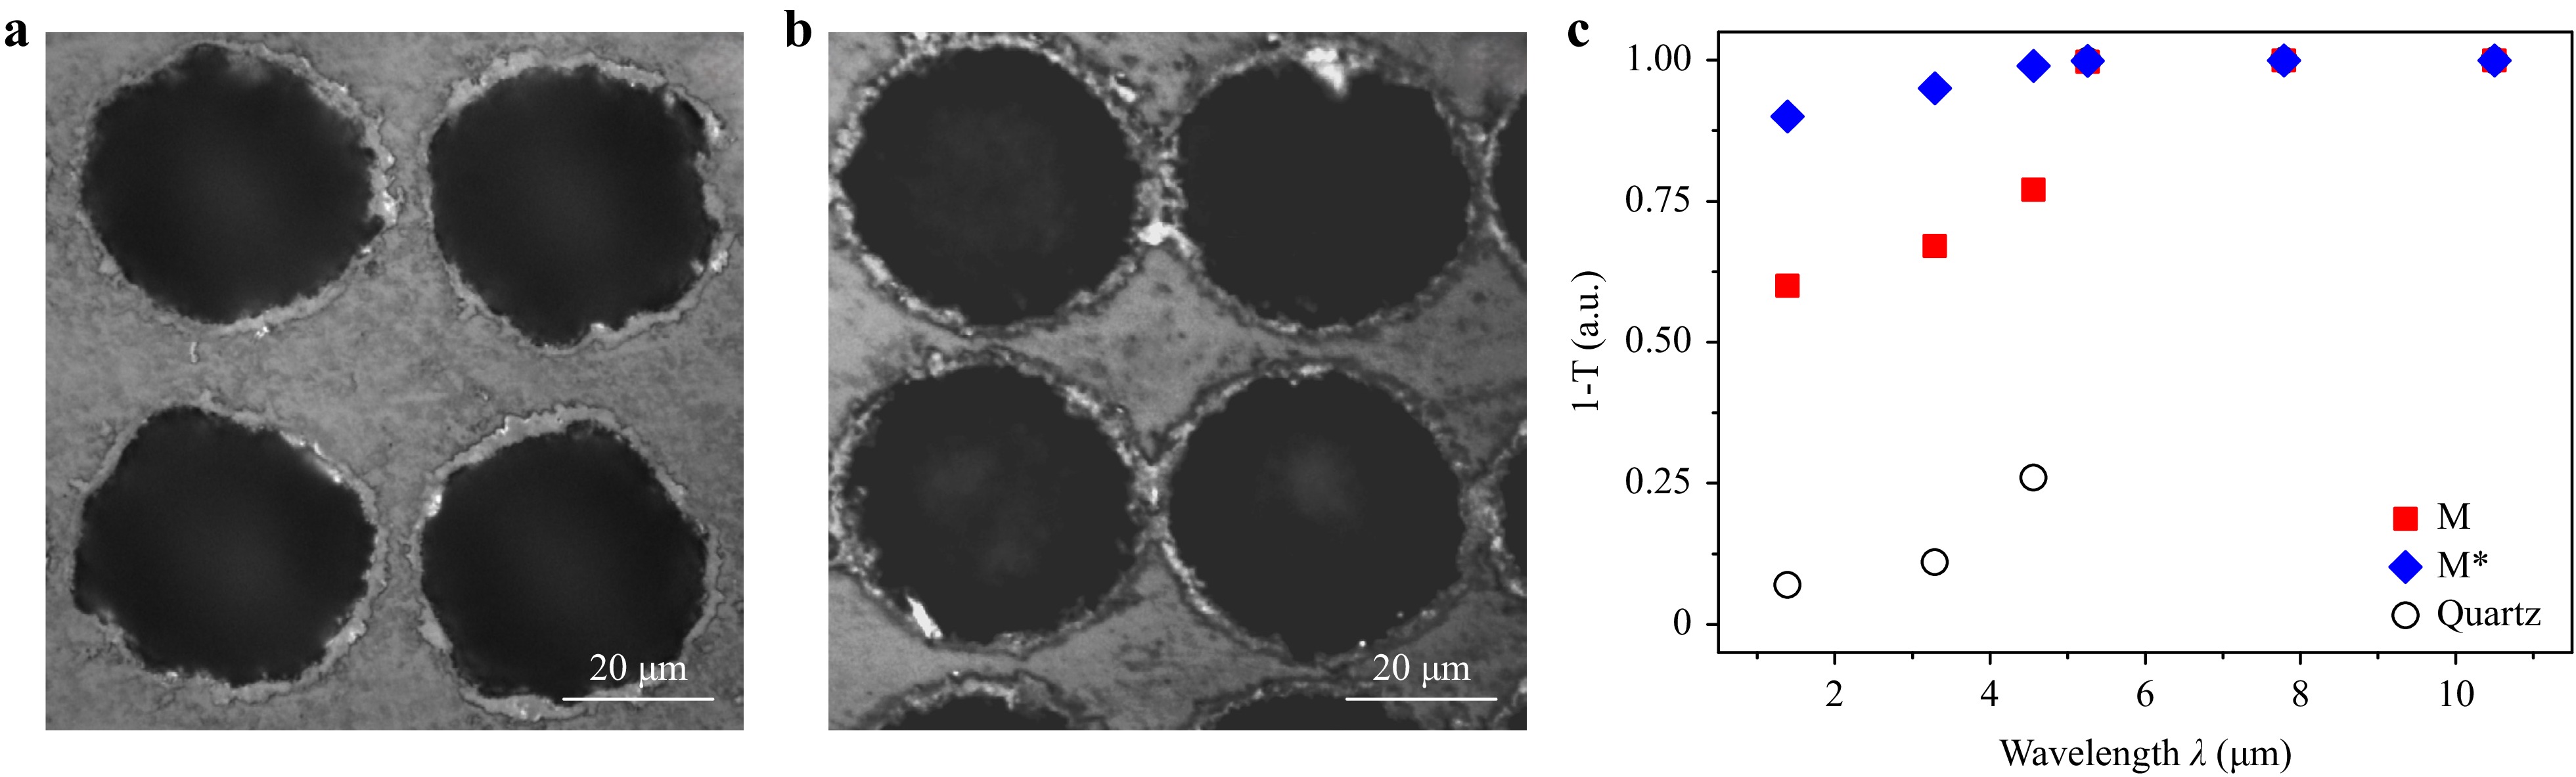
Fig. 2 Representative craters from a matrix M and b matrix M*, c 1-T spectrum of M, M* and pristine quartz.
M and M* were applied on two identical QTFs, having two prongs with length of 11 mm and thickness of 0.5 mm, separated by a spacing of 0.6 mm. They were realized starting from a double polished z-cut quartz wafers with a thickness of 250 μm, as those of the previous investigations49, using standard photolithographic techniques. The region of application of the two matrices was chosen in accordance with the working principles of QTF based photodetection34. When the radiation hits the surface of the QTF, photothermal energy is generated because of light absorption by the quartz. Due to the thermoelastic conversion, the photo-induced local heating creates elastic deformations that put prongs into vibration when the light is intensity-modulated at one of the QTF resonant frequencies. Thus, the induced strain field generates a local polarization, and charges appear on the surface of the QTF that can be collected by electrical contacts appropriately deposited along the QTF prongs. The strain field as well as the piezoelectric charges distribution are mainly localized at the prong clamped-end and for this reason the laser beam is focused near this region50. Therefore, the surface texturing has been realized in the form of localized matrices applied on the junction section between the clamped end of the prongs and the body of the QTFs, namely where the maximum strain occurs. A picture of the textured area applied to the two QTFs is shown in Fig. 3a, b. Hereafter, for ease of reading, the two textured QTFs will be referred to as the matrices applied to them, namely M-QTF and M*-QTF. The resonance curves of both QTFs were measured, before and after the laser texturing, to evaluate the impact of the laser texturing on the resonance properties of the QTF. A sinusoidal voltage excitation was provided to the QTF while the generated piezo-current was demodulated at the same excitation frequency by a lock-in amplifier. The resonances curves of M-QTF and M*-QTF were reconstructed by varying the excitation frequency, and the results are shown in Figs. 3c, d.
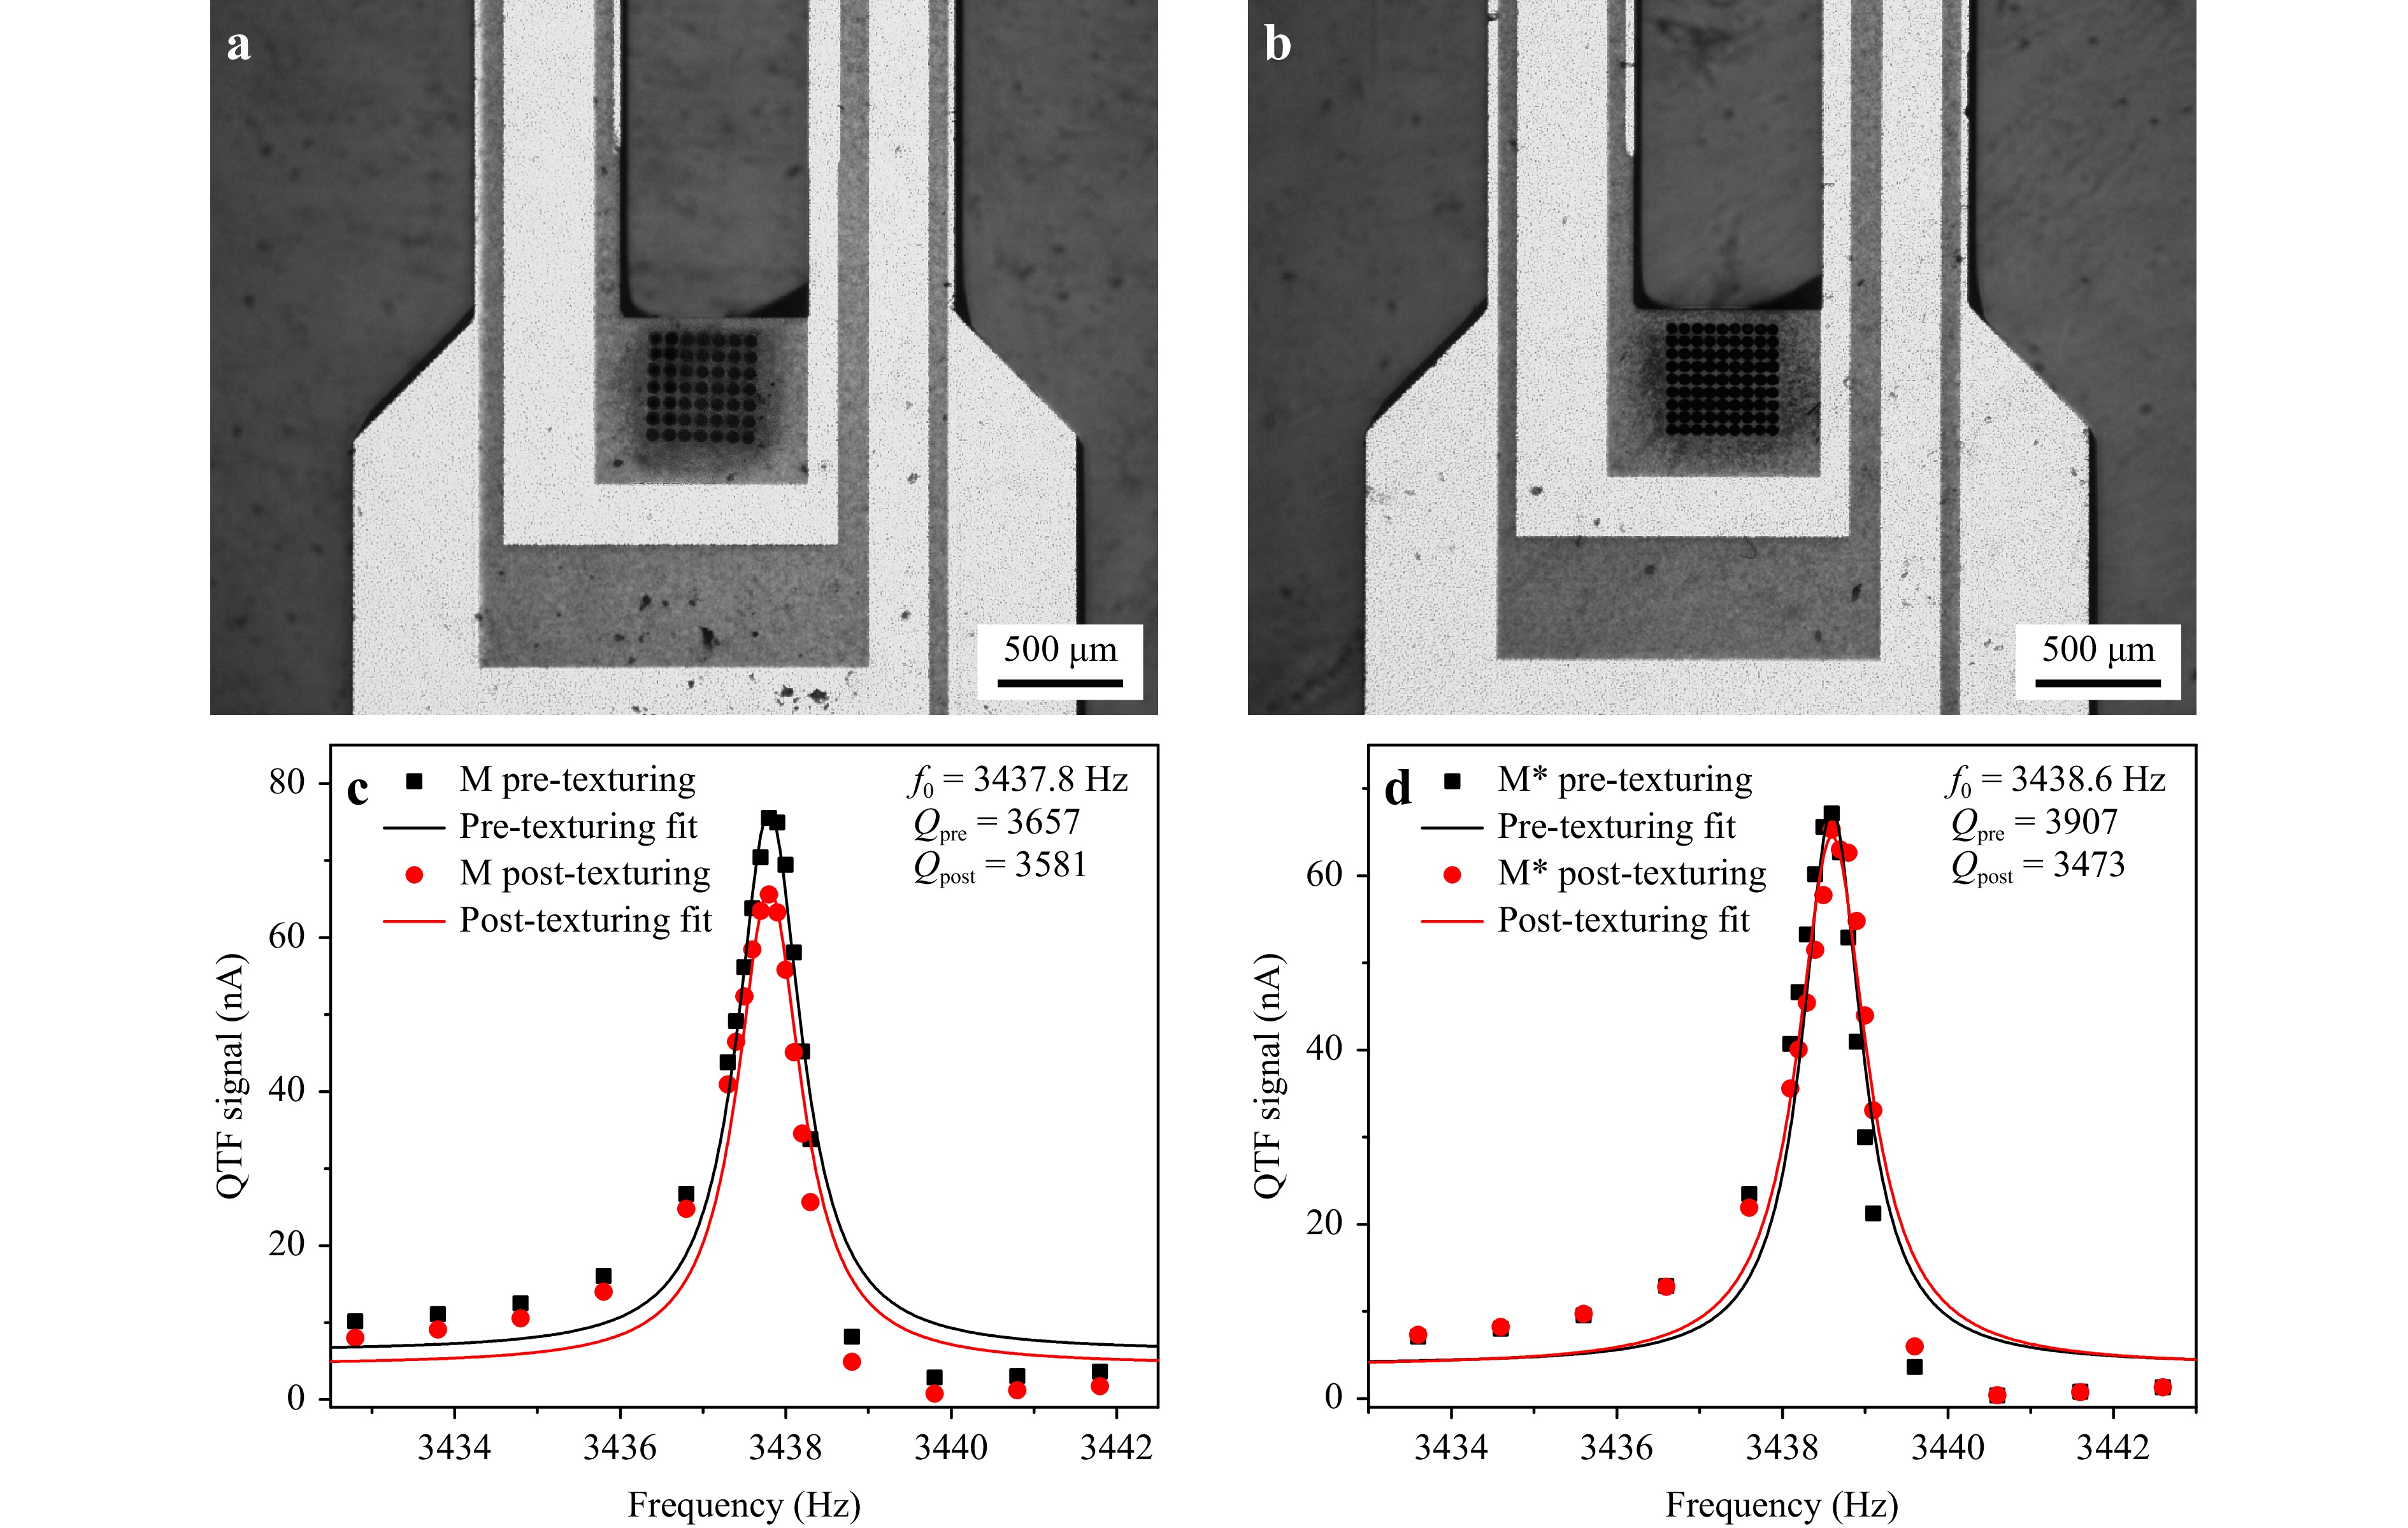
Fig. 3 Pictures of the two laser-textured QTFs a M and b M* together with their electrical response, c, d, fitted with a Lorentzian function, before and after texturing.
Following the Butterworth-Van Dyke model, the equivalent circuit of a QTF can be modelled as an RLC circuit with a parallel stray capacitance (see Fig. 7a in the Materials and Method Section). The circuit analysis reveals that an increase in stray capacitance induces a right-left asymmetry relative to the peak value51. The data points were fitted with a Lorentzian function to retrieve both the resonance frequency and the quality factor (Q-value). No frequency shifts were observed in both cases. A negligible reduction of 3% in Q-value (from 3657 to 3581) was observed for M-QTF after the texturing, while the Q-value for M*-QTF dropped from 3907 to 3473 (11%) due to a higher density of craters, locally modifying the mechanical properties of the junction zone between the clamped prong end and the quartz support. This was expected because one of the loss mechanisms for a QTF is the interaction of the vibrating prong with the support52, which causes part of the mechanical vibrational energy of the prong to be lost by the support per each oscillation cycle. Altering the crystalline area in the junction with localized surface defects creates additional channels for dissipation, deteriorating the Q-value. However, a drop of 11% in the Q-value is expected not to significantly degrade the overall piezoelectrical properties of both QTFs.
QTFs as photodetector in a TDLAS setup for water detection. M-QTF and M*-QTF were used as a photodetector in a TDLAS setup for water vapor detection in air, at room temperature and atmospheric pressure, together with a bare QTF (named hereafter as B-QTF) with the same geometry as M-QTF and M*-QTF but without textured area, used as reference for highlighting the performance of the textured QTFs. The resonant frequency and the quality factor of B-QTF were measured equal to f0 = 3441.1 Hz and Q = 4001. The schematic of the TDLAS setup is reported in Fig. S4 (supplementary information). The setup was assembled for accommodating two interchangeable sources, a diode laser (DL) targeting the water absorption line at 7194.80 cm−1 (1.39 μm) with an absorption cross-section of 1.73 × 10⁻²² cm2 molecule−1 and an optical power of 20 mW, and a quantum cascade laser (QCL) for the detection of the water line at 1354.83 cm−1 (7.38 μm) with an absorption cross-section of 3.30 × 10⁻²¹ cm2 molecule−1 and an optical power of 50 mW. The spectral profile of the cross-sections of both absorption features were simulated by using HITRAN database and reported in Fig. S5 (supplementary information). The DL emission falls within the transparent spectral region of the quartz, while the QCL in the opaque spectral region of the quartz (see Fig. 1). In this way, the effect of the texturing on the infrared photodetection in the transparent region could be analysed as well as the potential alteration of the performance in the opaque spectral range. After passing through an open pathlength of 10 cm, the laser beam was focused on the textured area of M-QTF or M*-QTF; for B-QTF the laser beam was focused on the same position as for textured QTFs. For both laser sources, the TDLAS sensor operated in wavelength modulation and 2f-detection (2f-WM): the current driver was modulated at a half of the QTF resonance frequency and the acquired signal demodulated at the resonance frequency by means of a lock-in amplifier. A 10 mHz ramp signal was also superimposed to the current driver to linearly tune the wavelength emission and scan across the absorption feature. A room dehumidifier fixed the water concentration in the laboratory environment at 50% RH with a stable temperature of 19°C. The water vapor concentration was continuously monitored with a room hygrometer, and variations of ± 2% were recorded throughout the duration of all measurements reported hereafter. Such minor fluctuations are not significant enough to impact on the spectral reconstruction of the water vapor absorption line. Fig. 4a reports the spectral scans of the water absorption line at 1.39 μm (using the DL) when the three QTFs were alternatively used, while Fig. 4b shows the 2f-WM spectral scans detected at 7.38 (using the QCL) employing the same QTFs.
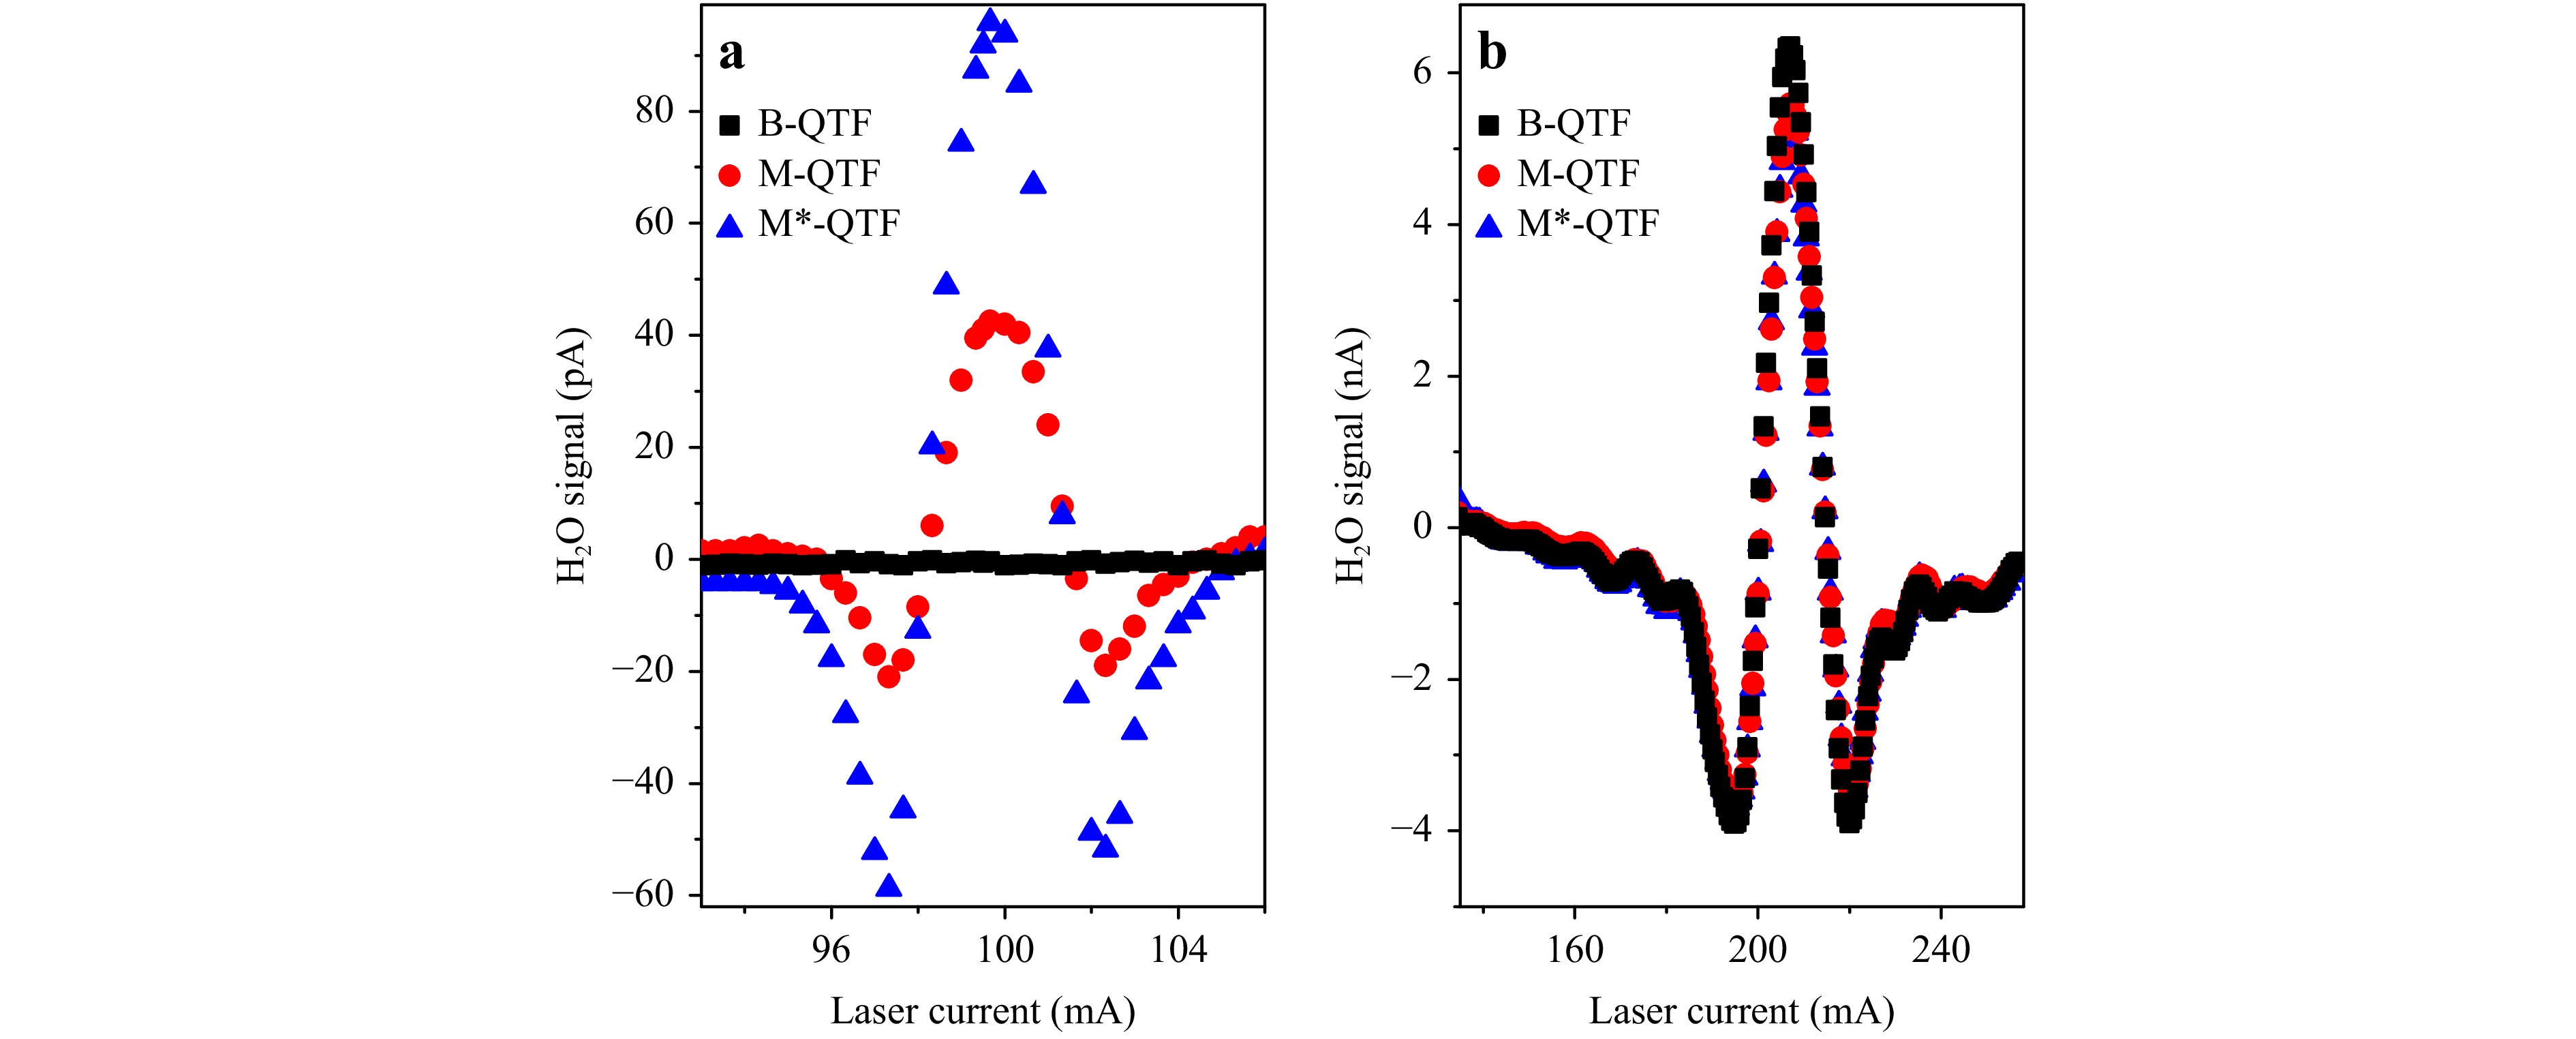
Fig. 4 a 2f spectral-scans of water at 1.39 μm from B (black squares), M (red dots) and M* (blue triangles); b 2f spectral-scans of water at 7.38 μm from B (black squares), M (red dots) and M* (blue triangles).
As expected, Fig. 4a shows that no absorption feature was retrieved using B-QTF as photodetector because of the quartz transparency at 1.39 μm: the release of the optical energy in the quartz was too low for inducing localized thermoelastic effects. Conversely, the textured area in M-QTF and M*-QTF enabled the surface optical absorption, and, in turn, the modulated optical energy was converted in resonant mechanical vibrational energy, generating a piezoelectric polarization field. The peak signals were used to estimate the responsivity of both textured QTFs at 1.39 μm, using the model proposed in the Methods Section. The responsivities R for M-QTF and M*-QTF at λ = 1.39 μm were RM = 6.35 μAW−1 and RM* = 14.6 μAW−1, respectively.
Fig. 4b shows that, at 7.38 μm, the absorption feature of the water line was well reconstructed with the three QTFs. The peak signal retrieved with the B-QTF, equal to SW = 6.35 nA, is only ~12% and ~16% higher than signals acquired with M-QTF and M*-QTF, respectively. These percentages are comparable with the values of the ratio between the Q factors of M and M* and that of B: QM/QB = 10% and QM*/QB = 13%. The responsivity for M*-QTF at λ = 7.38 μm was estimated as 17.0 μAW−1, comparable with the measurement at 1.39 μm (14.6 μAW−1). The responsivity for M-QTF at λ = 7.38 μm was estimated as 19.0 μAW−1. RM at λ = 7.38 μm is three time its value at λ = 1.39 μm: this difference is related to a less efficient mechanism of thermoelastic conversion of M-QTF at lower wavelengths caused by its lower values of absorbance (see Fig. 2c). Thus, two conclusions can be drawn: i) the texturing does not alter the performance of a QTF-based photodetector in the opaque spectral region; ii) the detector can be used both in the opaque and transparent spectral region with comparable performance, opening the way to a broadband infrared detection without a significant normalization due to spectral-dependence of the responsivity.
-
The long-term stability of the M*-QTF was studied through an Allan-Werle deviation analysis53, which related the noise level with the signal integration time, as described in the Methods section. The 7.38 μm-QCL was locked to 140 mA, far from the water absorption feature. The M*-QTF signal was acquired for three hours with an integration time t of 0.1 s. The results are shown in Fig.5.
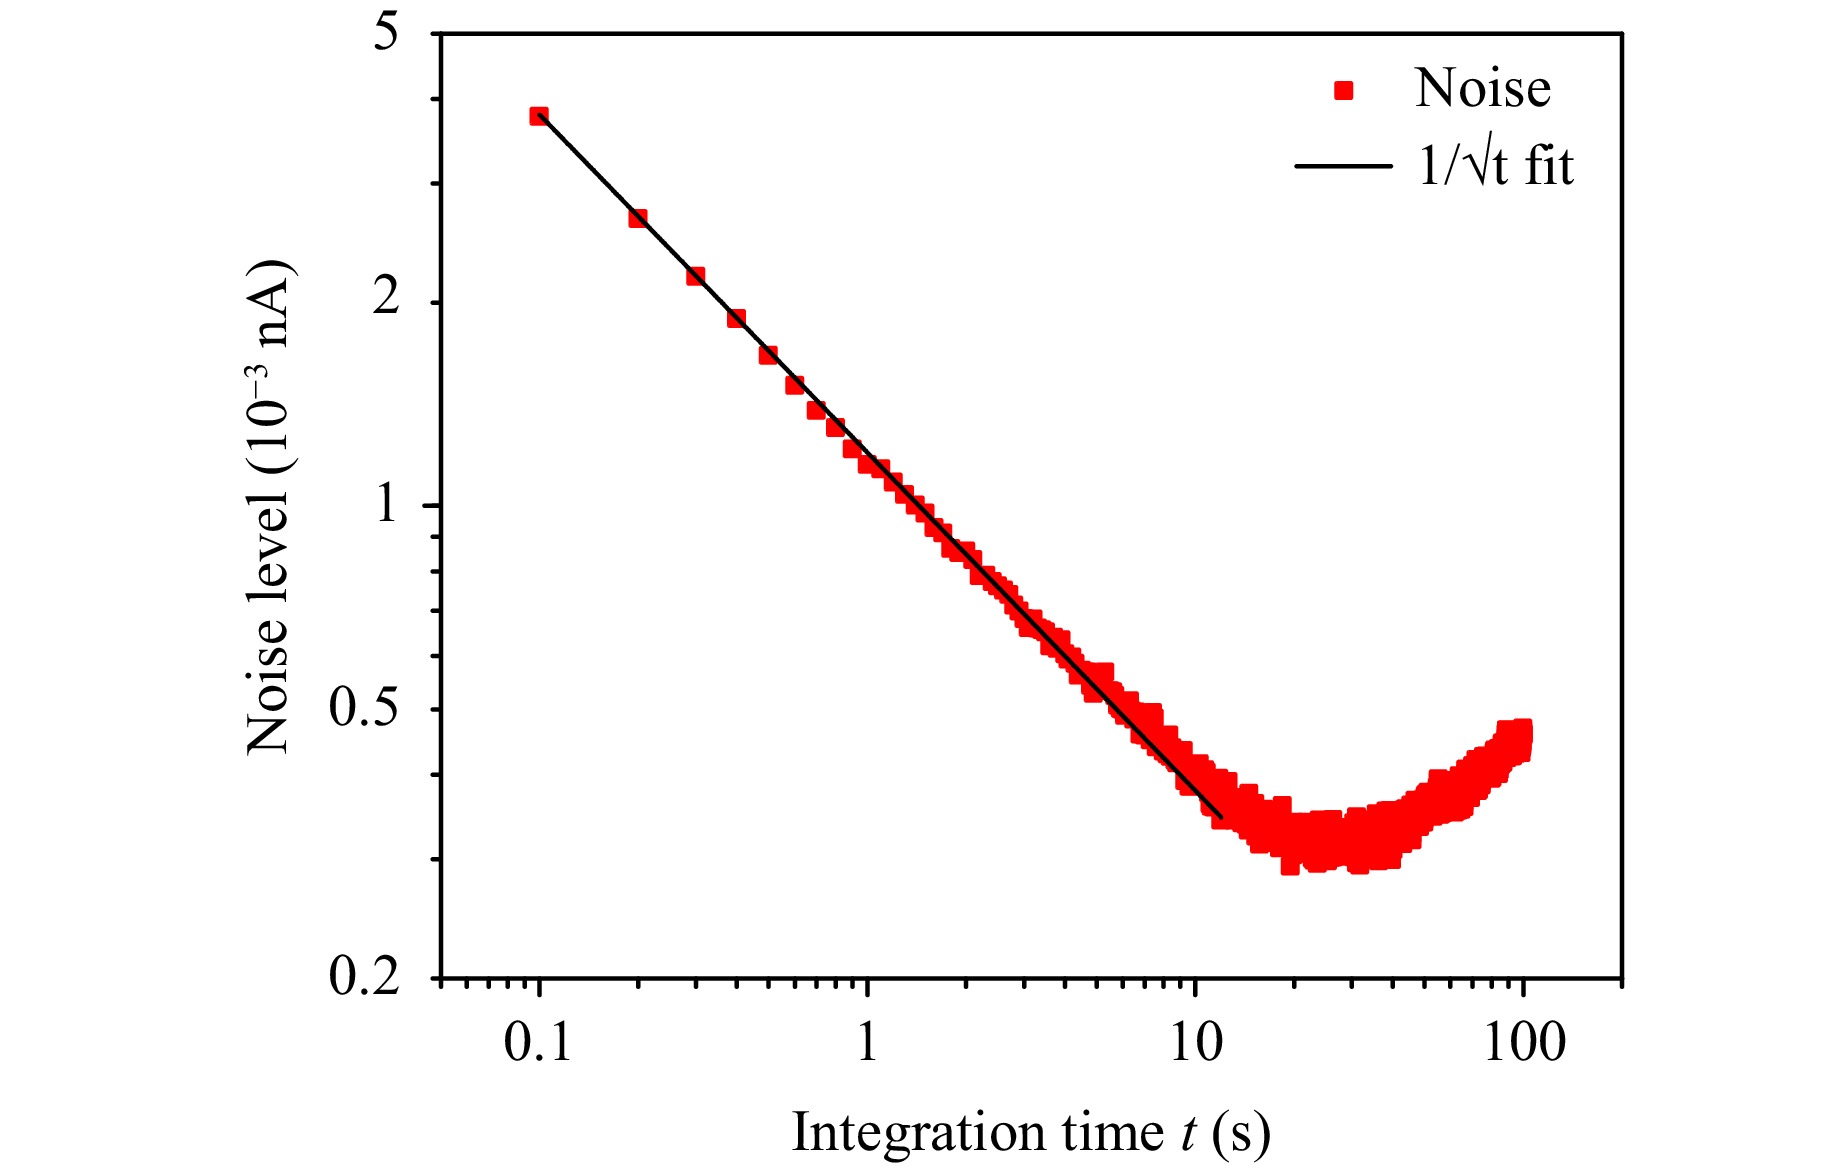
Fig. 5 Plot of M based sensor noise level as a function of integration time, determined using Allan-Werle deviation analysis, fitted with an inverse square root of t function.
The noise level decreased as the integration time increased up to 30 s, following the expected trend ~1/√t, pointing out that the main contribution to photodetector’s noise was due to the QTF thermal noise. For integration times longer than 100 s, the noise started to deteriorate. This behaviour was ascribed to mechanical instabilities of the sensor, i.e., laser instability, mechanical vibrations, etc. which affect the performance of the sensor at long integration times.
-
In this work, we report on the first realization of Black Quartz through ultra-fast laser surface texturing aimed at extending the optical absorption of the crystal for wavelengths shorter than 5 μm. The approach consisted of designing squared matrices of ablated craters on a 250 μm thick quartz wafer. Seven different matrices were realized at fixed laser fluence F and repetition frequency fR, while varying both the number of laser pulses N and the craters center-to-center distance h. A decrease in the material transmittance T related both to the density and the depth of the craters was found in the transparent region of pristine quartz. The two most performant matrices were applied to two identical QTFs and used as photodetector in a TDLAS setup. First, it was verified that the laser texturing did not alter the electrical properties of the two QTFs: the resonance curves of both QTFs were compared before and after the laser texturing and negligible deterioration of the Q value was verified. Then, the two QTFs were mounted in a TDLAS setup to detect two water absorption features, one at 1.39 μm and another one at 7.39 μm. The tests clearly demonstrated that the laser texturing enabled the infrared optical absorption in the transparent region, without impacting on the performance in the opaque region, providing an efficient extension of the optical absorption from near to mid infrared range up to 10 μm.
This work represents a starting point for future developments of Black Quartz. Other surface texturing patterns different from crater-matrix layout could be now investigated, like e.g. continuous texturing over a more extended area or crossed grooves, to stimulate a comprehensive study on the dependence of the optical absorption on the surface topography. Moreover, further studies could be conducted on the optimization of the QTF design for relating the thermoelastic conversion and the piezoelectric charge generation with the dimension and the position of the microstructures, with the aim at improving the responsivity of a QTF-based infrared photodetector.
-
The experimental setup used to perform the laser texturing of quartz wafers and QTFs is shown in Fig. 6.
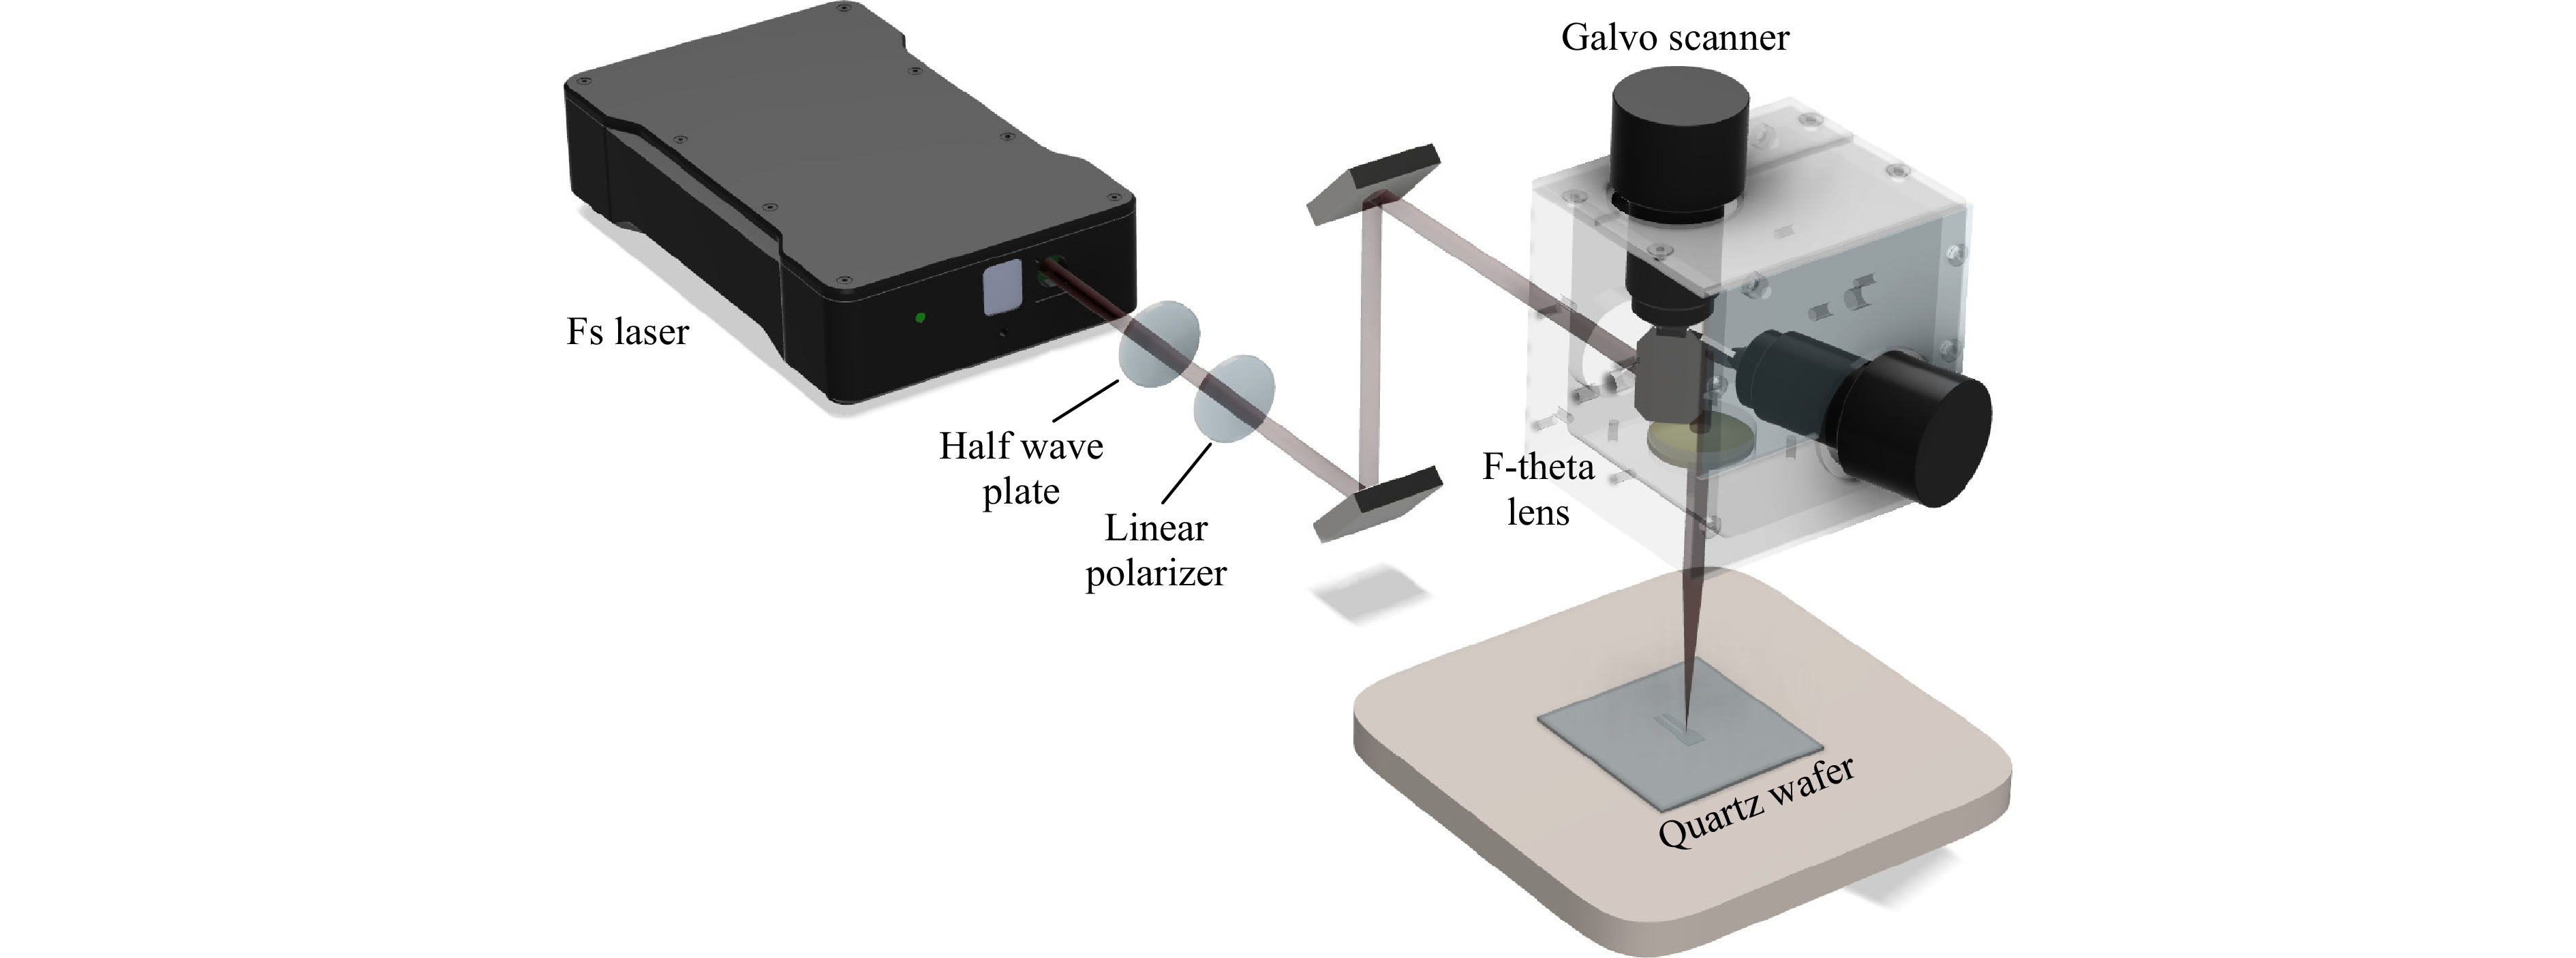
Fig. 6 Schematic representation of the apparatus for superficial laser-texturing of quartz wafer.
The quartz wafers were provided by Nano Quartz Wafer GmbH. They consisted in double polished z-cut quartz wafers with an extension of 24.5 × 24.5 mm2 and a thickness of 250 μm. The employed laser source was a Pharos SP 1.5 from Light Conversion. This source emitted laser pulses whose temporal duration was tuneable from 190 fs to 10 ps. The emitted beam was centred at a wavelength of 1030 nm with a Gaussian-like profile with M2 = 1.3. The maximum average laser power was 6 W corresponding to a maximum pulse energy of 1.5 mJ. The repetition frequency fR was tuneable from single pulse to 1 MHz. The laser beam was emitted from the source with linear polarization. A half-wave plate and a polarizer were coupled to fine tune the laser beam power. The linear polarizer transmitted the P-component of polarization. The laser beam was directed to a PC-controlled galvo scanner SCANLAB intelliSCANSE 14 coupled with a 100 mm F-theta lens. The estimated laser diameter in air was 28 μm. The samples were placed in the focal plane of the F-theta lens.
The samples were imaged using an optical microscope (Nikon Eclipse E600). A Scanning-Electron-Microscope (SEM) from Zeiss (Mod Sigma, Germany) was employed to perform an energy-dispersive x-ray analysis (EDX).
-
When a monochromatic radiation at optical frequency $ \nu $, modulated at a mechanical frequency f, hits an infrared photodetector, the spectral responsivity can be expressed as:
$$ R\left(\nu ,f\right)=\frac{S\left(nf\right)}{{\mathrm{\Delta }P}_{nf}\left(\upsilon \right)} $$ (1) where S(nf) is the photodetector signal demodulated at f or one of its subharmonics (nf, with n = 2,3…) and ΔPnf is the amplitude of the power modulation. In 2f-WM and derivative spectroscopy, the 2f-WM peak signal can be approximated as:
$$ \mathrm{\Delta }{P}_{2f}=\frac{{P}_{0}}{4}{\alpha ''}\left({\upsilon }_{0}\right)\mathrm{\Delta }{\upsilon }^{2}L $$ (2) where α''(ν0) is the second derivative of the absorption coefficient and ν0 is the peak frequency of the absorption coefficient54. Assuming a Lorentzian lineshape, the second derivative in ν = ν0 is:
$$ {\alpha ''}\left({\upsilon }_{0}\right)=\frac{2\sigma \left({\upsilon }_{0}\right)Nc}{{\gamma }^{2}} $$ (3) where σ(ν0) is the absorption cross section at the absorption peak, as provided by the HITRAN database, c is the water concentration in air, $ \gamma $ is the half-width at half-maximum of the Lorentzian line, and N the molecular density, that can be related to thermodynamic parameters by the ideal gas law approximation. In the TDLAS with 2f-WM detection, the peak signal of the 2f-absorption feature is maximized when the modulation depth Δν ~ ϒ. With this assumption, the responsivity $ R\left({\nu }_{0}, 2f\right) $ becomes:
$$ R\left({\nu }_{0}, 2f\right)=\frac{S\left(2f\right)}{\dfrac{{P}_{0}}{2}\sigma \left({\upsilon }_{0}\right)NcL} $$ (4) Both temperature (T) and relative humidity (RH) values are used to calculate the absolute water concentration in air in %-unit using the following equations:
$$ c={10}^{2}\frac{{P}_{w}}{P-{P}_{w}} $$ (5) $$ {P}_{w}={P}_{ws}\frac{RH}{100} $$ (6) $$ {P}_{ws}=6.11\cdot {e}^{\frac{17.7\cdot T}{T+243.57 ^\circ{\rm C}}} $$ (7) where P is the ambient pressure (760 Torr), Pw is the water vapor pressure, and Pws is the saturated water vapor pressure. With T = 19°C and RH = 50%, the water concentration results c = 1.4%.
-
The Butterworth-Van Dyke model is largely used to simulate the electrical behavior of a QTF. However, to simplify the overall transfer function at the output signal of the QTF, the Butterworth-Van Dyke model can be replaced by its equivalent Norton model, according to the scheme shown in Fig. 7.
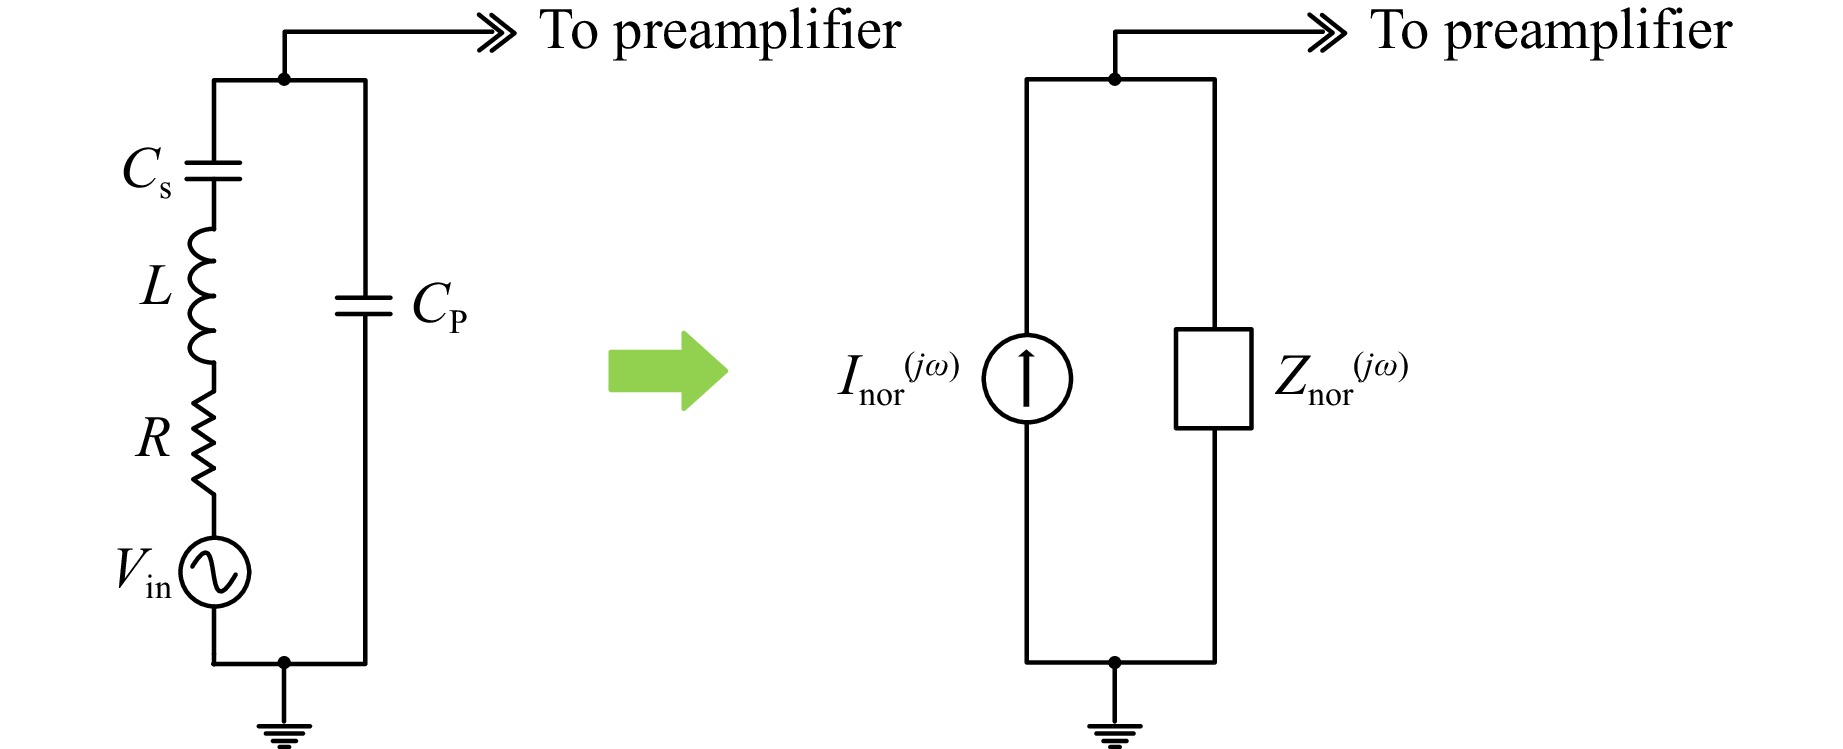
Fig. 7 aThe Butterworth-Van Dyke model of the QTF. b Norton equivalent model of the QTF. Inor(jω) is the equivalent current and Znor(jω) the impedance of the QTF.
The QTF is represented as the parallel connection between an equivalent current source Inor(jω) and the impedance Znor(jω) of the QTF, where ω = 2πf. Inor(jω) is the current that flows between the QTF pins if they are short-circuited and its expression can be easily derived as:
$$ {I}_{nor}\left(j\omega \right)={V}_{in}\cdot \frac{j\omega {C}_{s}}{\left(1-{\omega }^{2}L{C}_{s}\right)+j\omega R{C}_{s}} $$ (8) where $ {V}_{in} $ is the excitation voltage and $ R $, $ {C}_{s} $ and $ L $ are the resistance, the capacitance and the inductance of the Butterworth-Van Dyke model of the QTF, respectively. The series-resonant frequency fS of the QTF can be calculated as a function of its electrical parameters:
$$ {f}_{S}=\frac{{\omega }_{S}}{2{\text π} }=\frac{1}{2{\text π} \sqrt{L{C}_{S}}} $$ (9) as well as its quality factor Q:
$$ Q=\frac{1}{{\omega }_{S}R{C}_{S}} $$ (10) Thus, a scan of the excitation angular frequency ω nearby the series-resonant angular frequency $ {\omega }_{S} $allows the reconstruction of the spectral response of the QTF. Then, the resonance frequency and the quality factor can be easily retrieved by extracting the peak value $ {f}_{0} $ and the full-width at half-maximum value Δf of the Lorentzian fit of the curve, respectively, being Q =$ {f}_{0}/\Delta f $.
-
The minimum detection limit represents the most important figure of merit of any gas sensor, since it corresponds to the gas concentration providing a signal-to-noise ratio equal to 1. Thus, its calculation passes though the estimation of the noise level, which is usually measured as the 1σ deviation of a set of signals acquired with an integration time τ, with the laser locked on the absorption peak and fixed conditions imposed in the absorption cell. It goes without saying that the noise level, and so the minimum detection limit of a sensor, can be improved by further increasing τ. Theoretically, the signal from a perfectly stable system could be infinitely averaged; however, a sensor is a limited-stable system. At longer averaging times, drift effects usually deteriorate the performance of an optical sensor, mainly caused by additional noise contributions, like laser instability, temperature and mechanical drifts, as well as moving optical fringes, which can start to dominate at different timescales. For this reason, an optimum integration time which minimizes the noise level of a sensor can be found. The reconstruction of the trend of the noise level as a function of τ by varying step-by-step the signal integration time is unfeasible because time-consuming. For this reason, an Allan deviation analysis was performed to simulate the noise level trend at different integration times starting from a set of time-series data acquired with a fixed integration time τ0. Given a set of N time-series data acquired with an integration time τ0, its Allan variance σ2y(τ0) is defined as
$$ {\sigma }_{y}^{2}\left({\tau }_{0}\right)=\frac{1}{N}\sum _{k=1}^{N}\frac{1}{2}({y}_{k+1}-{y}_{k}) $$ (11) where yk is the kth data averaged over an integration time τ0, and yk+1 and yk are adjacent values. To simulate σ2y at longer integration times τ > τ0, a simple algorithm has been developed in LabVIEW. Assuming that there is no dead time between adjacent measurements, the software averages the values for y1 and y2 and obtains a new y1-value averaged over 2τ0. Subsequently, this routine applies the same procedure for the subsequent couples of data to obtain a new time-series data corresponding to an integration time 2τ0. Finally, Eq. 11 is applied to this new set of time-series data to determine σ2y(2τ0). The software loops this process for all other integer multiples n of τ0 to generate values for σ2y(nτ0) as a function of (nτ0). The obtained trend can be used to identify the main noise contributions of a sensor, when possible. In the case of a QTF, the main noise component is expected to be the thermal noise:
$$ {\sigma }_{thermal}=\sqrt{\frac{2{k}_{B}T}{{\text π} R\tau }} $$ (12) where kB is the Boltzmann constant and T = 298K is the QTF temperature. Thus, if the QTF thermal noise is the dominant noise source in a certain timescale for a QTF-based photodetector in a TDLAS setup, the Allan deviation is expected to follow a 1/√τ dependence in that timescale. If the Allan deviation deviates from this trend, other contributions are deteriorating the overall noise level of the sensor.
-
The authors from Dipartimento Interuniversitario di Fisica di Bari acknowledge financial support from PNRR MUR project PE0000023-NQSTI, project MUR – Dipartimenti di Eccellenza 2023–2027 – Quantum Sensing and Modelling for One-Health (QuaSiModO) and THORLABS GmbH within the PolySenSe joint research laboratory. The authors from Shanxi University acknowledge financial support from National Natural Science Foundation of China (NSFC) under grant number 62122045, 62235010, 62175137, 62105252 and the Shanxi Science Fund for Distinguished Young Scholars (20210302121003).
Femtosecond laser fabrication of black quartz for infrared photodetection applications
- Light: Advanced Manufacturing , Article number: (2025)
- Received: 26 September 2024
- Revised: 26 February 2025
- Accepted: 27 February 2025 Published online: 09 October 2025
doi: https://doi.org/10.37188/lam.2025.026
Abstract: Quartz tuning forks have been recently employed as infrared photodetectors in tunable laser diode spectroscopy because of their high responsivities and fast response time. As for all sensitive elements employed for photodetection, the main drawback is the limited bandwidth of their absorption spectrum. For quartz crystals, the high absorptance for wavelengths above 5 µm guarantees excellent performance in the mid-infrared range, that cannot be easily extended in the visible/near-infrared range because of its transparency from 0.2 to 5 µm. In this work, we report on the development of a laser surface functionalization process to enhance the optical absorption of quartz crystals, named hereafter Black Quartz, in the 1-5 µm spectral range. Black Quartz consists of surface modification of quartz crystal by ultra-fast-pulsed-laser-processing to create localized matrices-like patterns of craters on top. The surface modification decreases the transmittance of quartz in the 1-5 µm range from > 95% down to < 10%, while the transmittance above 5 µm remains unchanged. The Black Quartz process was applied on two quartz-tuning-forks mounted in a tunable laser diode spectroscopy sensor for detecting two water vapor absorption features, one in the near infrared and the other one in the mid-infrared. A comparable responsivity was estimated in detecting both absorption features, confirming the extension of the operation in the near-infrared range. This works represents an important and promising step towards the realization of quartz-based photodetector with high and flat responsivity in the whole infrared spectral range.
Research Summary
Black Quartz: New photoactive material for infrared photodetection
One of the big challenges in the field of photonics is the realization of a cost-effective, broadband and highly sensitive infrared photodetector, but many of the most recent and advanced solutions proposed for this aim achieve at maximum two of these requirements. Annalisa Volpe from Polytechnic University of Bari and colleagues propose Black Quartz as a new photoactive medium for broadband and efficient infrared photodetection. This material is easily obtained by superficial femtosecond laser texturing of quartz creating a new medium that has competitive responsivity in the 1 – 10 μm wavelength range. The authors provided proof of operativity of a black quartz photodetector in gas sensing setup by working at 1.39 μm and 7.38 μm with comparable results.
Rights and permissions
Open Access This article is licensed under a Creative Commons Attribution 4.0 International License, which permits use, sharing, adaptation, distribution and reproduction in any medium or format, as long as you give appropriate credit to the original author(s) and the source, provide a link to the Creative Commons license, and indicate if changes were made. The images or other third party material in this article are included in the article′s Creative Commons license, unless indicated otherwise in a credit line to the material. If material is not included in the article′s Creative Commons license and your intended use is not permitted by statutory regulation or exceeds the permitted use, you will need to obtain permission directly from the copyright holder. To view a copy of this license, visit http://creativecommons.org/licenses/by/4.0/.

 DownLoad: