


-
Cancer treatment continues to pose a major challenge in modern medicine primarily because of systemic resistance and poor penetration of therapeutic agents into solid tumors1. Among the various emerging approaches, photodynamic therapy (PDT) has garnered significant interest as a noninvasive strategy capable of targeting tumours with high precision (spatial selectivity) while allowing the activation of therapeutic agents at specific times (temporal selectivity)2,3. PDT uses light, photosensitizers, and molecular oxygen to produce reactive oxygen species (ROS) that trigger localised tumour cell destruction4,5. Initially applied to surface malignancies such as skin cancer, recent advancements in optical technologies have expanded the use of PDT to treat cancers of internal organs, including the oesophagus6, bladder7, and lungs8. For example, fibre-optic devices and endoscopic systems enable precise light delivery within tissues, broadening the scope of PDT applications9. However, traditional PDT has significant limitations, including uneven photosensitizer distribution, oxygen dependence, and suboptimal tumour penetration. These factors reduce their effectiveness, particularly in hypoxic tumour regions and dense stroma10.
To address these challenges, alternative drug delivery strategies have been explored, including cell-mediated delivery systems, which offer the potential to enhance therapeutic selectivity and overcome tumour microenvironmental barriers11. Various cell types, such as neutrophils12, T-lymphocytes13, mesenchymal stem cells14, and red blood cells15, have been explored for their capacity to deliver therapeutic agents owing to their innate biological properties. These cells can act as natural carriers, facilitating the transport of payloads to tumour sites, while mitigating systemic side effects.
Among these systems, macrophages have emerged as promising candidates because of their intrinsic tumor-homing abilities16. These innate immune cells are actively recruited to tumour sites by chemoattractants released by cancer and stromal cells17. Macrophages have been successfully used to deliver a wide array of therapeutic agents, including chemotherapeutics18, nanoparticles19, and gene therapies20. Macrophages loaded with gold nanoshells have been reported to improve the effectiveness of photothermal therapy21. Similarly, macrophages have been utilised to transport iron oxide nanoparticles, enhancing both magnetic resonance imaging and magnetothermal therapy for solid tumors22, demonstrating their versatility as therapeutic carriers. Their capacity to infiltrate hypoxic and poorly vascularised tumour sites, where conventional therapies are often ineffective, makes them ideal delivery vehicles for advanced cancer treatment.
This study aimed to combine macrophages and PDT to create a highly selective and effective therapeutic platform. Specifically, macrophages were utilised as ‘Trojan horses’ to deliver layer-by-layer (LbL) polyelectrolyte microcapsules loaded with а photosensitizer. LbL microcapsules constructed through the successive deposition of oppositely charged polyelectrolytes are versatile carriers of therapeutic agents23–26. Many targeted drug delivery systems, including liposomes, micelles, and solid-core nanoparticles or microparticles, have been successfully explored for cell-mediated delivery. Among these, LbL capsules occupy a unique position and offer several key advantages, including high structural stability, the ability to encapsulate multiple agents (drugs, dyes, or particles), and a deformable, hollow architecture27–29. The latter is particularly important for efficient cellular uptake and migration through tissues because it facilitates internalisation without compromising cell viability or mobility.
To evaluate this ‘Trojan horses’ strategy, this study developed a platform employing two macrophage cell lines, RAW 264.7 (monocyte/macrophage-like cells) and primary PMs (peritoneal macrophages), loaded with LbL microcapsules encapsulating two distinct photosensitizers—a Chlorin e6 derivative and an aluminum phthalocyanine derivative.
This platform was tested in vivo using the CT-26 colon cancer model to assess its therapeutic potential. By combining macrophage-mediated delivery with the unique properties of LbL microcapsules (Fig. 1), this study aimed to overcome the challenges of traditional PDT, while advancing personalised cancer treatments.
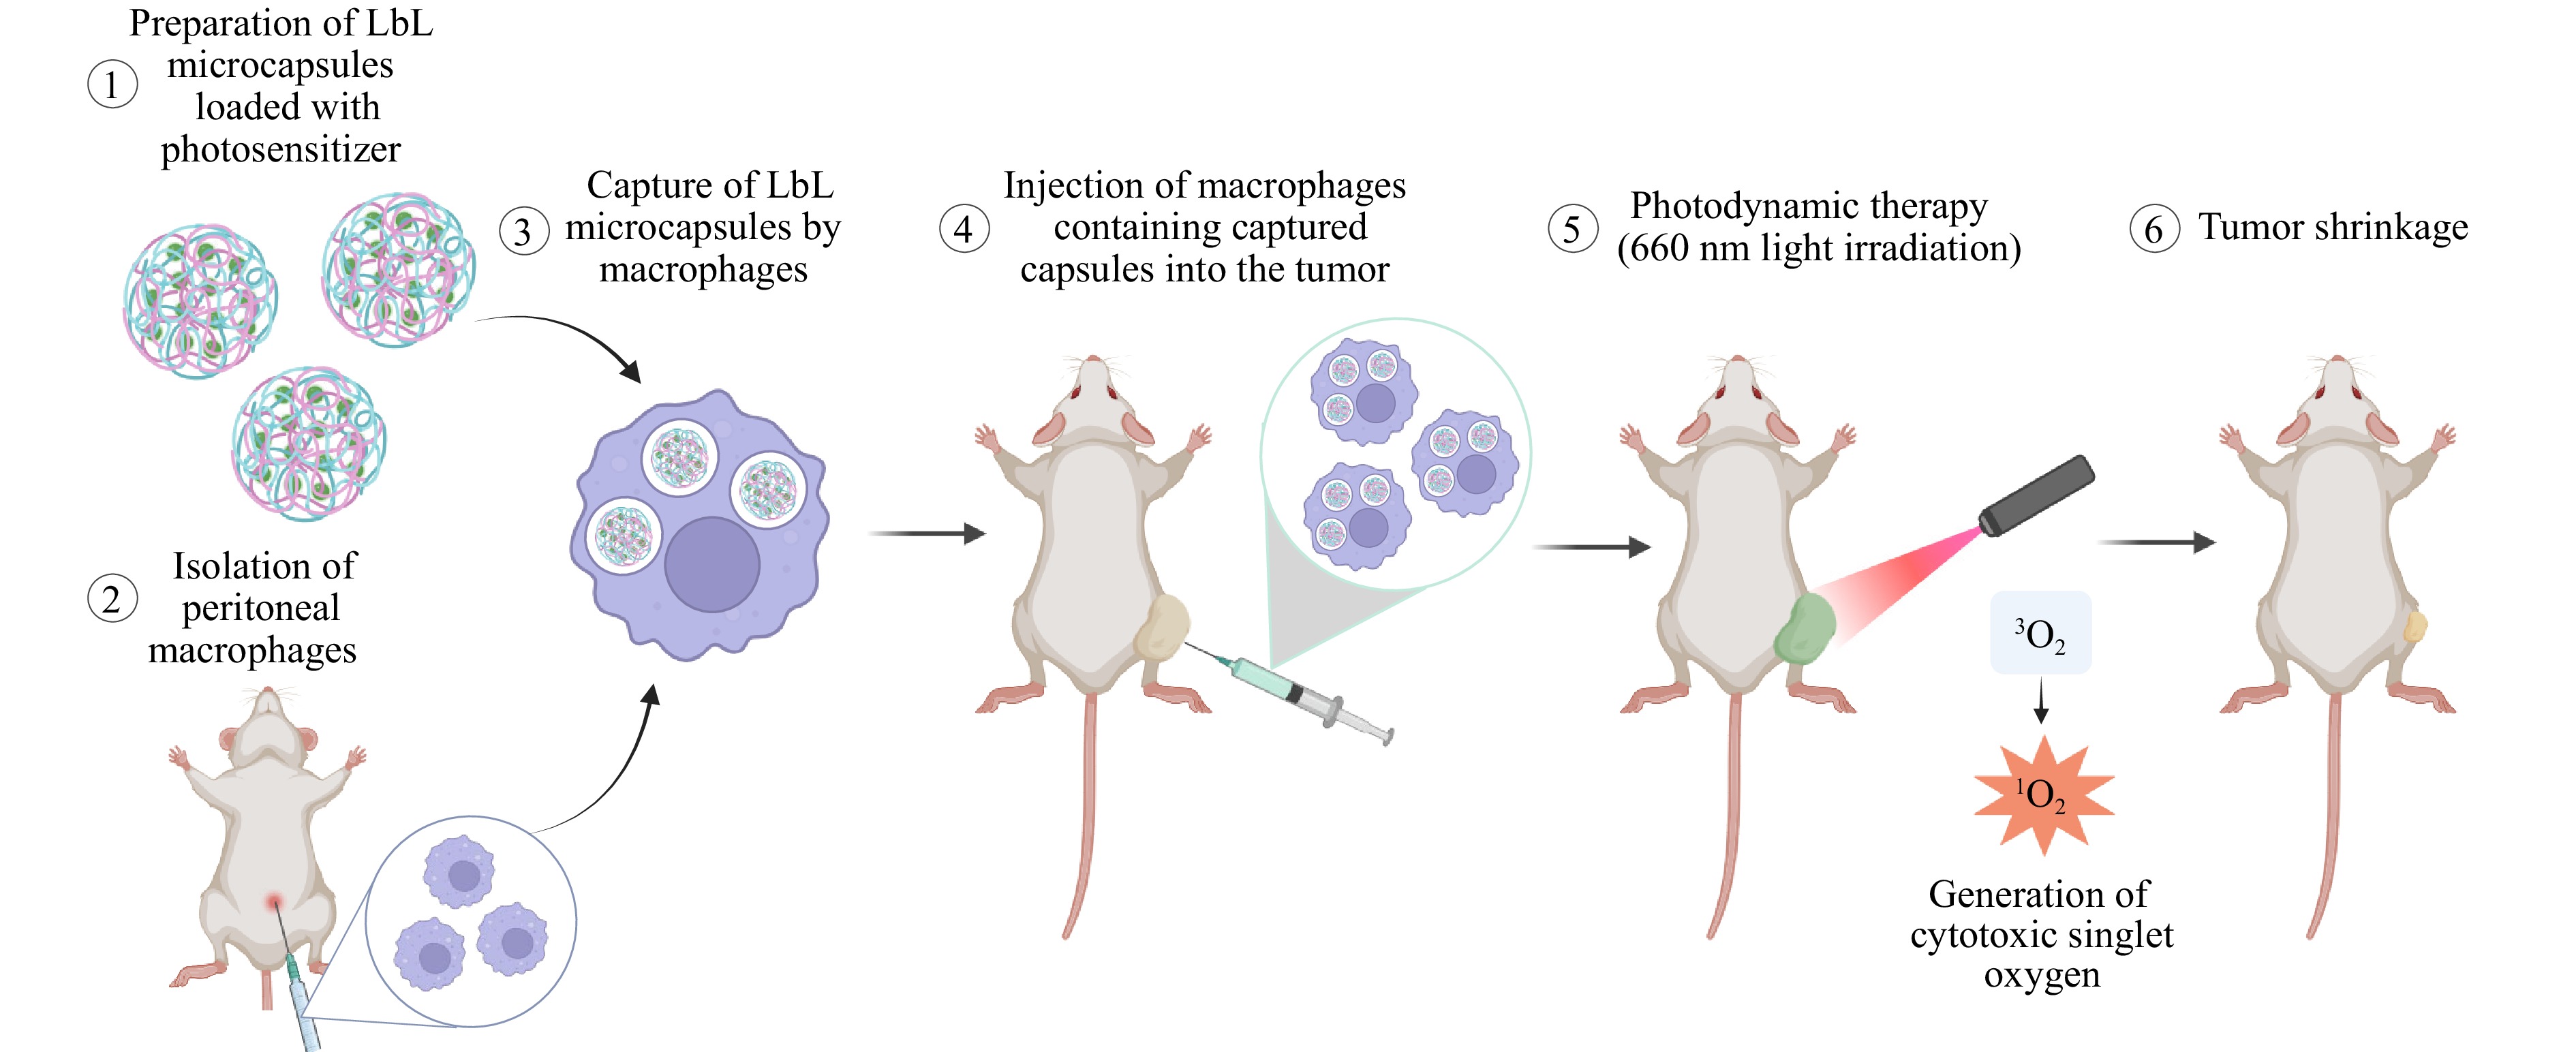
Fig. 1 Schematic of macrophage-mediated delivery of photosensitizer-loaded microcapsules for photodynamic therapy.
-
In the initial phase of the study, the study optimised the dye excitation parameters and evaluated the dark toxicity (toxicity in the absence of light) and light toxicity (toxicity induced by light exposure). Two second-generation photosensitizers were selected as the photodynamic agents: photoditazine (PD), a commercial derivative of chlorin e6, and synthesised aluminum tetrasulfophthalocyanine chloride (PS), a modified analogue of the commercial dye Photosense. The synthesis scheme for the PS is shown in Fig. 1S. Both photosensitizers are well-established in clinical practice for treating malignant tumours via photodynamic therapy.
The optical absorption spectra of PD and PS, measured in deionised (DI) water (Fig. 2), revealed their characteristic peaks. PD exhibited absorption maxima at 404 and 652 nm, whereas PS displayed peaks at 350, 608, and 674 nm. For the light-induced toxicity experiments, a custom light-emitting diode (LED) setup with a radiation range of 620–680 nm and an emission peak at 660 nm was used, aligning with the red edge of the absorption bands of both photosensitizers (Fig. 2). Despite the strong absorption of PD in the blue region (404 nm), the red region was chosen because of its placement within the biological transparency window (NIR-1, 650–1000 nm), enabling deeper tissue penetration and efficient photosensitizer activation.
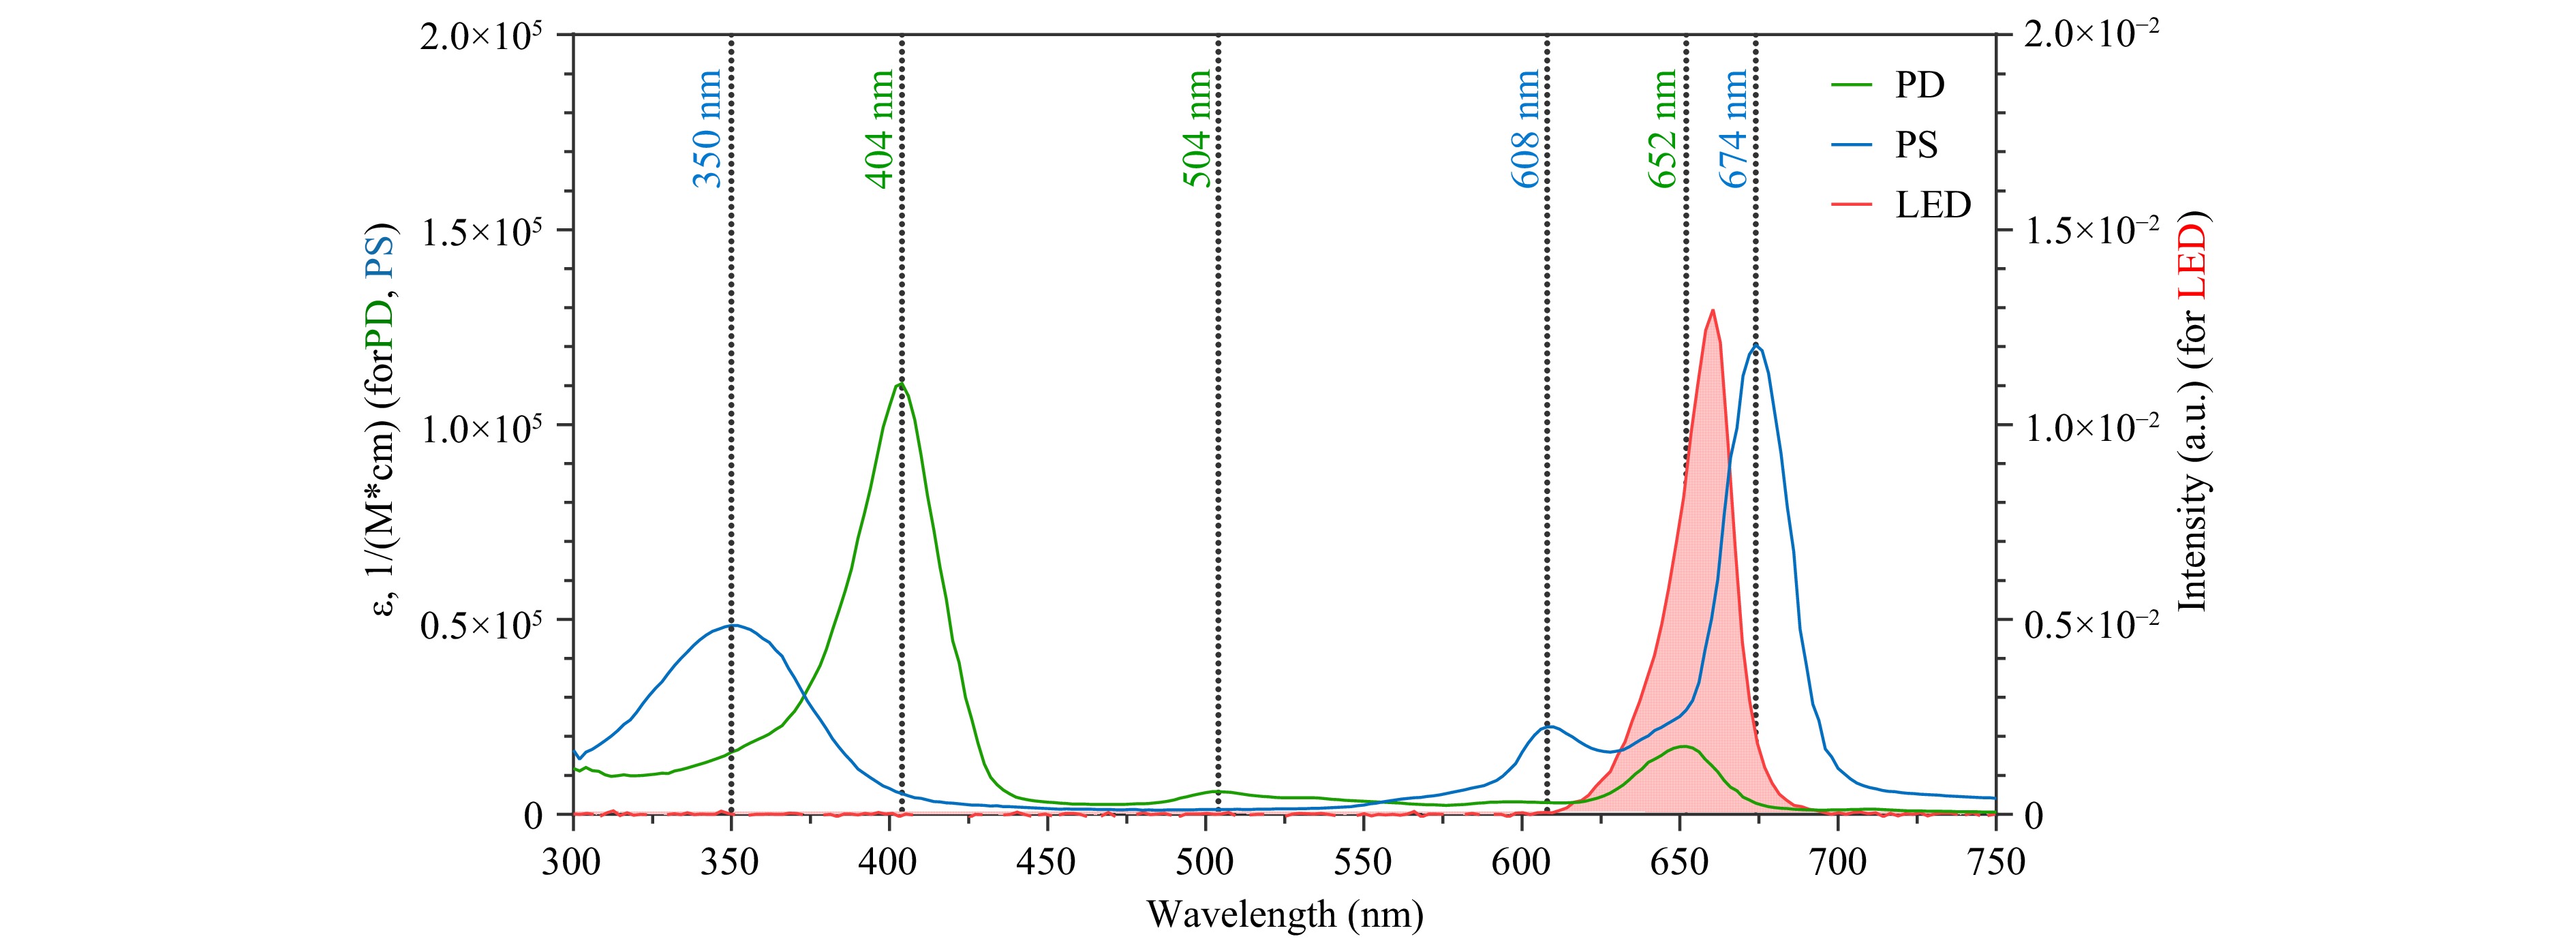
Fig. 2 Normalized optical absorption spectra of PD and PS in DI water, and LED emission spectrum. The X-axis represents the wavelength, the left Y-axis represents the molar absorption coefficient (ε), and the right Y-axis indicates the diode emission intensity.
An essential feature of photosensitizers is their minimal dark toxicity, which ensures that they remain non-toxic in the absence of light exposure. As illustrated in Fig. 3 (more details in Fig. 2S), significant cytotoxicity was observed only at the highest photosensitizer concentrations, supporting their safety profile for therapeutic use. These results were consistent across cancer and normal cell lines, including CT-26 (a highly metastatic murine colon carcinoma), RAW 264.7 (murine monocyte/macrophage-like cells), and L929 (murine fibroblasts common in the tumour microenvironment).
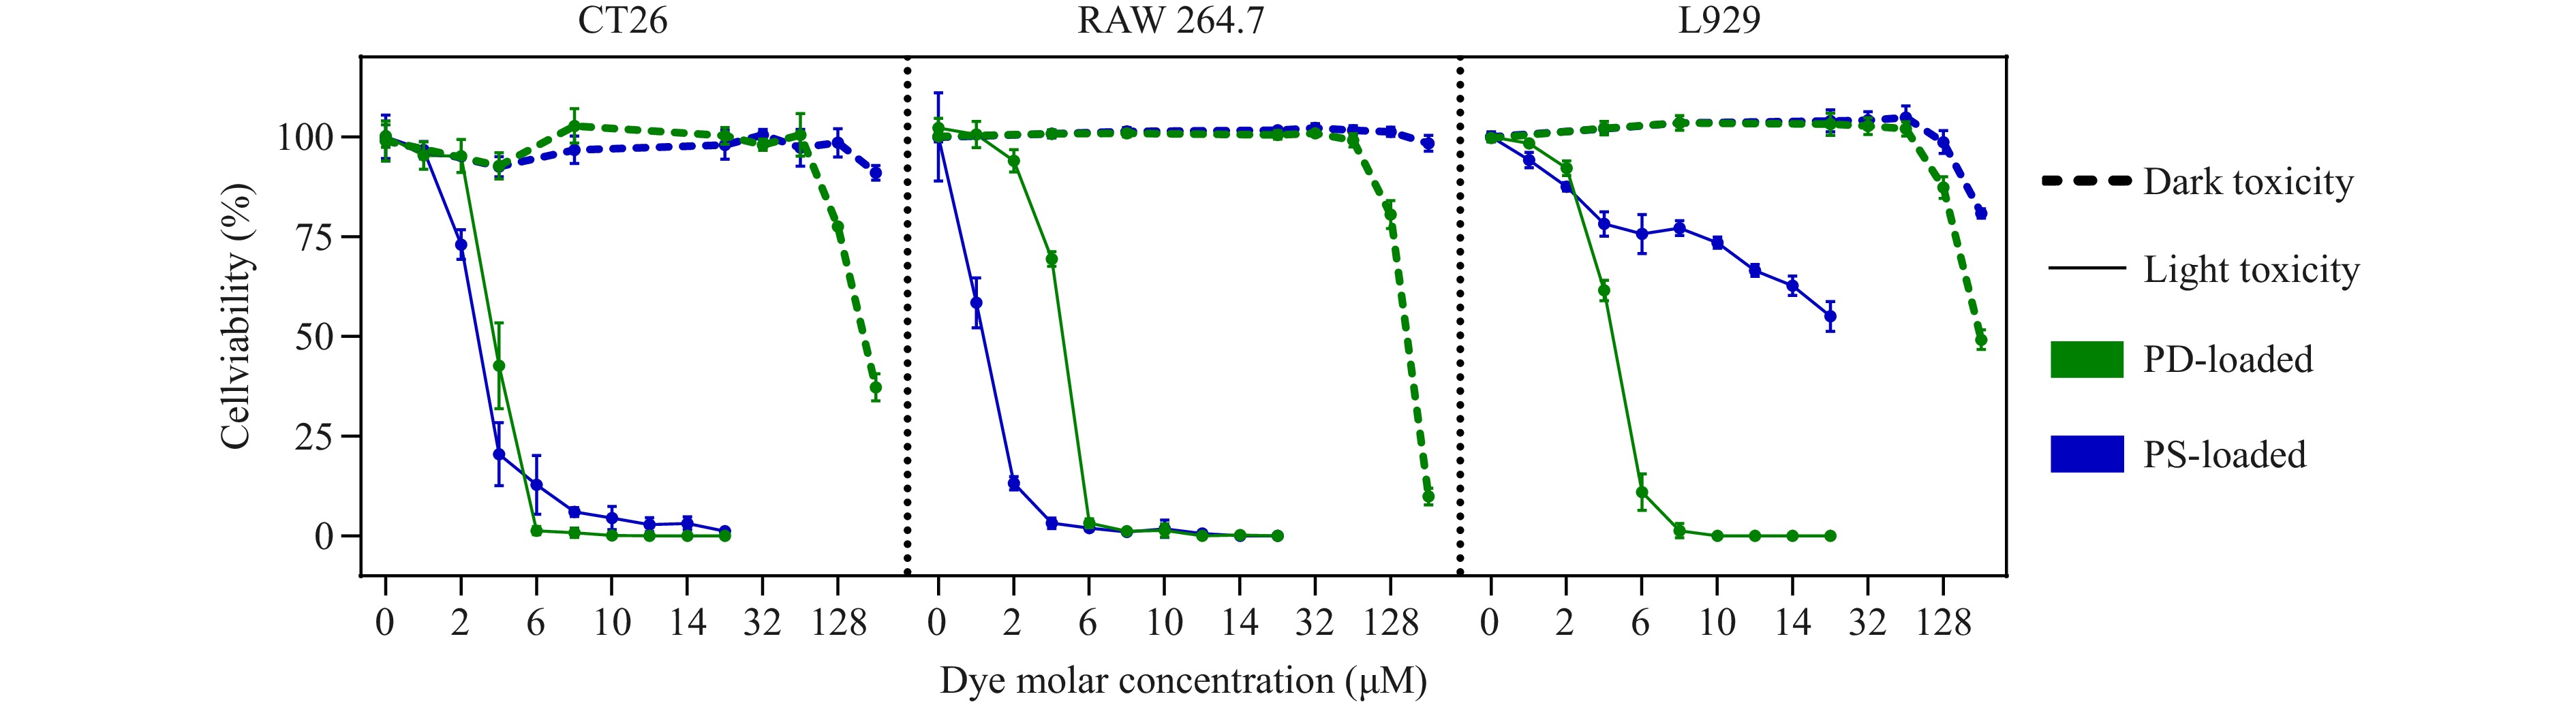
Fig. 3 Dark and light toxicity assessments of photosensitizers PD and PS in CT26, RAW 264.7, and L929 cell lines. Data are presented as mean ± SD; n = 5.
To evaluate light-induced cytotoxicity, a custom LED setup was used to irradiate the cells at a maximum wavelength of 660 nm (see Methods). The controlled variation in light energy density by the setup enabled the optimisation of the irradiation parameters. As shown in Fig. 3S, an energy density of 20 J/cm2 (delivered within 20 min) was the most effective at inducing significant cell death in CT-26 cells at minimal photosensitizer concentrations. IC50 values for PS were 5.4, 3.7, and 2.6 μM at 10, 15, and 20 J/cm2, respectively (Fig. 3S(A)), and those for PD were 4.7, 4.3, and 3.9 μM, respectively, under the same conditions (Fig. 3S(B)). Based on these findings, 20 J/cm2 was selected for subsequent light-induced toxicity experiments. Under the optimised conditions, both photosensitizers exhibited strong phototoxic effects. As shown in Fig. 3 (more detailed in Fig. 2S), light activation of PD and PS resulted in nearly 100% cell death in CT-26 cells at concentrations of 6 and 10 μM, respectively. For RAW 264.7 cells, complete cytotoxicity was observed at 6 μM PD and 4 μM PS. Interestingly, L929 fibroblasts exhibited resistance to PS even at high concentrations, although they were effectively killed by 8 μM PD.
-
Owing to the strong photodynamic properties demonstrated by PD and PS in the CT26 cell line, both photosensitizers were selected for encapsulation in the LbL microcapsules and subsequent cellular studies. Using a chemical reactor, 5.8 g of vaterite particles (a polymorph of calcium carbonate) with a consistent diameter of 6.2 ± 0.5 μm (confirmed via scanning electron microscopy (SEM); Fig. 4S) were synthesised to serve as templates. The vaterite cores were loaded with photosensitizers PD or PS (see Methods). The loaded particles were then coated with polyelectrolyte pairs—poly(allylamine hydrochloride)/poly(4-styrene sulfonate) sodium salt (PAH/PSS), bovine serum albumin/tannic acid (BSA/TA), and poly-L-arginine/dextran sulfate sodium salt (PArg/DS)—via the LbL assembly. Finally, the vaterite cores were dissolved, leaving behind photosensitizer-loaded microcapsules for subsequent experiments.
Prior to polyelectrolyte deposition, ζ-potential measurements confirmed that empty vaterite cores exhibited a near-neutral surface potential (0.4 ± 6.0 mV), whereas the PD-loaded cores carried a moderately negative charge (–13.1 ± 6.4 mV) and the PS-loaded cores were more strongly negative (–23.1 ± 5.7 mV), consistent with the chemical structures of the dyes (Fig. 5S). Table 1 summarises the characteristics of the synthesised microcapsules (after core dissolution), including the diameter, ζ-potential, shell thickness, loading efficiency of the photosensitizers, and the percentage of drug loss during polyelectrolyte shell formation and core removal. The highest losses were observed for (BSA/TA)4 capsules. These capsules were stabilised by hydrogen bonding, resulting in thinner and more permeable shells compared to those of the electrostatically assembled (PAH/PSS)4 and (PArg/DS)4 systems. This increased permeability could facilitate the leakage of the encapsulated photosensitizers during synthesis, leading to lower loading efficiencies.
Shell composition, polyelectrolyte layers Encapsulated dye Size, μm ζ-potential, mV
(pH = 7)Double shell thickness, nm Dye loss during synthesis, % of initial loading Dye loading per 1 capsule, pg (PAH/PSS)4 PD 6.3 ± 0.5 15 ± 6 200 ± 7 26 12 PS 6.3 ± 0.4 30 ± 8 170 ± 2 13 9 Empty 6.3 ± 0.4 20 ± 8 206 ± 4 — — (BSA/TA)4 PD 6.4 ± 0.8 −20 ± 8 130 ± 9 31 11 PS 5.1 ± 0.4 −24 ± 8 100 ± 2 64 3 Empty 6.4 ± 0.6 −18 ± 7 88 ± 3 — — (PArg/DS)4 PD 6.5 ± 0.5 −33 ± 9 175 ± 8 21 14 PS 6.1 ± 0.4 −43 ± 11 179 ± 9 20 7 Empty 6.4 ± 0.4 −23 ± 8 147 ± 2 — — Table 1. Summary of the main characteristics of the synthesized microcapsules, including diameter, ζ-potential, double shell thickness, dye loss during synthesis, and photosensitizer loading efficiency.
The PD-loaded microcapsules exhibited the highest dye loading (11–14 pg/capsule) among all formulations. In contrast, PS loading was lower, with a maximum of 9 pg/capsule for (PAH/PSS)4 and as low as 3 pg for the (BSA/TA)4 capsules. The (BSA/TA)4 microcapsules also had the thinnest shells, as determined by atomic force microscopy (AFM). The (PArg/DS)4 microcapsules exhibited the highest ζ-potential, indicating good colloidal stability30. Interestingly, the (PAH/PSS)4 capsules exhibited a net positive ζ-potential despite having PSS as the outermost layer. This phenomenon has been previously reported and is attributed to the structural reorganisation of the multilayer shell after CaCO3 core dissolution. During this process, interdiffusion of polyelectrolytes can occur, leading to the partial exposure of PAH residues at the surface and resulting in a residual positive potential31. The study data (Fig. 5S, 6S) support this explanation; while ζ-potential measurements during deposition showed the expected alternation between positive and negative values, and the final capsules after core removal exhibited a residual positive charge, consistent with post-dissolution rearrangements.
The influence of biological environment was also assessed. Protein corona formation is highly relevant upon exposure to protein-containing media, as serum proteins can adsorb onto capsule surfaces, substantially altering their effective surface charge and modulating capsule–cell interactions32–35. Herein, the ζ-potential measurements confirmed this effect, wherein after 1 h of incubation in a complete medium containing 10% FBS, the (PAH/PSS)4 capsules shifted from a net positive to a net negative charge, consistent with protein corona formation (Fig. 6S). In contrast, the (BSA/TA)4 and (PArg/DS)4 capsules retained almost unchanged ζ-potentials under identical conditions. In addition, the (BSA/TA)4 capsules did not display clear charge alternation during assembly, but instead followed an almost linear trend, consistent with stabilisation primarily through hydrogen bonding rather than electrostatic interactions36.
Confocal laser scanning microscopy (CLSM) images were captured to assess the feasibility of fluorescence tracking of the dye encapsulated within the microcapsules (Fig. 4a). Although dye encapsulation was observed in all samples, the fluorescence signal varied significantly among the formulations. The (BSA/TA)4 capsules loaded with either PD or PS did not exhibit detectable fluorescence under CLSM, likely because of the quenching effect of TA37. In contrast, the (PArg/DS)4 and (PAH/PSS)4 capsules containing PD exhibited the strongest fluorescence signals, whereas the (PAH/PSS)4 capsules containing PS displayed weak fluorescence and the (PArg/DS)4 capsules had a pronounced background fluorescence signal.
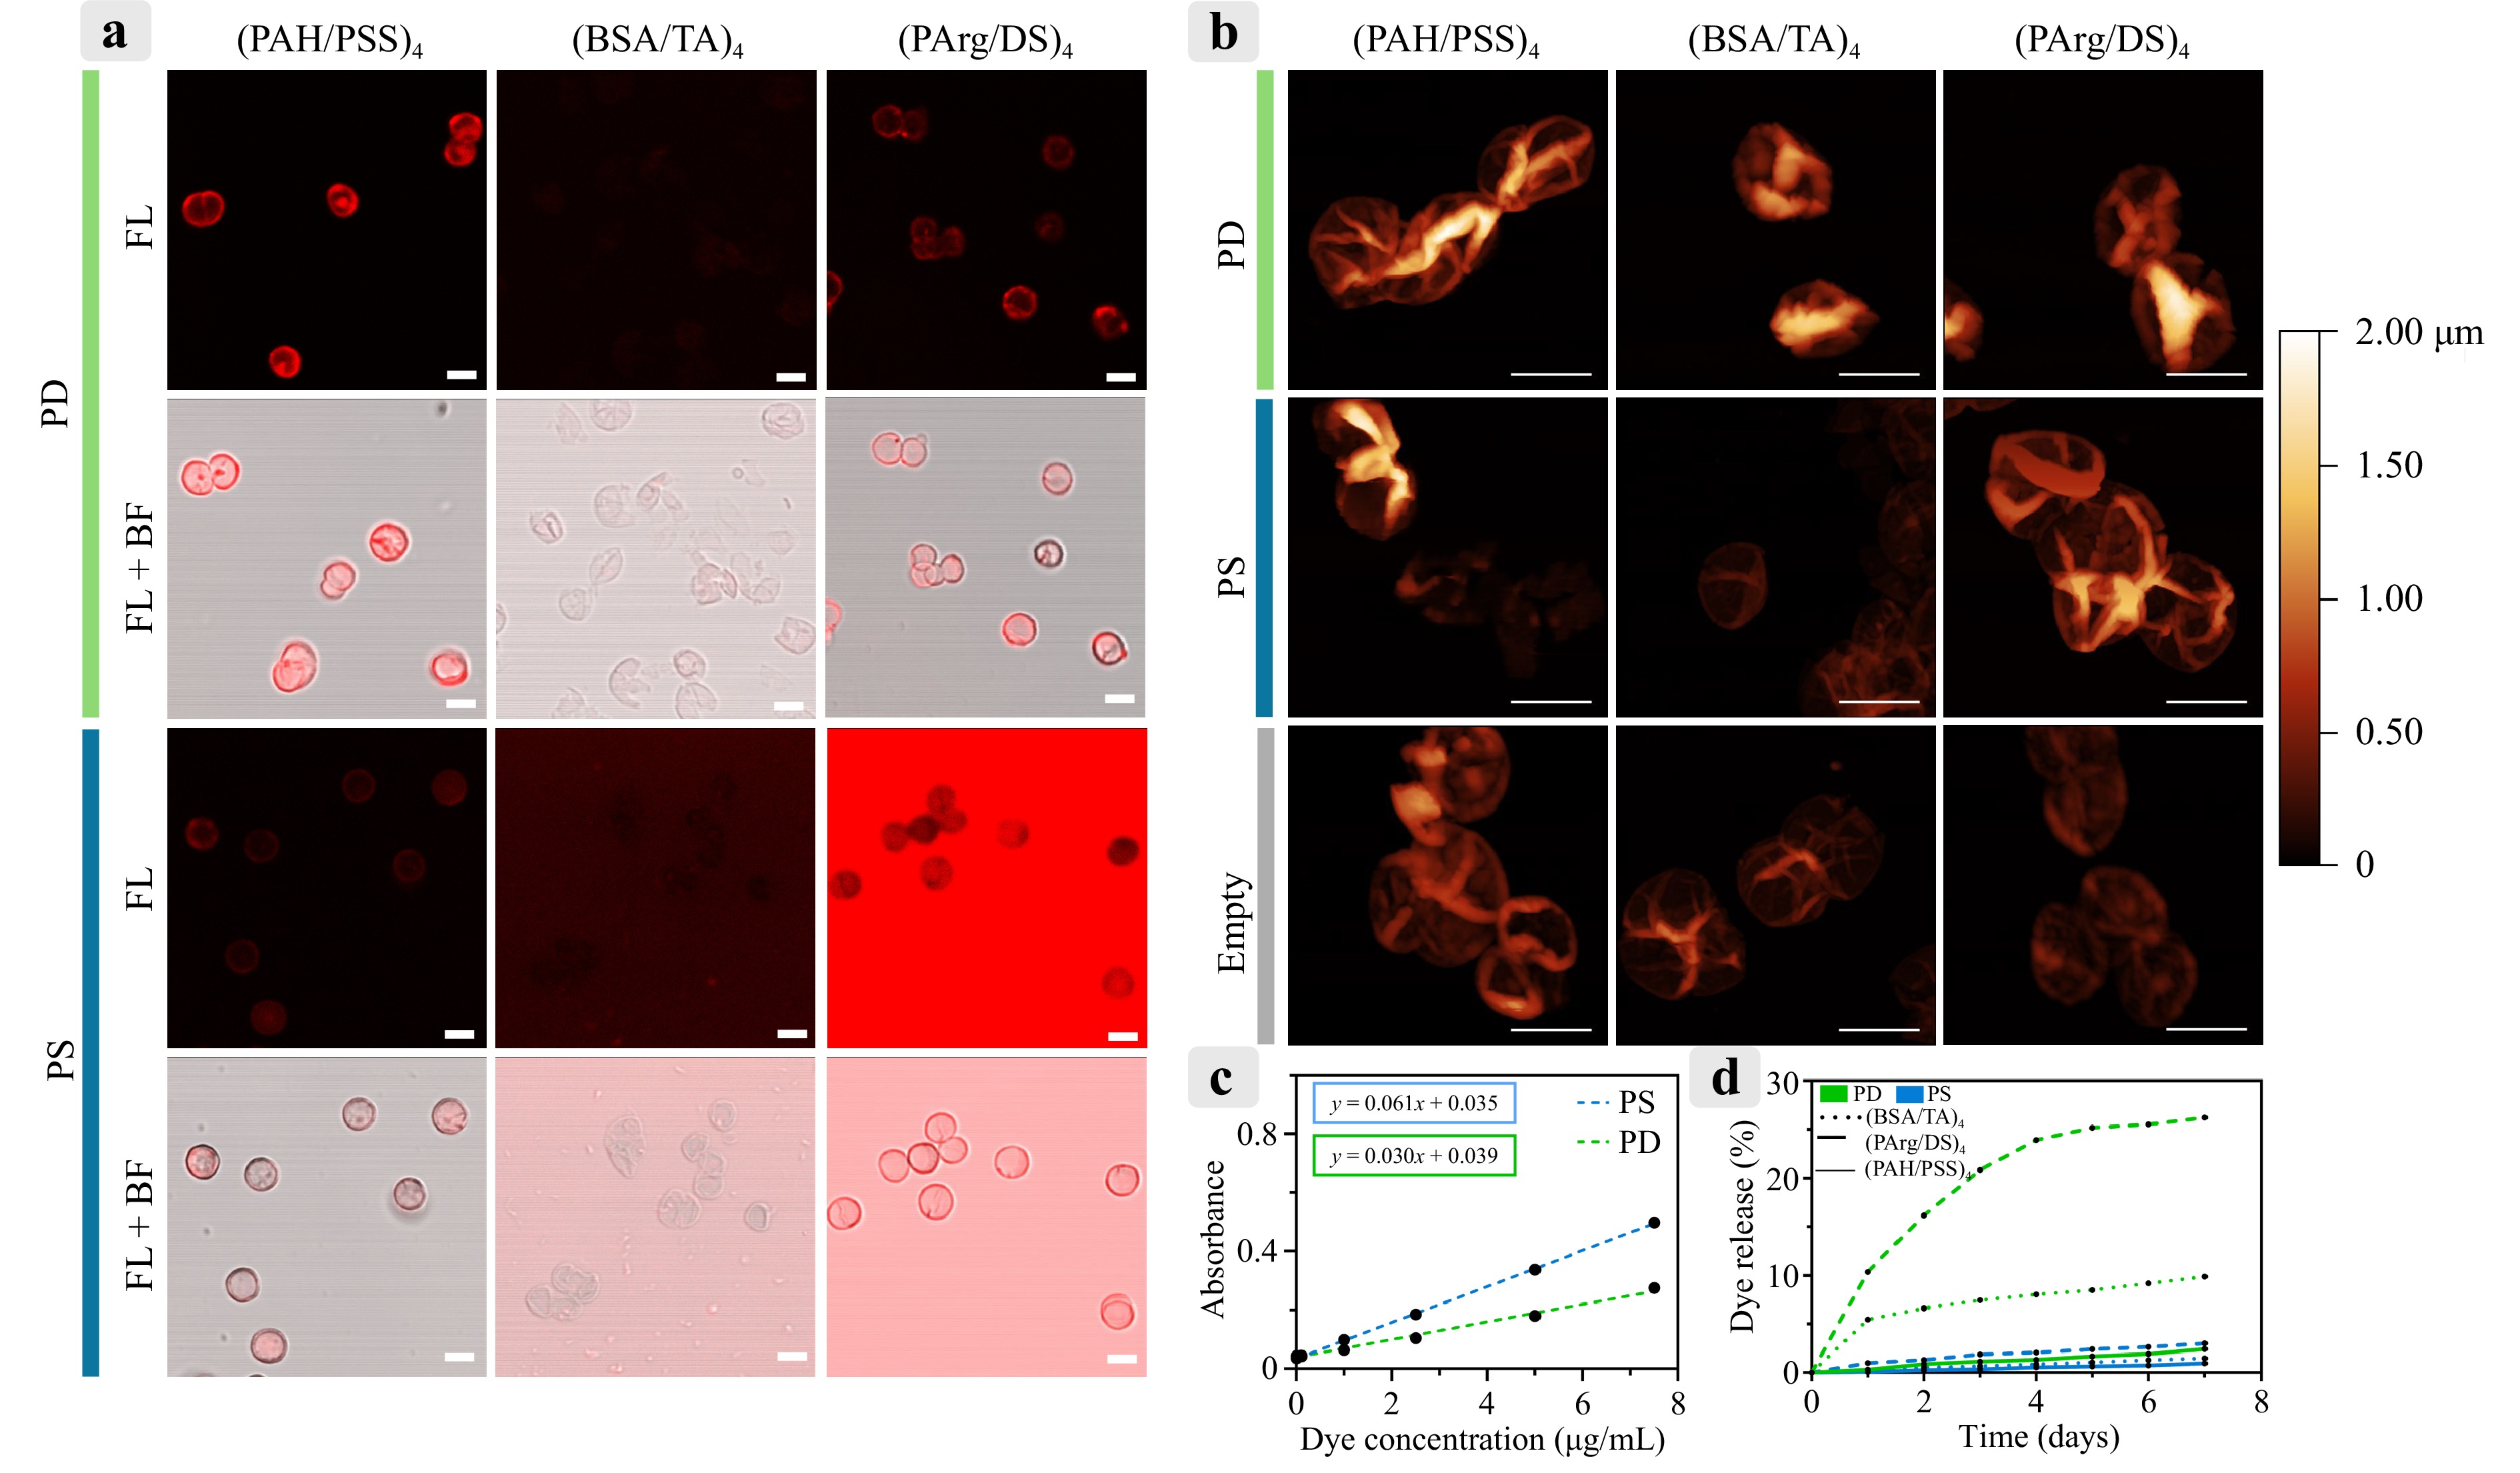
Fig. 4 a Fluorescence images of microcapsules obtained using CLSM under identical excitation and detection parameters (excitation: 671 nm; detection: 685–750 nm). Scale bar: 5 μm. b AFM images of dried microcapsules. Scale bar: 5 μm. c Calibration curves for PD and PS, showing optical absorbance as a function of photosensitizer concentration. d Release profiles of PD and PS from microcapsules in saline over a period of 7 d.
AFM images (Fig. 4b) showed the structural differences among the formulations, indicating that the (BSA/TA)4 microcapsules had thinner shells than the others. Additionally, the images demonstrate complete dissolution of the vaterite cores within the microcapsules.
To investigate drug release characteristics, the release profiles in physiological saline were measured. Calibration curves for PD and PS (Fig. 4c) were recorded based on their absorbance peaks at 400 and 674 nm, respectively, to quantify the loading and release. Release studies (Fig. 4d) demonstrated that the PS-loaded (BSA/TA)4 capsules exhibited the highest release rate, reaching 26% over 7 d, consistent with their thinner shells, as indicated by AFM. Conversely, the PD-loaded (PArg/DS)4 capsules released only 10% of their payload within the same period. Other formulations, including the (PAH/PSS)4 capsules, displayed minimal release, not exceeding 3%, after 7 d.
-
The cytotoxicity of photosensitizer-loaded microcapsules was evaluated using RAW 264.7 cells and PMs. PMs were isolated from the abdominal cavity of mice, and they were subsequently cultured and washed under the appropriate conditions (see Methods). Staining with F4/80 confirmed that approximately 86% of the cells in the isolated primary culture were macrophage-type cells (Fig. 8S).
As depicted in Fig. 5a (more detailed in Fig. 7SA), RAW 264.7 cells exhibited the highest sensitivity to PAH/PSS-coated capsules, with significant toxicity observed at photosensitizer concentrations starting at 2 μM, particularly for PD-loaded capsules. In contrast, the PMs displayed minimal sensitivity to all tested capsule types across the tested concentration range (Fig. 5b; more detailed in Fig. 7SB).
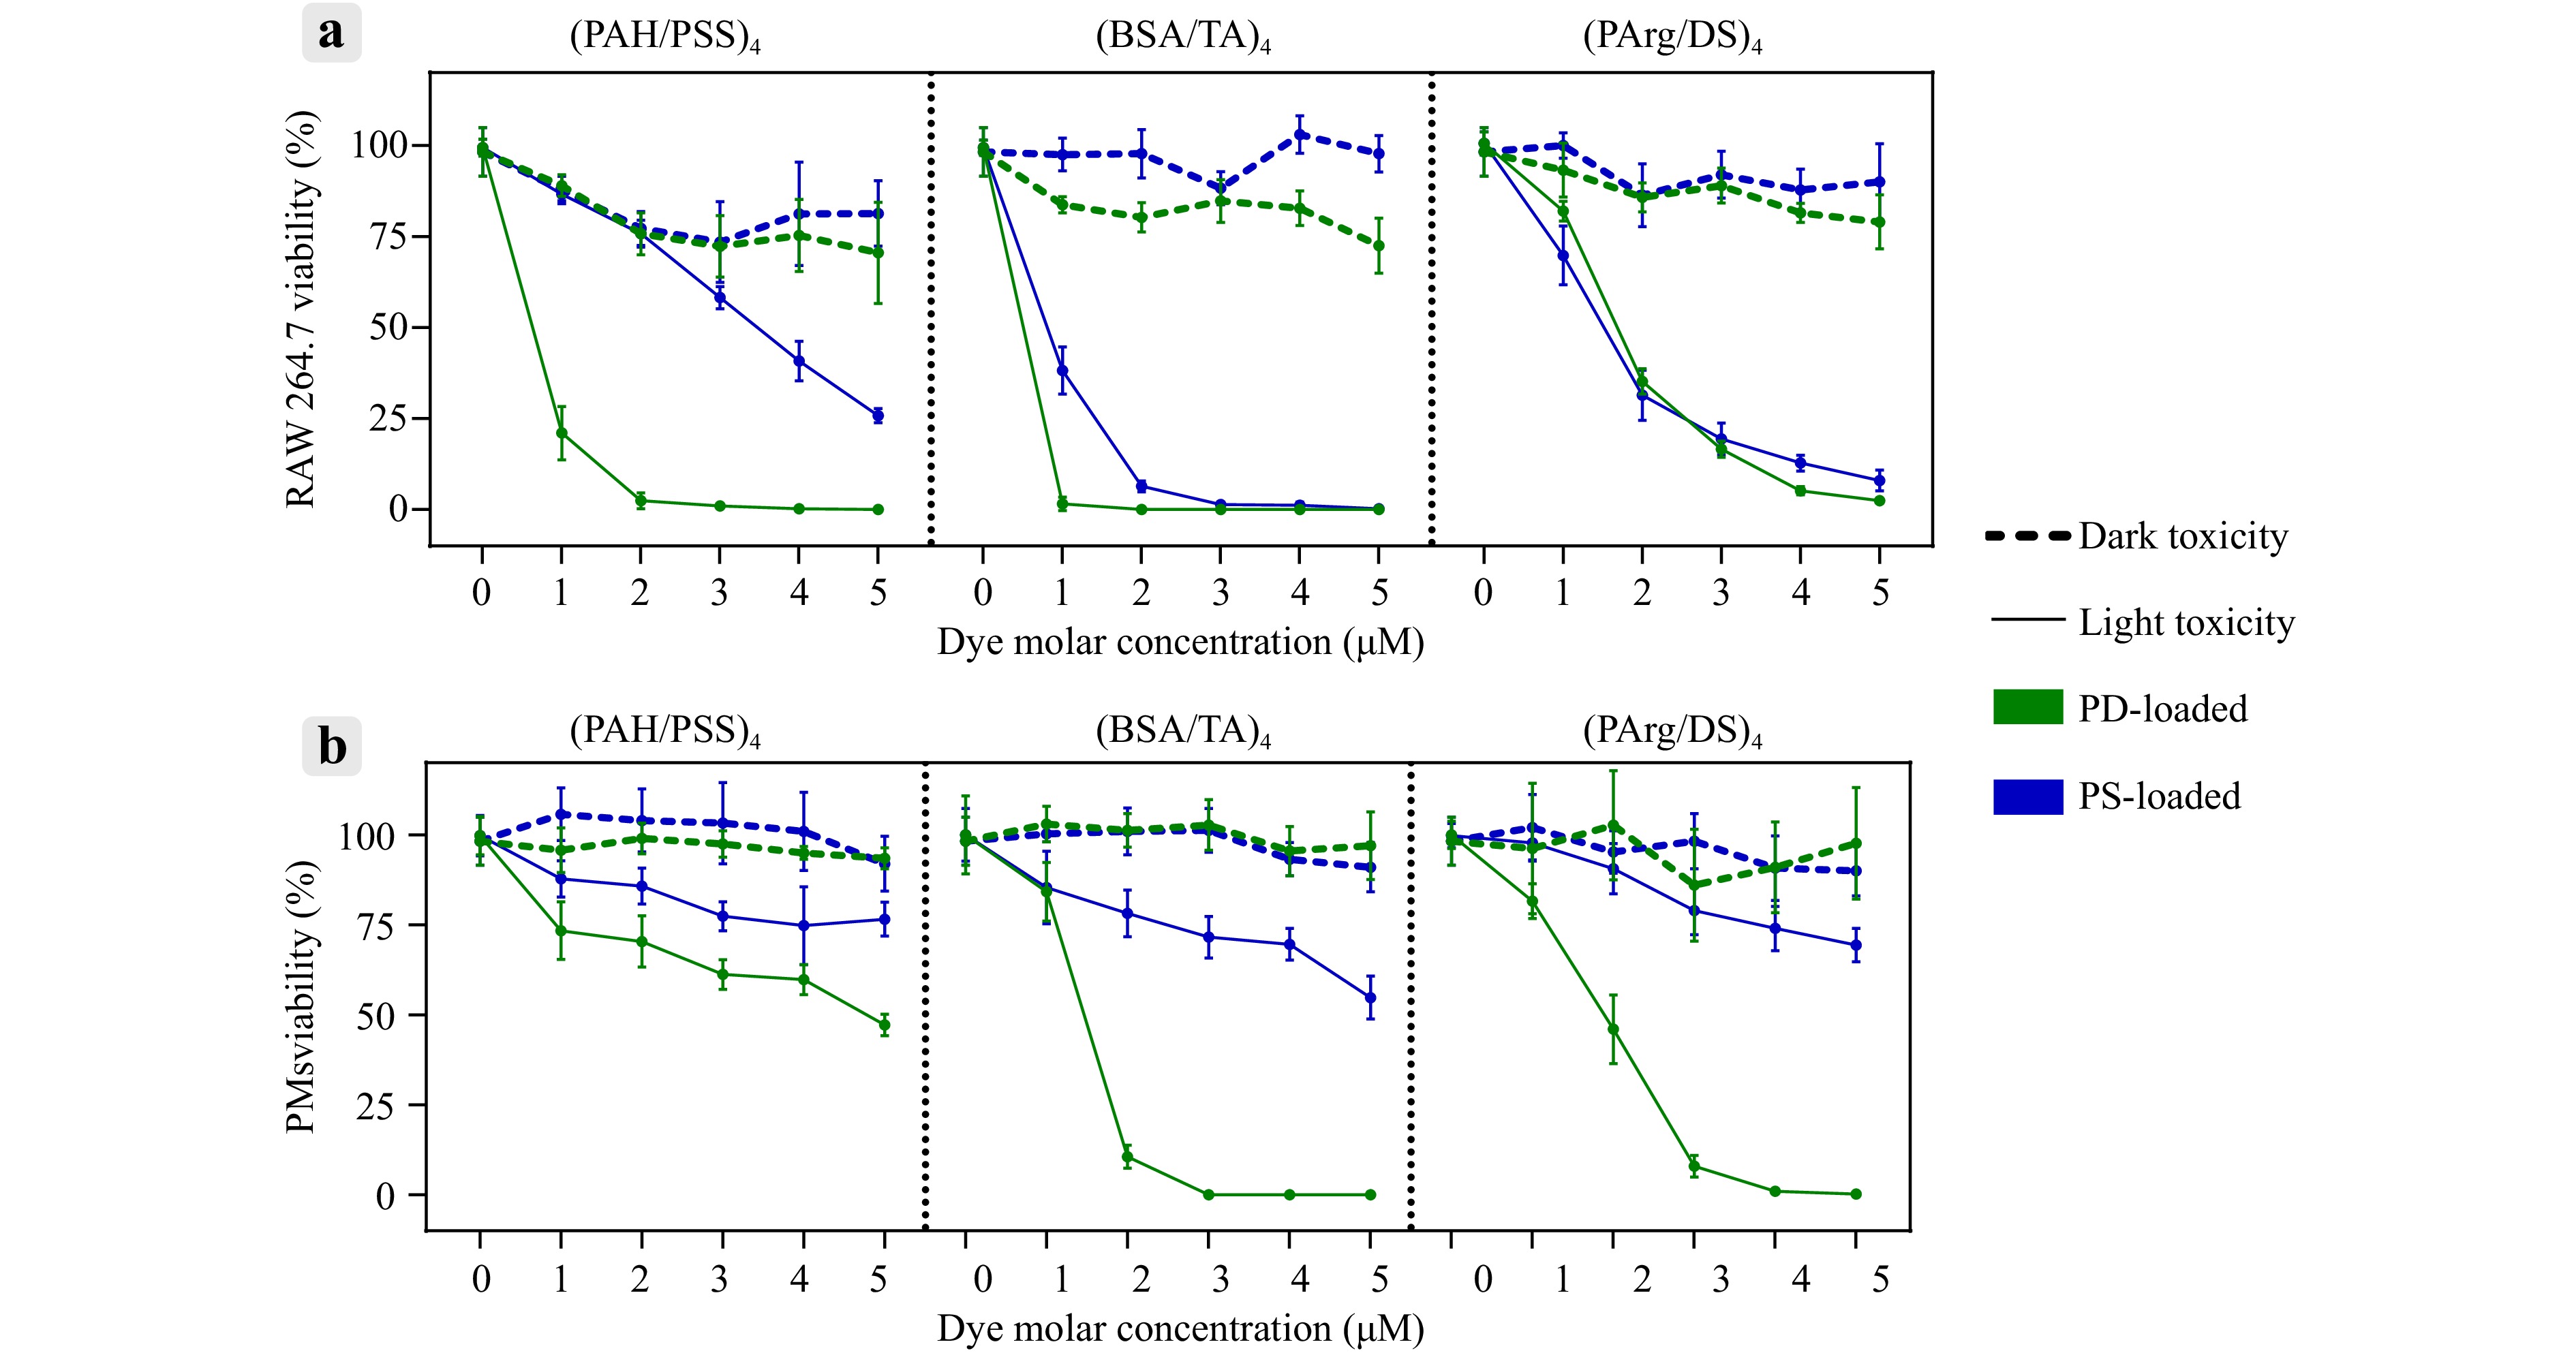
Fig. 5 Evaluation of dark and light toxicity for different microcapsule types loaded with photosensitizers (PS or PD) in macrophages (RAW 264.7 and PMs). Data are presented as mean ± SD; n = 5.
Light-induced cytotoxicity assays (Fig. 5a; more detailed in Fig. 7SC) demonstrated that, in RAW 264.7 cells, the PD-loaded (BSA/TA)4 and (PAH/PSS)4 capsules exhibited the strongest phototoxic effects, achieving 100% toxicity at concentrations of 1 and 3 μM, respectively. The PD-loaded (PArg/DS)4 capsules required a higher concentration of 5 μM to achieve a similar effect. The capsules containing PS were less effective overall, as neither (PAH/PSS)4 nor (PArg/DS)4 formulations reached 100% cytotoxicity within the tested concentration range of 1–5 μM. Only the (BSA/TA)4 capsules loaded with PS reached 100% toxicity at 3 μM.
For PMs, the light toxicity data (Fig. 5b; more detailed in Fig. 7SD) revealed a similar trend, with the PD-loaded capsules demonstrating superior phototoxic effects compared to the PS-loaded capsules. The (BSA/TA)4 and (PArg/DS)4 capsules containing PD reached 100% toxicity at 3 and 4 μM, respectively.
Although the (BSA/TA)4 capsules exhibited strong phototoxic effects, they were excluded from subsequent experiments owing to their high release rates and challenges in fluorescence visualisation. The PD-loaded (PAH/PSS)4 capsules at 3 μM and the (PArg/DS)4 capsules at 5 μM were selected for further investigations based on their strong light-induced cytotoxicity, low dark toxicity, and reliable fluorescence visualisation.
To validate the cytotoxic potential of microcapsules on target tumour cells, dark and light toxicity assays were performed on CT-26 cells across a concentration range of 1–9 μM (only for (PArg/DS)4 PD). Dark toxicity was not observed at any of the concentrations tested. Upon LED exposure, complete cell death was achieved at 9 μM, with an IC50value of 3.8 μM (Fig. 9S). These results confirmed the strong photodynamic efficacy of the encapsulated photosensitizer against CT-26 cancer cells in vitro.
-
To study the internalisation efficiency of the two selected capsule types, PD-loaded (PAH/PSS)4 and PD-loaded (PArg/DS)4, by RAW 264.7 macrophages and PMs, flow cytometry, with the advantages of single-cell imaging for detailed analysis, was used. Flow cytometry revealed that diffusion of photoditazine from the capsule shells often resulted in whole-cell fluorescence in RAW 264.7, making it difficult to count individual capsules per cell, as reported in previous studies38,39. Therefore, the uptake was quantified based on the fraction of fluorescence-positive cells rather than the capsule number per cell, providing robust statistical data across large populations (Fig. 10S).
Fluorescence visualisation showed that the PD signal was detectable in nearly all the cells within 1 h of incubation. Nevertheless, some cells exhibited increased side-scattered light (SSC) signals because the capsules were attached to the membrane or internalised. Two-dimensional dot plots comparing SSC and PD fluorescence intensities identified the subpopulations of capsule-loaded cells. Kinetic analysis of capsule uptake (Figs. 6b and 6c) showed that (1) the capsules coated with (PArg/DS)4 were internalised more efficiently than those coated with (PAH/PSS)4 starting from 20 min, and (2) the fraction of cells carrying capsules increased over time, reaching a plateau after 3 h. After 6 h of incubation, approximately 41 ± 4% of RAW 264.7 cells and 55 ± 2% of PMs carried the (PArg/DS)4 capsules. This difference can be partly attributed to the lower phagocytic activity of RAW 264.7 cells compared to primary macrophages, as reported previously40,41. The dynamics of capsule uptake suggest a phagocytic mechanism of internalisation, which has been well described for micron-sized objects42,43.

Fig. 6 a CLSM images showing RAW 264.7 cells and PMs incubated with microcapsules over time. Cytoplasm is labelled with Calcein-AM—green colour (excitation: 488 nm, detection: 505–565 nm). Capsules are visualized via PD fluorescence—red colour (excitation: 671 nm, detection: 685–750 nm). Scale bar: 10 μm. b Time-dependent capsule uptake efficiency in RAW 264.7 cells. c Time-dependent capsule uptake efficiency in PMs. d Fluorescence images of PM migration to CT-26 spheroids after 24 h. CT-26 spheroids are stained with RAPID DiO lipophilic tracer—green colour (excitation: 460–495 nm, emission: 510–551 nm). PMs are stained with CFDA SE cell tracer—orange colour (excitation: 528–553 nm, emission: 578–663 nm). The (PArg/DS)4 capsules with PD are visualized via PD fluorescence—red colour (excitation: 620–650 nm, emission: 670–750 nm). Scale bar: 100 μm.
The persistence of microcapsules within RAW 264.7 and PM cells was monitored over 6 d using CLSM (Fig. 6a). RAW 264.7 cells exhibited minimal capsule internalisation, with most capsules remaining bound to the cell membrane, as confirmed by flow cytometry (Fig. 10S). In contrast, PMs actively internalised the (PArg/DS)4 capsules within 3 h and the (PAH/PSS)4 capsules within 24 h.
Morphological changes such as increased macrophage size were observed in the PMs exposed to the (PArg/DS)4 and (PAH/PSS)4 capsules on days 4 and 6, respectively. Despite these changes, Calcein AM staining confirmed cell viability throughout the study. Notably, the capsules retained their structural integrity and did not degrade over the 6-d observation period.
Additional viability assays were performed to confirm that prolonged intracellular persistence did not lead to delayed cytotoxicity. PMs were incubated with PD-loaded (PArg/DS) capsules and assessed using the AlamarBlue assay on days 1, 3, and 6 of culture. The results (Fig. 11S) showed a consistently high viability across all time points, with no statistically significant reduction.
To evaluate the migration of microcapsule-loaded macrophages toward spheroids, experiments were performed using only one selected capsule and one cell type. The PD-loaded (PArg/DS)4 and PM cells were used in this study. The decision to exclude PD-loaded (PAH/PSS)4 capsules was due to their poor uptake by macrophages; moreover, RAW 264.7 cells were not included further because of their low capsule capture efficiency for all formulations.
To mimic the tumour microenvironment, CT-26 spheroids were co-cultured with L929 fibroblasts at a 10:1 ratio. The migration of microcapsule-loaded PMs was analysed. Fluorescence images (Fig. 6d) revealed that both unloaded and capsule-loaded macrophages actively migrated to the spheroids, spread across their surfaces, and infiltrated the interior. Fluorescence from the PD-loaded microcapsules in the 670–750 nm emission range (PD, red colour) confirmed the successful delivery of the photosensitizer throughout the spheroids, especially in the group with capsule-loaded macrophages. A detailed view is presented in Fig. 12S.
-
Various drug delivery systems have been shown to trigger the activation and immune responses both in vitro and in vivo44,45. Nanocarriers, in particular, can be internalised by macrophages, resulting in modifications of the cell surface and the release of cytokines and chemokines. Understanding the mechanisms governing the interactions between nanocarriers and macrophages is crucial for designing targeted nanocarriers that are optimised for specific therapeutic applications. Leveraging the macrophage activity represents an innovative and effective strategy for treating a range of diseases46.
The effect of microcapsules on macrophage polarisation was assessed in the final phase of the in vitro experiments. PM polarisation following exposure to microcapsules was evaluated using flow cytometry. PMs were incubated with PD-loaded (PAH/PSS)4 and (PArg/DS)4 capsules with lipopolysaccharide (LPS) as a positive control for M1 polarisation. To identify macrophage subpopulations, antibodies against CD80 and CD163 were used as markers of the M1 and M2 phenotypes, respectively.
The proportions of macrophage subpopulations positive for CD80 (M1 marker47) and CD163 (M2 markers48) were determined using fluorescence intensity plots of the corresponding channels. Table 2 summarises the percentage of macrophages expressing these markers as a function of the incubation duration. Incubation with both (PAH/PSS)4 and (PArg/DS)4 capsules resulted in the rapid polarisation of PMs to the M1 state (CD80+). The (PArg/DS)4 capsules slightly enhanced the activation efficiency of the M1 macrophage population compared to the (PAH/PSS)4 capsules. The control group treated with LPS demonstrated a strong polarisation to the M1 state, validating the accuracy of the experiment. While in the population of cells that were not exposed to any influence, only minor subpopulations of M1 and M2 polarized macrophages are present.
(PAH/PSS)4 (PArg/DS)4 LPS CD80+ CD163+ CD80-/CD163- CD80+ CD163+ CD80-/CD163- CD80+ CD163+ CD80-/CD163- Control 7.6 ± 3.2% 6.5 ± 1.9% 85.9 ± 5.1% 7.6 ± 3.2% 6.5 ± 1.9% 85.9 ± 5.1% 7.6 ± 3.2% 6.5 ± 1.9% 85.9 ± 5.1% 6 h 86.3 ± 1.8% 1.9 ± 0.2% 11.8 ± 2.0% 99.2 ± 0.3% 0.7 ± 0.2% 0.1 ± 0.1% 96.8 ± 1.6% 1.7 ± 1.0% 1.5 ± 0.4% 12 h 96.0 ± 2.2% 0.4 ± 0.2% 3.6 ± 2.6% 99.6 ± 0.1% 0.3 ± 0.1% 0.1 ± 0.1% 97.3 ± 1.2% 1.0 ± 0.6% 1.7 ± 0.8% 24 h 88.8 ± 8.2% 1.8 ± 0.6% 9.4 ± 8.3% 99.7 ± 0.1% 0% 0.3 ± 0.1% 95.6 ± 1.9% 3.7 ± 2.2% 0.7 ± 0.3% Table 2. Analysis of PM polarization following incubation with (PAH/PSS)4 and (PArg/DS)4 microcapsules containing PD, with LPS used as control. The data represents the percentage of macrophages expressing CD80 (CD80+) and CD163 (CD163+) at different incubation times.
This pronounced M1-polarizing effect may be associated with the surface chemistry of the microcapsules. In this study, the terminal layers consisted of polystyrene sulfonate or dextran sulfate. Prior research suggests that sulfone and sulfonic acid groups on nanoparticle surfaces can promote M1-like activation of macrophages49. Moreover, polymeric materials, whether presented in two- or three-dimensional architectures, have frequently been shown to induce proinflammatory responses, including M1 polarization50,51. These reports indicate that polyelectrolyte shells, even in the absence of photosensitizers, can modulate immune cell phenotypes.
This intrinsic immunomodulatory property of the LbL microcapsules may be harnessed for therapeutic purposes. M1 polarisation is generally associated with antitumour activity and can enhance the effectiveness of macrophage-based therapies in oncology52, whereas in other contexts such as tissue regeneration or wound healing, a shift toward the M2 phenotype may be more desirable53. Thus, the rational design of the microcapsule composition, including the choice of terminal polyelectrolytes, can potentially fine-tune immune responses according to specific therapeutic goals.
The use of polarised macrophages for in vivo injections can influence the local microenvironment at the site of accumulation and modulate the recruitment of endogenous immune cells54. The authors believe that using autologously reprogrammed macrophages is less likely to overload the immune system and may gently restore the M1/M2 macrophage balance, in contrast to the systemic administration of immune checkpoint inhibitors, which can lead to immune-related adverse events55. However, the stability of ex vivo polarized macrophages after in vivo administration remains a critical and unresolved issue56. Therefore, investigating the long-term fate of macrophages, particularly regarding their safety and impact on immune homeostasis, is important in the context of repeated administration.
-
A PDT experiment was conducted on CT-26 tumour-bearing mice, with cells implanted subcutaneously into the left flank, to evaluate the therapeutic potential of macrophage-mediated delivery of photosensitizer-loaded microcapsules (Fig. 7). Mice were randomly assigned to five groups (n = 9 per group). 1) Control group (‘Control’): no treatment (negative control); 2) Macrophage group (‘PMs’): intratumoural injection of PMs without capsules (1 × 10⁶ to 1.2 × 10⁶ PMs); 3) Capsule group (‘Caps’): intratumoural injection of (PArg/DS)4 capsules loaded with PD (30 µg); 4) Macrophage-containing capsule group (‘PMs+Caps’): intratumoural injection of PMs containing (PArg/DS)4 capsules loaded with PD (1 × 10⁶ to 1.2 × 10⁶ PMs with encapsulated 30 µg of PD); 5) Free PD group (‘PD’): intratumoural injection of free photoditazine (30 µg) (positive control group).
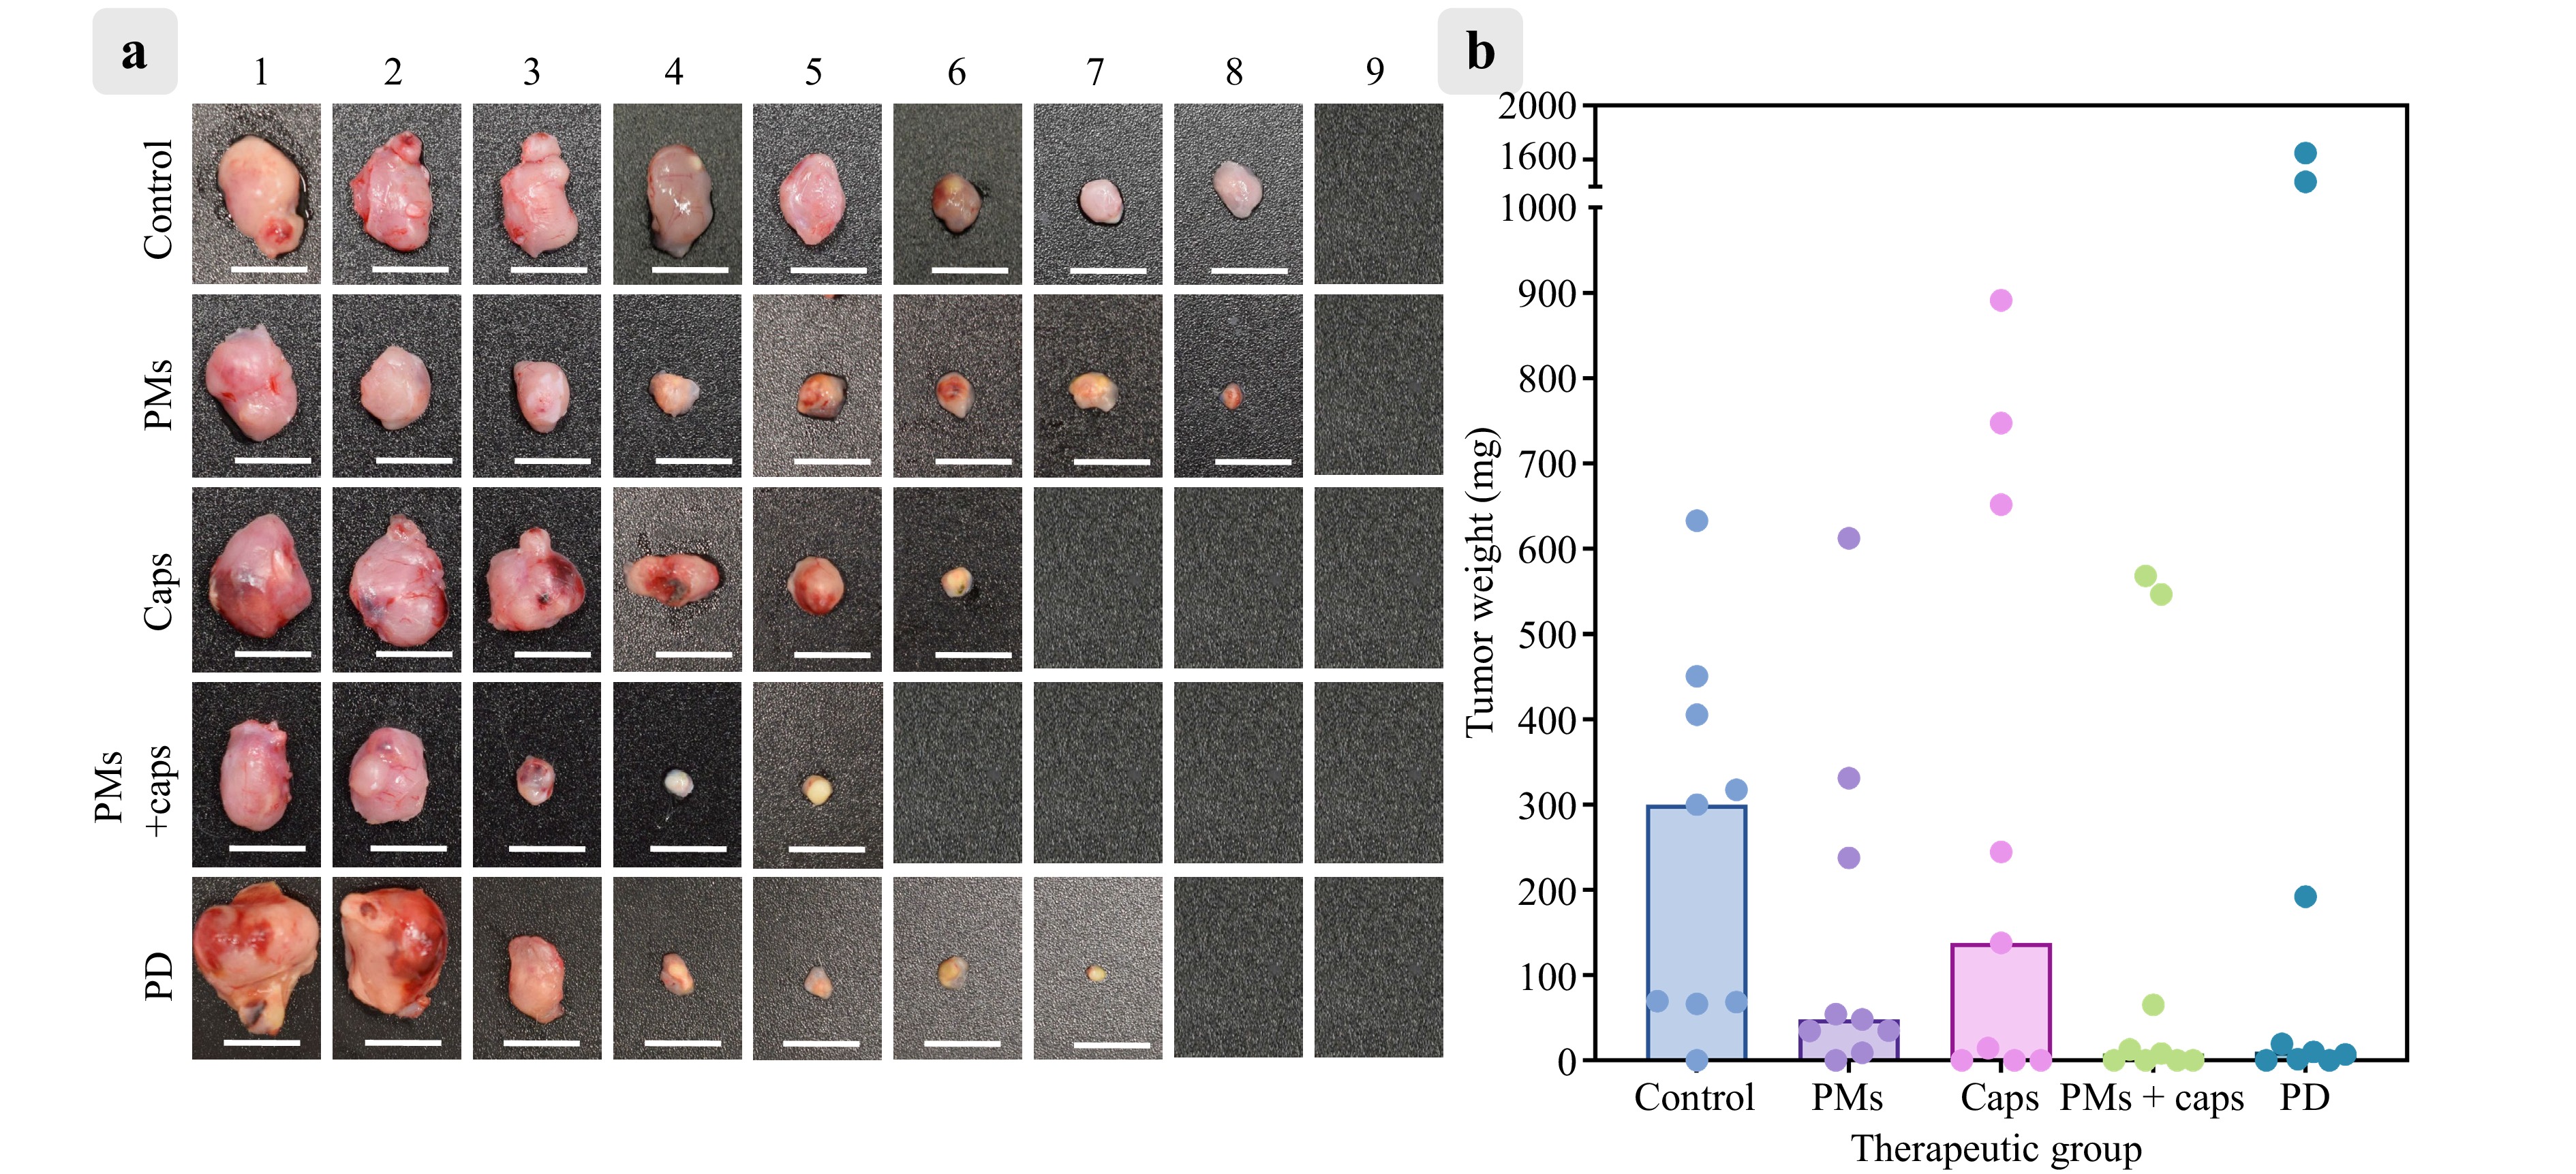
Fig. 7 a Representative tumour images from control mice (Control), mice receiving only peritoneal macrophages (PMs), and PDT-treated mice that received capsules (Caps), PMs with capsules (PMs + Caps), or free photoditazine (PD) (n = 9 in each group). Scale bar: 1 cm. b Tumour weights in the same groups after PDT. Bars indicate median values.
Although intravenous injection is a more clinically relevant delivery route, previous studies have indicated that macrophages, similar to other micron-sized delivery vehicles, tend to accumulate predominantly in the liver following systemic administration57. To maximise the local concentration at the tumour site and confirm the functional activity of the photosensitizer-loaded macrophages in situ, intratumoural injections were administered in this study. All treatment groups, except for the ‘Control’ and ‘PMs’ groups, received photodynamic therapy via 660 nm laser irradiation (120 mW/cm2, total energy dose 150 J) 24 h after injection to provide sufficient time for intratumoural redistribution and infiltration of macrophages carrying the LbL microcapsules. The tumours were excised and weighed 15 d post-inoculation. The median tumour weighted 299.7 mg for ‘Control’, 48.0 mg for ‘PMs’, 137.8 mg for ‘Caps’, 8.1 mg for ‘PMs + Caps’, and 9.9 mg for ‘PD’.
Although Kruskal–Wallis analysis (used because of non-normal distribution) followed by Dunn’s post hoc test revealed no statistically significant differences among the groups (adjusted p > 0.99 for ‘Control’ vs. ‘PMs’; p > 0.99 for ‘Control’ vs. ‘Caps’; p > 0.99 for ‘Control’ vs. ‘PD’; p = 0.55 for ‘Control’ vs. ‘PMs + Caps’), the biological outcomes suggest a promising therapeutic trend. Complete tumour regression was observed in four of the nine mice in the ‘PMs + Caps’ group. This was comparable to the ‘PD’ group, in which two out of nine mice achieved full regression. Similarly, in the ‘Caps’ group, three mice showed no detectable tumour tissue, whereas the others showed varying degrees of progression.
This variation in response reflects the inherent biological heterogeneity in tumour burden and immune response, sometimes observed in the CT-26 tumour model as well as in spontaneous regression58. Further optimisation of dose and timing and validation in larger cohorts are essential to reduce variability and improve reproducibility. Nonetheless, the substantial tumour mass reduction in the ‘PMs + Caps’ group supports the hypothesis that macrophage-mediated delivery improves the intratumoural bioavailability of photosensitizers, potentially increasing therapeutic efficacy in otherwise resistant tumours.
-
This study provided an in-depth evaluation of photosensitizer-loaded LbL microcapsules as a platform for macrophage-mediated photodynamic therapy. The results highlighted several critical aspects of this approach, offering insights into its potential and remaining challenges.
The photosensitizer photoditazine (PD), a derivative of chlorin e6, and the synthesised aluminum tetrasulfophthalocyanine chloride (PS) exhibited desirable characteristics for PDT. Both dyes demonstrated minimal dark toxicity at low concentrations and potent light-induced cytotoxicity, underscoring their suitability for effective and safe cellular transport of encapsulated cargo into tumours (Figs. 3 and 5). This aligns with the existing literature, which emphasises the importance of achieving strong phototoxic effects while minimising off-target toxicity59,60. Encapsulation within the LbL microcapsules provided additional advantages, ensuring controlled delivery and sustained stability of the photosensitizers. The shell compositions, (PAH/PSS)4, (PArg/DS)4, and (BSA/TA)4,were selected to represent a spectrum of synthetic, semi-natural, and fully natural materials with differing biodegradability profiles, enabling the evaluation of their potential for macrophage-mediated delivery of photodynamic dyes. The (PAH/PSS)4 system, composed of synthetic poly(allylamine hydrochloride) and poly(styrene sulfonate), served as a well-established and robust control with known physicochemical behavior61,62. In contrast, (PArg/DS)4, composed of poly-L-arginine and dextran sulfate, was chosen for its enhanced biocompatibility and enzymatic degradability63. The (BSA/TA)4 capsules utilised bovine serum albumin and tannic acid, forming natural protein–polyphenol networks with moderate stability and degradation under intracellular conditions64.
The performances of the different capsule shell variants varied significantly. The (BSA/TA)4 capsules exhibited substantial release rates and signal quenching, which hindered their imaging capabilities, whereas the (PAH/PSS)4 and (PArg/DS)4 capsules retained the photosensitizers more effectively and maintained compatibility with fluorescence imaging (Fig. 4d). These findings support the use of polyelectrolyte-based capsules as robust carriers of PDT agents65,66.
A critical aspect of this study was the evaluation of the macrophage-mediated delivery of photosensitizer-loaded capsules. Compared with other cell-based delivery systems such as mesenchymal stem cells (MSCs) or neutrophils, macrophages offer a unique combination of properties that make them particularly well-suited for photodynamic therapy33. Although MSCs have been used in tumour-targeted delivery because of their migratory behaviour, their ability to penetrate dense and hypoxic tumour cores is often limited, and they may exhibit undesired immunomodulatory effects or even support tumour progression in some contexts67. However, neutrophils are short-lived and have a limited capacity for cargo loading68. In contrast, macrophages exhibit strong tumour-homing behaviour, high phagocytic capacity, extended viability, and compatibility with large particulate carriers, such as LbL microcapsules42. These characteristics enable them to function effectively as ‘Trojan horse’ delivery vehicles capable of penetrating complex tumour microenvironments while retaining therapeutic payloads for extended periods.
The study findings revealed distinct behaviours between RAW 264.7 cells and the PMs in terms of capsule internalisation (Fig. 6b). RAW cells predominantly retained capsules on their surfaces, whereas the PMs efficiently internalised both capsule types, particularly the (PArg/DS)4 variant (Fig. 6c). This disparity underscores the importance of selecting appropriate macrophage populations for therapeutic applications.
In addition to cell type, capsule size and mechanical properties influence uptake. Previously reported data showed that large (PArg/DS)4 magnetic microcapsules (2.7 μm) were internalized by RAW 264.7 cells more efficiently than smaller 1 μm capsules, with uptake reaching 93.1 ± 0.8%, although these capsules did not contain a photodynamic dye69. This suggests that a size of approximately 3 μm may further enhance microcapsule uptake by macrophages. Nevertheless, uptake is not determined by size alone; surface charge, encapsulated substances, and the capsule-to-cell ratio also play critical roles39,70.
In parallel, capsule stiffness, governed by shell thickness and composition, has been shown to significantly affect the internalisation efficiency. For example, 2-layer microcapsules are internalised by HepG2 cells more rapidly and in greater amounts than their 10-layer counterparts, underscoring the role of stiffness in uptake71. This study experimentally investigated PD-loaded (PAH/PSS)4 and (PArg/DS)4 capsules with comparable shell thicknesses (200 ± 7 nm and 175 ± 8 nm, respectively). The mechanical behaviour was influenced by the thickness and chemical structure of the capsule shell. For instance, the guanidinium groups of polyarginine can interact strongly with cell membranes; this likely explains the more efficient internalisation of the (PArg/DS)4 capsules compared to the (PAH/PSS)4 capsules72.
Additionally, the prolonged stability of the (PArg/DS)4 capsules within PMs, persisting for six days without significant degradation, was a surprising result (Fig. 6a). Previous studies have reported the rapid degradation of similar capsules within macrophages (Raw 264.7), typically within 24 h57. Complete degradation of (PArg/DS)4 microcapsules within 60 h has also been shown in cells derived from the kidneys of African green monkeys (VERO-1)73. This discrepancy can be attributed to several factors. First, the increased number of shell layers in the system (four bilayers) may confer enhanced resistance to enzymatic degradation compared to thinner-walled capsules, as suggested in the literature74. Second, capsule size may influence phagosomal processing; larger microcapsules (~6.5 μm in this study) may undergo slower trafficking or incomplete lysosomal fusion than smaller submicron particles. Third, the encapsulated photosensitizers may alter the intracellular microenvironment by affecting lysosomal pH or enzymatic activity, potentially contributing to capsule stabilization75. Collectively, these features may account for the observed 6-d structural integrity of the capsules inside the macrophages. This enhanced intracellular retention represents a significant advantage for sustained delivery and may enable prolonged therapeutic action in vivo.
The migration experimental results (Fig. 6d) further validated the potential of the proposed platform by demonstrating the ability of capsule-loaded PMs to penetrate spheroids that mimic tumour microenvironments. The observed fluorescence within the spheroid interior confirmed the effective delivery of the photosensitizers, addressing one of the primary challenges in solid tumour therapy—heterogeneous drug distribution. These results align with those of previous studies showing that macrophages naturally tend to infiltrate tumour regions, thereby enhancing the therapeutic efficacy of macrophage-mediated systems to overcome the limitations of traditional PDT.
Despite promising in vitro findings, the in vivo PDT experiments presented mixed results. The therapeutic effect was not sufficiently pronounced to achieve complete tumour regression, likely because of the large tumour size at the start of the experiment (Fig. 7). This challenge is well-documented in the literature, highlighting the difficulties in achieving complete ablation in large, established tumors76. Factors such as uneven light distribution and large tumour size likely contributed to the suboptimal results observed in this study. Therefore, innovative approaches are required to address these issues. For instance, incorporating nanozymes to alleviate tumour hypoxia by catalysing the conversion of hydrogen peroxide to oxygen can enhance PDT efficacy77,78. Similarly, integrating novel materials, such as microbubbles, with photosensitizers in their shells offers a promising strategy for overcoming hypoxia and improving therapeutic outcomes79,80. Furthermore, new optical methods, such as advanced photonics systems81 and multiphoton excitation techniques82, can improve light delivery to deep tumour regions. These emerging strategies provide a roadmap for future research aimed at overcoming the limitations of traditional PDT.
Several critical factors should be considered to bridge the gap between the study findings and the clinical implementation. These include the scalability and reproducibility of microcapsule synthesis (e.g. through high-throughput or microfluidic approaches), development of standardised protocols for the isolation and ex vivo expansion of patient-derived macrophages, and stringent control over their activation and polarisation states. Additionally, a thorough evaluation of the long-term safety, immunogenicity, and biodistribution is essential to ensure clinical relevance in preclinical studies. Nevertheless, the modular design of the proposed LbL system and its favourable compatibility with immune cell carriers make this approach a promising candidate for the development of a personalised cell-based therapeutic platform for photodynamic treatment of solid tumours.
-
This study revealed the potential of photosensitizer-loaded LbL microcapsules in macrophage-mediated PDT, particularly for addressing suboptimal drug delivery and the inherent complexity of tumour microenvironments. By leveraging the innate tumour-homing properties of macrophages and optimising microcapsule design, this study demonstrated effective photosensitizer delivery and sustained phototoxicity while maintaining minimal off-target effects. Although the in vitro results were promising, the in vivo experiments revealed challenges, particularly with larger tumours, emphasising the need for novel approaches to overcome issues such as hypoxia and uneven light distribution. Translating these findings into clinical applications will require further optimisation of combination therapies as well as the development of advanced imaging methods to monitor therapeutic progress.
-
Poly(allylamine hydrochloride) (PAH, Mw = 17.5 kDa), poly(4-styrene sulfonate) sodium salt (PSS, Mw = 70 kDa), bovine serum albumin (BSA), tannic acid (TA), poly-L-arginine (PArg, Mw = 70 kDa), dextran sulfate sodium salt (DS, Mw = 40 kDa), ethylenediaminetetraacetic acid (EDTA) disodium salt, sodium chloride, calcium chloride dihydrate, and sodium carbonate were sourced from Sigma-Aldrich. The photoditazine was obtained from LLC Veta-Grand (Russia). Cell culture media, including Dulbecco’s Modified Eagle’s Medium (DMEM) and Roswell Park Memorial Institute Medium (RPMI-1640), and supplements such as foetal bovine serum (FBS), penicillin-streptomycin, Dulbecco’s phosphate-buffered saline (DPBS, without Ca/Mg), and trypsin-EDTA (0.25% with phenol red), were supplied by Gibco (UK). Alamar Blue was acquired from Invitrogen (USA). Phosphate-buffered saline (PBS) and calcein-AM dye were purchased from Thermo Fisher Scientific. RAPID DiO and carboxyfluorescein diacetate succinimidyl ester (CFDA SE) fluorescent dyes were purchased from LumiProbe. Solutions were prepared using deionised (DI) water (resistivity > 18.2 MΩ·cm at 25 °C) from a Milli-Q® Direct 8 water purification system (Merck Millipore).
Aluminum chloride (Sigma-Aldrich) and phthalonitrile (Sigma-Aldrich) were used as received. For the synthesis of aluminum tetrasulfophthalocyanine chloride (PS), all reactions were monitored by thin-layer chromatography (TLC) using aluminum sheets (silica gel, ALUGRAM SIL G UV254, 20 cm × 20 cm, MACHEREY-NAGEL) and/or UV-Vis spectroscopy until the starting materials were completely consumed, unless specified otherwise. Attenuated total reflection–Fourier transform infrared (ATR–FT-IR) spectra were recorded using a Thermo Scientific Nicolet iS5 FT-IR spectrometer (spectral resolution: Δλ = 4 cm−1). Matrix-assisted laser desorption/ionization time-of-flight (MALDI-TOF) mass spectra were acquired using a Bruker Autoflex II mass spectrometer with 2,5-dihydroxybenzoic acid (DHB) as the matrix. High-resolution mass spectra (HRMS) were recorded on a G3 quadrupole time-of-flight mass spectrometer (Waters Corp., USA) equipped with an electrospray ionisation (ESI) source in both positive and negative ion modes. ESI conditions included water as the eluent, an ion source temperature of 450 °C, and nitrogen gas pressures of 40 psi (drying and nebulising) and 25 psi (curtain), with a capillary voltage of 1500 V.
-
Aluminum tetrasulfophthalocyanine chloride (PS), a photosensitizers used in this study, was synthesised in two steps.
In the first step, aluminum phthalocyanine chloride (AlPc) was synthesized by dissolving 1,2-phthalodinitrile (1 mmol) and aluminum (III) chloride (0.3 mmol) in 5 mL of 1,2-dichlorobenzene in an argon atmosphere inside a 25 mL double-necked flask. Subsequently, 10 µL of 1,8-diazabicyclo[5.4.0]undec-7-ene was added to the mixture, and the reaction occurred at boiling temperature for 5 h. Upon completion, the solvent was removed by rotary evaporation, and the product was recrystallised from ethanol. Yield was 115 mg (83%); melting Point > 300 °C; UV-Vis (dimethylformamide): λmax (log ε); and nm = 675 (5.25), 608 (4.63), and 355 (4.85). MS MALDI-TOF (m/z): 556 ([M+], 100%). IR-FTIR (ν, cm-1): 3650–2100 (O–H), 1636 (C = C), 1495 (N = C), 1477 (C–), 1407 (C–C), 1327 (pyrrole), 1252, 1196, 1085 (CAr–H), 958, 922 (isoindole + meso atoms), 847 (CAr–H), 776, 753 (aromatic rings), and 715–400 (Al–O).
In the second step, tetrasubstituted aluminum sulfophthalocyanine (PS) was synthesized by reacting 100 mg of unsubstituted aluminum phthalocyanine chloride (0.2 mmol) with 25 mL of oleum (≥ 24%) in a 50 mL flask. The mixture was stirred at 100 °C for 72 h under a reflux conditions. After the reaction, the mixture was poured onto 10 g of crushed ice, and the resulting precipitate was filtered and washed with a cold acetone–water mixture (1:1). The precipitate was then heated with 25 mL of 10% HCl at 60 °C for 3 h, filtered, and washed with 10% HCl (3 × 10 mL). Finally, the product was boiled in 25 mL of absolute isopropyl alcohol for 1 h, cooled to 40 °C, filtered, washed with isopropanol, and dried under vacuum. Yield: 115 mg (74%). Melting Point > 300 °C. UV-Vis (dimethylformamide): λmax (log ε); nm = 685 (4.95), 616 (4.48), and 361 (4.75). MS ESI-QTOF (m/z): Found 894.9284 ([M + H]+); molecular formula: C32H16AlN8O12S4; and calculated 894.9352.
-
The extinction spectra of free photosensitizers and microcapsules were measured using a Tecan Infinite M Nano+ multifunctional microplate reader (Tecan Trading AG, Switzerland) and an SF-2000 UV/Vis spectrophotometre (OKB Spectr, Russia) at 25 °C. All measurements were conducted in DI water. Solutions or suspensions were transferred to quartz cuvettes or microplate wells for analysis.
-
Spherical porous vaterite particles (6.2 ± 0.5 μm in diameter) were synthesised following a method reported by Volodkin et al.83. To increase the amount of product and improve the size repeatability, synthesis was performed using a TetraQuant CR-1B chemical reactor (TetraQuant Ltd., Russia). A 50 mL solution of 1 M CaCl2 was mixed with 50 mL of 1 M Na2CO3 in 300 mL of DI water under vigorous stirring. The resulting microparticle suspension was vacuum-filtered and washed twice with DI water and once with ethanol. The cleaned particles were dried in a vacuum oven at 50 °C, and the resulting vaterite powder was collected.
-
LbL microcapsules were prepared following a procedure described in standard methods84,85. The vaterite cores were loaded with photosensitizers (PD or PS) at a concentration of 1 mg/mL in DI water using a freezing-induced loading technique86. Dye incorporation was achieved through three freezing cycles (each cycle duration was 2 h and the temperature was −18 °C) using a TetraQuant R-1 mini-rotating device (TetraQuant LLC, Russia). The loaded particles were coated with alternating polyelectrolyte layers of PAH/PSS, PArg/DS, or BSA/TA. PAH, PSS, PArg, and DS were prepared at 1 mg/mL in 0.15 M NaCl, whereas BSA and TA were prepared at 1 mg/mL in DI water. Each layer was adsorbed onto the vaterite particles for 10 min on a rotator and washed three times with DI water via centrifugation (1400 × g, 2 min). Four bilayers were applied to each formulation: (PAH/PSS)4, (PArg/DS)4, and (BSA/TA)4. To dissolve the vaterite cores, a 0.2 M EDTA solution was added dropwise over several hours. Following core dissolution, the suspension was washed thrice with DI water via centrifugation and subsequently dispersed in physiological saline, yielding the final microcapsules. At all stages of capsule synthesis, the supernatants were collected to quantify the loading efficiency of the photosensitizers.
-
The amount of photosensitizer encapsulated in the microcapsules was determined using a Tecan Infinite M Nano+ multifunctional microplate reader (Tecan Trading AG, Switzerland). The absorbances of photoditazine (PD) and aluminum tetrasulfophthalocyanine chloride (PS) was measured at 405 and 675 nm, respectively. Calibration curves were prepared for each photosensitizer in DI water (Fig. 4c). The amount of drug remaining in the supernatant collected during capsule synthesis was measured and the encapsulated amount was calculated as the difference between the initial drug mass used for freeze-induced loading and the total drug mass in the supernatant.
-
ζ-potential measurements were performed using a ZetaSizer Nano ZS analyser (Malvern Panalytical, UK). Measurements were carried out for (i) empty vaterite cores, (ii) dye-loaded vaterite cores, and (iii) particles after polyelectrolyte layer deposition (following three washing steps with DI water; Fig. 5S), as well as for (iv) final microcapsules and (v) microcapsules after incubation in a medium (incubated at 37 °C in RPMI containing 10% FBS with shaking at 300 rpm for 1 h in a thermoshaker, followed by three washing steps with DI water; Fig. 6S). The samples were diluted 50-fold in DI water and transferred to disposable U-shaped capillary cuvettes for analysis. Measurements were conducted at 25 °C, with each sample analysed thrice. The results, including the mean values and standard deviations, were processed using ZetaSizer Software 8.00.
-
The diameters of the microcapsules were analysed using a MIRA II LMU scanning electron microscope (Tescan, Czech Republic). A drop of the sample suspension was deposited on a silicon wafer, dried completely, and coated with a ~5 nm gold layer using a rotary-pumped sputter coater (Emitech K350, UK). SEM images were acquired at 30 kV and analysed using ImageJ v.1.54i. The diameters were calculated based on measurements of at least 100 microcapsules.
-
Cells and microcapsules were visualised using a Leica TCS SP8 X confocal laser scanning microscope (Leica, Germany). Imaging was conducted using a 20×/0.70 NA air objective and a discrete constant laser. Calcein AM dye was excited at 488 nm and fluorescence was detected in the 505–540 nm range (green channel). The PD and PS dyes were excited at 671 nm, and fluorescence was detected in the 686–790 nm range (NIR channel).
-
AFM imaging of the microcapsules was performed using an NTEGRA Spectra microscope (NTMDT-SI, Russia) in tapping mode. NSG10 probes (NTMDT, Russia) with a resonance frequency of 140–390 kHz, a force constant of 3.1–37.6 N·m−1, and a tip curvature of 10 nm were utilised. The samples were prepared by depositing and drying a droplet of the microcapsule suspension in DI water on a glass microscope slide. AFM data analysis was conducted using the Gwyddion software. Only flat planar regions were selected by applying a binary mask to minimise artefacts introduced by capsule deformation during drying. Height profiles were extracted from these masked regions, and the height distributions were fitted with Gaussian functions. The distance between the maxima corresponding to the glass substrate and the capsule shell was taken as the double-shell thickness. At least 15 capsules per sample were analysed, and the results were averaged to obtain the mean thickness values reported in Table 1 together with their standard deviations.
-
The release kinetics of the encapsulated agents from the microcapsules were evaluated in 0.9% physiological saline (NaCl) at pH ~7.4, simulating neutral physiological conditions. Microcapsules were incubated at 37 °C and stirred at 300 rpm in 400 μL of saline using a thermoshaker. Each day, the samples were centrifuged at 3000 × g for 10 min, and half of the supernatant was collected and replaced with an equal volume of fresh saline. The concentration of the released photosensitizers was measured spectrophotometrically over a seven-day period. The release profiles were generated from cumulative measurements.
-
To obtain reliable and repeatable PDT data for different agents, a self-designed and compact LED-based illuminator was used. It comprised an array of TDS-P003L4N03, 660 nm LEDs placed in a frequently used series-parallel configuration. The light-guiding component provided spatially uniform irradiation to the 96-well plate. The output-power range of the device was measured using a Thorlabs PM100A power meter equipped with an S121C probe. The relative error in the power settings was 6% ± 2%. The temporal stability of the power density within the operational range was estimated to be ~1.5%. The temporal stability of the LED spectrum was assessed using a USB fibre spectrometer Thorlabs CCS200/M and was computed to be ~0.3%. All the parameters were evaluated within 30 min of the operation. For the thermal monitoring of the LED device, a PCB was equipped with a thermistor. Within the operational power densities, the PCB temperature did not exceed 30 °C and the temperature within the well of the black-walled 96-well plate did not exceed 37 °C, thereby ensuring safe operation. The temperature within the well plate was measured using a UT320-D multichannel thermometer equipped with a miniature bi-metal thermocouple.
-
In vitro assessment of the dark and light toxicity of the photosensitizers and microcapsules was conducted using various cell lines (CT-26, L929, RAW 264.7, and PMs). To enhance agent uptake, cells were seeded in 96-well plates at a density of 10,000 cells/well for photosensitizer experiments and 35,000 cells/well for microcapsule studies. After 12 h of incubation at 37 °C in a 5% CO2 atmosphere, the nutrient medium was replaced with solution containing photosensitizers or microcapsules. The control wells were supplemented with an equivalent volume of DPBS. Cell viability was measured using the Alamar Blue assay after 24 h. For light toxicity studies, cells were incubated with the agents for 3 h and then irradiated with 660 nm diodes for 20 min, delivering an energy density of 20 J/cm2. Cell viability was assessed 24 h post-irradiation using the same assay.
-
Microcapsule uptake efficiency and intracellular behaviour were evaluated using an Amnis ImageStream imaging flow cytometer. RAW 264.7 cells and PMs were seeded at a density of 400,000 cells/well in 12-well plates and prestained with Calcein AM (green fluorescence, marking the cytoplasm) and Hoechst 33258 (blue fluorescence, marking nuclei). The fluorescence of the encapsulated PD dye (red channel) was used to track microcapsule internalisation. Cells were prepared in suspension and analysed under laser settings of 405 nm (30 mW), 488 nm (5 mW), and 642 nm (150 mW). The intracellular localisation of the microcapsules was verified using the co-localisation analysis tools available in the instrument’s software.
-
Polarisation analysis of the PMs was conducted following incubation with (PAH/PSS)4 or (PArg/DS)4 microcapsules, or lipopolysaccharide (LPS, 100 ng/mL) as the M1 polarisation control. Cells (250,000 cells per well) were cultured in 24-well plates and stained with antibodies against CD80, CD163, and F4/80 ( macrophage markers). Antibody stock solutions were diluted in HBSS buffer, and 50 μL of staining solution was added to each sample. Staining was performed on ice for 30 minutes, followed by centrifugation and washing with DPBS containing 2% serum. Compensation controls were prepared for each antibody. The samples were analysed using an Amnis ImageStream flow cytometer with the lasers set at 405 nm (120 mW), 488 nm (130 mW), and 561 nm (75 mW). Data processing focused on assessing the macrophage polarisation states through surface marker expression.
-
The migration potential of macrophages, both loaded and unloaded with microcapsules, into CT-26 spheroids was assessed. CT-26 cells were co-cultured with L929 fibroblasts at a 10:1 ratio of. This ratio was determined experimentally because it consistently produced dense and stable spheroids. The co-cultivation of cancer cells with fibroblasts or stem cells is a commonly used strategy to generate spheroids, particularly for cell types with low intercellular adhesion87. The cells were stained with RAPID DiO lipophilic tracer (in RPMI without FBS) for 10 min, washed thoroughly with DPBS, and seeded in a 96-well low-adhesion plate (RPMI, 10% FBS) to promote spheroid formation. Each well contained 1000 CT-26 cells and 100 L929 fibroblasts. On the third day of spheroid formation, the spheroids were divided into four experimental groups: 1) Control: no addition; 2) Caps: added (PArg/DS)4 capsules containing PD; 3) PMs: added macrophages pre-stained with CFDA SE cell tracer; and 4) PMs+Caps: added macrophages pre-stained with CFDA SE and loaded with PD-containing (PArg/DS)4 capsules. Fluorescence imaging was performed 24 h after addition of the agents to evaluate their distribution within the spheroids.
-
This study adhered to the guidelines of the Saratov State Medical University and the Geneva Convention of 1985 (International Guiding Principles for Biomedical Research Involving Animals). Male BALB/c mice (6–8 weeks old, weighing 20–25 g) were used. Prior to experimental procedures, the mice were anaesthetised via intraperitoneal injection of 80 μL of a mixture comprising Zoletil (10 mg/mL, Virbac SA, Carros, France) and 2% Rometar (Spofa, Czech Republic) in a 3:1 ratio. For procedures involving PMs isolation from the abdominal cavity, the same anaesthesia composition was injected into the retroorbital sinus in a volume of 30 μL.
The photodynamic therapy experiment was conducted using CT-26 tumour-bearing mice. CT-26 cells (1 × 10⁶ cells in 10 µL of RPMI, 0% FBS) were implanted subcutaneously into the left flank. For personalised delivery, PMs were isolated from CT-26 tumour-bearing mice on day 7 post-inoculation and seeded in 12-well plates containing complete culture medium (RPMI, 10% FBS). After 1 h, the cells were thoroughly rinsed with DPBS buffer, and (PArg/DS)4 capsules containing PD (in RPMI, 2% FBS) were added. After 3 h, when the capsules were captured by the PMs, the macrophages were carefully removed from the wells and injected intratumourally into the same mouse (in RPMI, 0% FBS). For the in vivo photodynamic response experiment, mice were allocated into four groups (n = 9 per group): 1) Control group: no injections; 2) Macrophage group: intratumoural injection of PMs without capsules (1 × 10⁶ to 1.2 × 10⁶ PMs); 3) Capsule group: intratumoural injection of (PArg/DS)4 capsules loaded with PD (30 µg); 4) Macrophage-containing capsule group: intratumoural injection of PMs containing (PArg/DS)4 capsules loaded with PD (1 × 10⁶ to 1.2 × 10⁶ PMs with encapsulated 30 µg of PD); 5) Free PD group: intratumoural injection of PD in free form (30 µg). Photodynamic therapy was performed 24 h post-injection using a 660 nm surgical diode laser (LED phototherapeutic device, Polironik, Russia) at an irradiation intensity of 120 mW/cm2, delivering a total energy dose of 150 J. Therapeutic effects were assessed 15 d after tumour inoculation.
-
Statistical analysis was performed using GraphPad Prism 10.2.3, and the results were expressed as mean ± standard deviation (SD). IC50 values were calculated by fitting a sigmoidal dose-response curve to a 4-parameter logistic model. Group differences were analysed using two-way ANOVA followed by Dunnett’s post-hoc test or the Kruskal–Wallis test followed by Dunn’s post-hoc test. Differences were considered statistically significant at p < 0.05.
-
This research was supported by the Russian Science Foundation (grant no. 23-75-10070). Mass spectrometry studies were supported by the Development Program of Lomonosov Moscow State University. Graphical abstract was created in BioRender. Terentyeva, D. (2025) https://BioRender.com/lj3o3ib. Figure 1 was created in BioRender. Terentyeva, D. (2025) https://BioRender.com/g7rp5be.
Macrophage-mediated delivery of microcapsules for enhanced photodynamic therapy of colon cancer
- Light: Advanced Manufacturing , Article number: (2026)
- Received: 11 January 2025
- Revised: 23 October 2025
- Accepted: 03 November 2025 Published online: 12 January 2026
doi: https://doi.org/10.37188/lam.2026.002
Abstract: Photodynamic therapy (PDT) is a promising strategy for treating solid tumours due to its spatially controlled, light-triggered cytotoxicity. Although recent advances in optical technologies have improved light delivery, PDT efficacy remains limited by insufficient drug accumulation in tumours, largely due to the complexity of the tumour microenvironment. To address this challenge, a macrophage-mediated delivery platform was developed using layer-by-layer (LbL) microcapsules loaded with second-generation photosensitizers: photoditazine (PD) and aluminum tetrasulfophthalocyanine chloride (PS). Both photosensitizers exhibited low dark toxicity and high phototoxicity, enabling their safe transport by carrier cells. The photosensitizers were efficiently encapsulated into LbL microcapsules (6.2 ± 0.5 μm) with different shell compositions. Significant differences were observed between macrophage types: RAW 264.7 macrophages predominantly retained capsules on the cell surface, whereas primary peritoneal macrophages (PMs) internalised capsules within 3 h and retained them for up to 6 d without degradation. Among the tested formulations, polyarginine/dextran sulfate ((PArg/DS)4) capsules loaded with PD demonstrated the highest uptake efficiency and supported macrophage migration into tumour spheroids. In vivo experiments using a CT-26 colon cancer model confirmed the therapeutic potential of this platform, while highlighting the need for further optimisation for large tumours. This study provides new insights into cell-mediated delivery systems and underscores their potential to enhance PDT outcomes beyond current limitations.
Research Summary
Macrophages carry light-activated drugs into tumors
Immune cells can be turned into “Trojan horses” that transport drug-loaded capsules into tumors, offering a new boost for photodynamic therapy (PDT). Daria A. Terentyeva from Skoltech and collaborators engineered layer-by-layer microcapsules containing photosensitizers and showed that peritoneal macrophages can internalize and retain them for several days. This enabled effective delivery into tumor spheroids and tumor regression in a CT-26 colon cancer model. By combining light-activated drugs with the natural tumor-homing ability of macrophages, the approach addresses persistent barriers of poor drug penetration in solid tumors and paves the way for more effective PDT strategies.
Rights and permissions
Open Access This article is licensed under a Creative Commons Attribution 4.0 International License, which permits use, sharing, adaptation, distribution and reproduction in any medium or format, as long as you give appropriate credit to the original author(s) and the source, provide a link to the Creative Commons license, and indicate if changes were made. The images or other third party material in this article are included in the article′s Creative Commons license, unless indicated otherwise in a credit line to the material. If material is not included in the article′s Creative Commons license and your intended use is not permitted by statutory regulation or exceeds the permitted use, you will need to obtain permission directly from the copyright holder. To view a copy of this license, visit http://creativecommons.org/licenses/by/4.0/.

 DownLoad: