




-
Optical systems engineered to operate at or near the diffraction limit increasingly depend on controlling the optical wavefront, rather than solely increasing source brilliance or detector sensitivity. This wavefront-centric regime spans a broad range of applications, including high-resolution imaging1, optical inspection2, and short-wavelength instrumentation3. In this regime, nanometer-scale surface-figure deviations manifest as phase aberrations and cannot, in general, be fully mitigated by downstream alignment or tuning. As manufacturing and alignment tolerances tighten, performance must therefore be treated as an emergent property of the full process chain, encompassing deterministic surface figuring, metrology with rigorously quantified uncertainty, predictive wave-optics modeling, and opto-mechanical integration that preserves the characterized surface state after mounting.
Hard X-ray nanofocusing provides a stringent exemplar of this broader manufacturing problem. In diffraction-limited storage rings, increased coherent flux exacerbates the sensitivity of the propagated wavefront to beamline-optics distortions; in practice, grazing-incidence focusing mirrors often set the lower bound on achievable probe size and positional stability4. Elliptical Kirkpatrick–Baez (KB) systems remain the predominant approach because they provide high efficiency over a broad photon-energy range with negligible chromatic aberration5. The concept originates from the imaging geometry proposed by Kirkpatrick and Baez6, which established the canonical two-mirror configuration that converts mutually orthogonal line foci from two sequentially placed mirrors into a common focal point (Fig. 1a). Throughout this manuscript, we refer to the orthogonal KB mirrors as the horizontal KB mirror (HKB) and vertical KB mirror (VKB).
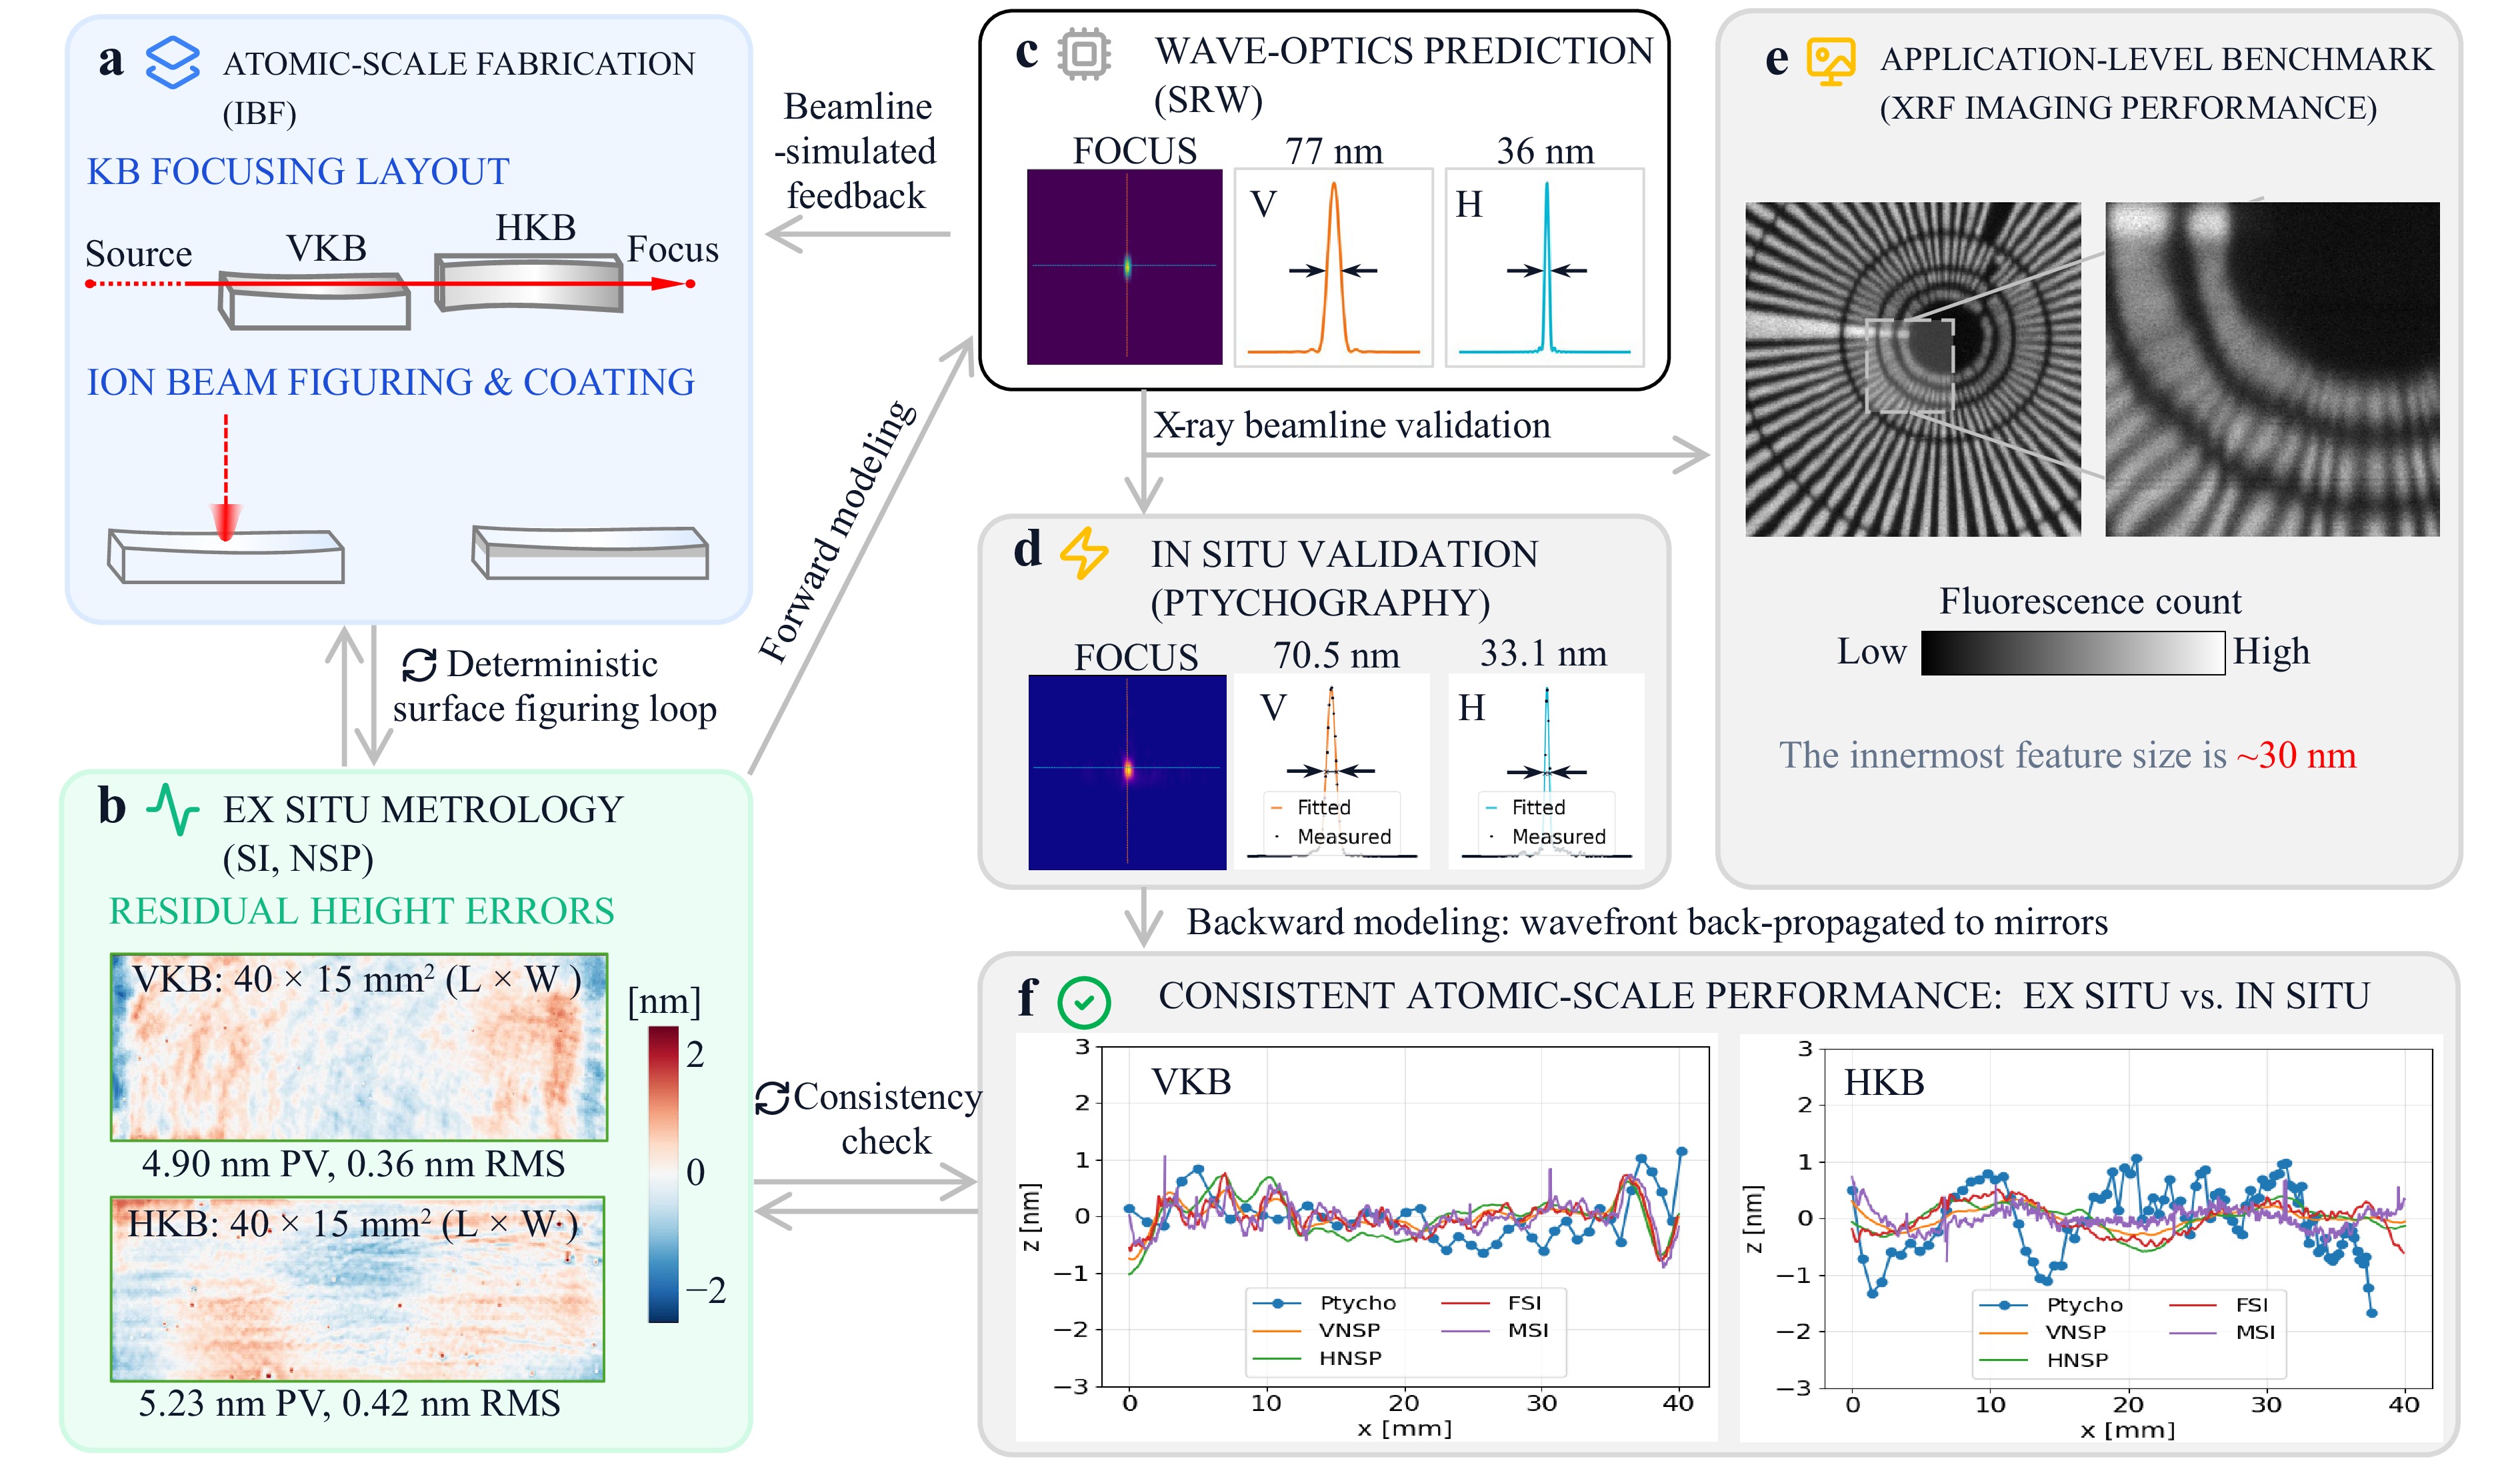
Fig. 1 Comprehensive in-house pipeline for atomic-scale fabrication and in situ validation of Kirkpatrick–Baez (KB) nanofocusing mirrors at the National Synchrotron Light Source II (NSLS-II). a Atomic-scale mirror fabrication employing ion beam figuring (IBF) for deterministic correction of elliptical surface profiles, followed by rhodium coating. b Ex situ surface metrology demonstrating sub-nanometer residual height errors of 0.4 nm Root-Mean-Square (RMS) after IBF processing and coating. c Numerical modeling of the nanoprobe at 12 keV using Synchrotron Radiation Workshop (SRW) to simulate wavefront propagation under partial coherence; the predicted focal spot size is 77 × 36 nm2 (V × H, Full Width at Half Maximum (FWHM)) for a 8 × 7 µm2 secondary source aperture (SSA). d In situ ptychographic characterization of the nanoprobe at the NSLS-II HXN beamline, yielding a reconstructed focal spot of 70.5 × 33.1 nm2 (FWHM), in high agreement with the SRW simulation. e X-ray fluorescence (XRF) microscopy of a Siemens star test structure, resolving the innermost features at length scales on the order of ~30 nm. f Quantitative validation of the fabrication–metrology loop, demonstrating spatial correspondence between ex situ surface residuals and in situ wavefront errors, thereby confirming atomic-scale deterministic fabrication performance.
From the perspective of scanning X-ray microscopy, the performance of a KB system cannot be reduced to a single scalar specification such as focal-spot Full Width at Half Maximum (FWHM). Different spatial-frequency bands of mirror error map to distinct penalties in the delivered Point Spread Function (PSF). Low-spatial-frequency figure errors primarily act as defocus and astigmatism, broadening the PSF core and directly degrading real-space resolution. By contrast, higher-spatial-frequency errors (mid-spatial-frequency height/slope structure and roughness-driven scattering) redistribute power from the diffraction-limited core into structured sidelobes or a diffuse halo. In scanning X-ray microscopy, this redistributed energy elevates the out-of-focus background and suppresses image contrast, often limiting detectability of weak features even when the measured FWHM of the central lobe remains near the diffraction limit. Ptychography partially circumvents this limitation because it reconstructs the complex probe and can tolerate non-Gaussian structure in the illumination. However, most real-space contrast mechanisms (e.g., fluorescence imaging) do not, and therefore remain sensitive to PSF wings and background.
Deterministic ion beam figuring (IBF) can achieve sub-nanometer residuals on grazing-incidence optics while introducing minimal surface or subsurface damage7. With appropriate tuning of ion energy and incidence angle, IBF can also preserve, and in some regimes improve, surface roughness8. Recent work on ultrasmooth Si surfaces under scanning Ar ion-beam etching further shows that surface evolution depends on the competition between ion-induced smoothing and contamination-driven roughening, emphasizing the importance of contamination control when atomic-scale figure correction must preserve high-spatial-frequency surface quality9. Reliable loop convergence, however, depends not only on removal physics but also on the integrated control framework of robust dwell-time optimization, careful boundary handling, and smooth motion planning that accounts for system dynamics. Fourier-domain dwell-time methods and their extensions10 stabilize convergence when the clear aperture must be embedded in a computational dwell grid and when removal is constrained by tool-influence-function (TIF) support and finite measurement aperture. Advanced schedulers then map the desired material-removal (i.e., dwell time) distribution onto continuous trajectories that enforce velocity and acceleration limits, and provide compensation when dynamic constraints would otherwise be violated11, 12. Recent synchrotron-mirror work further emphasizes hybrid height-slope figuring to target the error modes most relevant to focusing performance13.
In parallel, metrology for curved, off-axis X-ray mirrors has advanced along two coupled directions. The first direction is large-aperture integration of surface-height data via stitching interferometry (SI). SI provides a full 2D map of the optical surface with nanometer-level height resolution and sub-nanometer repeatability. The development of relative angle determinable stitching interferometry established a high-accuracy framework for hard X-ray elliptical mirrors by utilizing mirror tilt angles to determine stitching parameters14. This methodology has been successfully implemented to characterize deeply curved aspherical profiles in KB nanofocusing systems15. Dedicated stitching platforms can now achieve 0.1 nm Root-Mean-Square (RMS) repeatability for flat mirrors and approximately 1 nm RMS for curved ones16. More recently, mixed stitching interferometry assisted by one-dimensional profile measurements has been proposed to reduce accumulated stitching errors and improve the reliability of high-precision X-ray mirror metrology17.
On the other hand, slope metrology has also been attempted with extended bandwidth and explicit uncertainty control. Multi-pitch and self-calibration strategies18, 19 improve the conventional nano-accuracy surface profiler (NSP)20, enabling slope profiling of strongly aspheric mirrors whose total slope range exceeds the sensor dynamic range, while quantifying key systematic contributors such as pitch-axis and rotation-center uncertainty. In addition to extending dynamic range, these frameworks explicitly propagate dominant geometric/systematic error terms into an uncertainty budget, enabling metrology-informed updates during iterative figuring. Complementary approaches further extend the measurable error spectrum and strengthen cross-validation: laser speckle angular measurement achieves tens-of-nanoradian sensitivity for high-bandwidth slope errors and can be integrated with conventional profilers21, while focusing-deflectometry-based profilers improve spatial resolution by reducing the probing spot size, thereby extending the upper spatial-frequency bandwidth while maintaining sub-50 nrad angular accuracy22.
These developments reflect a central requirement for deterministic figuring that the reliability of dwell time is limited by the uncertainty attached to the metrology used to acquire surface maps. Accordingly, rigorous uncertainty quantification requires repeatability and self-consistency across repeated scans and mirror orientations, calibration of the angle/height response, and mitigation of dominant systematic terms. By enabling quantitative uncertainty budgets for highly aspheric off-axis ellipses, these metrology frameworks provide the reliable inputs needed for closed-loop IBF convergence23.
A second, equally limiting step is establishing consistency between ex situ metrology and in situ system performance. Mirrors may be accepted on a metrology platform yet deployed in a different mechanical and optical context, where mounting stress, coordinate transfer, partial coherence at the secondary source aperture (SSA), and environmental perturbations can alter the delivered wavefront. This motivates an end-to-end framework in which (i) measured surface maps inform forward wave-optics models under realistic coherence assumptions, and (ii) the measured focused field is back-propagated to the mirror planes for direct comparison with metrology. The Synchrotron Radiation Workshop (SRW) is widely used for partially coherent wavefront propagation in synchrotron beamlines24−27; together with uncertainty-quantified ex situ metrology, it enables closed-loop comparison between predicted and measured in situ fields.
Fig. 1 summarizes the end-to-end, fully in-house pipeline developed in this work at the National Synchrotron Light Source II (NSLS-II), which constitutes a central contribution of the present study. The pipeline closes the loop from deterministic fabrication to uncertainty-quantified ex situ metrology, forward wave-optics prediction, and in situ wavefront validation, including quantitative back-propagation to the mirror planes. The workflow begins with KB prescription and deterministic IBF followed by rhodium (Rh) coating (Fig. 1a). Ex situ metrology then yields sub-nanometer residual height maps for both mirrors (Fig. 1b), which are used to predict the delivered nanofocus under realistic coherence conditions using SRW (Fig. 1c). In situ ptychography reconstructs the complex probe at focus (Fig. 1d), while X-ray fluorescence (XRF) imaging provides an application-level resolution benchmark (Fig. 1e). Finally, the reconstructed wavefront is back-propagated to the mirror planes and compared with the ex situ residuals to assess end-to-end consistency (Fig. 1f).
The central contribution is therefore not any single component in isolation, but the quantitative closure of the full process chain. Specifically, the same mirror surface state measured ex situ is used for partial-coherence forward prediction, validated by in situ ptychography and XRF imaging, and then independently reconciled by back-propagating the measured complex probe to the KB pupil planes.
Using this pipeline, we demonstrate quantitative agreement between ex situ loop convergence and in situ nanofocusing for a pair of prototype-scale elliptical KB mirrors. Ex situ metrology indicates residual height errors of ~0.4 nm RMS on both mirrors (Fig. 1b). At the canonical operating point (12 keV, SSA = 8 × 7 µm2), partially coherent SRW simulations predict a focal spot of 77 × 36 nm2 (V × H, FWHM), and in situ ptychography reconstructs a 70.5 × 33.1 nm2 (V × H, FWHM) focus in close agreement (Fig. 1c, d). As an application-level resolution benchmark, XRF imaging of a Siemens star test pattern resolved features down to approximately ~30 nm features (Fig. 1e). Finally, the ptychography-reconstructed probe is back-propagated to the mirror planes for direct comparison with the ex situ residual maps (Fig. 1f), providing quantitative validation of the end-to-end loop described above and confirming atomic-scale performance.
Beyond achieving a small focal spot, this approach provides a traceable linkage between the manufacturing state (surface maps), predictive modeling (partial-coherence propagation), and the delivered system field (ptychography/XRF), thereby enabling attribution of residual performance limits to specific steps in the process chain.
The remainder of the paper is organized as follows. Section 2 describes the prototype KB system, geometric constraints, and the canonical operating point used for benchmarking. Section 3 details the forward-modeling pipeline, encompassing deterministic IBF fabrication, ex situ metrology, and SRW-based partially coherent wavefront propagation simulations. Section 4 presents the in situ experimental validation, including ptychography and XRF protocols, the horizontal SSA coherence sweep, and wavefront back-propagation to the mirror planes for end-to-end reconciliation. Section 5 discusses the limiting error terms and implications for scaling from prototype optics to production-class KB systems within an atomic-scale manufacturing (ASM) framework. Section 6 concludes the paper.
-
Establishing a robust link between fabrication tolerances and beamline performance is essential for validating the ASM pipeline. The in situ validation was conducted at the Hard X-ray Nanoprobe (HXN) beamline of NSLS-II, which provides a high-stability platform for multimodal X-ray imaging28−30. This setup enables the simultaneous collection of coherent diffraction and fluorescence signals, facilitating the comprehensive wavefront characterization required to close the manufacturing loop.
The experimental configuration is illustrated in Fig. 2. Fig. 2a summarizes the optical layout, including the secondary source aperture, the orthogonal KB mirrors, the fluorescence detector, the Siemens star test sample, and the downstream detector, while Fig. 2b shows the mirror assembly installed at the beamline. A dedicated KB microscope has been designed and constructed to accommodate the developed KB optics. The system design relied heavily on the approaches utilized in previously developed X-ray microscopes using KB mirrors31,32. The SSA acts as the effective secondary source, modulating the transverse coherence of the radiation incident on the KB pupils. The prototype VKB and HKB were figured to an elliptical-cylindrical profile and coated with Rh for high-efficiency, broadband operation.
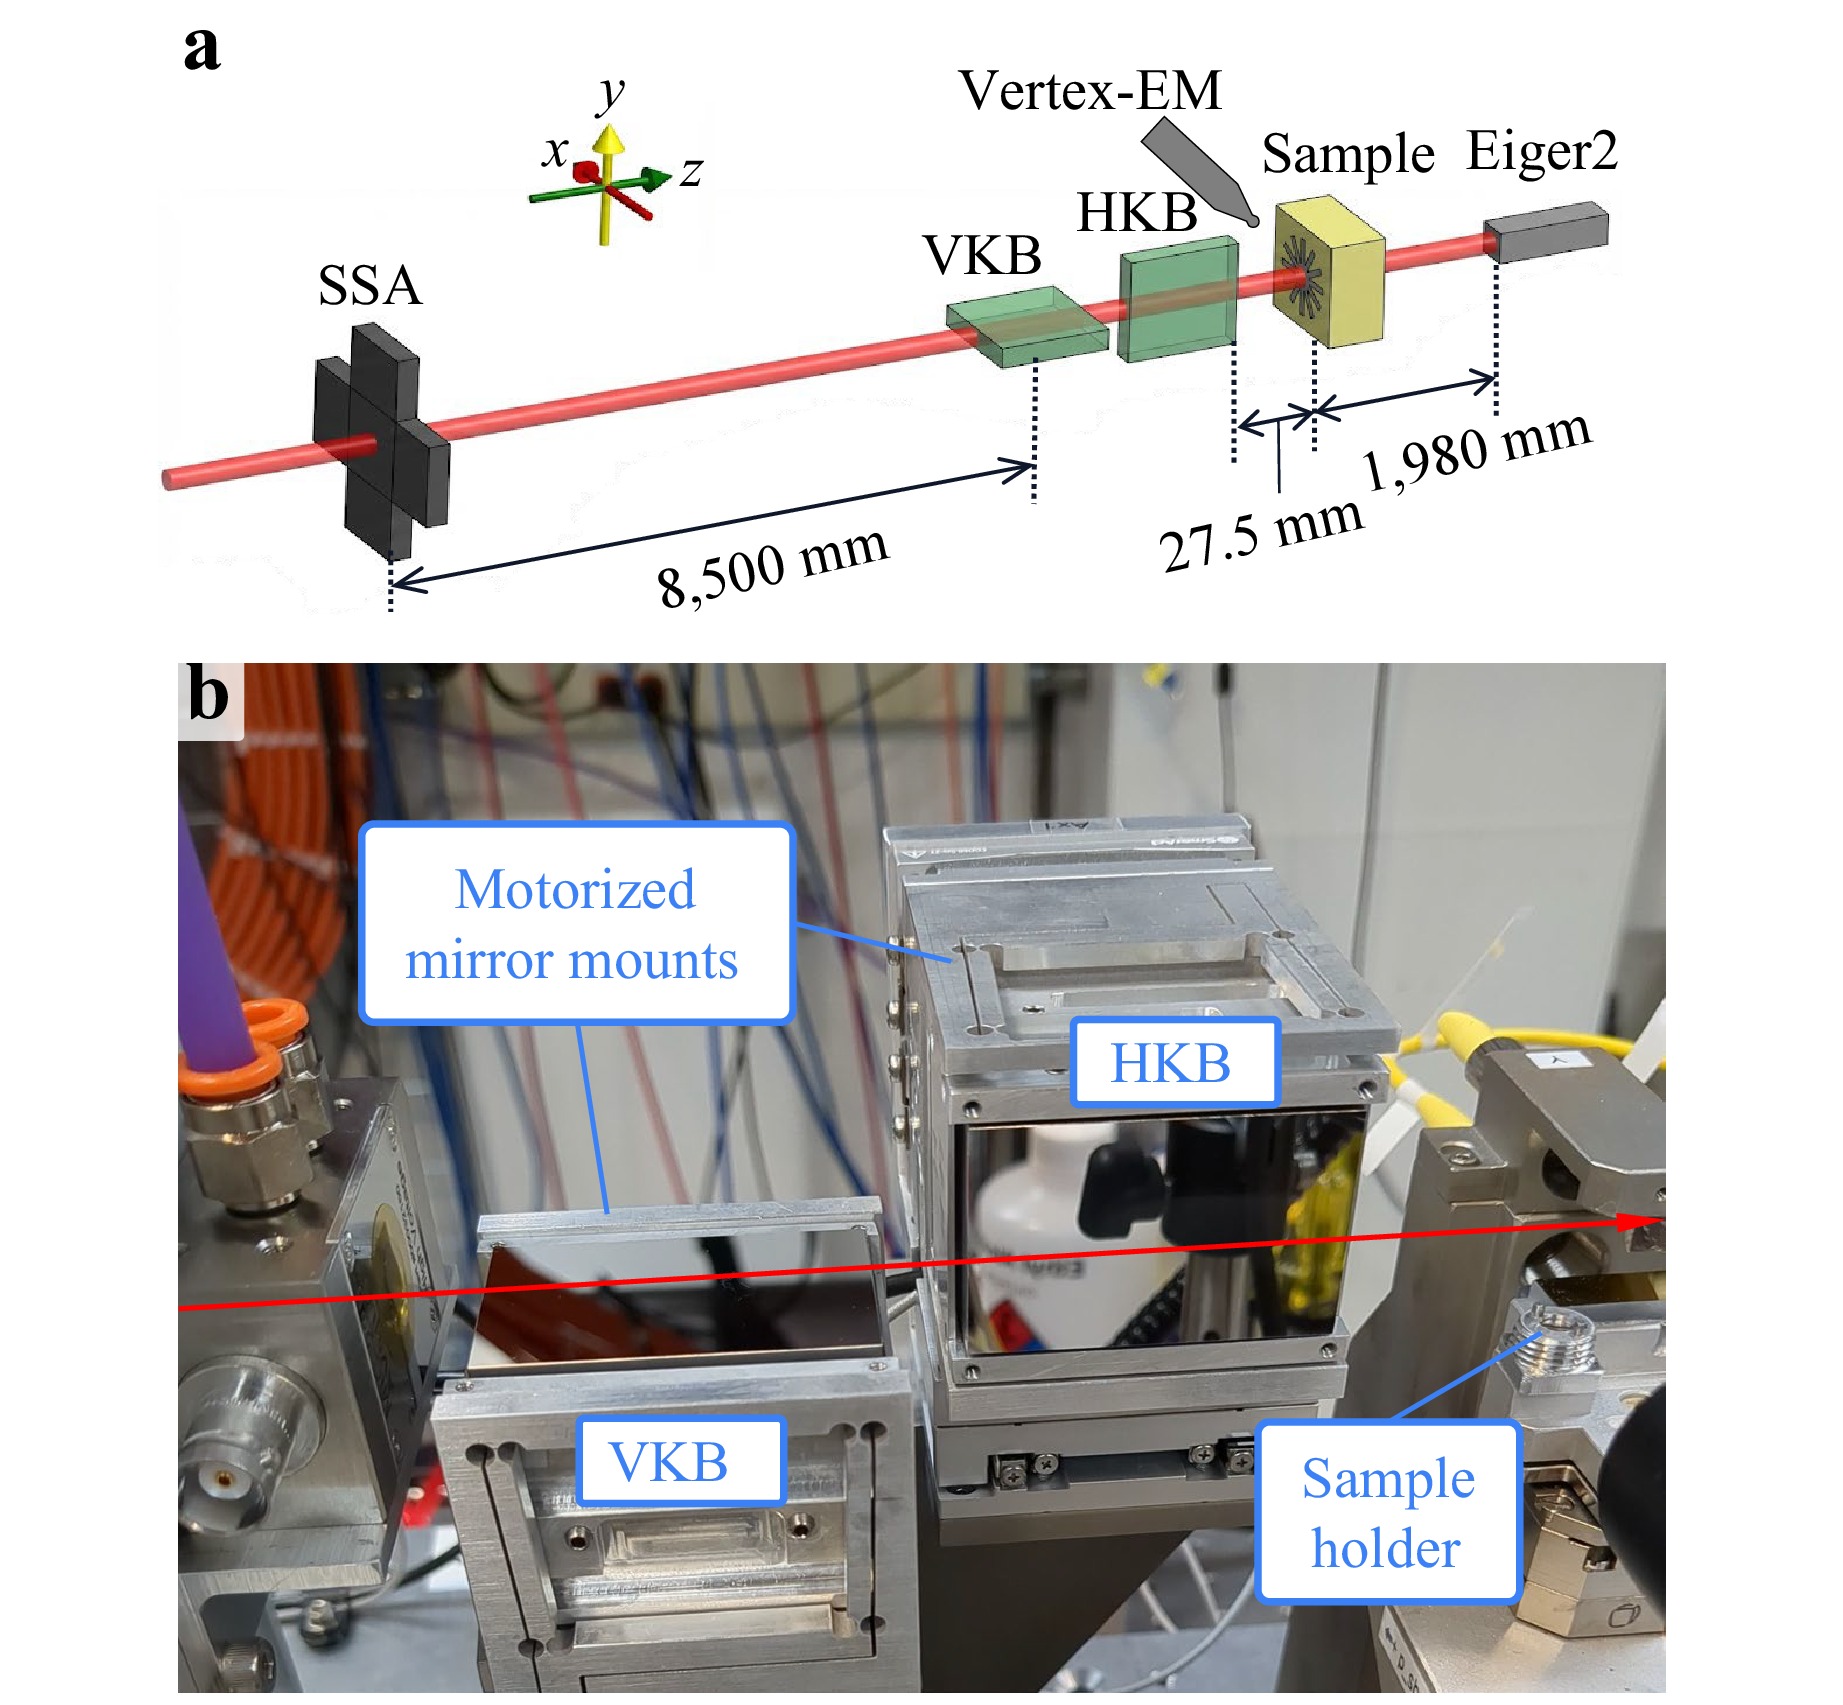
Fig. 2 Experimental setup at the Hard X-ray Nanoprobe (HXN) beamline: a Schematic of the beamline geometry, indicating the secondary source aperture (SSA), the orthogonal Kirkpatrick–Baez (KB) mirrors, the Vertex-EM fluorescence detector, the Siemens star test sample, and the downstream Eiger2 detector. b Photograph of the KB mirror mount at HXN.
To ensure these mirrors could be deterministically fabricated to atomic precision, the optical design parameters were determined via a fabrication-aware optimization33. This methodology minimizes the total slope range required to achieve the target focus, subject to the strict boundary conditions, including mirror gaps, working distance, and demagnification, detailed in Table 1, which also lists the resulting optimized parameters for the VKB and HKB mirrors (notation in Fig. 3).
Parameter Units VKB value HKB value Specified Photon energy keV 12 Working distance mm 27.5 Mirror gap mm 10 Clear aperture length mm 40 Spatial acceptance $ \mu $m 160 SSA opening $ \mu $m 8 7 Demagnification factor 80 170 Diffraction-limited focal size (FWHMa) nm 60.1 28.6 Distance from SSA ($ p^V $, $ p^H $) mm 8,500 8,555 Image distance ($ q^V $, $ q^H $) mm 105 50 Grazing-incidence angle ($ \theta^V $, $ \theta^H $) mrad 4 4 Chief-ray location ($ x^{V}_{i} $, $ x^{H}_{i} $) mm 0 0 Optimized Grazing-incidence angle ($ \theta^V $, $ \theta^H $) mrad 3.971 3.989 Chief-ray location ($ x^{V}_{i} $, $ x^{H}_{i} $) mm 1.289 1.390 a Calculated as $ \text{FWHM} = 0.886\,\lambda/(2\cdot\text{NA}) $, where $ \lambda $ is the wavelength of the X-ray beam34. Table 1. Design constraints for the prototype KB mirrors at the canonical HXN configuration used in this work.
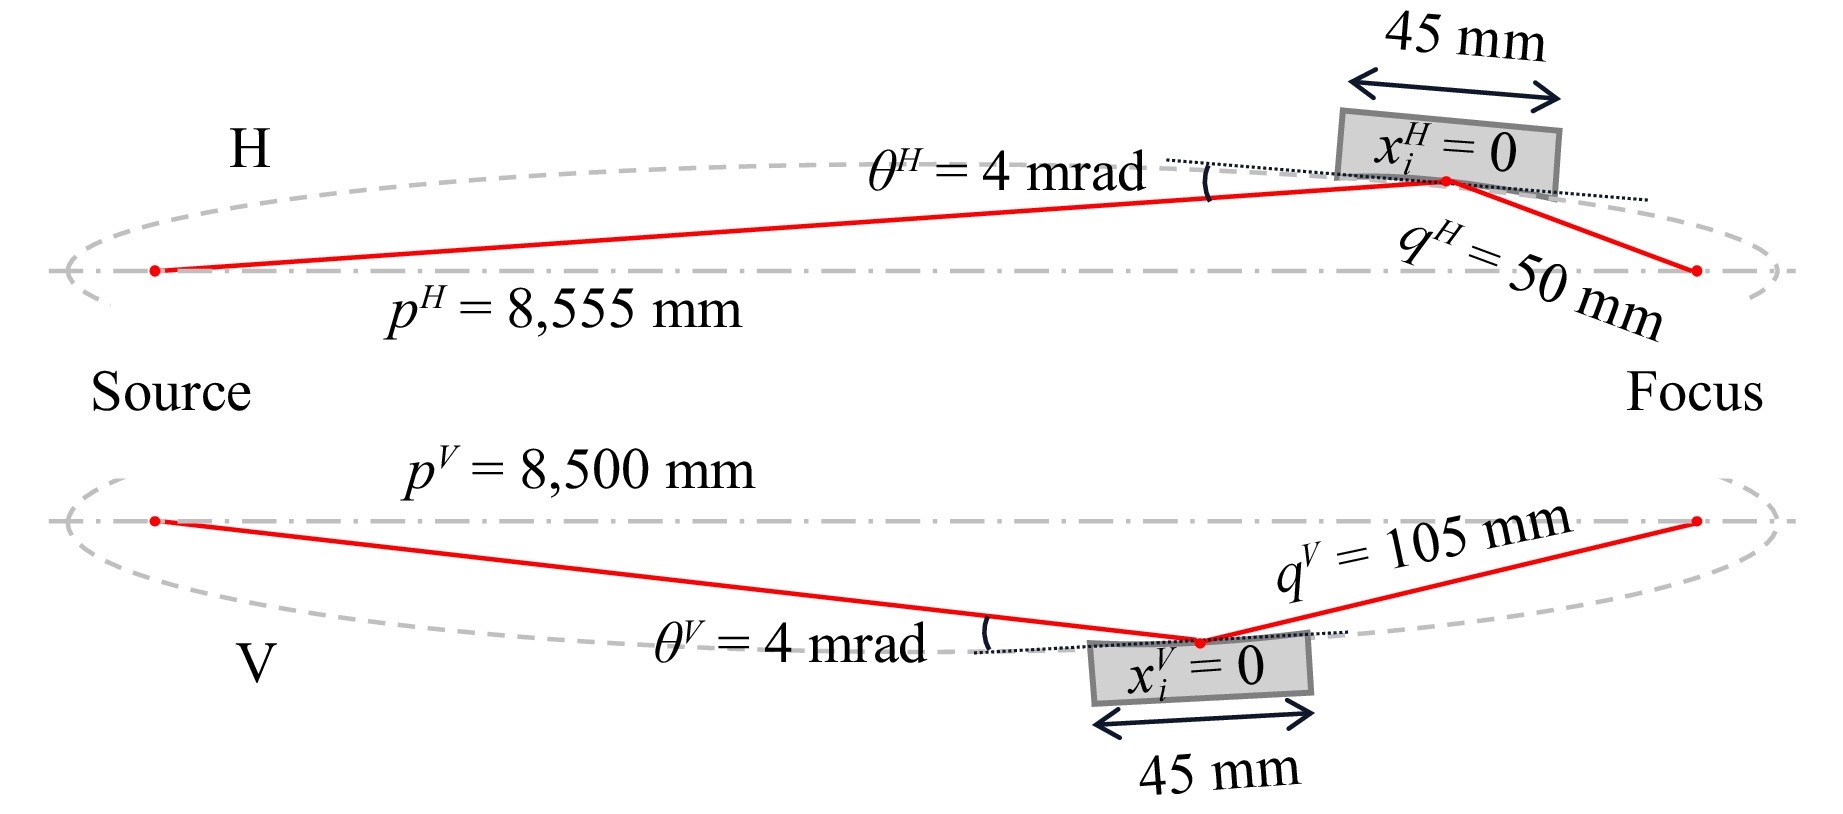
Fig. 3 KB mirror geometry and notation. Schematic defining the key geometric parameters for the KB mirrors, including the object distance ($ p $), image distance ($ q $), grazing-incidence angle ($ \theta $), and chief-ray location in the mirror coordinate system ($ x_{i} $), used throughout the fabrication and simulation.
The parameters $ p $, $ q $, $ \theta $, and $ x_i $ represent the object distance, image distance, grazing-incidence angle, and chief-ray location in the mirror coordinate system, respectively35. These parameters, together with the endstation clearance at HXN, provided the geometric basis for the beamline model. The partial-coherence model, meanwhile, is based on the source emittance and the specific optics/SSA configuration. Together, these elements enable the subsequent wavefront analysis, connecting the ex situ mirror residuals to the final in situ performance.
This integrated experimental configuration allows for the high-resolution multimodal characterization and coherence-controlled validation required to close the manufacturing loop. The detailed measurement protocols and the resulting in situ performance metrics are presented in Secs. 3 and 4, respectively.
-
Building on the geometry and operating conditions defined in Sec. 2, this section details the forward-modeling stages of the manufacturing and validation pipeline shown in Fig. 1. We begin by establishing the ex situ residual surface state of the coated VKB/HKB pair achieved through deterministic IBF (Sec. 3.1). This topography provides the baseline for the partially coherent SRW simulations (Sec. 3.2). These predictions are later compared against the in situ experimental results and backward-modeling validations detailed in Sec. 4 to verify end-to-end consistency.
-
The prototype VKB/HKB pair was fabricated utilizing an in-house developed IBF system36 and subsequently coated with Rh (Fig. 1a). The IBF process employed a Kaufman & Robinson KDC10 ion source operated at 600 V and 10 mA. To deterministically correct errors across spatial-frequency bands, three beam configurations were applied in sequence: a full beam (7.5 mm FWHM), followed by 5 mm and 1 mm pinhole apertures (yielding 5 mm and 1 mm FWHM, respectively). Target removal profiles were computed via Robust Iterative Surface Extension (RISE) with the Closed-form Universal Dwell-time Optimization (CUDO)10, 37, while the corresponding motion plans were generated using the Enhanced Position-Velocity-Time (E-PVT) algorithm12. Throughout the figuring process, a Fizeau SI (FSI) platform16 provided in-process metrology feedback.
After coating, the mirrors were characterized ex situ using four independent metrology instruments. Residual height was evaluated by FSI and a micro-SI (MSI) platform, while residual slope was measured by NSP19 in both vertical- and horizontal-scan configurations (VNSP/HNSP). Throughout this paper, the ex situ residual height and slope are defined as the measured surface height and slope after subtraction of a best-fit ellipse consistent with the design prescription in Fig. 3, together with piston/tip/tilt over the clear aperture. In addition, because the X-ray footprint is defined by the chief-ray incidence and the mounted mirror pose, the metrology maps were spatially registered to the illuminated footprint by allowing a constrained refinement of the effective grazing angles ($ \theta^{V} $ and $ \theta^{H} $) and tangential footprint centers ($ x_{i}^{V} $ and $ x_{i}^{H} $), chosen to minimize the footprint RMS error35. The optimized grazing angles and chief-ray locations from the VNSP measurements are shown in Table 1 as an example. The refined parameters $ \theta $ and $ x_i $ should be interpreted as registration parameters that map the metrology coordinate system onto the illuminated X-ray footprint of the mounted optics, rather than as limits of the metrology instruments. They can be compensated during endstation alignment.
To enable a fair comparison between SI-derived height and NSP-derived slope, slope errors are evaluated over spatial periods ranging from 2 mm to the full tangential clear-aperture length. In the NSP configuration, a pinhole placed in front of the autocollimator sets an effective head-spot size of approximately 2 mm. Accordingly, SI-derived slopes are computed using 2 mm sliding-window gradients along the tangential axis. Similarly, NSP-derived slopes are integrated to obtain the corresponding heights38. Agreement between SI- and NSP-derived heights and slopes provides a consistency check of the metrology state.
Fig. 4 summarizes the final ex situ surface state after deterministic fabrication–metrology loop convergence. For the VKB (Fig. 4a-c), the FSI residual height map yields 0.36 nm RMS. Height profiles extracted along the central meridian ($ y=0 $) agree closely across instruments (VNSP: 0.24 nm RMS; HNSP: 0.36 nm RMS; FSI: 0.28 nm RMS; MSI: 0.28 nm RMS). The corresponding slope profiles at $ y=0 $ also show consistent spatial structure, with RMS values in the 0.25–0.30 µrad range (VNSP: 0.27 µrad; HNSP: 0.30 µrad; FSI: 0.25 µrad; MSI: 0.29 µrad).
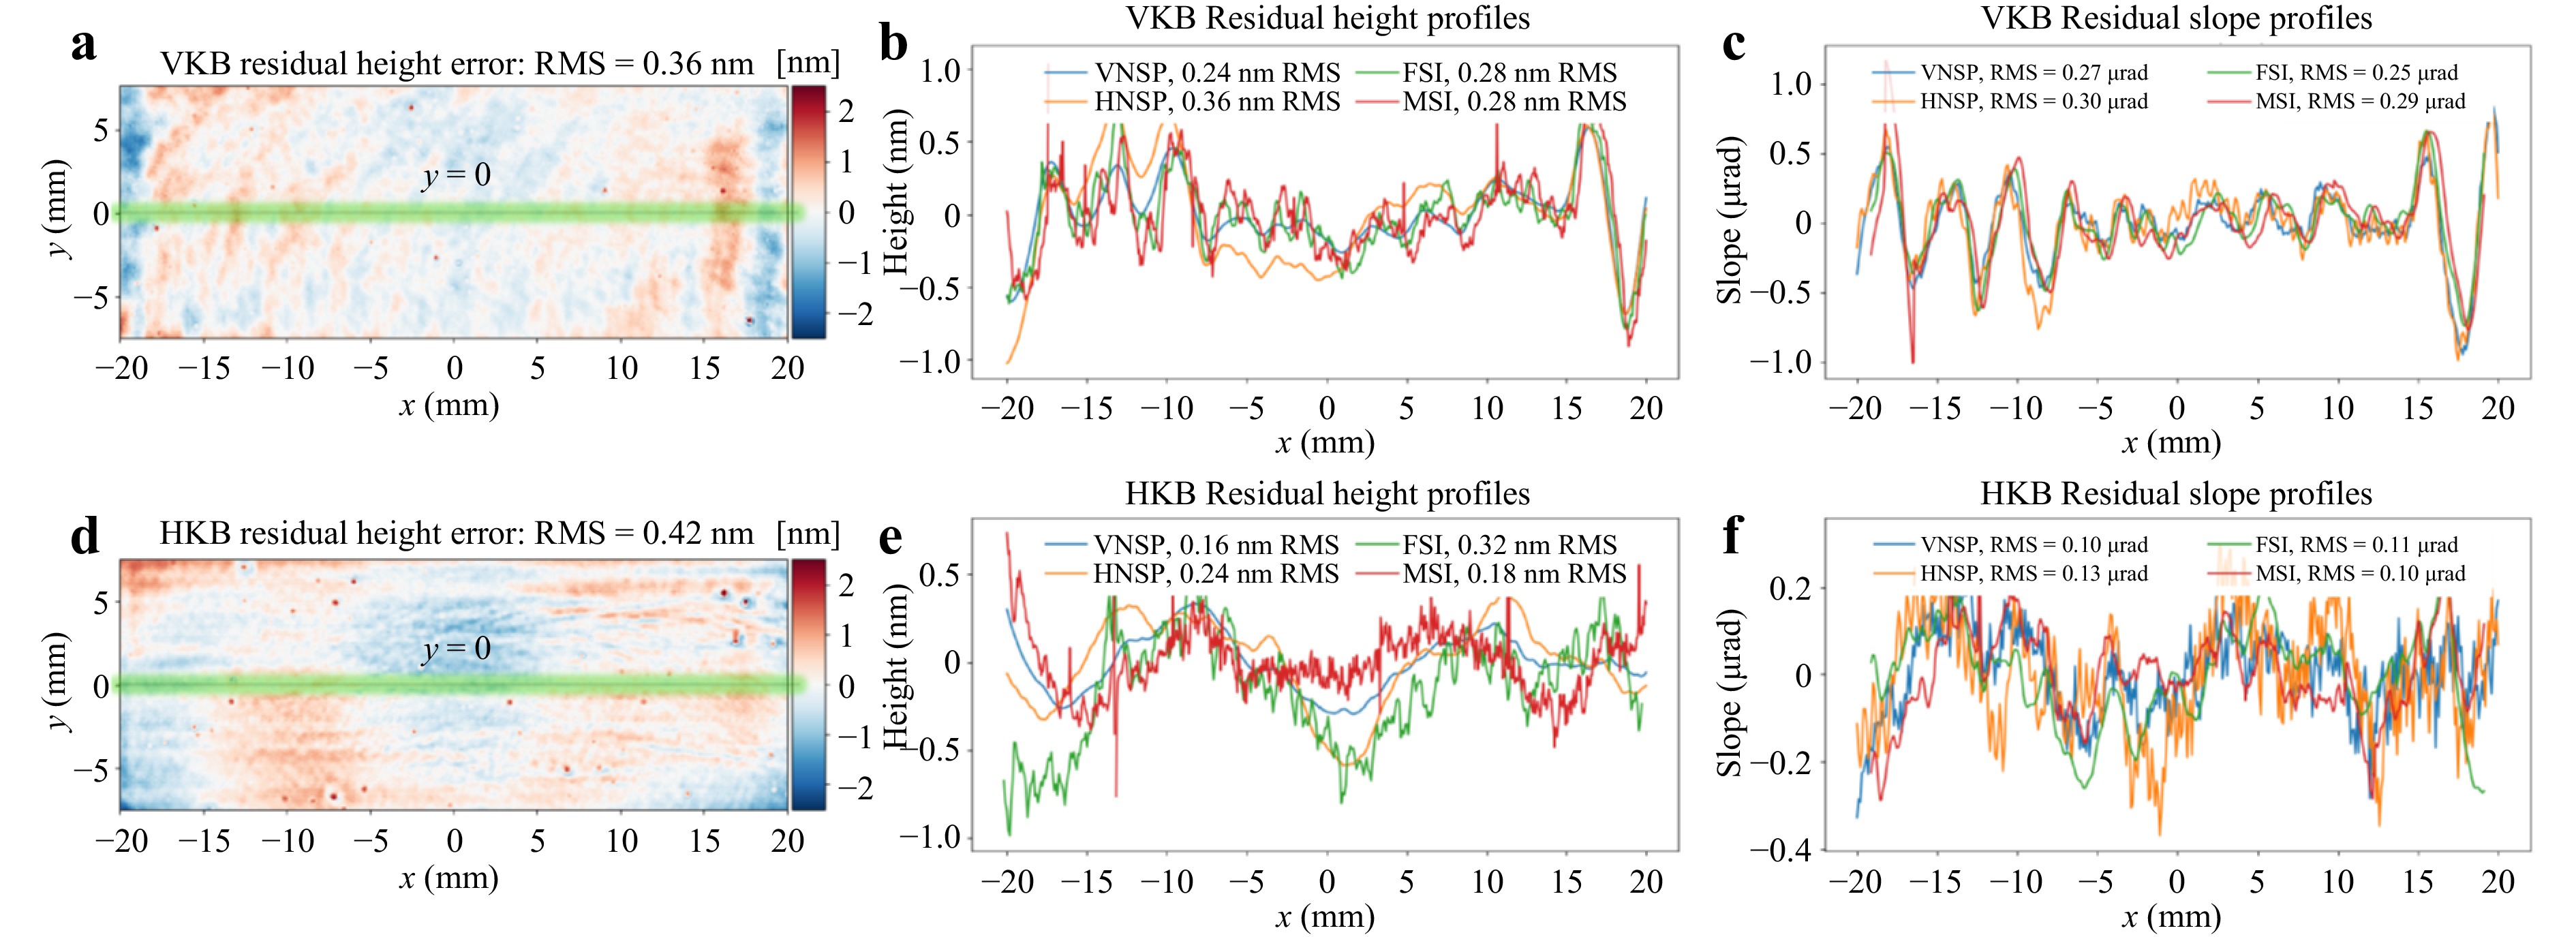
Fig. 4 Ex situ metrology summary of the KB mirrors after best-fit ellipse removal. a-c VKB: a Fizeau stitching-interferometry (FSI) residual height map (0.36 nm RMS); b residual height line profiles along y = 0 from vertical-scan nano-accuracy surface profiler (VNSP, 0.24 nm RMS), horizontal-scan nano-accuracy surface profiler (HNSP, 0.36 nm RMS), FSI (0.28 nm RMS), and micro-stitching interferometry (MSI, 0.28 nm RMS); c residual slope line profiles along y = 0 from VNSP (0.27 µrad RMS), HNSP (0.30 µrad RMS), FSI (0.25 µrad RMS), and MSI (0.29 µrad RMS). d-f HKB: d FSI residual height map (0.42 nm RMS); e residual height line profile along y = 0 from VNSP (0.16 nm RMS), HNSP (0.24 nm RMS), FSI (0.32 nm RMS), and MSI (0.18 nm RMS); f residual slope line profiles along y = 0 from VNSP (0.10 µrad RMS), HNSP (0.13 µrad RMS), FSI (0.11 µrad RMS), and MSI (0.10 µrad RMS).
For the HKB (Fig. 4d-f), the FSI residual height map indicates 0.42 nm RMS, and the central height profiles remain in the sub-nanometer regime across all instruments (VNSP: 0.16 nm RMS; HNSP: 0.24 nm RMS; FSI: 0.32 nm RMS; MSI: 0.18 nm RMS). The HKB slope profiles show excellent agreement in RMS values around 0.10 µrad (VNSP: 0.10 µrad; HNSP: 0.13 µrad; FSI: 0.11 µrad; MSI: 0.10 µrad). Collectively, these measurements define a cross-validated ex situ reference state for the prototype KB pair, which is used as the input for the forward SRW simulations and as the benchmark for the ex situ–in situ consistency analysis in the following subsections.
It is worth mentioning that, although the NSP-measured slopes of the VKB are larger than those of the HKB, this can still be compatible with diffraction-limited performance under the operating conditions used in this study. Under near-fully coherent, pupil-limited illumination, the delivered nanofocus is governed most directly by the residual height (equivalently, the optical path difference, OPD) within the illuminated footprint. As indicated in Fig. 4c, the dominant VKB slope errors have a period of ~2.5 mm and could be further reduced using the 1 mm ion-beam configuration. We did not pursue this additional iteration because the objective of this study is end-to-end validation of the fabrication-metrology-beamline loop rather than optimization of a single metric in isolation.
-
To connect the ex situ surface state in Fig. 4 to a prediction of the delivered nanofocus, we modeled nanofocus formation in SRW using the same beamline geometry and an SSA-defined effective source (Sec. 2). The SSA defines the transverse coherence of the radiation incident on the VKB and HKB pupils; modulating the aperture width therefore perturbs coherent-mode content and effective pupil filling at fixed mirror acceptance. Partial coherence is realistically captured via multi-electron simulation by accumulating the intensity distribution from tens of thousands of statistically sampled macro-electrons.
The resulting SRW-predicted intensity for the canonical condition (12 keV, SSA 8 × 7 µm2) is shown in Fig. 5a. Under this operating point, the model predicts a focal FWHM of 77 × 36 nm2 (V × H). Notably, these values represent a ~25%–30% broadening compared to the diffraction-limited floors of 60.1 × 28.6 nm2 (V × H) (Table 1). This comparison confirms that the canonical focus is not set by geometric demagnification alone; rather, it is shaped by the competition between the accepted NA and the transverse coherence imposed by the SSA.
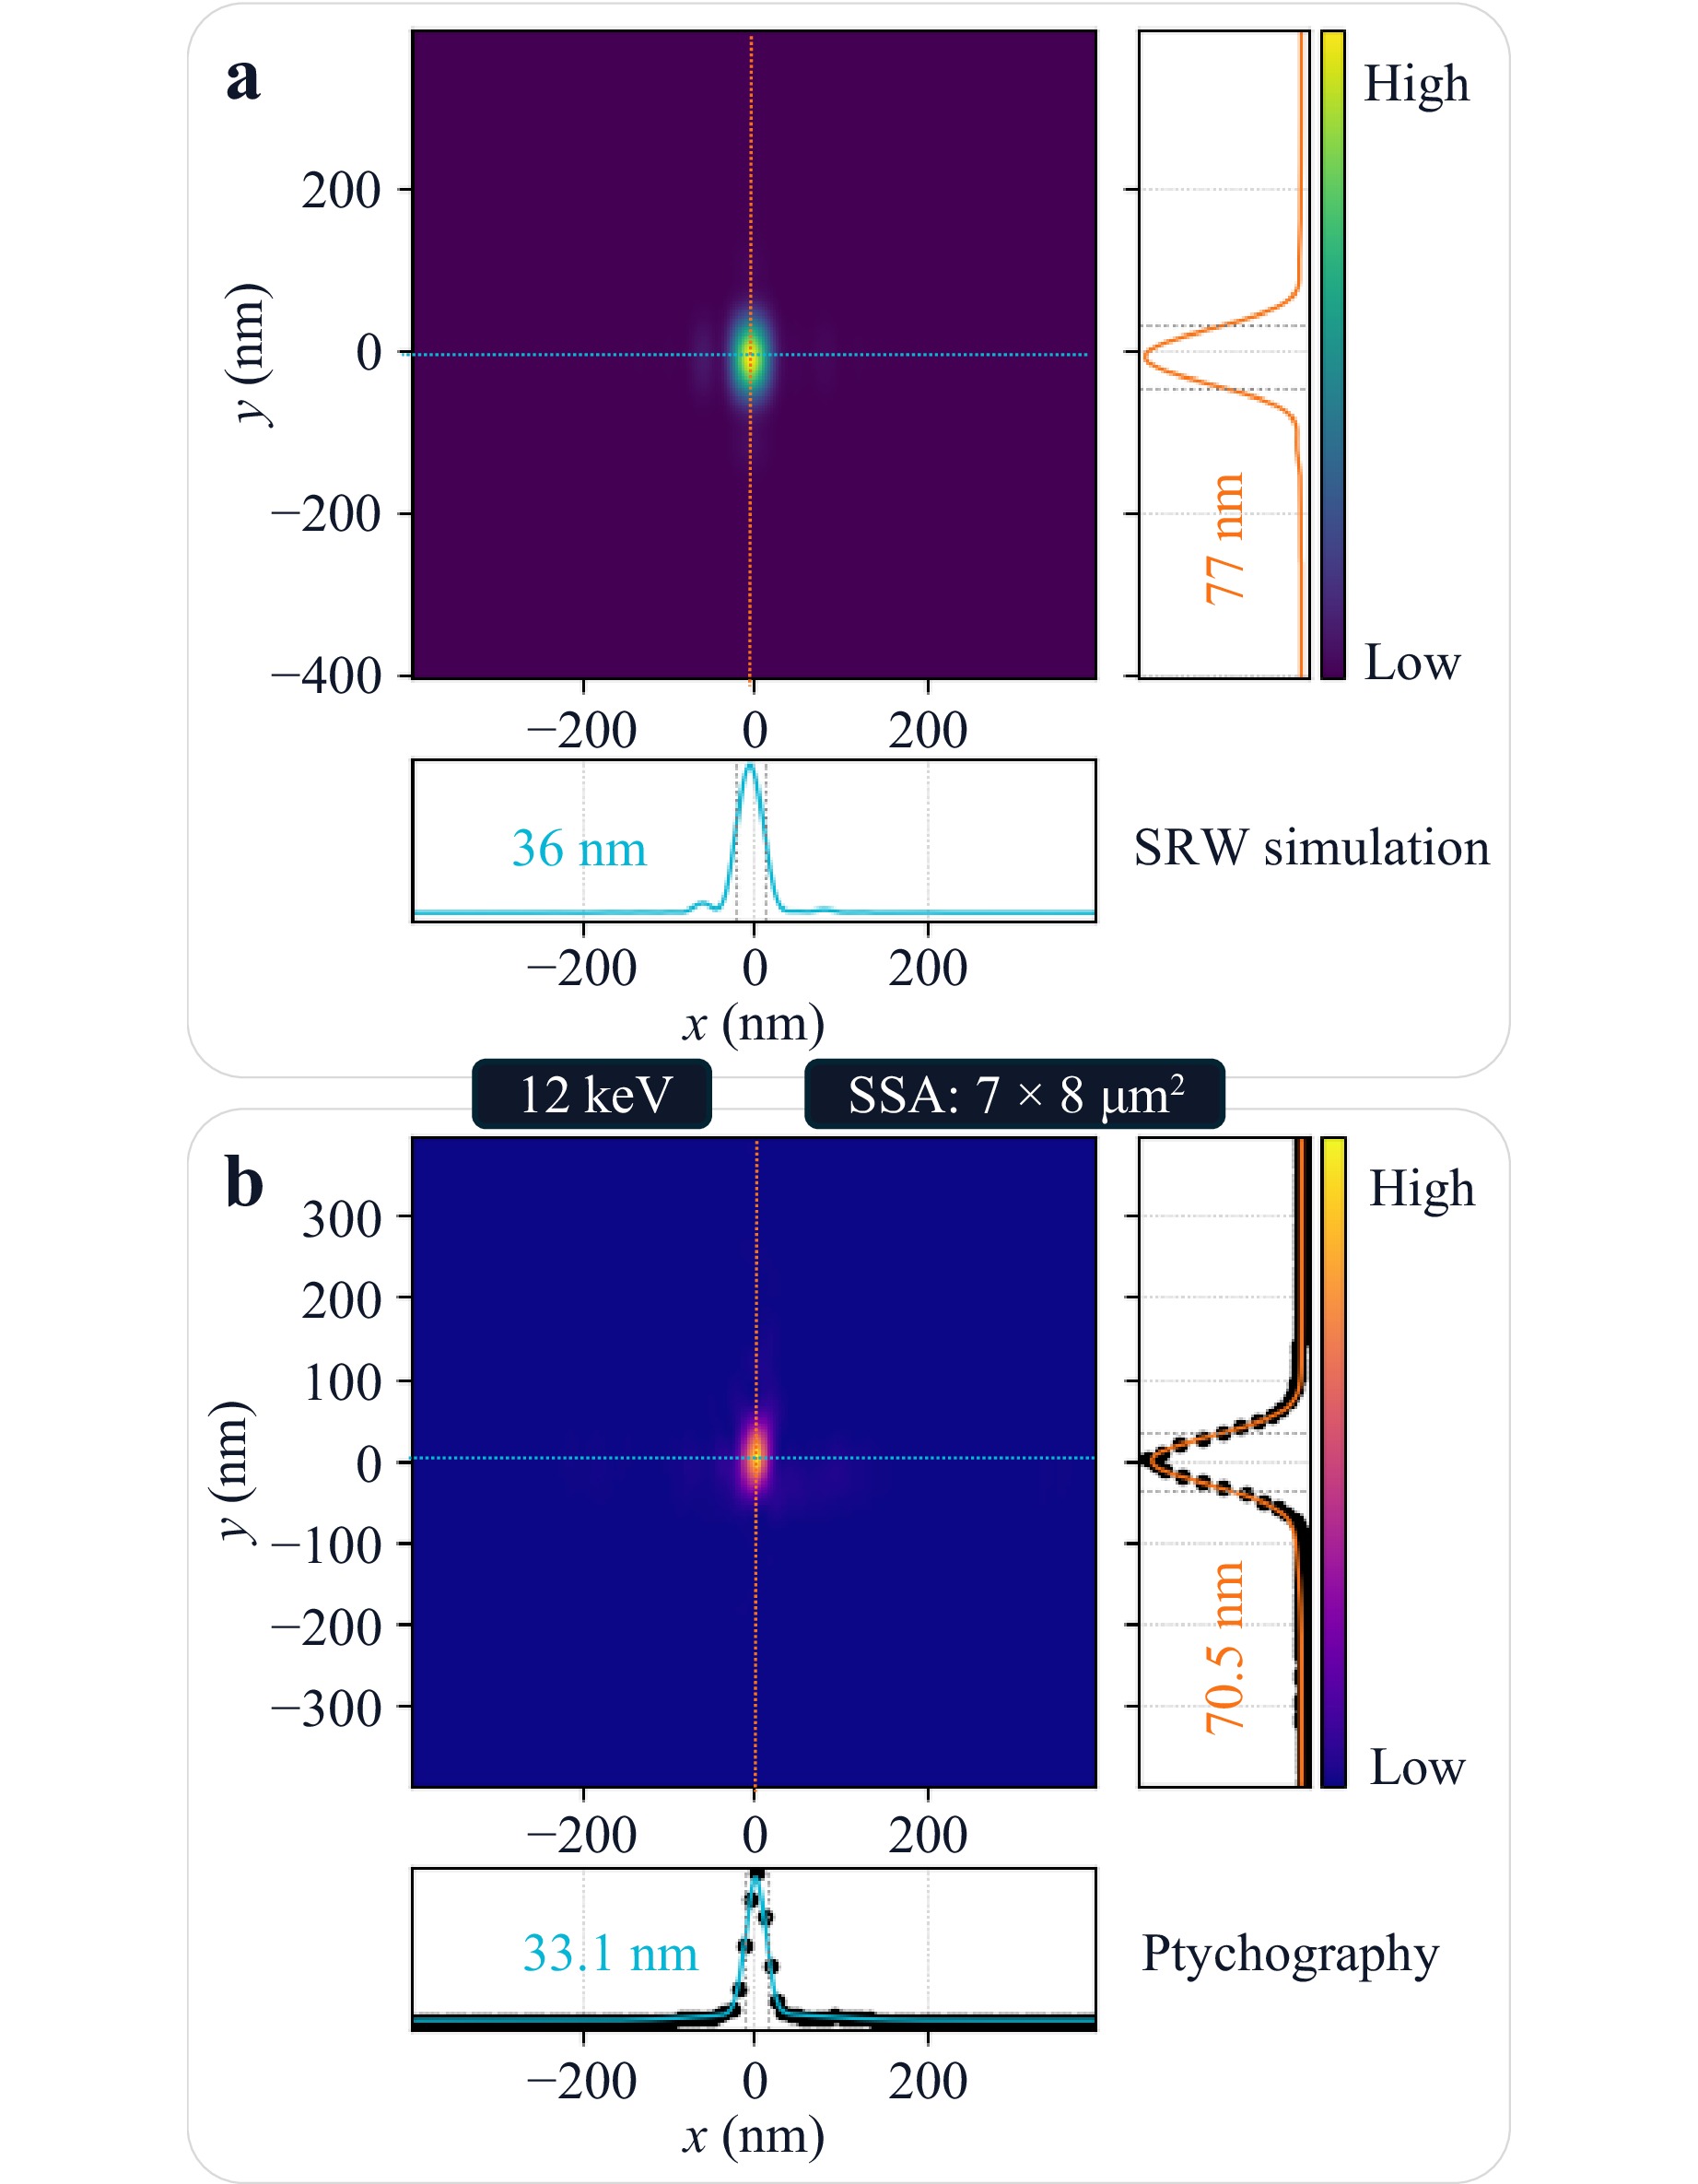
Fig. 5 Comparison between SRW simulation and in situ ptychography at the canonical HXN configuration (12 keV, SSA = 8 × 7 µm2). a SRW-simulated focal spot intensity (FWHM: 77 × 36 nm2, V × H) under partial coherence; b ptychography-reconstructed focal spot intensity (FWHM: 70.5 × 33.1 nm2, V × H).
While coherence sets the ultimate performance limit in this regime, the atomic-scale mirror quality remains the enabling condition, as it determines how closely the system can approach this coherence-limited bound without redistributing energy into structured halos. To verify that the measured surface residuals are negligible relative to this limit, we apply the Maréchal criterion. For a grazing-incidence reflector, a surface-height error $ \sigma_h $ maps to an RMS optical-path difference $ \sigma_{\rm{OPD}}\approx 2\sigma_h\sin\theta $. Requiring $ \sigma_{\rm{OPD,tot}}\lesssim \lambda/14 $ (Strehl ratio $ \gtrsim 0.8 $) yields an approximate per-optic height budget:
$$ \sigma_h \lesssim \frac{\lambda}{28\,\sin\theta\,\sqrt{N}} \approx \frac{\lambda}{28\,\theta\,\sqrt{N}} $$ (1) where $ N $ is the number of independent reflective elements and the small-angle approximation $ \sin\theta\approx \theta $ is used for $ \theta\ll 1 $ rad. At 12 keV ($ \lambda \approx 0.103 $ nm) and $ \theta=4 $ mrad, Eq. 1 gives $ \sigma_h \lesssim 0.65 $ nm for $ N=2 $. As the ex situ RMS heights for both the VKB (0.36 nm) and HKB (0.42 nm) in Fig. 4 fall well below this value, we can conclude that the residual figure error is not the dominant broadening mechanism under these conditions.
-
Following the forward-modeling pipeline and the establishment of the ex situ surface state, this section details the in situ characterization of the delivered wavefront at HXN beamline. We employ a multimodal approach, which pairs ptychographic probe reconstruction and XRF imaging, to experimentally validate the nanofocus. Finally, the reconstructed complex probe is back-propagated to the mirror pupils. This allows for a direct, quantitative reconciliation between the operational wavefront error and the ex situ height residuals, thereby closing the manufacturing and validation loop.
-
We validate the delivered nanofocus at the canonical operating condition (see Table 1) using ptychographic probe reconstruction at the sample plane. Crucially, to maintain a rigorous and independent validation of the pipeline, the ptychographic reconstruction was initialized using an initial probe derived from beamtime measurements rather than the SRW predictions. Utilizing the reconstructed complex probe $ U(x,y) $, we form $ I(x,y)=|U(x,y)|^2 $ and extract 1D central line cross-sectional profiles $ I_h(x) $ and $ I_v(y) $ through the peak of the 2D intensity distribution. To avoid imposing a single-Gaussian model on the probe, each profile is fitted with a triple-Gaussian model; the FWHM is then obtained from the half-maximum crossings of the fitted curve.
Fig. 5b shows the reconstructed focal-plane intensity and the corresponding line cuts along the horizontal and vertical axes through the peak. The extracted focal size is 70.5 × 33.1 nm2 (V × H), which is consistent with the corresponding SRW prediction in Fig. 5a within ~10% in both axes. The slightly larger spot size predicted by SRW is consistent with the fact that the forward model reports the intensity formed by an incoherent sum of coherent modes, whereas ptychographic reconstruction yields an effective probe metric whose detailed width can depend on the inversion model and regularization even when the central lobe is reproduced accurately. In the following subsection, we use controlled HSSA variation to make this coherence sensitivity explicit.
-
To evaluate the system performance under varying degrees of partial coherence, we utilized the horizontal SSA (HSSA) opening as a controlled perturbation. By varying the HSSA from 5 to 60 µm while maintaining a fixed vertical SSA of 8 µm, we spanned the transition from high-flux, weakly coherent illumination to a low-flux, near-fully coherent regime. Fig. 6 summarizes the resulting horizontal focal-width metrics against two physical limits: the horizontal diffraction-limited focal size (28.6 nm) and the demagnified effective source size, which serves as a geometric asymptotic bound as coherence is reduced.
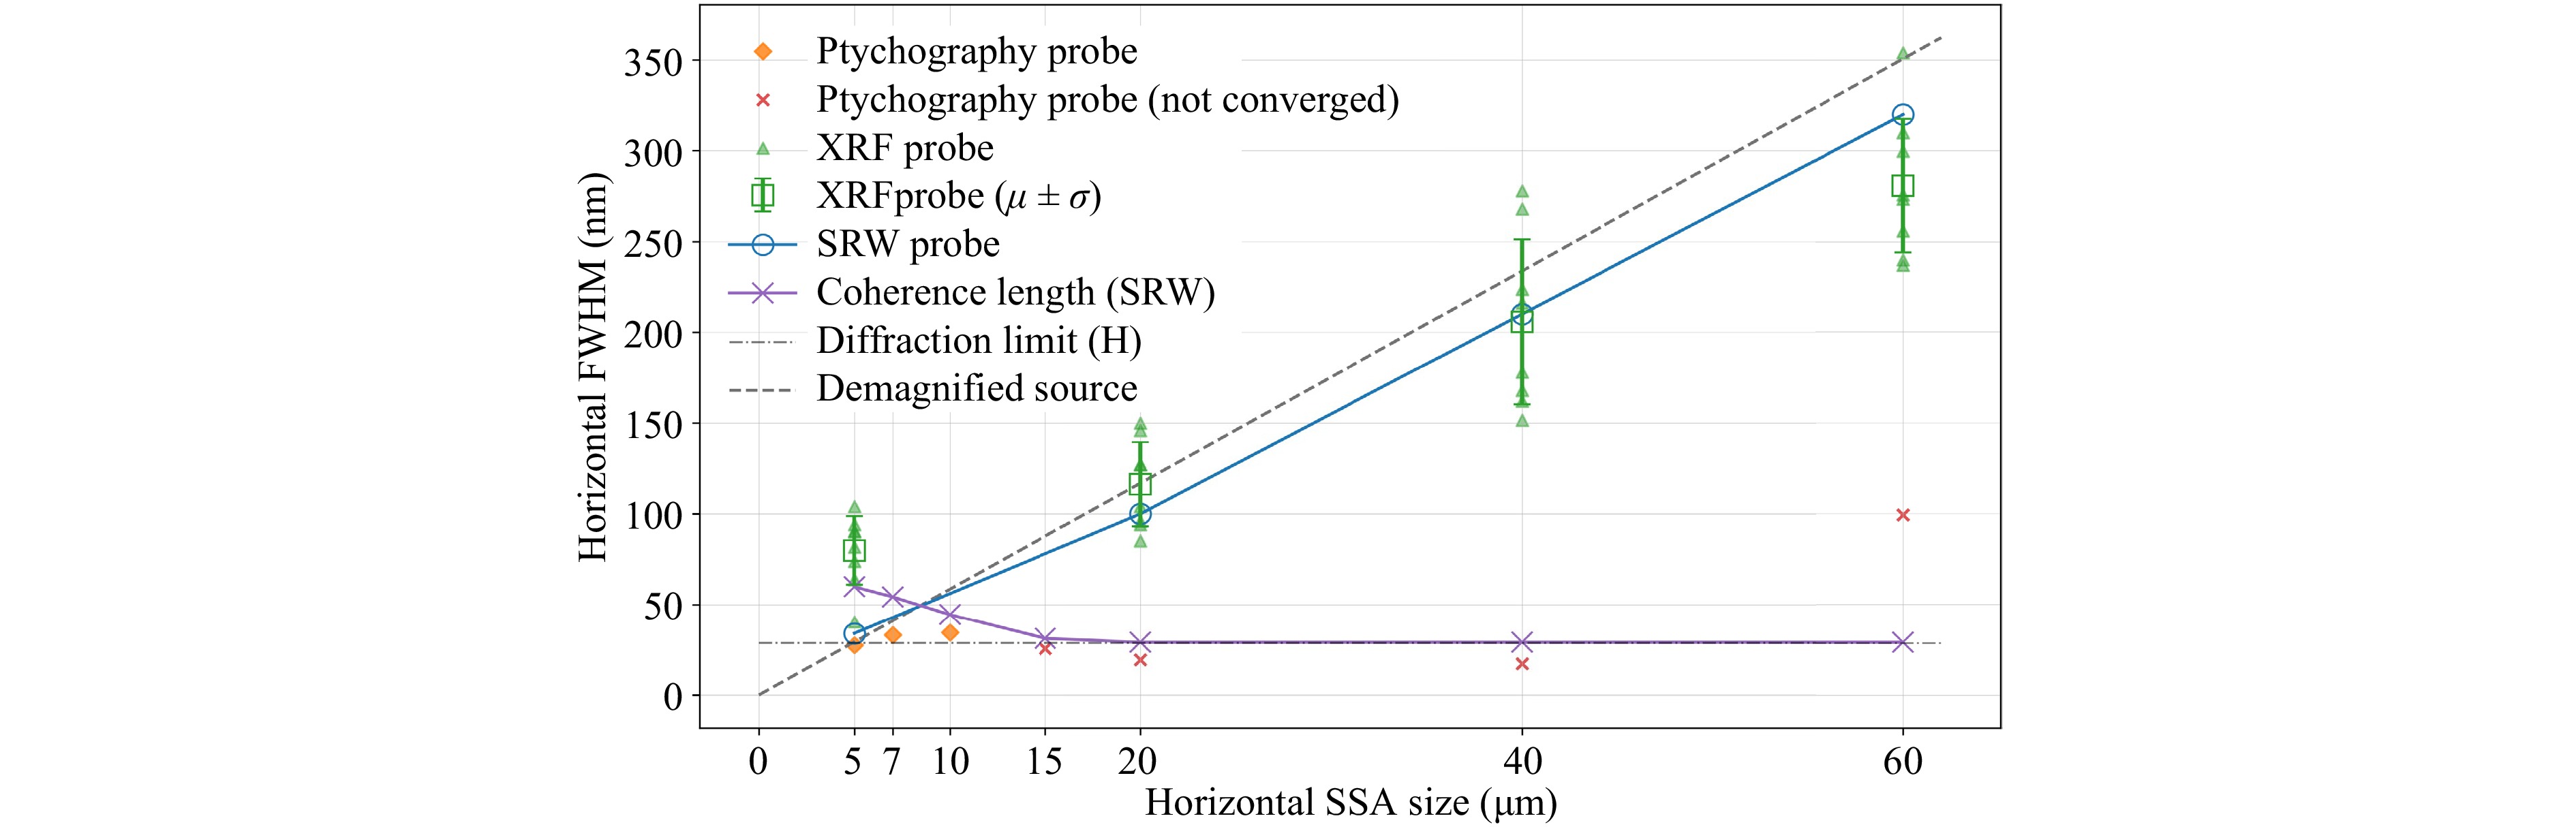
Fig. 6 Horizontal focal full width at half maximum (FWHM) at 12 keV as a function of horizontal secondary source aperture (HSSA), with the vertical SSA fixed at 8 µm. The horizontal gray line marks the horizontal diffraction limit set by the accepted numerical aperture (28.6 nm), and the dashed gray line indicates the demagnified effective source-size scaling. Blue open circles show FWHMs of the predicted partially coherent intensity at each HSSA setting, calculated using SRW. Orange diamonds show FWHM values extracted from ptychographic probe reconstructions at the nominal focus; red crosses indicate reconstructions acquired with HSSA sizes larger than 15 µm that did not converge and are shown for reference. Green triangles denote individual XRF knife-edge widths obtained from four scanned edges of an L-shaped feature at each HSSA size; open green squares show the corresponding mean, with error bars given by the edge-to-edge standard deviation. The purple curve shows the horizontal transverse coherence length versus HSSA estimated using SRW, showing an asymptotic decrease in coherence length as HSSA size increases.
SRW partial-coherence modeling predicts a monotonic increase of the horizontal FWHM with HSSA (blue curve in Fig. 6). To make the coherence perturbation explicit, we also plot an estimated horizontal coherence length calculated at the focus position of the KB mirrors (purple line), which provides a precise metric as it accounts for the subtle beam trimming effects of the KB aperture. The coherence length decreases rapidly as the HSSA is opened, from ~60 nm at HSSA = 5 µm to ~30 nm at HSSA = 20 µm, and then remains near this value over the larger-aperture settings. This evolution is consistent with a transition from a pupil-limited, high coherent fraction regime at small HSSA openings to a multi-mode regime in which additional HSSA opening primarily increases incoherent flux while leaving the coherent fraction saturated. In SRW, the corresponding increase in mode content and effective source extent drives the predicted broadening toward the demagnified-source trend.
To anchor the sweep with an intensity-based real-space estimator, we extract horizontal widths from 1D XRF knife-edge scans acquired on an L-shaped feature. For each HSSA setting, we analyze four independent edges and fit each edge-spread function (ESF) with a Gaussian error function (ERF), converting the fitted standard deviation $ \sigma $ to an effective width via $ \mathrm{FWHM}=2\sqrt{2\ln 2}\,\sigma $. The open green squares in Fig. 6 report the mean across edges, and the error bars denote the edge-to-edge standard deviation. Despite the differing transfer function of fluorescence detection (edge quality, scan sampling, and dwell-time effects), the knife-edge widths follow the SRW-predicted monotonic trend and remain on the same scale across the measured points, supporting a coherence-limited interpretation for the horizontal focus.
In contrast, ptychographic probe reconstructions (orange diamonds and red crosses in Fig. 6) reveal a fundamental limitation of the single-mode inversion model. While the reconstructions are consistent at small HSSA, the algorithms failed to reach numerical convergence for HSSA > 15 µm. This behavior is not interpreted as a new optical limitation specific to the present KB system; rather, it reflects the expected breakdown of the single-coherent-probe approximation under increasingly partial coherence. As the HSSA is opened, partially coherent modes contribute to the illumination. A single-mode ptychographic model can then absorb partial-coherence effects into the object-probe factorization, causing the reconstructed probe width to deviate from the physical intensity PSF. The non-converged points are therefore included only as qualitative indicators of this model-validity boundary. In this regime, SRW partial-coherence modeling and intensity-based metrics such as XRF knife-edge scans provide more reliable estimates of the delivered PSF.
-
We complement the wavefront-based probe metrics with a real-space imaging benchmark using XRF raster scans of a Siemens star test pattern. In contrast to ptychography, which relies on an inverse model to infer the probe, the Siemens star target enables a direct real-space verification of spatial resolution under the same beamline configuration by mapping the focused intensity distribution through a high-contrast, lithographically defined structure.
We emphasize that Siemens-star-based resolution estimates are inherently less quantitative than ptychographic probe reconstruction or knife-edge scans because the inferred width is convolved with the structural fidelity of the test pattern itself (e.g., linewidth bias, edge roughness, and local placement errors near the innermost spokes). We therefore use the Siemens star primarily as an independent, real-space resolution benchmark rather than as a standalone metrology of the probe.
Fig. 7a shows an overview XRF image of the Siemens star acquired with a nominal 20 nm scan step. To quantify the effective edge response, we select three representative horizontal edge locations (E1–E3) that span the vertical straight edges. A higher-resolution scan of the central region acquired with a prescribed 5 nm step (Fig. 7b) resolves the smallest spokes, corresponding to a specified feature size on the order of ~30 nm. This 2D image-level observation provides an intuitive resolution benchmark that is largely insensitive to the inversion assumptions that can affect reconstructed probe widths under partial coherence.
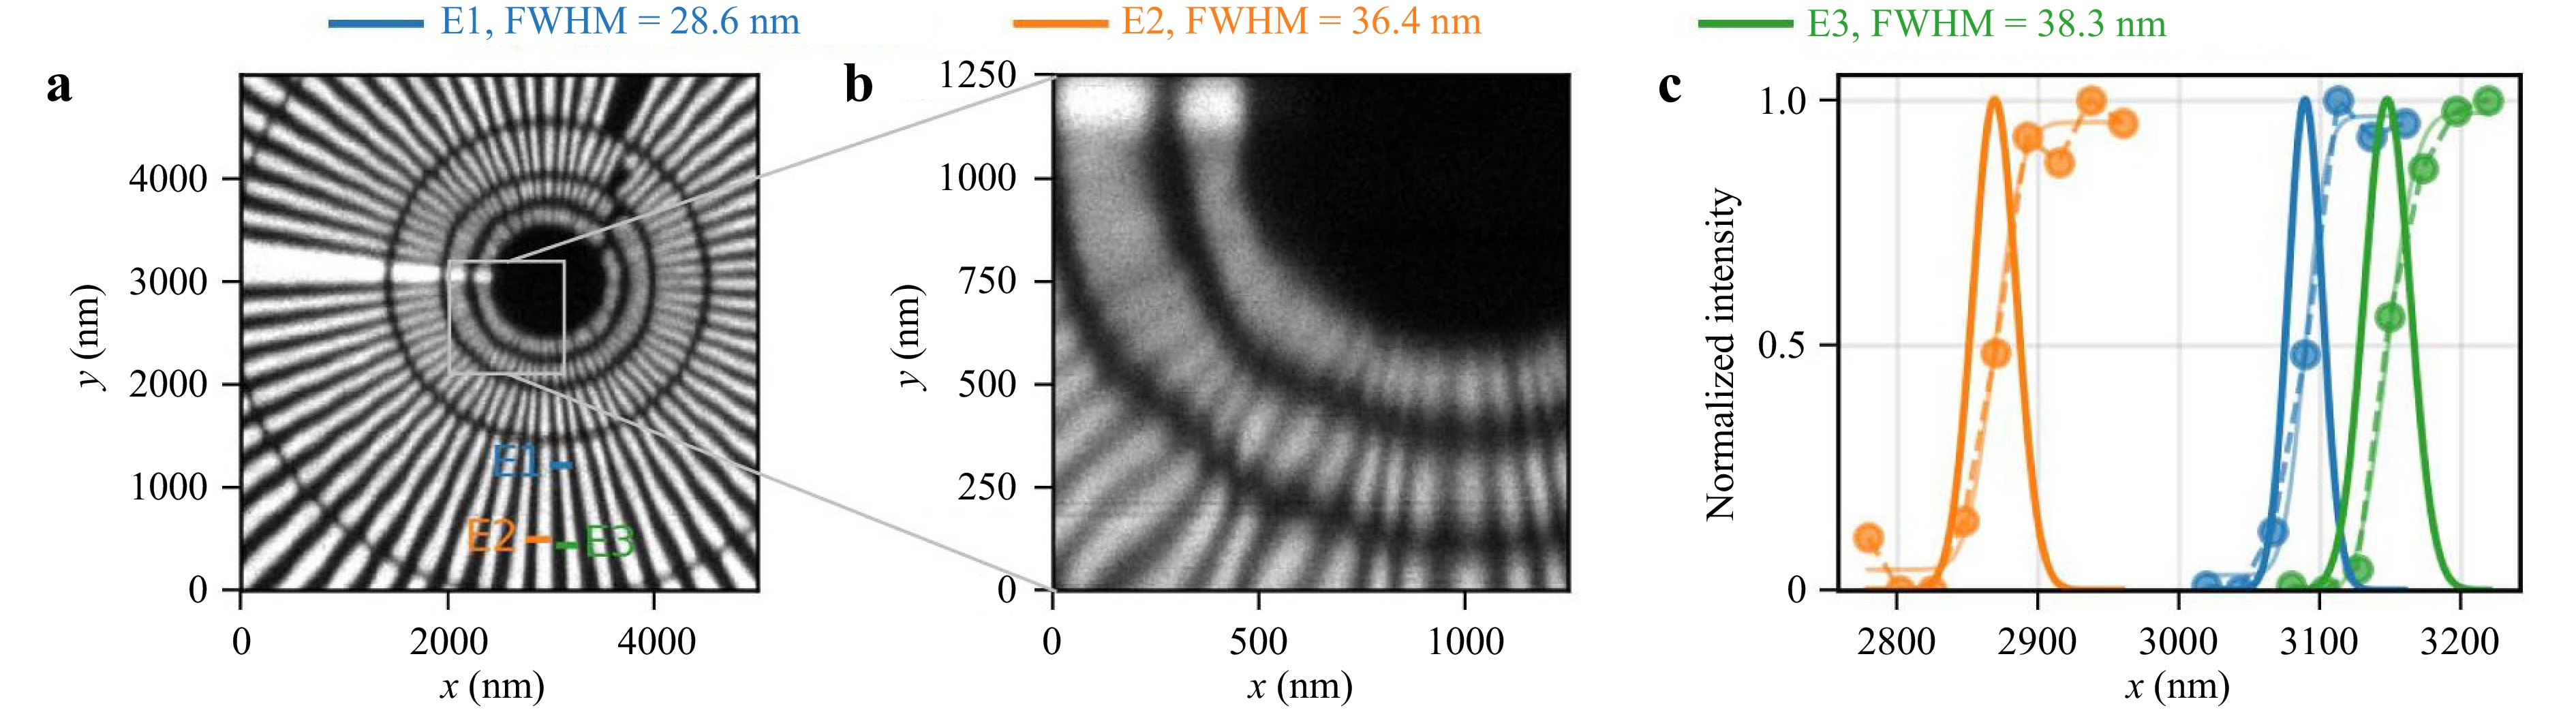
Fig. 7 Real-space XRF resolution benchmark using a Siemens star test pattern. a XRF image of the Siemens star acquired with a nominal 20 nm scan step, showing the overall structure. Three horizontal line profiles (E1–E3) are selected for edge-response analysis. b High-resolution scan of the central region acquired with a nominal 5 nm step, resolving the innermost spokes with features on the order of 30 nm. The resolution is convolved with the lithographic fidelity and edge roughness of the test pattern. c Quantitative edge analysis for locations E1–E3. The data points (circles) represent the measured intensity profiles, while the solid lines show the fitted error functions and the derived Gaussian line-spread functions (LSF). The extracted FWHM beam sizes are 28.6 nm, 36.4 nm, and 38.3 nm, respectively, confirming the 30-nm-level spatial resolution.
To obtain a quantitative width estimate, following the procedure for knife-edge processing described in Sec. 4.2, we analyzed the edge response at E1–E3 in Fig. 7c by fitting the measured intensity profiles with ERFs and converting the fitted parameter to an equivalent Gaussian line-spread function (LSF). The extracted FWHM values are 28.6 nm, 36.4 nm, and 38.3 nm for E1–E3, respectively. The spread across locations reflects a combination of local spoke geometry, fluorescence transfer function, scan sampling, and residual wavefront structure; nevertheless, all three measurements fall in a few tens of nanometers range and support the 30-nm-level real-space resolving capability inferred from the innermost spokes in Fig. 7b. Together with the HSSA sweep experiments in Fig. 6, these Siemens star results provide an independent validation of the nanofocus delivered by the KB pair.
-
The final stage of the pipeline evaluates the consistency of the wavefront delivered at the sample plane with the ex situ surface state established in Sec. 3.1. We perform this closure test by back-propagating the ptychography-reconstructed complex probe from the sample plane to the VKB and HKB pupil planes and comparing the height residuals derived from the inferred pupil phase with the ex situ metrology residuals. This approach probes the optical system in its mounted, operational configuration and provides a direct consistency check across domains of surface metrology (height referenced to the best-fit ellipse) versus wavefront error (phase over the illuminated pupil).
Starting from the reconstructed probe $ U(x,y) $ at the sample plane under the canonical SSA condition (Sec. 4.1), we propagate upstream to the two pupil planes using a Fraunhofer propagator39. The propagation distances are set by the mirror-to-focus separations ($ {\textit z}=-q_{v} $ for the VKB and $ {\textit z}=-q_{h} $ for the HKB), yielding complex pupil-plane fields $ U_v $ and $ U_h $. Lateral pupil coordinates are defined using the standard Fraunhofer scaling, and each pupil field is cropped to the illuminated region. From the cropped pupil, we form the wrapped phase, unwrap it to obtain a continuous phase map, and then convert phase to an equivalent surface height-error map using
$$ h_{\mathrm{bp}}=\frac{\lambda}{4{\text{π}} \sin\theta}\,\phi $$ (2) where $ \lambda $ is the X-ray wavelength, $ \theta $ is the grazing angle, and $ \phi $ is the unwrapped pupil phase. To compare with ex situ profiles, we reduce the 2D pupil height map to a 1D tangential profile by averaging along the transverse direction and map the pupil coordinate to the mirror tangential coordinate using the known ellipse geometry (Fig. 3) with the same residual calculation convention in Sec. 3.1.
Fig. 8 summarizes the resulting wavefront closure analysis for both mirrors. To validate the numerical approach, the complex probe was back-propagated using both an SRW propagator and a standard Fraunhofer propagator; the two methods yielded identical results, confirming the validity of the far-field approximation. The resulting pupil phase maps (Fig. 8a, c) show a smooth phase structure over the illuminated footprint.
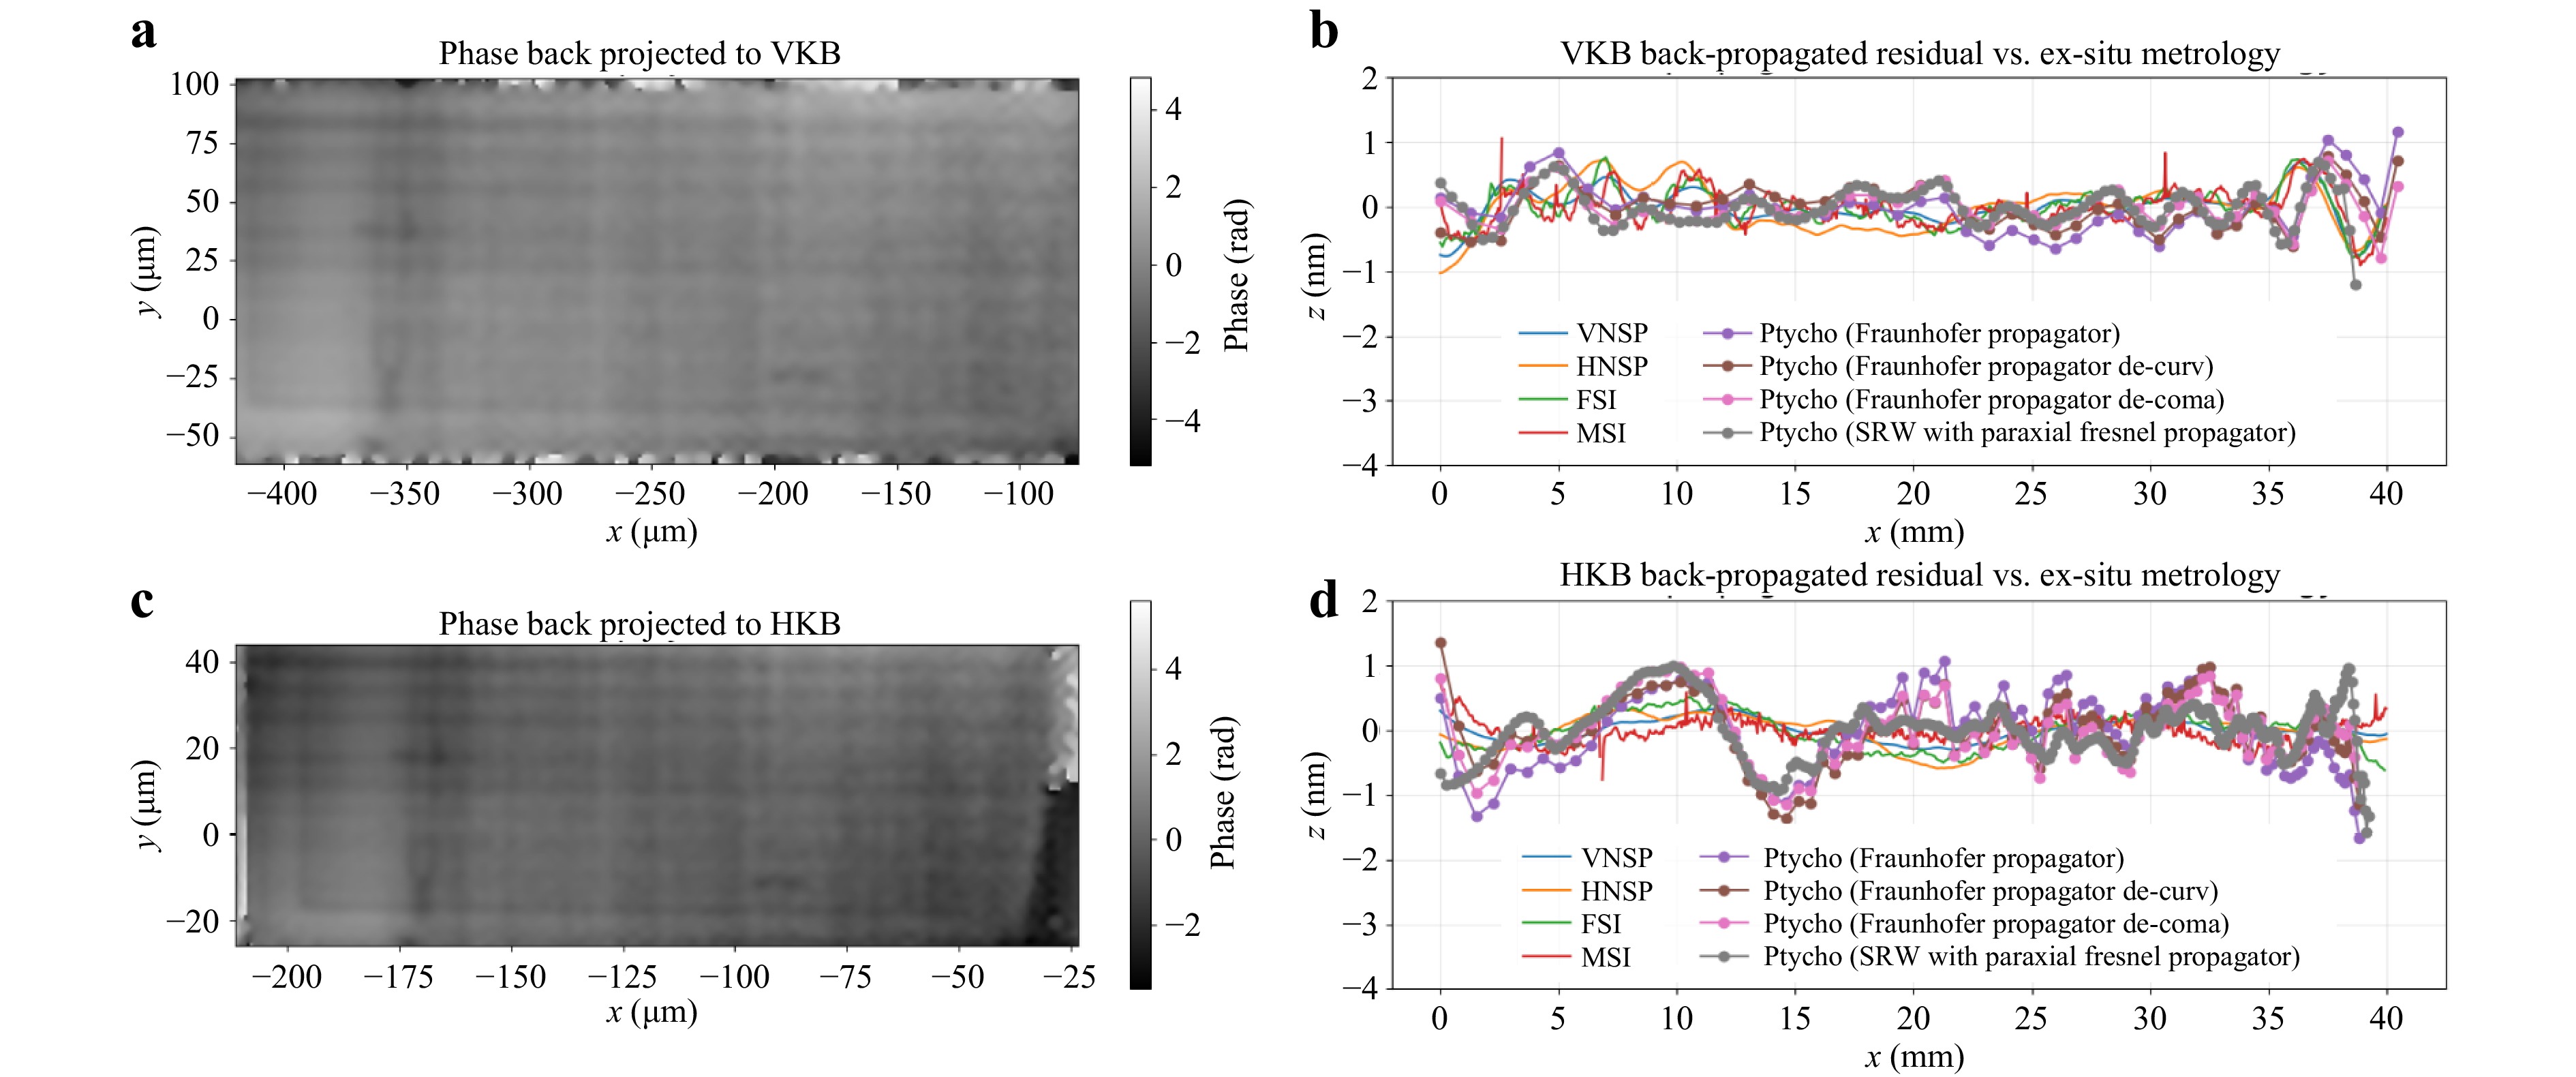
Fig. 8 Wavefront closure by back-propagation to the KB pupils and comparison to ex situ metrology. The ptychography-reconstructed complex probe at the sample plane is back-propagated to the mirror pupil planes using both a paraxial Fresnel propagator in SRW and a Fraunhofer propagator. The top row shows the vertical KB mirror (VKB), and the bottom row shows the horizontal KB mirror (HKB). a, c Back-propagated phase maps for the VKB and HKB, respectively, with the illuminated footprint used for the one-dimensional comparison indicated. b, d One-dimensional tangential height profiles comparing the back-propagated equivalent height residuals, labeled “Ptycho (Fraunhofer propagator)” and "Ptycho (SRW with paraxial Fresnel propagator)," with the ex situ residual profiles from VNSP, HNSP, FSI, and MSI. The curves labeled "Ptycho (Fraunhofer propagator de-curv)" show the same back-propagated profiles after removing residual tilt and defocus-like curvature. The curves labeled "Ptycho (Fraunhofer propagator de-coma)" further remove the leading asymmetric coma-like component. These low-order removals are diagnostic decompositions of the back-propagated wavefront, not additional experimental corrections applied to the KB system. The close agreement in residual morphology and scale across ptychography back-propagation, SRW propagation, and ex situ metrology indicates consistent ex situ–in situ performance and supports closure of the fabrication-metrology-beamline pipeline
The 1D tangential profiles (Fig. 8b, d) compare the pupil-derived equivalent height residuals, "Ptycho (Fraunhofer propagator)" and "Ptycho (SRW with paraxial Fresnel propagator)", against the ex situ residual measurements from VNSP, HNSP, FSI, and MSI (duplicated from Fig. 4). To isolate the surface-state-like residual structure from experimental misalignment, low-order terms are removed sequentially from the back-propagated profiles: the "Ptycho (Fraunhofer propagator de-curv)" curves denote profiles after the removal of tilt and curvature, while "Ptycho (Fraunhofer propagator de-coma)" further removes a coma-like component that captures the leading-order asymmetric mismatch across the footprint.
It is evident that the back-propagated residual profiles, even without low-order component removal, agree closely with the ex situ metrology profiles in both morphology and amplitude for the VKB and HKB. This agreement indicates that the wavefront delivered at the sample is consistent with the measured surface residual state within the illuminated pupils and that no additional low-order misalignment is required to be compensated. Effectively, Fig. 8 closes the loop from deterministic surface figuring and metrology to wavefront delivery under beamline operating conditions, providing an end-to-end validation of the fully in-house fabrication-metrology-beamline pipeline.
-
The measurements in Secs. 3 and 4 validate the proposed end-to-end workflow. The same residual surface state that is accepted by ex situ metrology (Fig. 4) predicts the delivered nanofocus under realistic coherence assumptions (Figs. 5, 6) and is recovered again by mirror-plane back-propagation from the measured probe (Fig. 8). This section interprets what, in practice, limits the focus at HXN under the canonical operating point and what the validated workflow implies for scaling prototype optics toward production-class ASM delivery.
-
The present results clarify the dominant performance hierarchy for this KB geometry. The ideal diffraction-limited focal sizes set by the accepted numerical aperture are 60.1 nm and 28.6 nm in the vertical and horizontal directions, respectively, whereas the partially coherent SRW prediction for the measured system is 77 × 36 nm2 and the ptychographic reconstruction gives 70.5 × 33.1 nm2. Thus, under the canonical SSA condition, the delivered focus is only slightly broader than the ideal NA-limited floor. The measured residual mirror figures, 0.36 nm RMS for the VKB and 0.42 nm RMS for the HKB, correspond to OPD errors below the two-mirror Maréchal budget at 12 keV and 4 mrad. Therefore, the current KB pair is not primarily figure-error limited; rather, the residual broadening is governed by partial coherence, effective source size, and KB pupil filling. This separation is the practical value of the closed-loop pipeline, which converts a measured surface state into a wavefront-level prediction, validates that prediction in situ, and identifies whether further improvement should target mirror figuring, beamline coherence, source demagnification, alignment, or the reconstruction model.
-
The HSSA sweep (Fig. 6) acts as a controlled perturbation that separates coherence-driven effects from mirror-driven ones. SRW predicts a monotonic increase in horizontal FWHM with HSSA as the coherent fraction decreases and then saturates. The XRF knife-edge widths follow the same monotonic trend and remain on the SRW scale, despite the deviations that resulted from finite scan step and edge quality. These two metrics together indicate that over the HSSA range explored in this study, the horizontal PSF is governed primarily by coherence and effective source extent, not by a change in mirror-limited aberrations.
The ptychographic widths extracted under the same sweep do not follow this trend (Fig. 6), including values that fall below the diffraction-limited floor at intermediate HSSA openings and a broadening at HSSA = 60 µm. This discrepancy is rather a modeling limit than an experimental contradiction. Conventional ptychography reconstructs an effective single coherent probe. As the beam becomes multi-mode, the inversion can absorb partial-coherence effects into the object/probe factorization and return a probe metric that is no longer a reliable estimator of the intensity PSF. In this regime, intensity-based real-space estimators (XRF knife-edge, Siemens star) and forward partial-coherence modeling provide the more stable spot-size metrics. Therefore, ptychography is suitable for measurements at the near-coherent condition (Fig. 8), but multi-mode ptychographic models are required if one aims to use ptychography itself as a quantitative PSF metrology tool at partial coherence.
-
The KB pair studied here has a prototype-scale 40 mm clear aperture, chosen to enable rapid iteration while exercising the full fabrication-metrology-validation loop. Scaling this workflow to production-class systems stresses the following considerations.
As clear aperture and accepted NA increase, the mirror must suppress surface error over a wider spatial-frequency band. The present results show that sub-nanometer height residuals over the illuminated footprint are sufficient to make coherence the dominant limiter at HXN; maintaining this hierarchy at larger NA requires that precision control remain at the same level.
Additionally, longer optics increase the error accumulation in the stitching-based height mapping, and systematic error terms that are negligible on 40 mm optics may become dominant over hundreds of millimeters. The end-to-end closure concept used in this study suggests a path forward: uncertainty-quantified ex situ maps feed forward into SRW prediction, and at-wavefront diagnostics are used not only for performance reporting but also as a consistency validation on the metrology state.
Ultimately, atomic-scale fabrication is necessary but not sufficient. The system-level bottleneck is the ability to carry a measured surface state through realistic wave-optics transport and recover it again from at-wavefront measurements in the real application configuration. The loop closed in this study provides that ability for a prototype KB system and defines the methodological ingredients that must be preserved as optics scale and acceptance increase.
-
We have established and validated a fully in-house, end-to-end pipeline for diffraction-limited hard X-ray nanofocusing optics, effectively closing the loop from deterministic ion beam figuring and precision ex situ metrology to in situ beam characterization. Under canonical operating conditions at 12 keV with a 8 × 7 µm2 secondary source aperture (SSA), ptychography yielded a focal spot of 70.5 × 33.1 nm2 (V × H) in close agreement with partially coherent SRW predictions of 77 × 36 nm2 (V × H) and independent fluorescence-based benchmarks. Controlled variation of the SSA confirmed that spot broadening in this regime is governed primarily by coherence-limited pupil filling. Finally, back-propagation of the reconstructed wavefront to the mirror planes provided a direct link between the in situ performance and the ex situ residual surface state.
Looking forward, two directions are immediate. First, as synchrotron radiation facilities are upgraded toward diffraction-limited storage rings, there is a high demand for a mirror fabrication pipeline that can manage and control the bandwidth of surface residual specifications without compromising beam quality. The mirror fabrication pipeline demonstrated in this paper clearly meets this demand, and we will further demonstrate this capability by producing new production-class KB mirrors for HXN user experiments. Second, accelerating the feedback loop will benefit from tighter coupling between uncertainty-quantified ex situ metrology and wave-optics modeling, utilizing in situ pupil reconstruction as an active feedback parameter rather than solely for validation.
-
This work was supported by the Accelerator and Detector Research Program, Scientific User Facilities Division, Office of Basic Energy Sciences, U.S. Department of Energy (DOE), under Field Work Proposal No. FWP-PS044, and by Brookhaven National Laboratory Laboratory Directed Research and Development (LDRD) Project 25-024. This research was carried out at the Optical Metrology Laboratory of the National Synchrotron Light Source II (NSLS-II), a DOE Office of Science User Facility operated by Brookhaven National Laboratory under Contract No. DE-SC0012704.
In-house pipeline from atomic-scale fabrication to at-wavefront validation of synchrotron X-ray nanofocusing mirrors
- Light: Advanced Manufacturing , (2026)
- Received: 06 March 2026
- Revised: 10 June 2026
- Accepted: 10 June 2026 Published online: 22 July 2026
doi: https://doi.org/10.37188/lam.2026.098
Abstract: Diffraction-limited synchrotron sources place stringent demands on wavefront-preserving X-ray optics. We report a fully in-house, closed-loop pipeline at the National Synchrotron Light Source II that links ion beam figuring, precision ex situ metrology, wavefront simulation, and in situ beam validation. The fabricated elliptical Kirkpatrick–Baez mirrors achieved 0.4 nm root-mean-square residual height error. At 12 keV, ptychography measured a 70.5 × 33.1 nm2 (V × H) focal spot using an 8 × 7 µm2 secondary source aperture, consistent with partially coherent Synchrotron Radiation Workshop simulations of 77 × 36 nm2. X-ray fluorescence imaging independently resolved approximately 30 nm features in a Siemens star. Back-propagation of the reconstructed probe further linked the measured wavefront to ex situ surface errors, establishing quantitative closure across fabrication, metrology, simulation, and beamline commissioning.
Research Summary
X-ray nanofocusing: Mirrors made and verified in-house
A fully in-house workflow for making and testing X-ray mirrors brings diffraction-limited nanofocusing closer to routine use at synchrotron facilities. Tianyi Wang, Lei Huang and colleagues at Brookhaven National Laboratory’s National Synchrotron Light Source II report an integrated pipeline that links ion beam figuring, precision surface metrology, wave-optics simulation and beamline validation. The team produced elliptical Kirkpatrick–Baez mirrors with residual height errors of about 0.4 nanometers. At 12 keV, ptychographic measurements gave a 70.5 × 33.1 nanometer focal spot, in close agreement with partially coherent simulations. X-ray fluorescence imaging of a Siemens star independently resolved features near 30 nanometers. By backpropagating the measured wavefront to the mirror pupils, the team confirmed consistency between fabrication, metrology and delivered beam performance.
Rights and permissions
Open Access This article is licensed under a Creative Commons Attribution 4.0 International License, which permits use, sharing, adaptation, distribution and reproduction in any medium or format, as long as you give appropriate credit to the original author(s) and the source, provide a link to the Creative Commons license, and indicate if changes were made. The images or other third party material in this article are included in the article′s Creative Commons license, unless indicated otherwise in a credit line to the material. If material is not included in the article′s Creative Commons license and your intended use is not permitted by statutory regulation or exceeds the permitted use, you will need to obtain permission directly from the copyright holder. To view a copy of this license, visit http://creativecommons.org/licenses/by/4.0/.

 DownLoad: