






HTML
-
In recent years, research on quantum computing and quantum technologies has grown substantially, leading to significant advances in hardware design and algorithm development1. Despite significant advances in the field, currently available quantum processors have barely reached the threshold of thousands of physical qubits, a number that is still insufficient to solve complex problems and span general applications. According to Fowler et al.2, thousands of logical qubits, and thus millions of physical qubits, are necessary for certain algorithms to ensure reliable outcomes when quantum error correction is applied. New error-correcting codes and architectures are emerging every day, improving the ratio of logical to physical qubits and lowering hardware requirements. Nevertheless, reaching the scale of thousands of logical qubits is expected to require at least $ 10^5 $ physical qubits3. Therefore, the advancement of quantum-computing technologies requires the scalable development of reliable qubit platforms. One of the most promising strategies for addressing this challenge is the adaptation of mature Complementary Metal-Oxide Semiconductor (CMOS) technology for fabricating semiconductor-based qubits. In this context, Si nanowires (NWs), which provide a strong lateral electron confinement in two dimensions, are an attractive platform for realising spin-based qubits4. The use of isotopically enriched 28Si has enabled exceptionally long spin-coherence times for both nuclear and electron spins5−7. In addition, NWs offer high carrier mobility, bandgap tunability, and compatibility with current device-fabrication technologies. From a scalability perspective, NWs offer a clear advantage: they enable the integration of multiple local metallic or superconducting contacts and electrostatic gates on the top, bottom, and sides of the wire, providing precise 3D control of electrons via spin-orbit and electrostatic interactions8−11.
The performance of electronic devices is highly dependent on the material quality. This dependence becomes even more significant for quantum devices that rely critically on the sustainment of quantum coherence. Factors such as the presence of crystalline disorder, surface conditions, and modifications introduced during device processing significantly affect the performance and reliability12−14. Given the precision required during the manufacturing process for a proper qubit function, it is essential to employ characterisation techniques capable of detecting structural defects at the micro- and nanoscales. Characterisation methods must be nondestructive, enabling in situ evaluation of devices during fabrication without introducing damage. μ-Raman spectroscopy meets these criteria because of its noninvasive character and exceptional sensitivity to structural properties, and it is capable of resolving subtle variations in material properties such as the presence of defects, surface states15, residual stress16, and thermal effects17.
Despite their subwavelength diameters, Si NWs can be effectively characterised using μ-Raman spectroscopy owing to polarisation-dependent resonance effects when the incident electric field is aligned parallel to the NW axis18,19. Under these conditions, the NW behaves as an optical dipolar nanoantenna, maximising the internal electric field, and consequently, the Raman scattering efficiency. By contrast, when the polarisation is perpendicular to the axis, the internal field is significantly attenuated, leading to a much weaker response20. The magnitude of this enhancement is further governed by the NW diameter, excitation wavelength, and substrate. In particular, for an excitation wavelength of 532 nm, Si NWs with diameters in the 40–60 nm range exhibit stronger resonant enhancement than thicker NWs (60–80 nm)18,21. Therefore, selecting an appropriate excitation wavelength relative to the NW dimensions and environment is essential for optimising the Raman signals.
This polarisation-dependent response is an essential tool for probing the physical properties of one-dimensional nanostructures, including crystallographic orientation and optical selection rules22,23. In particular, such effects have been utilised to evaluate local strain distributions and mechanical stress in nanoscale semiconductor systems because the antenna-enhanced signal provides the precision required to resolve subtle phonon frequency shifts24,25. Consequently, μ-Raman spectroscopy provides a robust nanoscale characterisation technique with an enhanced detection capability for investigating the structural and mechanical properties of anisotropic nanostructures.
Residual stress plays a key role in Si nanodevices, often leading to buckling or curvature if released26. In addition, even a modest residual stress can lift the heavy-hole/light-hole degeneracy and reduce band mixing, which can enhance the hole-qubit operation while remaining well below the mechanical damage thresholds27−29. In this paper, we report a μ-Raman investigation of Si NWs to determine their structural quality and stress. The Si NWs were fabricated by dry etching on silicon-on-insulator (SOI) wafers using a combined mixed-and-match optical/e-beam lithography approach. We present two different accurate stress extraction methodologies: intentional localised laser heating of the NW and removal of both the underlying bulk Si substrate and the buried oxide (BOX) SiO2 layer to obtain freestanding Si NWs. Both approaches provide reliable and equivalent stress measurements. Simultaneously, simulations based on Finite Element Methods (FEM) were performed to properly understand the experimental results and extract additional information regarding the stress distributions in the NWs.
-
Si NWs were fabricated via the dry etching of silicon-on-insulator (SOI) wafers. Fig. 1a shows the scheme of the samples, which consist of a boron-doped monocrystalline Si substrate oriented along the $ \langle 001 \rangle $ direction with a thickness of 725 µm, a 400 nm thermal SiO2 layer, and a 50 nm monocrystalline Si layer, also oriented along $ \langle 001 \rangle $. The NWs and their source/drain connections were defined on the top Si layer using a mixed-and-match lithography approach that combined electron beam and optical patterning, followed by dry etching. The NW widths ranged from 40 to 60 nm. The NWs analysed by Raman spectroscopy for stress extraction were 50 nm wide, Fig. 1b. The geometrical parameters used as input for the FEM simulations are illustrated in Fig. 1a.
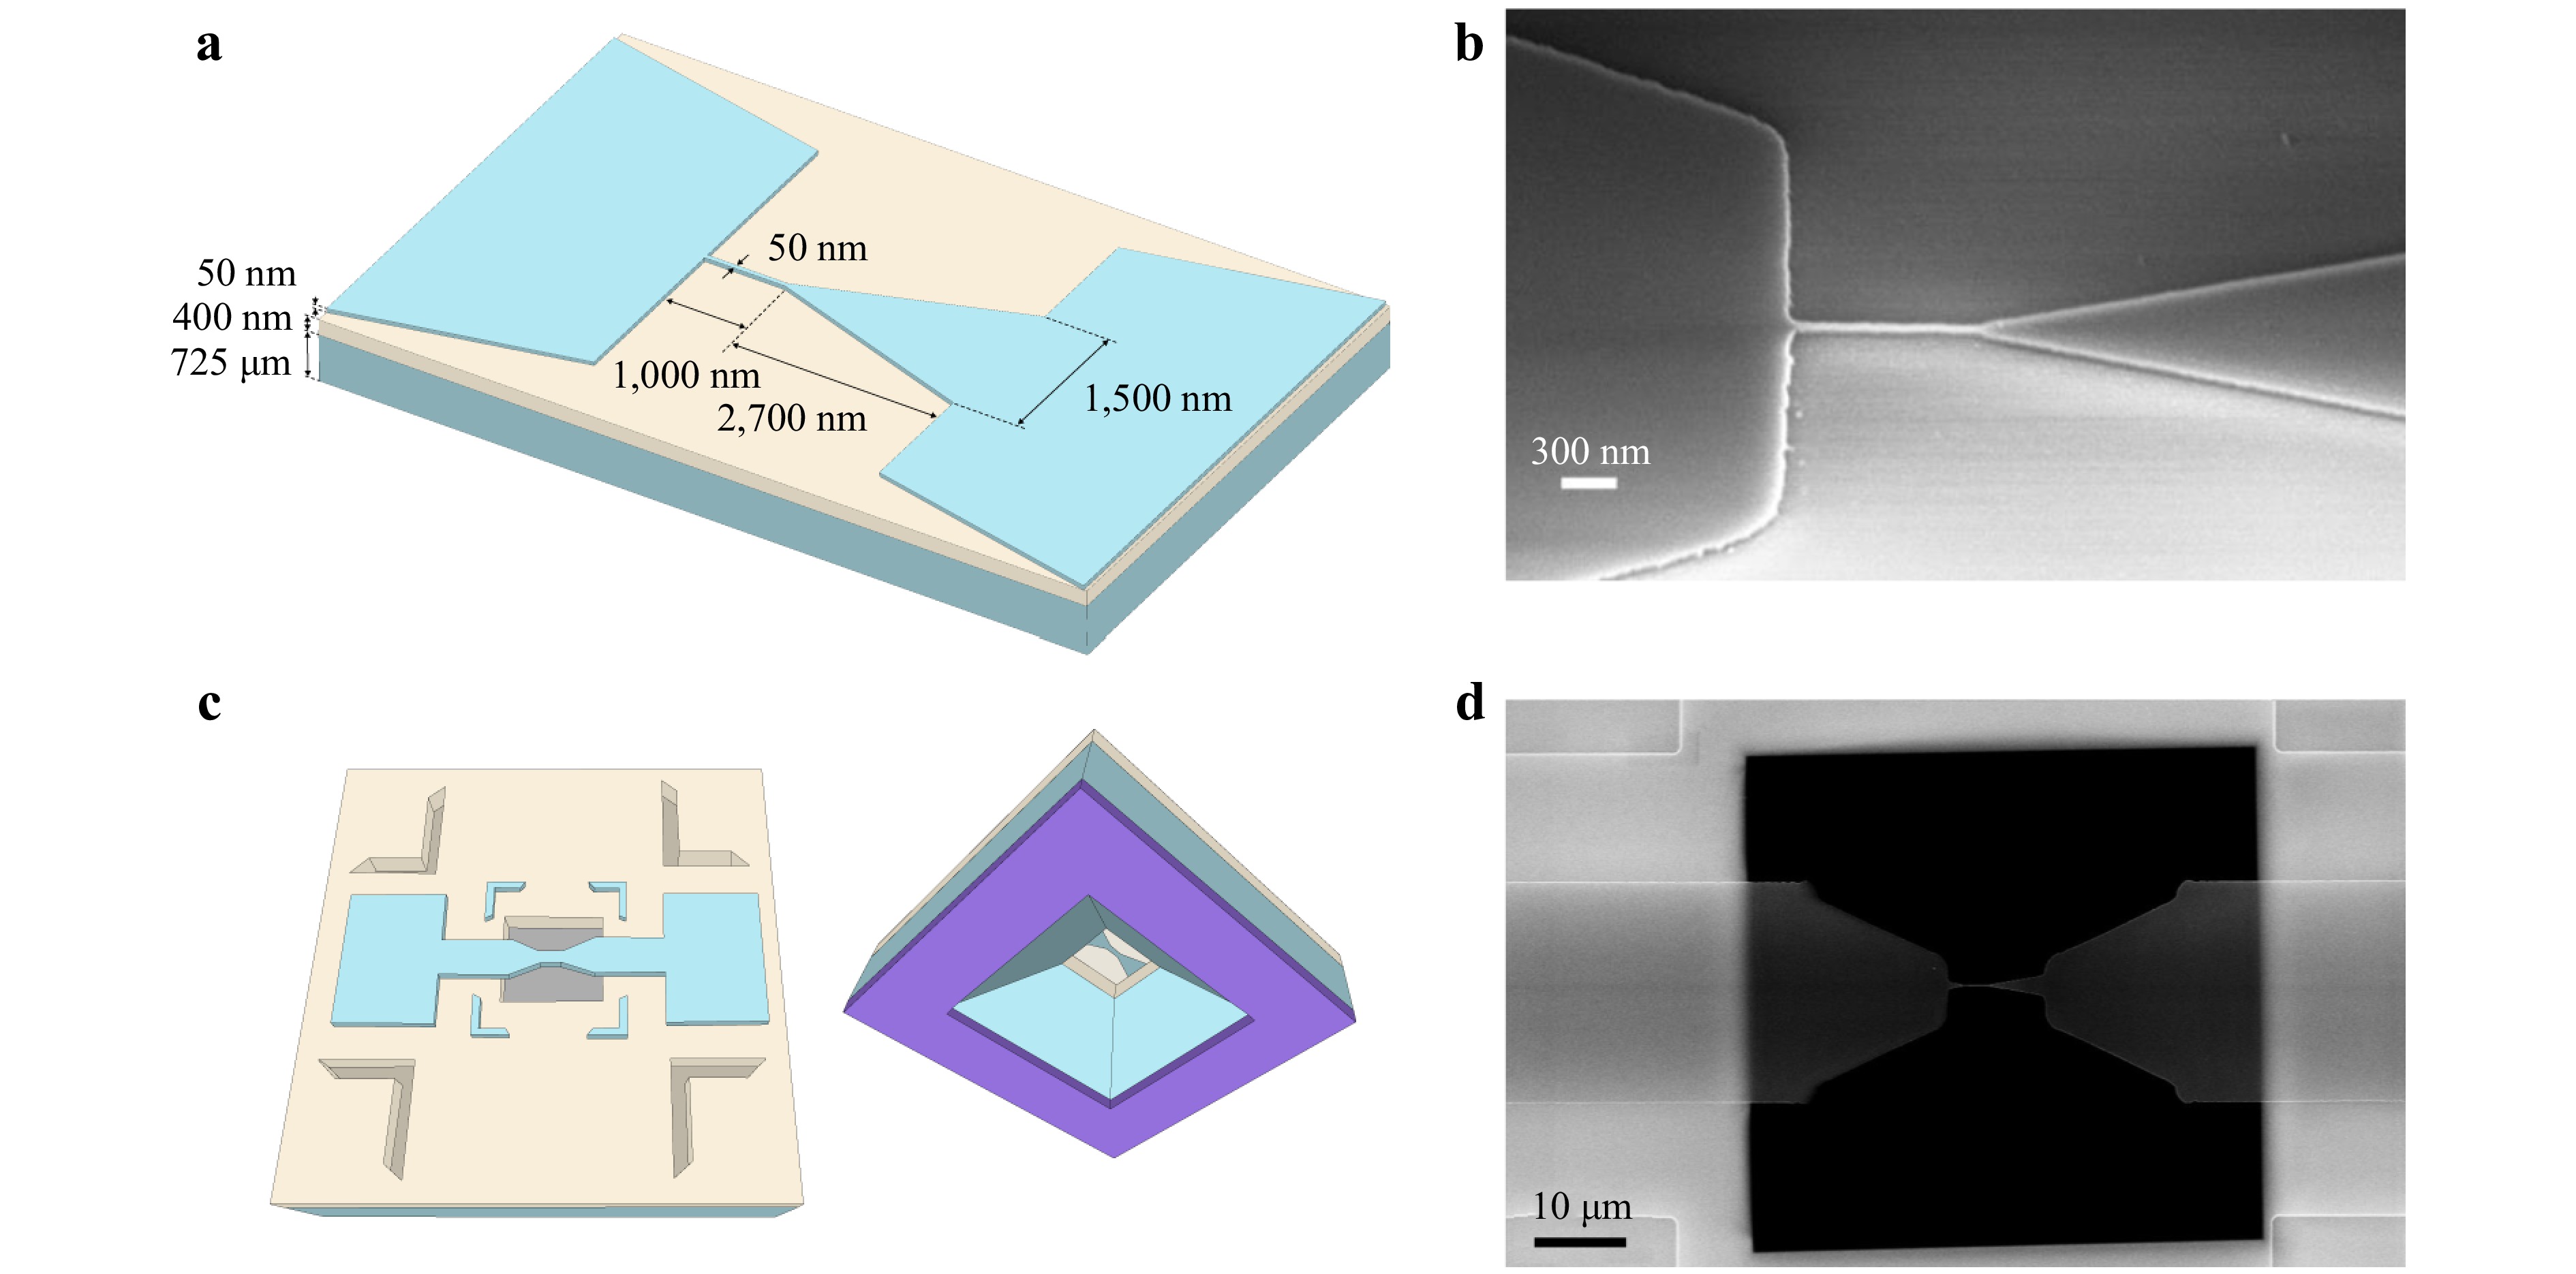
Fig. 1 a Schematic representation of the sample. b SEM image of a Si NW and its pads. c Illustration of the free-standing NW, presented in both top and bottom views. d SEM image of a free-standing NW, suspended over the etched window and supported only by the electrodes on the surrounding frame.
To directly access the Si NW information in some samples, we removed the Si substrate beneath the NWs in a controlled manner using optical lithography and anisotropic etching on the back side of the wafer. Wafer-scale local Si substrate removal occurred after NW fabrication. The samples were prepared by depositing a SiNx mask; subsequently, anisotropic KOH etching removed the Si substrate beneath the NW, avoiding damage to the NW. The oxide layer directly beneath the Si NWs was selectively removed using a HF bath, resulting in freestanding NWs, while the oxide in the surrounding frame regions of the sample remained intact. A schematic representation of the result is presented in Fig. 1c. The NWs retained their integrity after the subsequent dicing and cleaning steps, as shown in the SEM image in Fig. 1d. See the Materials and Methods for further details on the sample fabrication process.
Sample description
-
Characterisation of Si NWs etched on SOI wafers is particularly challenging because of the combination of reduced signal strength and intertwined physical effects. The nanoscale diameter of the NWs leads to a very small scattering volume; thus, the Raman response is typically dominated by the underlying Si substrate because the optical penetration depth exceeds the NW thickness. At the same time, the interpretation and isolation of the NW contribution are complicated by the coexistence of several mechanisms that affect the Raman peak position and linewidth, including residual stress, laser-induced heating, and phonon confinement30,31. In particular, even moderate excitation powers can induce significant local heating in Si nanowires, producing redshifts and broadenings comparable to or larger than those expected from confinement or strain, which can easily lead to misinterpretation of the spectra32,33. Moreover, thermal effects are exacerbated by the reduced thermal conductivity of nanoscale Si, which is dominated by surface and boundary scattering, limiting heat dissipation and promoting non-uniform temperature distributions. In addition, the SOI configuration further increases the characterisation complexity because the buried oxide modifies both the heat transport and mechanical boundary conditions, introducing additional stress components through interfacial strain transfer and thermal mismatch31. These challenges are consistent with the broader analyses of SOI fabrication and characterisation, which highlight the intrinsic difficulty in obtaining quantitative layer specific stress values in ultrathin Si films34,35.
Although routine methodologies are applied to mitigate background signals (e.g., low incident laser power or pinhole control to limit the depth of field), the NW geometry and SOI structure allow the incident laser beam to reach the Si substrate. Other possible approaches, such as using UV excitation to leverage the shallow penetration depth, still result in substrate illumination because the beam can circumvent the NW diameter. In addition, low stress values typically fall within the measurement error range, further complicating the accurate estimation of this magnitude.
Altogether, these factors make the reliable extraction of intrinsic NW properties from Raman measurements highly nontrivial and thus require carefully designed experimental strategies to decouple the different contributions. To overcome these challenges, two approaches have been considered for characterising NWs with submicron resolution.
In the first approach, we intentionally induced local heating of the NW using an incident laser beam to modify the Raman spectrum of the NW and distinguish it from the signal of the unperturbed Si substrate beneath the NW. This allowed us to perform two-peak fitting and extract information concerning only the NW. The main challenge in this approach is the modification of the NW Raman spectrum by changing the temperature. Thus, to determine the stress on the NWs using this experimental approach, we must separate the thermal and stress contributions to the Raman peak shape.
By contrast, in the second method, we propose an alternative path to directly access the information of the Si NW by locally removing the underlying Si substrate using optical lithography and anisotropic etching, thereby providing a benchmark against the laser heating approach. Thus, the absence of the underlying substrate permits cleaner measurement of the Si NW.
-
To differentiate the NW signal from that of the substrate, we intentionally induced localised laser heating of the NW by applying a sufficiently high excitation power. This modified the NW Raman spectrum without causing damage and allowed us to decouple the signal arising from the NW and the one coming from the Si substrate. The dissipation of heat in NWs depends on the materials in their vicinity36, their dimensions21, and surface roughness37. In this case, the NWs lie on SiO2, which has a very low thermal conductivity compared to bulk Si. Furthermore, the thermal conductivity of the NW decreases with its diameter38, and the surface roughness can be significant because of the etching process, which can further reduce the thermal conductivity by enhancing diffusing phonon scattering39−41. Hence, the heat dissipation capability of the NWs was significantly reduced compared to that of bulk Si.
When a NW is heated by a laser beam, temperature-induced changes in the phonon frequency and linewidth must be considered to obtain the real stress on the NW. The temperature dependence of phonon frequency can be expressed as42:
$$ \omega(T) = \omega_{0} + \Delta\omega_{{\mathrm{te}}}(T) + \Delta\omega_{{\mathrm{anhar}}}(T) $$ (1) where $ \omega_{0} $ is the phonon frequency at 0 K, $ \Delta\omega_{{\mathrm{te}}} $ is the Raman shift due to thermal expansion, and $ \Delta\omega_{{\mathrm{anhar}}} $ is the Raman shift due to anharmonic phonon decay (phonon-phonon coupling). The thermal expansion term is described as follows42:
$$ \Delta\omega_{{\mathrm{te}}}(T) = \omega_{0} \left( \exp{ \left[ -3 \gamma \int_{0}^{T} \alpha(T') {\mathrm{d}}T' \right]} - 1 \right) $$ (2) where $ \alpha(T) $ is the coefficient of linear thermal expansion, $\gamma $ = 1.02 is the Grüneisen parameter, and the integral is defined from 0 K to T, the temperature reached by the NW.
The anharmonic contribution is mainly due to the three- and four-phonon decay processes and is expressed as42,32
$$ \begin{split} \Delta\omega_{{\mathrm{anhar}}}(T) = & A_{1}\left(1+\frac{2}{e^{\hbar\omega_{0}/2k_{{\mathrm{B}}}T}-1}\right) + \\ & A_{2}\left( 1+\frac{3}{e^{\hbar\omega_{0}/3k_{{\mathrm{B}}}T}-1} +\frac{3}{(e^{\hbar\omega_{0}/3k_{{\mathrm{B}}}T}-1)^2} \right) \end{split} $$ (3) The linewidth is also shaped by the anharmonic phonon decay according to the following dependence:
$$ \begin{split} \varGamma(T) =& \varGamma_0 + B_{1} \left(1+\frac{2}{e^{\hbar\omega_{0}/2k_{{\mathrm{B}}}T}-1}\right)+ \\ & B_{2}\left( 1+\frac{3}{e^{\hbar\omega_{0}/3k_{{\mathrm{B}}}T}-1} +\frac{3}{(e^{\hbar\omega_{0}/3k_{{\mathrm{B}}}T}-1)^2} \right) \end{split} $$ (4) where $ A_1 = -2.5606 $ cm−1, $ A_2 = -0.0998 $ cm−1, $ B_1 = 1.4093 $ cm−1, and $ B_2 = 0.0667 $ cm−1 are the anharmonic parameters, $ \varGamma_0 = 1.3 $ cm−1 is the linewidth at 0 K, and $ \omega_{0} $ = 526.0746 cm−1. These parameters were determined from the experimentally measured variation as a function of the temperature of the Raman shift and linewidth of the released Si membrane (top Si layer) obtained by locally removing the BOX and bulk Si (Fig. 1c and d). The sample temperature was externally regulated using a temperature-controlled stage (see Experimental setup), and a low laser power was applied to prevent laser-induced heating.
In addition to the effect of temperature on the Raman signals, the effect of stress must also be considered. Stress alters the Raman spectrum relative to an unstressed sample; tensile stress induces a shift in the phonon frequency to lower frequencies, whereas compressive stress shifts it to higher frequencies. In a NW, which can be treated as a one-dimensional structure, only the uniaxial stress along its axis should be considered because the transverse in-plane components ($ \sigma_{yy} $ and $ \sigma_{zz} $) relax, leaving only the longitudinal component $ (\sigma_{xx}) $.
Following33,43, the phonon frequency can be converted into total stress using a linear relation derived from the phonon deformation potential formalism for Si. The stress shift coefficient (SSC) depends on the crystallographic orientation, stress configuration, and Raman selection rules. In this study, the SSC reported in43 was used, yielding a value of $ -0.434 $ $ \text{GPa}/\text{cm}^{-1} $ for uniaxial stress along the $ \langle 110 \rangle $ direction, considering the $ \langle 001 \rangle $ surface and the present measurement configuration. This value is consistent with those reported in the literature. In particular, the work of Ureña et al.44, carried out on top-down suspended Si NWs with a thickness of 200 nm fabricated along the $ \langle 110 \rangle $ direction, subjected to uniaxial stresses up to 4.5 GPa and characterised using a 458 nm excitation wavelength, presented experimental conditions closely comparable to those of the present study and reported an SSC of $ -0.497 $ GPa/cm−1. This result agrees with subsequent studies such as25 (15 nm Si NWs), with an SSC of approximately $ -0.526 $ GPa/cm−1, and45 (100 nm Si beams with doping), which obtained an SSC value of $ -0.395 $ GPa/cm−1. Although some of these works account for additional effects such as size-dependent elastic properties and doping, all the reported coefficients remain in the same tight range as the values used in this work. Under these assumptions, the stress is given by
$$ \sigma = -0.434 \left( \dfrac{\text{GPa}}{\text{ cm}^{-1}} \right) \Delta\omega_{\mathrm{s}} $$ (5) To determine the stress distribution along the NW, we decoupled the respective contributions of stress and temperature to the Raman shift. We assumed that the full width at half maximum (FWHM) depends solely on the temperature, $ \varGamma (T) $, because neither significant stress gradients nor structural disorder are present, and phonon confinement becomes relevant only for Si NWs with diameters below 20 nm46,47. Thus, any change in FWHM can be attributed to temperature effects, allowing the temperature to be extracted from its variation using Eq. (4). By contrast, the phonon frequency depends on both the stress and temperature, $ \omega_{\text{exp}}(\sigma,T) $; therefore, once the temperature is determined from the FWHM, the temperature-induced Raman shift can be calculated, and the stress contribution to the frequency shift can be extracted.
After determining the temperature from the FWHM using Eq. (4), the corresponding temperature-induced Raman shift $ \omega_{\text{temp}}(T) $ is calculated using Eq. (1). The thermal contribution is then given by $ \Delta\omega_{\text{temp}}(T) = \omega_{\text{temp}}(T) - \omega_{\text{ref}} $, where $ \omega_{\text{ref}} = 520.7 $ cm−1 corresponds to the phonon frequency of unstressed Si at room temperature. The total experimental Raman shift relative to the Si reference is $ \Delta\omega_{\text{exp}}(\sigma,T) = \omega_{\text{exp}}(\sigma,T) - \omega_{\text{ref}} $ and contains both thermal and stress contributions. Finally, subtracting the thermal component from the total shift yields a corrected Raman shift free of heating effects, $ \Delta\omega_{\text{NH}}(\sigma) $.
$$ \Delta\omega_{\text{NH}}(\sigma) = \Delta\omega_{\text{exp}}(\sigma,T) - \Delta\omega_{\text{temp}}(T) $$ (6) Now, $ \Delta\omega_{\text{NH}}(\sigma) $ contains only the effect of stress, which allows us to extract it directly using Eq. (5).
Using this procedure, we obtained the stress in the Si NWs by performing in-depth Raman linescans, as shown in Fig. 2a. The representative Raman spectrum of a locally heated NW is represented in Fig. 2b. We can see that the Si peak on the NW shifts to lower frequencies, and its FWHM increases owing to the induced heating with respect to the substrate peak, which remains mostly unperturbed along the line scan. To fit the Raman spectra, we used a Lorentzian lineshape in the case of the NW and a Fano lineshape for the substrate peak48. The Fano lineshape was used because at laser powers above $ 0.84 $ mW, where the power density is $ I \approx 2.06 \times 10^5 $ W/cm2, a slight Fano effect appears because of the photogenerated carriers. If the Fano effect is not considered, then the temperature obtained from the FWHM (Eq. (4)) is overestimated.
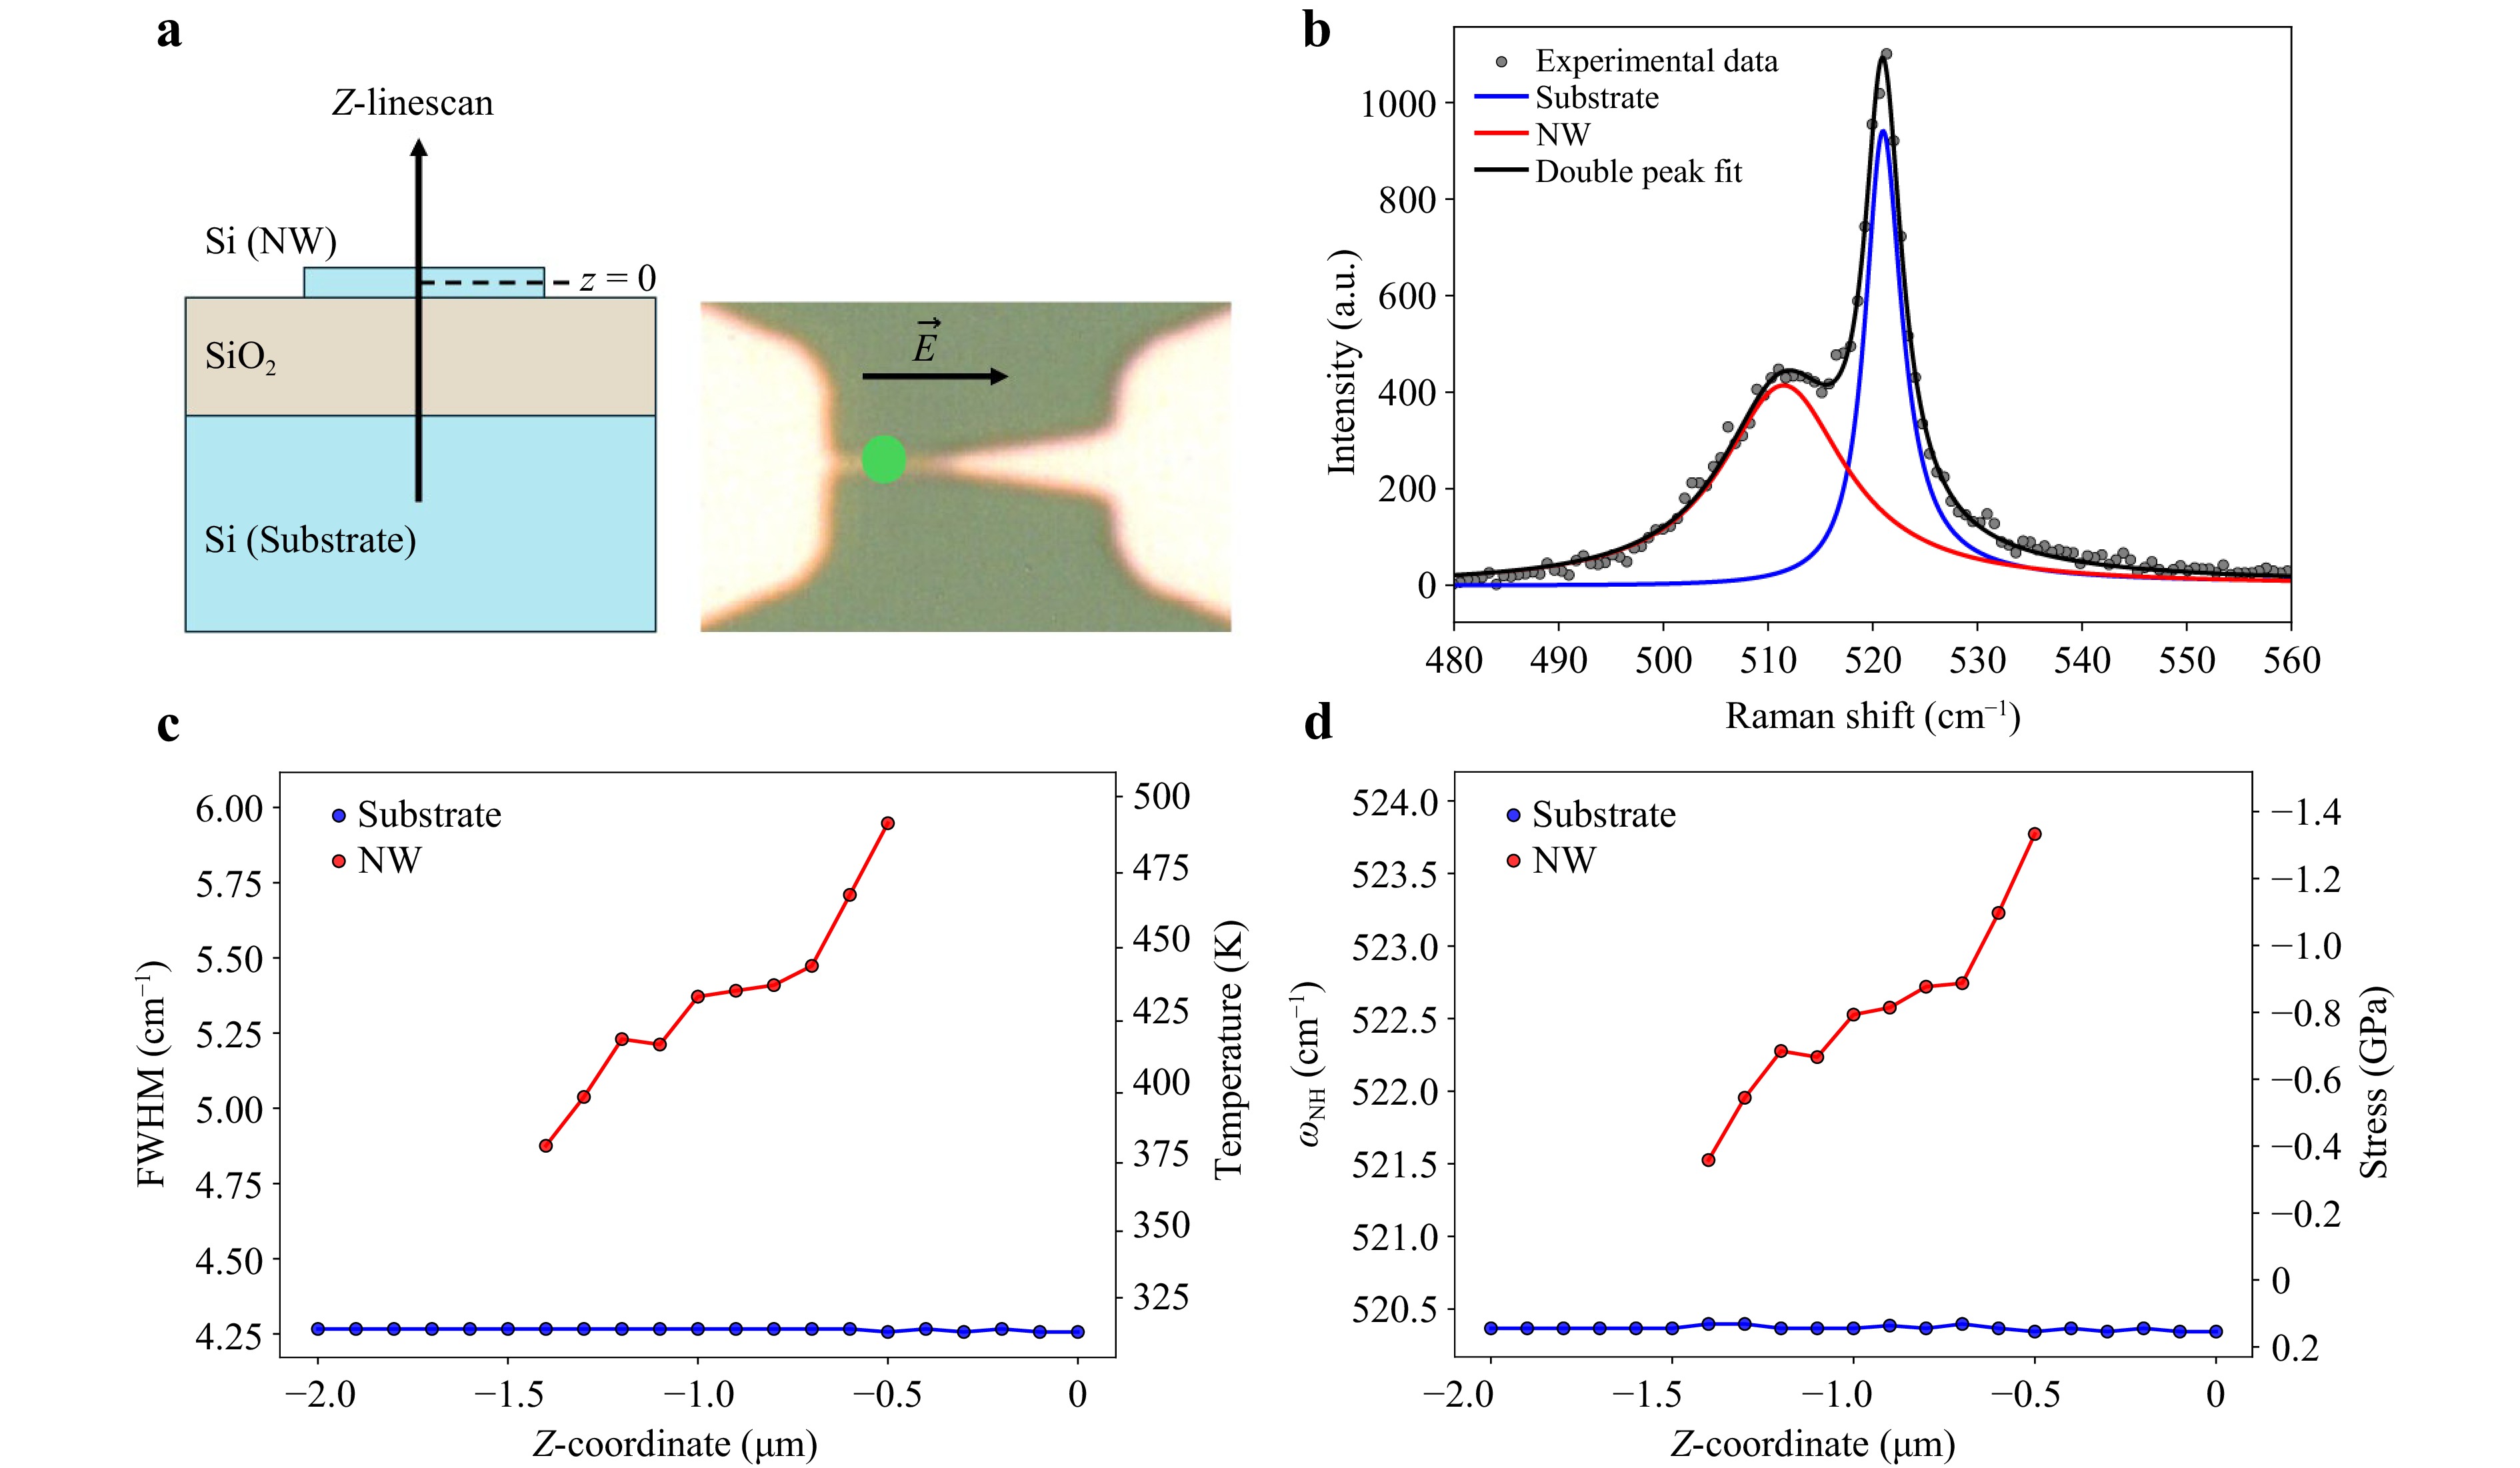
Fig. 2 a Scheme of the Z-linescan over the NW with the laser polarised parallel to the NW axis. $ z=0 $ corresponds to the NW layer. b Representative Raman spectrum when the NW is locally heated with the excitation laser. Experimental data (points), double peak fit (black line), NW peak (red line), and substrate peak (blue line). c FWHM of the NW (red) and substrate (blue) Raman signals, together with the corresponding temperature (right Y-axis), as a function of the Z-coordinate along the linescan. d Raman shift of the NW (red) and substrate (blue) Raman signals, together with the corresponding stress (right Y-axis), as a function of the Z-coordinate along the linescan.
To probe both the NW and Si substrates, we performed multiple in-depth line scans, as shown in Fig. 2a, while increasing the laser power. To achieve confocality and reduce the Raman signal from the substrate, we used a minimum spectrometer pinhole size (10 μm). Thus, we reduced the Raman signal that arrived at the detector from planes apart from the focal plane. Therefore, we obtained the relative intensity between the peak of the NW and that of the substrate, which allowed us to deconvolute both peaks and obtain the stress on the NW.
Fig. 2c shows the FWHM and corresponding temperature calculated using Eq. (4), for the substrate (blue) and NW (red) peaks obtained from the double-peak fit, as a function of the line-scan depth (Z-coordinate). We observed that, above approximately 500 K, the Raman measurements no longer follow Eqs. (1)–(6), resulting in large errors in the stress calculations. This deviation from the behaviour at lower temperatures may result from the significant temperature and stress gradients caused by local laser heating at high temperatures because the proposed treatment assumes homogeneous distributions of both. Defect formation and disorder were ruled out because the low-temperature measurements could be reproduced after high-power laser exposure. Taking this into account, we focus on the line-scan points where the NW peak temperature remains below 500 K, shown in Fig. 2c, to ensure the reliable determination of the intrinsic stress in the NW; full Z-coordinate linescans are provided in the Supplementary Data, Fig. S1. The corrected Raman shift without the heating effects, $ \Delta\omega_{\text{NH}}(\sigma) $, and its associated stresses are shown in Fig. 2d. The stress shown in the figure depends on the calculated temperature. The temperature dependence of the stress originates from the differential responses of the materials to laser heating: Si undergoes thermal expansion, whereas SiO2 remains mostly unaffected. Consequently, SiO2 exerts compressive stress (thermal stress) on the NW, which increases with temperature as the NW tend to expand further.
To determine the intrinsic stress of the NW, we represented the stress as a function of the temperature and extrapolated the observed stress trends to room temperature (300 K). Hence, the compressive effect arising from the thermal expansion mismatch between the NW and SiO2 is removed, yielding the intrinsic stress of the NW (marked by an X in Fig. 3). This fitting was performed for different values of incident laser power and showed remarkable reproducibility. A stress value of $ 0.34 \pm 0.04 $ GPa was obtained for NW 1 (Fig. 3a), and a stress value of $ 0.17 \pm 0.04 $ GPa was obtained for NW 2 (Fig. 3b). These stress values correspond to minor elastic strains (0.1%–0.2%) within the linear elastic regime of silicon29,49. Strains of this magnitude are sufficient to break the cubic symmetry of the valence band and lift heavy-hole (HH) and light-hole (LH) degeneracy via deformation-potential coupling, reducing HH–LH mixing even without quantum confinement28,50. Such strain-induced valence-band splitting modifies the hole spin–orbit coupling and hole g-tensor, enabling reduced band mixing and access to operating regimes with lower sensitivity to electrical noise27,51,52. These effects are relevant for hole-based qubits, while the applied stress remains significantly below the thresholds associated with defect formation or mechanical degradation.
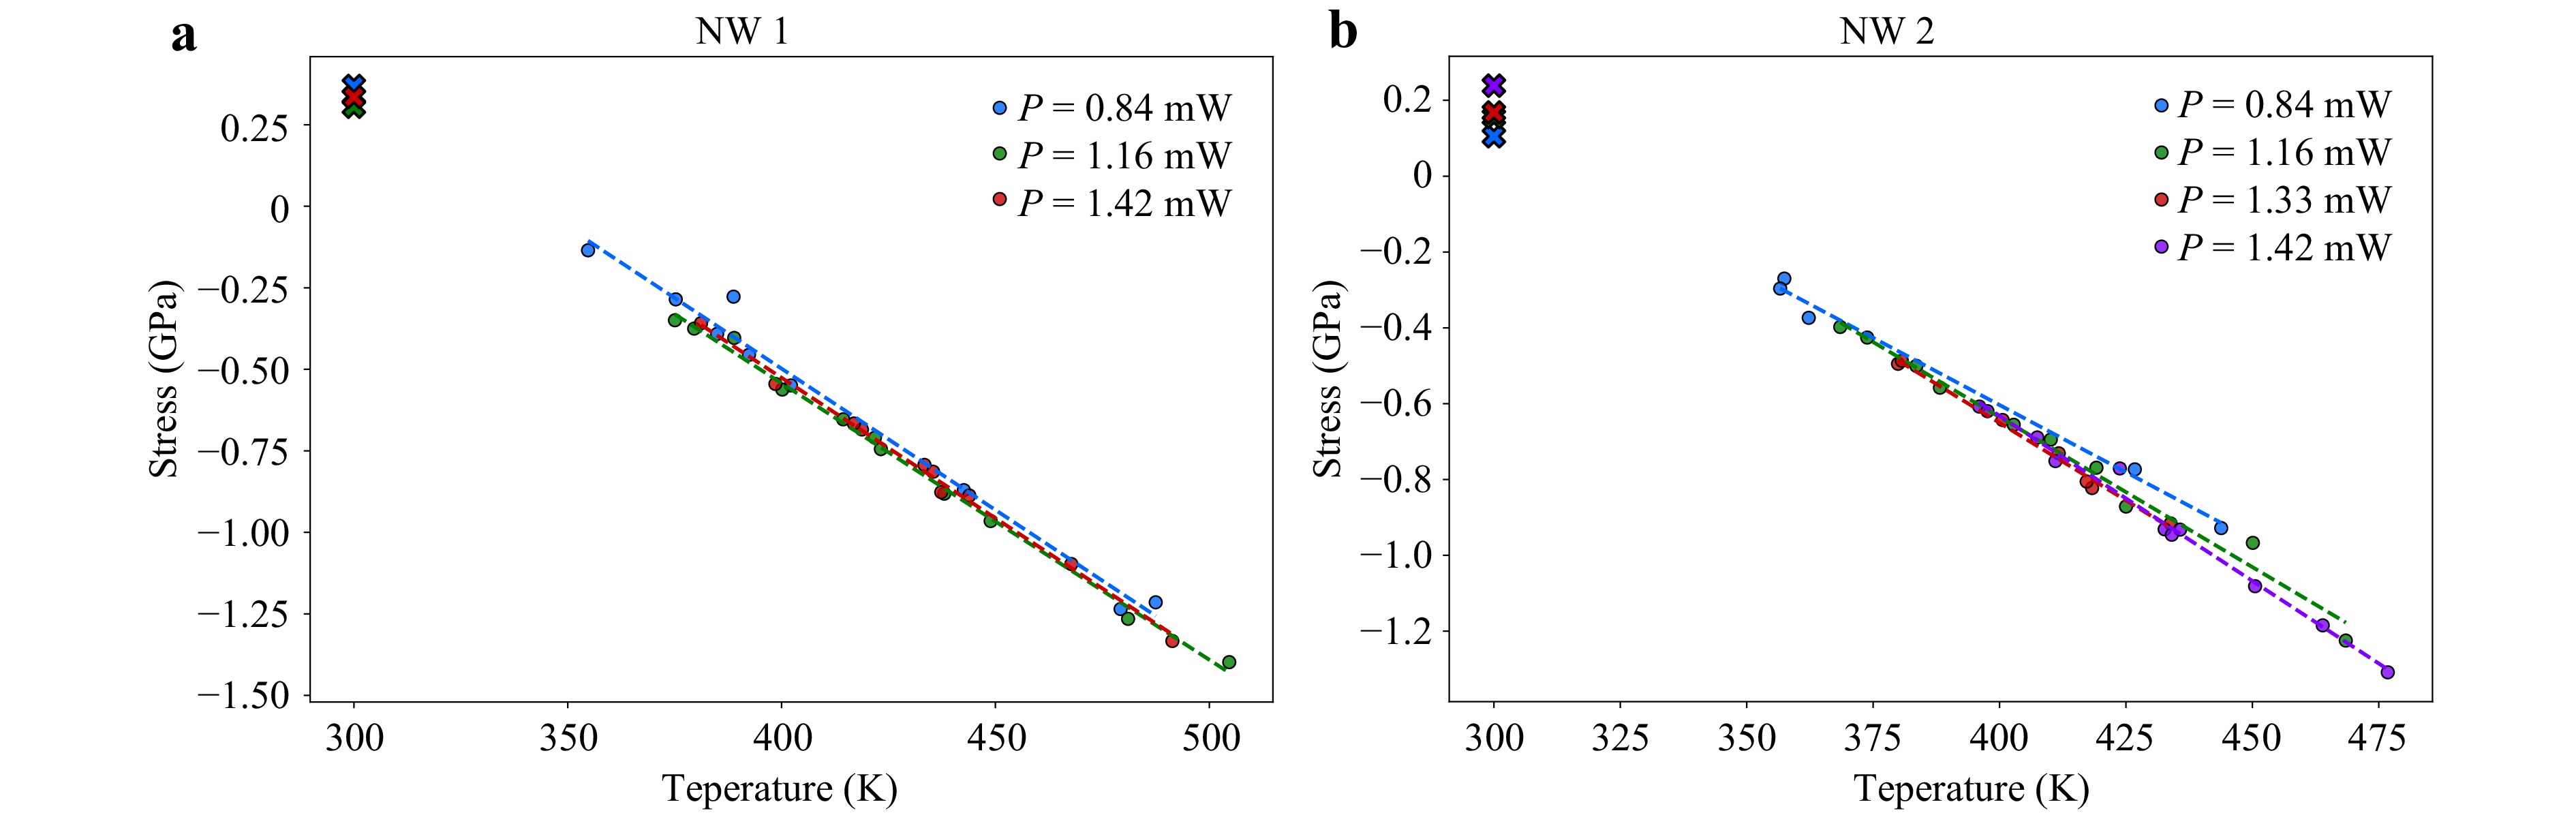
Fig. 3 Stress as a function of temperature measured during the z-line scan at different laser powers. The intrinsic stress at 300 K, extracted for each laser power, is indicated by X markers for two different nanowires: a and b.
Finally, it is important to note that the obtained data do not show any dependence on the applied laser power, as can be observed from the overlapping lines in Fig. 3, which indicates the robustness of the method and the intrinsic nature of the obtained room-temperature stress.
-
An alternative path to directly access information on Si NWs involves fabricating samples in which the Si substrate beneath the NW has been locally removed. However, the removal of the underlying Si and SiO2 results in the partial relaxation of the freestanding NW. As a result, the stress that we are measuring is not only the stress generated in the NW due to the etching process but also the stress caused by relaxation after removing the Si substrate and SiO2 beneath the NW and the contact pads. This residual stress distribution originated from the high-temperature processing followed by cooling to room temperature in the SOI structures. This is mainly due to the mismatch between the thermal expansion coefficients of Si and SiO2. Upon cooling, Si tends to contract more than SiO2. However, this contraction is constrained by interfacial bonding, which leads to tensile strain in the Si layer and compressive stress in the oxide53,54.
To determine the initial stress of the NW (before substrate removal), a FEM simulation of the NW was performed. Stress calculations were performed using the solid mechanics module of COMSOL Multiphysics. The geometrical parameters were obtained from SEM measurements, as shown in Fig. 1a. The top Si layer of SOI wafers exhibits biaxial in-plane tensile stress53. However, after the removal of the Si substrate and SiO2 layer beneath the NW and pads, the mechanical boundary conditions were significantly modified, with subsequent relaxation. The proposed FEM model contains only one free parameter, the initial NW stress ($\sigma $), and the sample geometry fully determines the remaining parameters. The simulation was run for $\sigma $ in the range of 0–1 GPa in steps of 0.05 GPa, yielding the measured stress after the Si substrate removal process. Subsequently, the simulated stress profiles were extracted from the model results and fitted to the experimentally measured stress distributions. Thus, the initial stress of the NW was uniquely determined by minimising the deviation between the model and experimental data.
An in-plane line scan was performed to determine the stress distribution along the NW. We used a low laser power (P$ =0.054 $ mW) corresponding to a power density of $ I = 1.33 \times 10^4 $ W/cm2 to avoid heating effects.
Fig. 4a shows the in-plane stress obtained from the Raman measurements (black line) compared with the FEM simulations (blue line). The lower part of the figure shows an optical image of the NW along which a line scan was performed. The stress remained approximately constant and close to zero in the left pad, whereas a compressive stress of approximately $ -0.2 $ GPa developed at the junction with the NW. Along the NW, the stress gradually transitioned to the tensile regime, reaching approximately $ 0.2 $ GPa. Upon approaching the junction with the tapered region, the stress became compressive again (approximately $ -0.3 $ GPa). At the onset of the tapered region, the structure relaxes again. We can also observe the presence of tensile stress in the central part of the tapered region, which appears on all the studied NWs (see Fig. 4b). Fig. 4a shows that the location of the tensile stress correlates with the end of the tapered region and its junction with the right pad. Thus, this tensile stress most likely occurs because of the different stiffnesses of these two regions and the corresponding local relaxation at this interface.
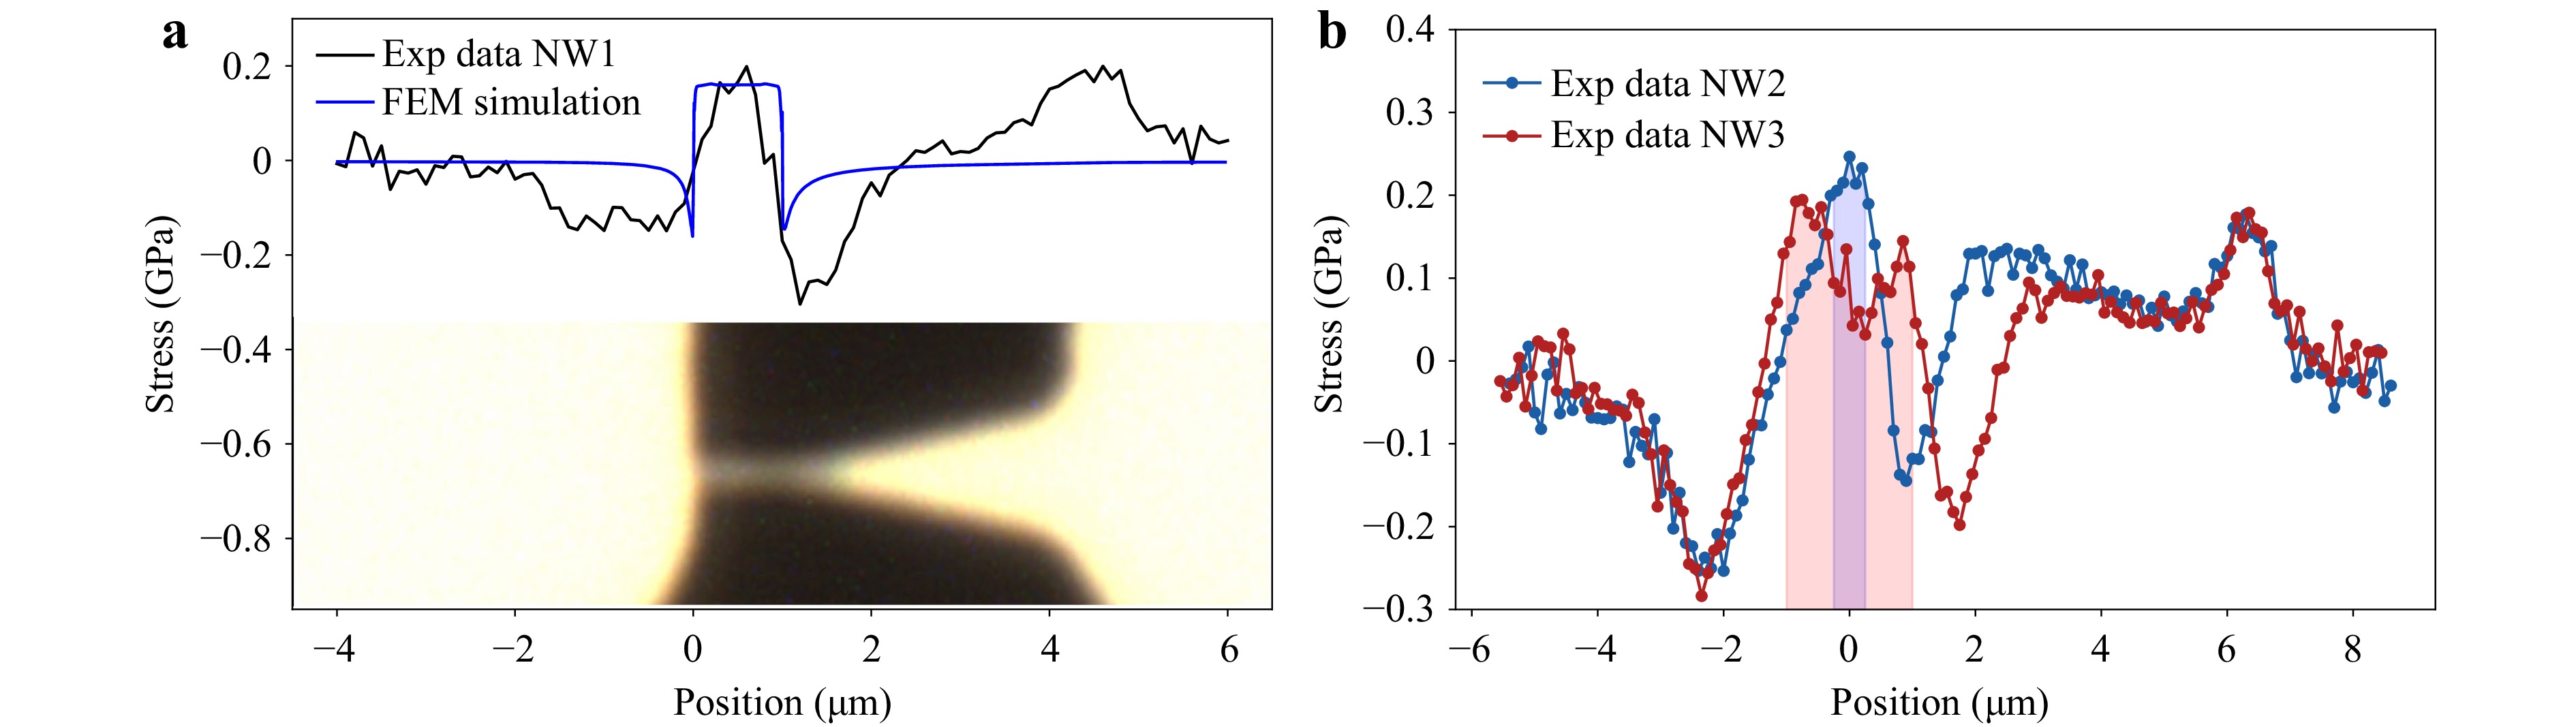
Fig. 4 a Comparison of the experimental stress profile along the NW (black) with the FEM simulation stress results (blue). b Experimental stress profiles measured along two NWs of different lengths: NW 2 (500 nm, blue curve) and NW 3 (2,000 nm, red curve). The regions corresponding to the NWs are shaded in blue for NW 2 and in red for NW 3.
Good agreement was observed between the FEM simulations and experimental data in the NW, which is the region of interest for producing qubits.
Fig. 4b shows the experimental stress profiles measured along NWs of different lengths: NW 2 (500 nm, blue curve) and NW 3 (2,000 nm, red curve). The stress distributions closely resemble the profile shown in Fig. 4a, exhibiting the same qualitative trends.
To demonstrate the capabilities of the proposed methodology, we performed 2D Raman mapping and calculated the corresponding stress distributions. Fig. 5a and 5b show an optical image and an experimental stress map obtained from the Raman mapping of NW 1, respectively. The outline of the structure is indicated by the white dashed lines to aid in the interpretation of the stress map. These results were similar to those presented in Fig. 4. A slight compressive stress (from $ \approx $ $ -0.2 $ GPa) was observed at the junctions between the pads and the NW. Along the NW, the stress gradually evolved into a tensile regime, reaching approximately $ 0.2 $ GPa. In the tapered region, only a weak tensile stress was detected. In contrast, the edge of the tapered region shows a very slight compressive stress, which is likely influenced by the nearby junction between the NW and the tapered region. In addition, the stress at the edges, particularly along the edge of the left pad, exhibited a tensile characteristic similar to that of the NW. The signal detected beyond the physical edges of the sample (dashed white line) arises from the finite size of the laser spot. The beam is not point-like but has a diameter of $ \approx $ 720 nm, and the measured Raman intensity therefore corresponds to the convolution of the Gaussian beam profile with the sample geometry.
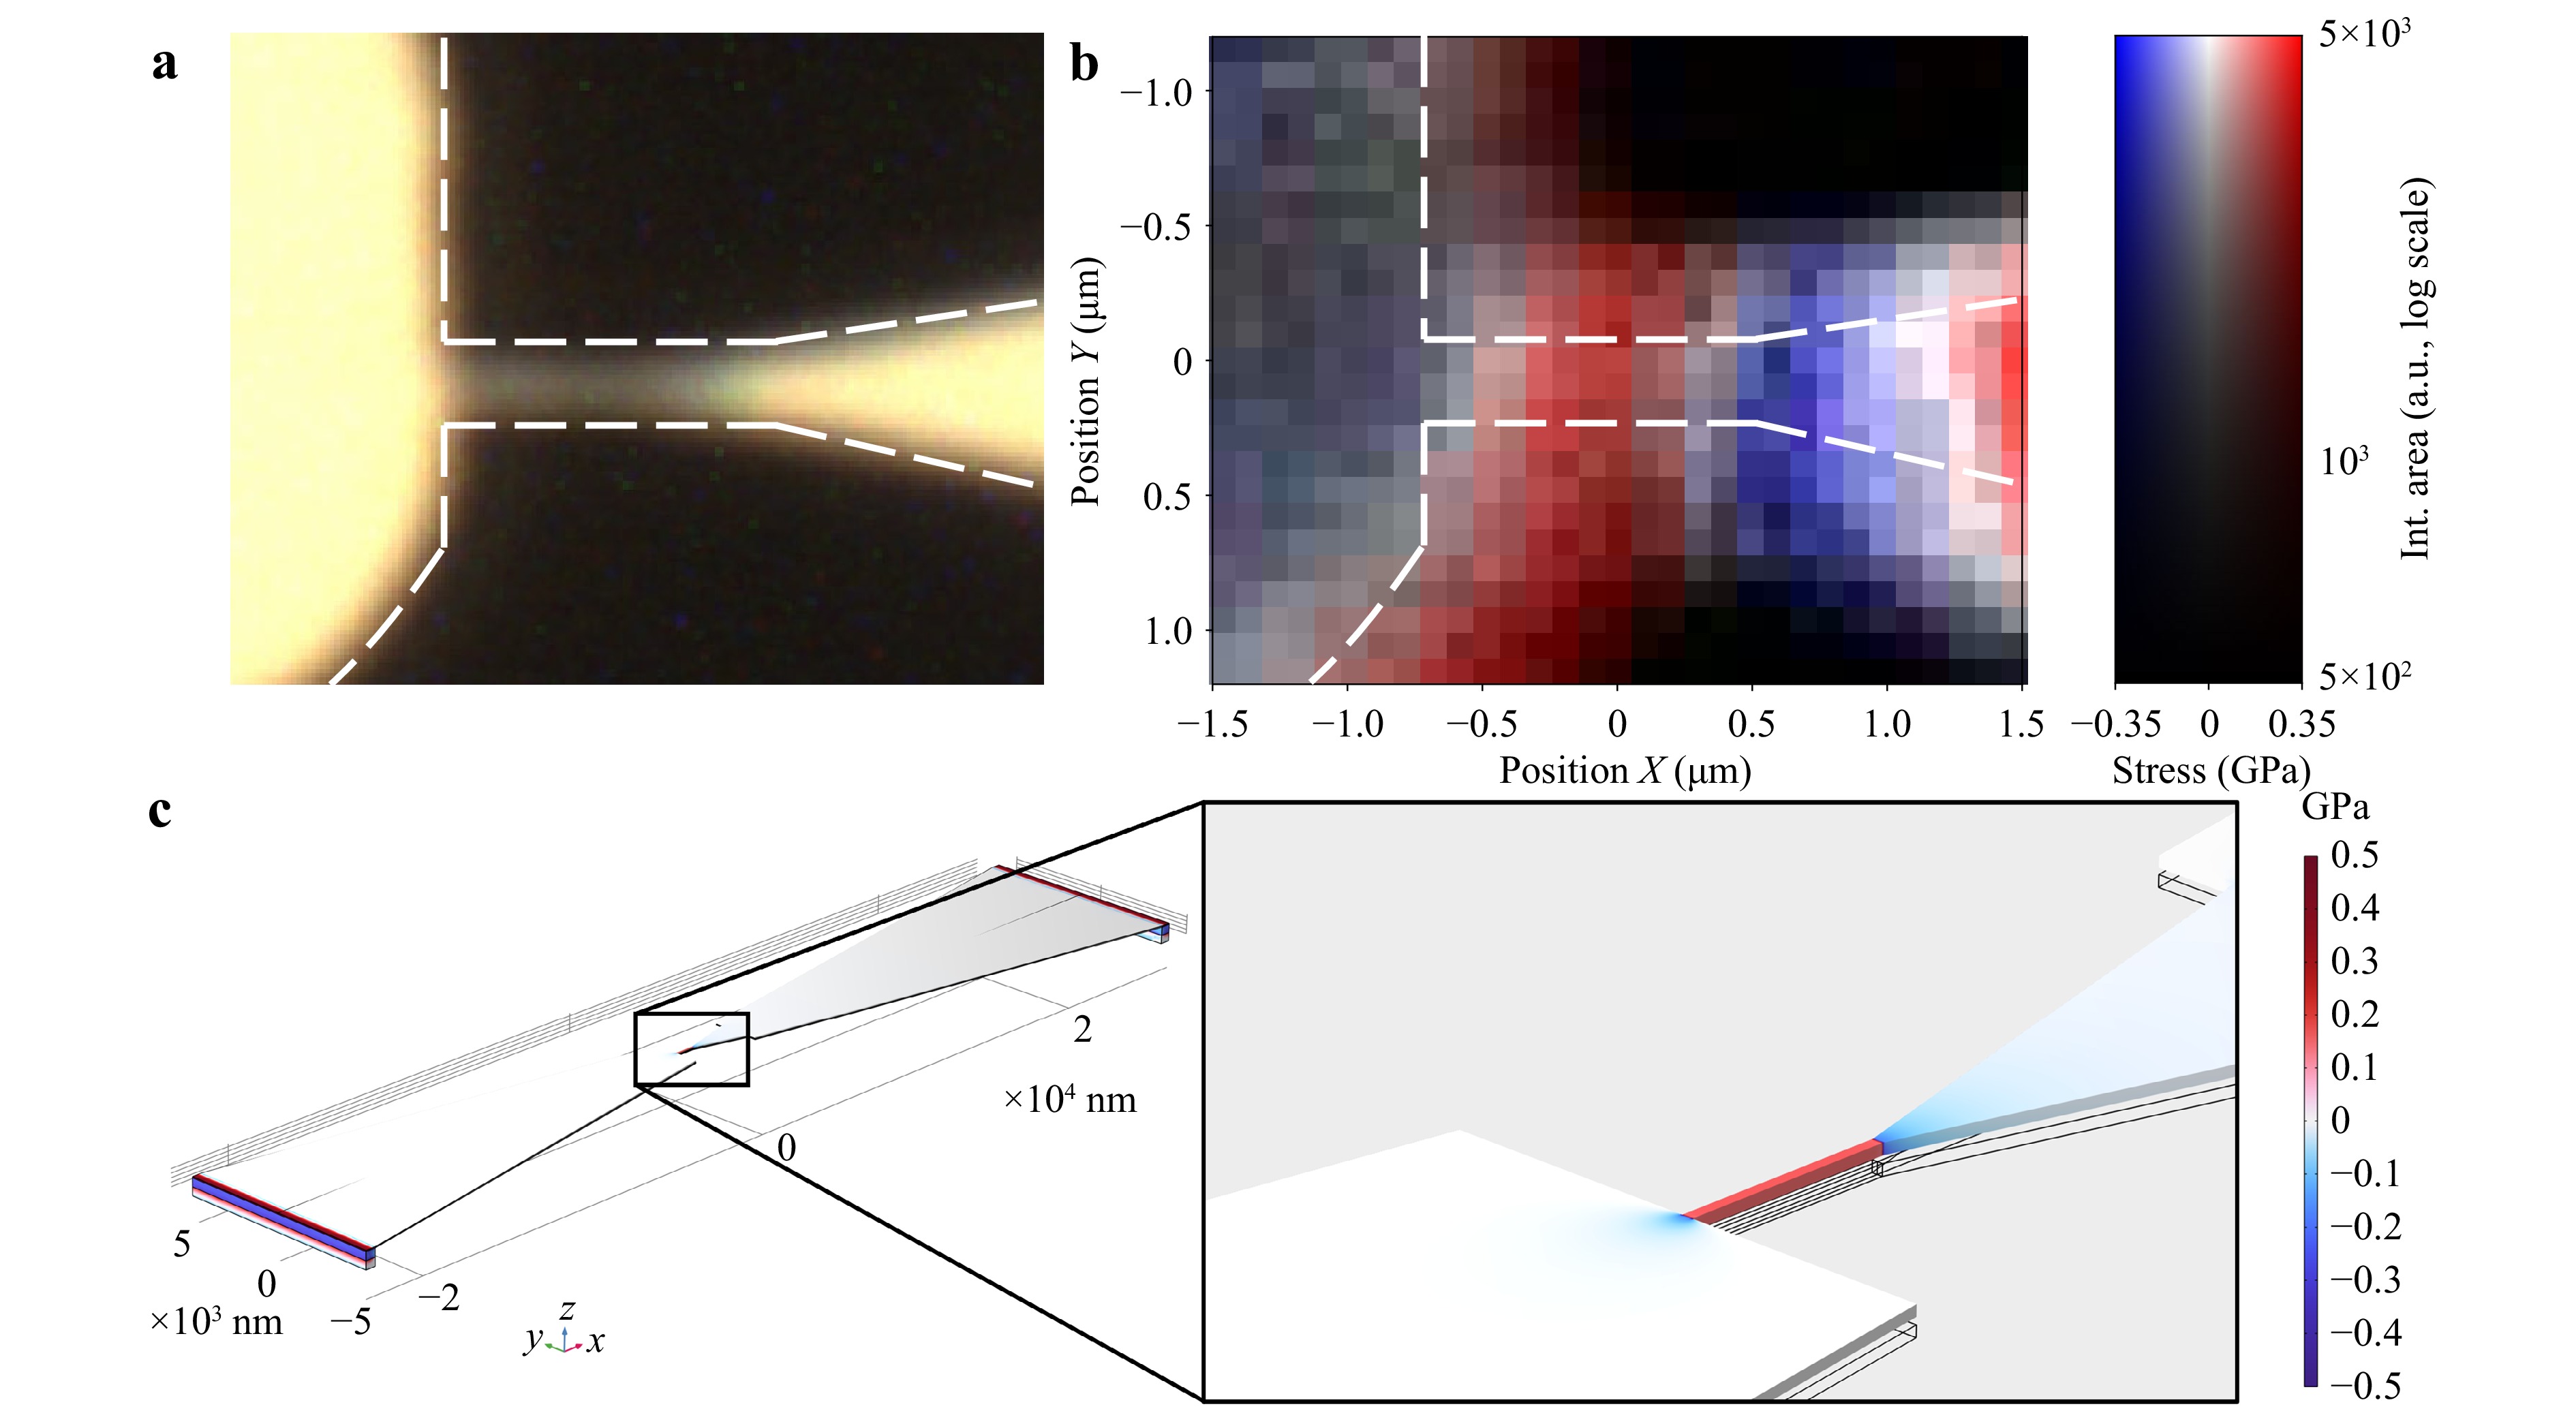
Fig. 5 a Optical image of the region where the Raman spectral map was acquired for NW 1. b Experimental stress map corresponding to the optical image. The contour of the structure is drawn with white dashed lines. The intensity of the colourbar (vertical) represents the Raman integrated area on a logarithmic scale, while the colour scale (horizontal) encodes the calculated stress in GPa: blue indicates compressive stress, white indicates zero stress, and red indicates tensile stress. c Structure and 3D stress distribution of the free-standing NW, the tapered region, and the pads obtained from the COMSOL model. On the right, a zoomed-in view of the NW highlights the local stress distribution. Note the slight bowing of the NW in the vertical direction as a result of the substrate removal. The black lines indicate the initial flat NW structure for reference, and the deformation scale is 1∶1.
Fig. 5c shows the structure and 3D stress distribution of the freestanding NW, tapered region, and pads obtained using the COMSOL model. At the ends of the pads, where the SiO2 layer and the Si substrate remain intact, Si experiences tensile stress, whereas SiO2 experiences compressive stress. By contrast, the regions of the NW and pads, where both SiO2 and the Si substrate have been removed, can relax. This relaxation leads to a partial release of stress and a slight bending of the structure toward the positive z axis in our reference frame, as shown in the magnified view on the right. For comparison, the structure formed by the black lines represents the initial state of the flat NW. The deformation scale is 1:1. This deformation induces additional stress within the NW and at its junction with the pads. The NW experiences tensile stress, whereas compressive stress develops at its junctions with the pads, which is in good agreement with the experimental observations shown in Figs. 4 and 5b.
The obtained value of the initial stress that provided an optimum fit between the simulation and experimental measurements was $ 0.21 \pm 0.05 $ GPa, which is close to the value estimated using the previous method. The average stress for all the studied NWs was $ 0.21 \pm 0.05 $ GPa, again within the values obtained in the intentional localised laser heating section. Furthermore, according to the simulations, the initial stress in the NW could be obtained by scaling the measured stress after the substrate removal by a factor of $ 1.33 $ (i.e. upon relaxation, the initial stress in the NW was reduced by 25%). This was a result of the linear relationship between the initial and measured stress values, as expected from the linear elastic model.
In summary, it is worth mentioning that the first method is relatively straightforward in terms of measurements and sample preparation and maintains the nondestructive capabilities of Raman spectroscopy. These characteristics render it suitable for implementation in production lines. Its main drawback is the requirement for a more complex analysis such as the one developed in this study. This methodology may be insufficient in situations in which Si NWs are inaccessible, for example, after the deposition of certain layers that prevent optical illumination, such as metals for electrostatic gating. In addition, notably, the deposition of transparent layers such as oxides does not limit their applicability. However, the second method is much more technically demanding owing to the technical challenges associated with removing the Si substrate without damaging the NW. In this study, the second method was intended to benchmark the validity and robustness of the first method, with its main advantage of being a more straightforward analysis. Although it can be applied to assess certain production steps, it is not intended as a systematic characterisation technique owing to its manufacturing complexity. Finally, the combination of the two approaches allowed us to assess the robustness of the full stress analysis and guarantee the reliability of the proposed model, measurement methodology, and etching process.
Intentional localised laser heating
Characterisation of free-standing Si NWs
-
We present two methods for the characterisation of stress profiles on Si NWs that are applicable in the context of manufacturing semiconductor quantum devices.
In the first method, local heating is deliberately induced in the NW by using an incident laser beam to modify its Raman spectrum. This enabled us to separate the NW and substrate peaks and extract the NW stress by decoupling it from thermal effects. We obtained stress values of $ 0.17 \pm 0.04 $ GPa and $ 0.34 \pm 0.04 $ GPa for the Si NWs. The data show no dependence on the applied laser power, indicating the robustness of the method and the intrinsic nature of the obtained stress.
In the second method, we propose an alternative route to directly access information from the Si NW, which involves removing the SiO2 and Si substrate beneath the NW. By comparing the experimentally obtained stress profiles with the FEM simulations, we were able to extract the initial stress of the NWs for which we obtained a value of $ 0.21 \pm 0.05 $ GPa. Both methods yielded comparable stress values, validating the reliability of the entire method and demonstrating that the fabrication process induced acceptable levels of stress in the NWs. Furthermore, the measured stress values correspond to minor elastic strains (0.1%–0.2%) that would lift the HH/LH degeneracy and reduce band mixing. These modifications could favour hole-qubit operation while remaining well below the mechanical damage thresholds.
Thus, this work establishes a methodology for nanoscale stress characterisation, even under unfavourable conditions where the separation of stress and temperature contributions is not trivial, or the presence of a substrate prevents clean measurement. These results confirm the suitability of the etching process and establish a reliable platform for the robust noninvasive characterisation of Si-NW-based qubits.
-
The fabrication process of the Si NWs, illustrated in Fig. 6, involved four lithographic steps (denoted as L1–L4). Starting from a silicon-on-insulator (SOI) wafer (Fig. 6a), a 50 nm layer of silicon nitride (Si3N4) was deposited via low-pressure chemical vapor deposition (LPCVD), as shown in Fig. 6b. The front-side Si3N4 was selectively removed, and alignment marks were defined using optical lithography (L1), followed by deep reactive ion etching (DRIE) to etch 50 nm of silicon and 200 nm of the buried oxide (Fig. 6c). The top-layer structures were patterned using AR-N 7520.07, which is a negative-tone mixed-and-match resist from Allresist. This resist enables mix-and-match patterning: large features such as contact pads and tracks are defined by optical lithography (L2) as indicated in Fig. 6d, while high-resolution SiNWs are exposed using electron beam lithography (L3) on a Raith 150 system (30 keV, ~40 pA, 120 μC/cm2) showed on Fig. 6e. Both exposures were performed on the same resist layer without intermediate development. After development and hard baking (1 min at 80 °C), the resist served as an etch mask for the pattern transfer into the top silicon layer using reactive ion etching (RIE) with SF6/C4F8/Ar chemistry. The resist was subsequently removed by oxygen plasma stripping (Fig. 6f).
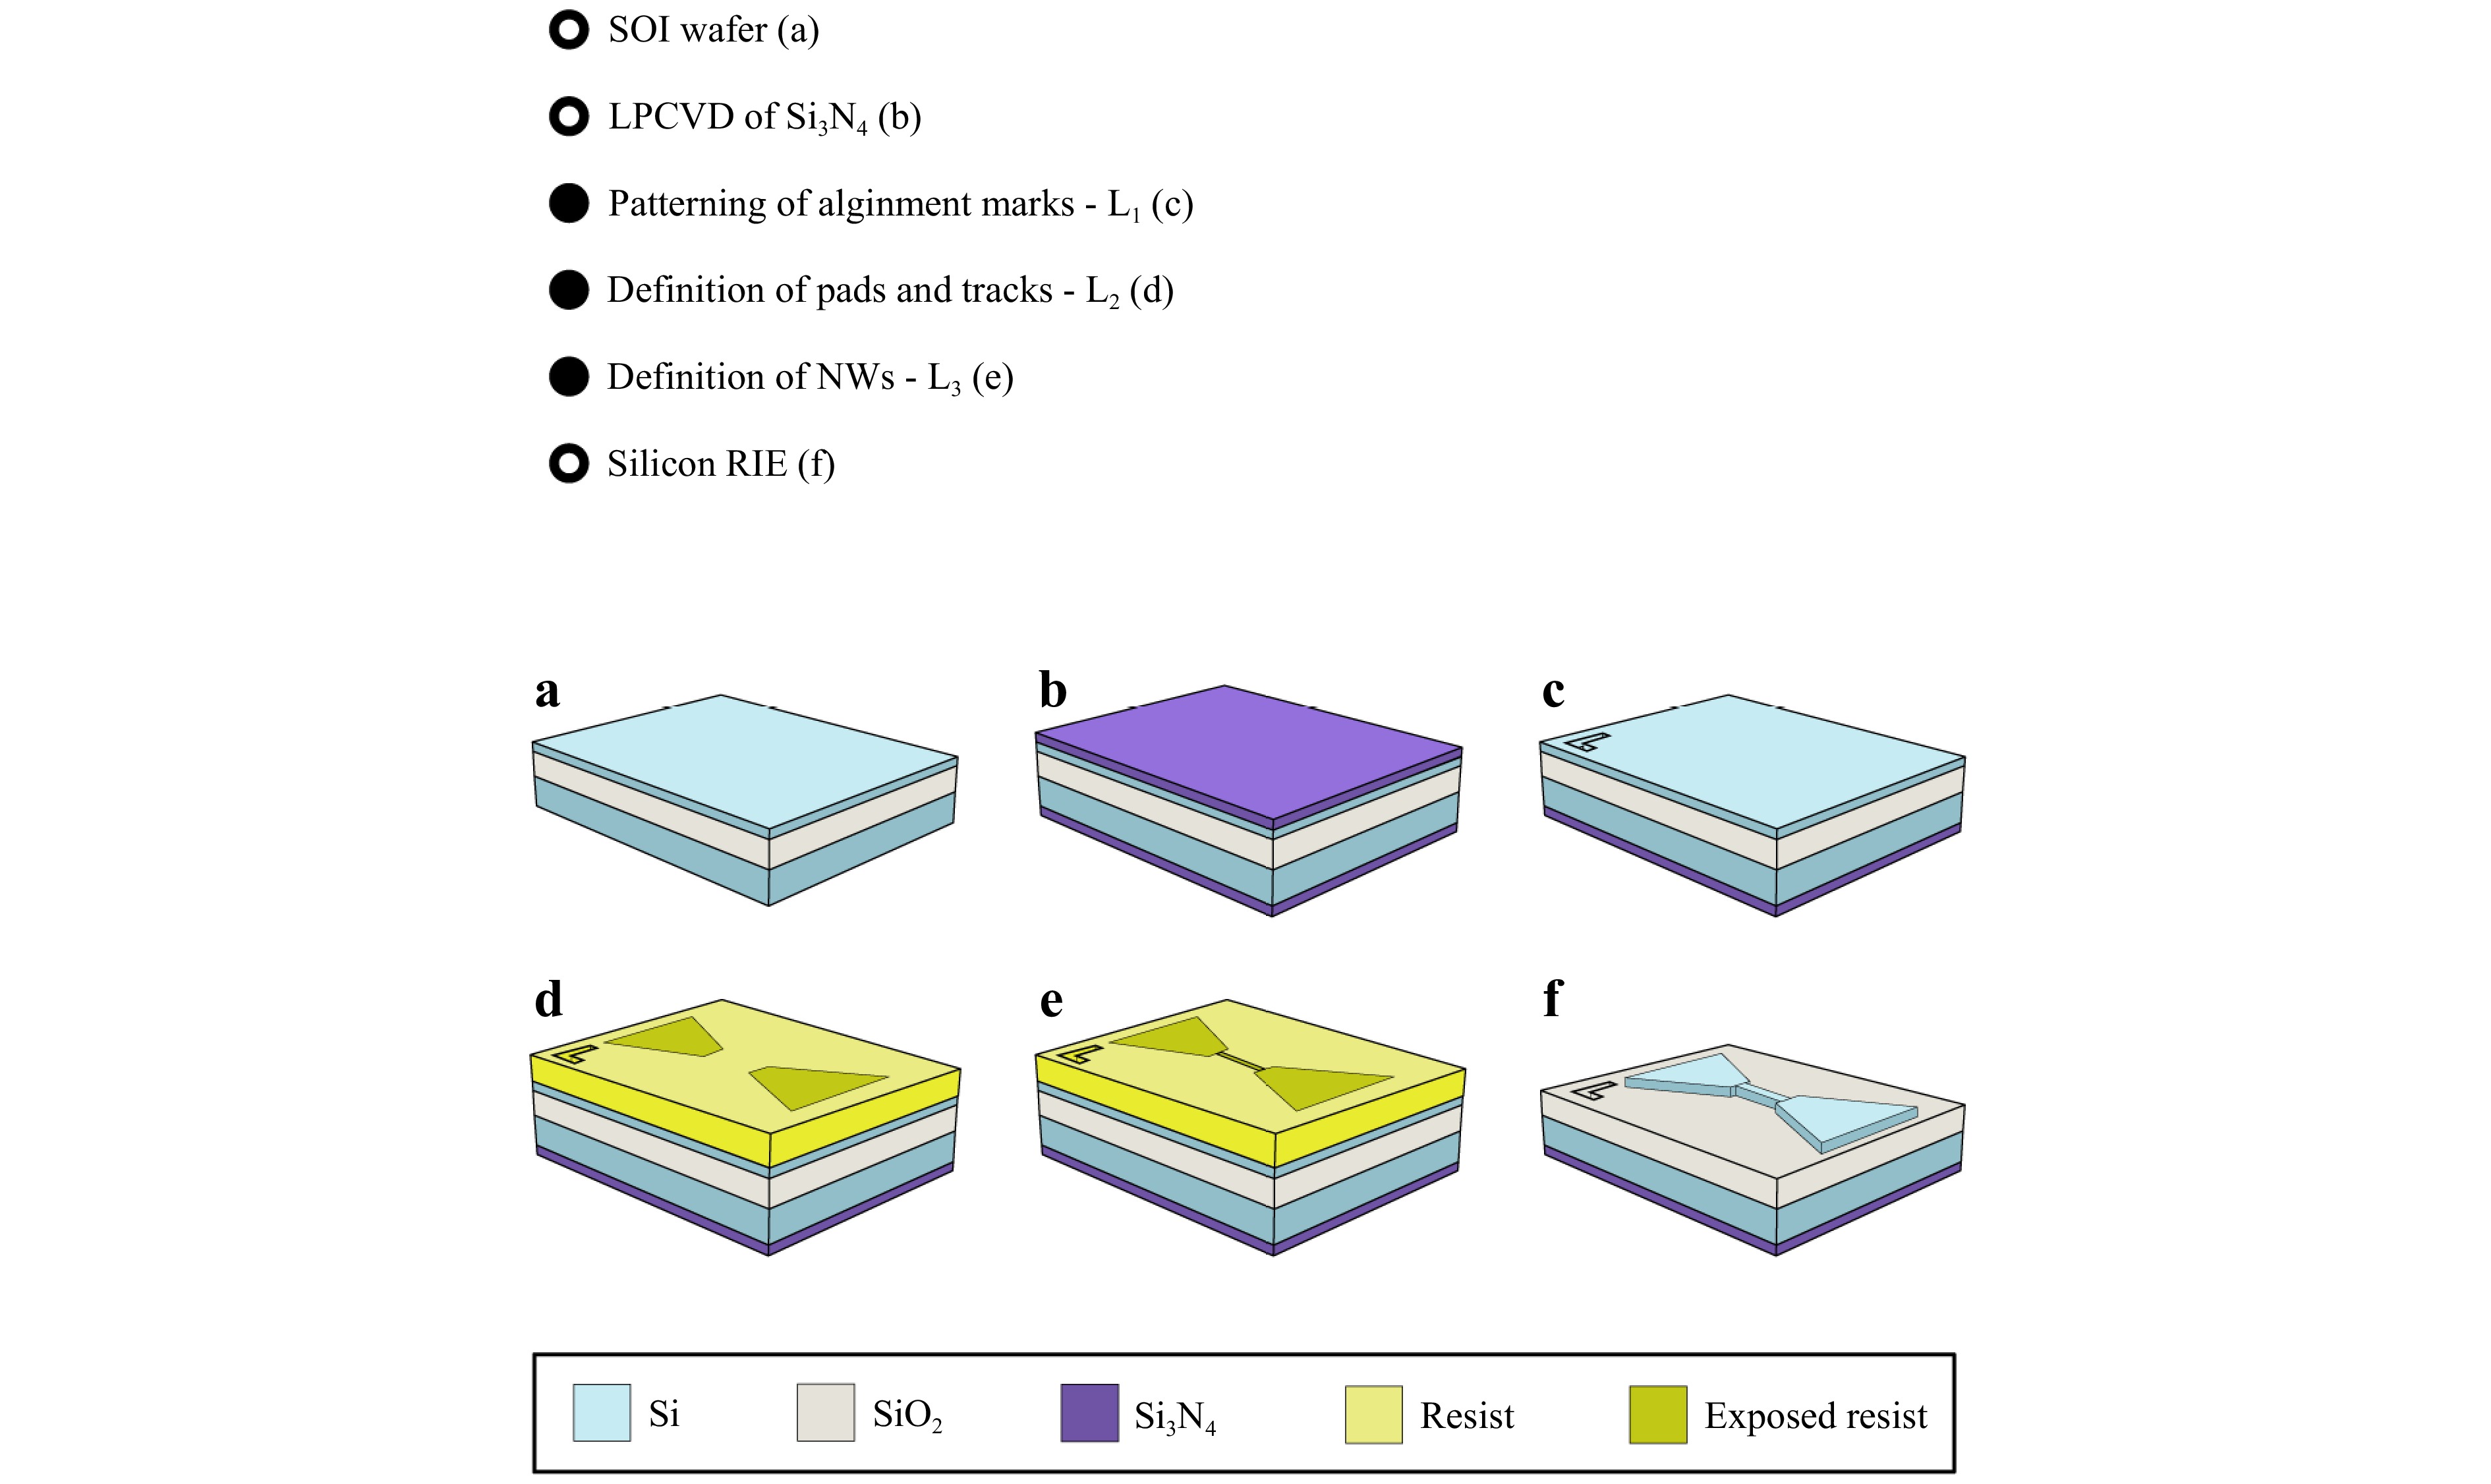
Fig. 6 Fabrication flow of SiNWs using three lithographic levels (L1–L3). a–c Front-side preparation: SOI wafer, LPCVD Si3N4 deposition, and alignment mark definition via optical lithography and DRIE. d–e Top-layer patterning with AR-N 7520.07 resist: large features defined by optical lithography (L2), and SiNWs by electron beam lithography (L3) on the same resist layer. f Pattern transfer by RIE and resist removal via oxygen plasma.
-
For membrane definition and the subsequent release of the NW through SiO2 wet etching, a fourth lithography step (L4) was performed on the wafer’s backside, aligned to the front-side marks, as shown in the Supplementary Data (Fig. S2). An opening was etched on the backside of the Si3N4 layer (50 nm) by RIE, followed by resist removal using O2 plasma. The remaining Si3N4 layer was used as a mask to completely wet-etch the bulk of the Si wafer (HF 5% dip to remove the native silicon dioxide + KOH 40%) until the BOX layer was reached. Finally, the wafer was immersed in diluted HF, with the front side physically protected to locally remove the SiO2 membrane and release the NWs, as shown in Fig. 1c and 1d.
-
Measurements were conducted using a HORIBA Soleil Raman Spectrometer. A laser with a wavelength of 532 nm was used. The emitted laser light is linearly polarised. A typical Raman setup includes a microscope, a filter to eliminate Rayleigh radiation, and a spectrometer coupled with a CCD. A 100X objective with a numerical aperture (NA) of 0.9 was employed to focus the laser light on the sample while simultaneously collecting its Raman emission. The laser light was focused on a circular illumination area of approximately 720 nm in accordance with the diffraction resolution limit $ \dfrac{1.22 \lambda}{NA} $. To control the depth from which the scattered light was collected and to achieve confocality in the Z-scan measurements, a pinhole of $ 10 \ \mu $m was employed. For the horizontal scans along the freestanding NWs, a $ 200 \ \mu $m pinhole was used to maximise the Raman signal. A grating of 2,400 lines/mm was used for all measurements.
The laser power applied for the intentional local heating of the Si NWs depends on the NW width and, therefore, varies across the samples. In this study, values between $ 0.84 $ and $ 1.42 $ mW were used, corresponding to power densities of $ 2.06 \times 10^5 $ and $ 3.49 \times 10^5 $ W/cm2. In the case of freestanding NWs, the laser power was minimised to avoid heating effects while still providing an adequate signal-to-noise ratio. Accordingly, a power of $ 0.054 $ mW was used, which corresponds to a power density of $ I = 1.33 \times 10^4 $ W/cm2.
The acquisition time for the spectra varied depending on the type of measurement and other parameters involved. However, before fitting the Lorentzian profile to the experimental spectra, the intensity values were normalised to 1 s acquisition time. The acquisition time ranged from $ 2 $ s for the freestanding Si NWs to $ 10 $ s for the unprocessed Si NWs. To externally control the temperature of the samples, we used a Linkam THMS600 System.
Sample fabrication process
Free-standing Si NWs
Experimental setup
-
The authors acknowledge the financial support from grants PID2021-126046OB-C21, PID2021-126046OB-C22, and PID2024-157972OA-C22 funded by MICIU/AEI/10.13039/501100011033 and by “ERDF/EU”, and grant TED2021-130786B-I00 funded also by NextGenerationEU/PRTR. GGG acknowledges the financial support of FSE+ and Junta de Castilla y León through a pre-doctoral fellowship. This study was supported by funding from the Spanish government through the "María de Maeztu Unit of Excellence" Accreditation, CEX2023-001397-M. JLS acknowledges the support from grant RYC2023-043765-I, funded by MCIN/AEI/10.13039/501100011033 and FSE+, and the Trigger project INSPECTOR. J. Antoja-Lleonart - staff hired under the Generation D initiative, promoted by Red.es, an organisation attached to the Ministry for Digital Transformation and the Civil Service, for the attraction and retention of talent through grants and training contracts, financed by the Recovery, Transformation, and Resilience Plan through the European Union's Next Generation funds. The authors gratefully acknowledge Irene Mediavilla for assistance with data acquisition and curation.

 DownLoad: