HTML
-
Additive manufacturing (AM), also called 3D printing, is considered a promising method for producing sophisticated components in polymers, ceramics, and metals, which are necessary for medical and biological applications1−3. Ti-based alloys have been used as implant materials in the human body instead of steel owing to their high strength/weight ratio, high corrosion resistance, and biocompatibility4, 5. Numerous studies have recently been conducted in the field of additive manufactured Ti-based alloys for materials development, including on commercial pure Ti6, Ti-Al7, 8, Ti-Nb9, Ti-Mo10, 11, Ti-Ta12, and Ti-Zr13. To satisfy the high accuracy requirement, laser AM techniques, which mainly include powder bed-based selective laser melting (SLM) and powder co-axial feeding-based directed energy deposition (DED), have significant advantages in terms of bio-component production. For instance, Li et al.14 and Fu et al.15 focused on the appropriate Ti-based alloys for laser AM with high strength and low modulus. They reported that dual-phase α/β Ti alloys, which combine high strength/plasticity and low modulus, are regarded as the most important microstructural design principle.
With respect to the manufacturing procedure of laser AM techniques, the powder feedstock is rapidly heated and then melted using a laser beam, which solidifies at ultra-high speed along its diversion. Therefore, metastable phases such as martensitic α’, β’, α’’, and ω, continuously appear in AMed Ti-based components16–19, which results in a low microstructural stability and a limited lifetime. For instance, Shipley et al.20 reviewed SLMed Ti6Al4V and concluded that that it has multiple potential applications in a solution for achieving a non-martensitic microstructure, undesired porosity, and residual stress. By contrast, as a type of layer-by-layer manufacturing process, the component prepared using a laser AM presents an anisotropic or graded structure, owing to the effect of the subtraction and repetition of the laser beam scanning over the surface and heat accumulation/cycling21, 22. For example, the texture of the lath and needle α phase induces a large difference in the tensile properties in the horizontal and vertical directions23. Kang et al. and Ren et al.17, 24 investigated the β-grain columnar equiaxed transition (CET) of Ti6Al4V and Ti-Mo alloys prepared using DED and indicated that a graded structure appears from the bottom to the top region as a result of the solidification rate and variances in the temperature gradient. In addition, the equiaxed β-grains cause a high plasticity and high strength as a result of the two stated structures, which consist of lath and equiaxed α phases. In conventional methods, these were obtained through heat processing at the α+β region or a cold deformation with annealing recrystallisation.
Although the DED process has been considered an important technology for producing complex Ti-based bio-components, the as-fabricated sample always presents a non-uniform and non-equilibrium microstructure and mechanical properties. Thus, long-life applications are quite limited. In this study, a specially designed triple-cycling heat treatment was first employed to optimise the microstructure and mechanical homogeneity of DED processed Ti-Mo alloys. The microstructure of the alloy was investigated using scanning electron microscopy and electron backscatter diffraction and was quantified in terms of the grain morphology, texture, and possible phases in the microstructure. The hardness and compressive behaviour for bio-application were also determined at the end of this study.
-
Fig. 1 shows the microstructure of the DED-processed Ti-Mo sample at the top, middle, and bottom positions under the as-fabricated and heat-treated conditions. It can be seen that the DED-processed sample possesses a mostly dense structure without a clear porosity and cracks. Fig. 1a, c shows that a needle-like martensitic α-Ti appears in the as-fabricated sample, owing to the high cooling rate of the DED system25 at approximately 103–105 K s–1. In addition, martensite α’ has an extremely small size without any preferred orientation. Fig. 1e shows that the bottom region presents a different microstructure with few α phases, which will be further determined using EBSD in the next section. Thus, it can be concluded that the as-fabricated Ti-Mo sample presents an inhomogeneous gradient structure from top to bottom (Fig. 1a, c, e). After the triple cycling heat treatment, the entire sample presents a mostly homogenous microstructural feature, which consists of a matrix phase (β-phase) and a short rod-like or equiaxed α phase. This spheroidization behaviour is attributed to the growth of the α phase during the cycling heat treatment. In addition, there still exists a slight difference between the top and bottom regions. For instance, the width of the α phase increases from 3–4 μm at the top to 5–8 μm at the bottom. It is worth noting that the rod-like α phase at the bottom presents an orientated growth, which is different from the top and middle with a random distribution shown in Fig. 1b, d.
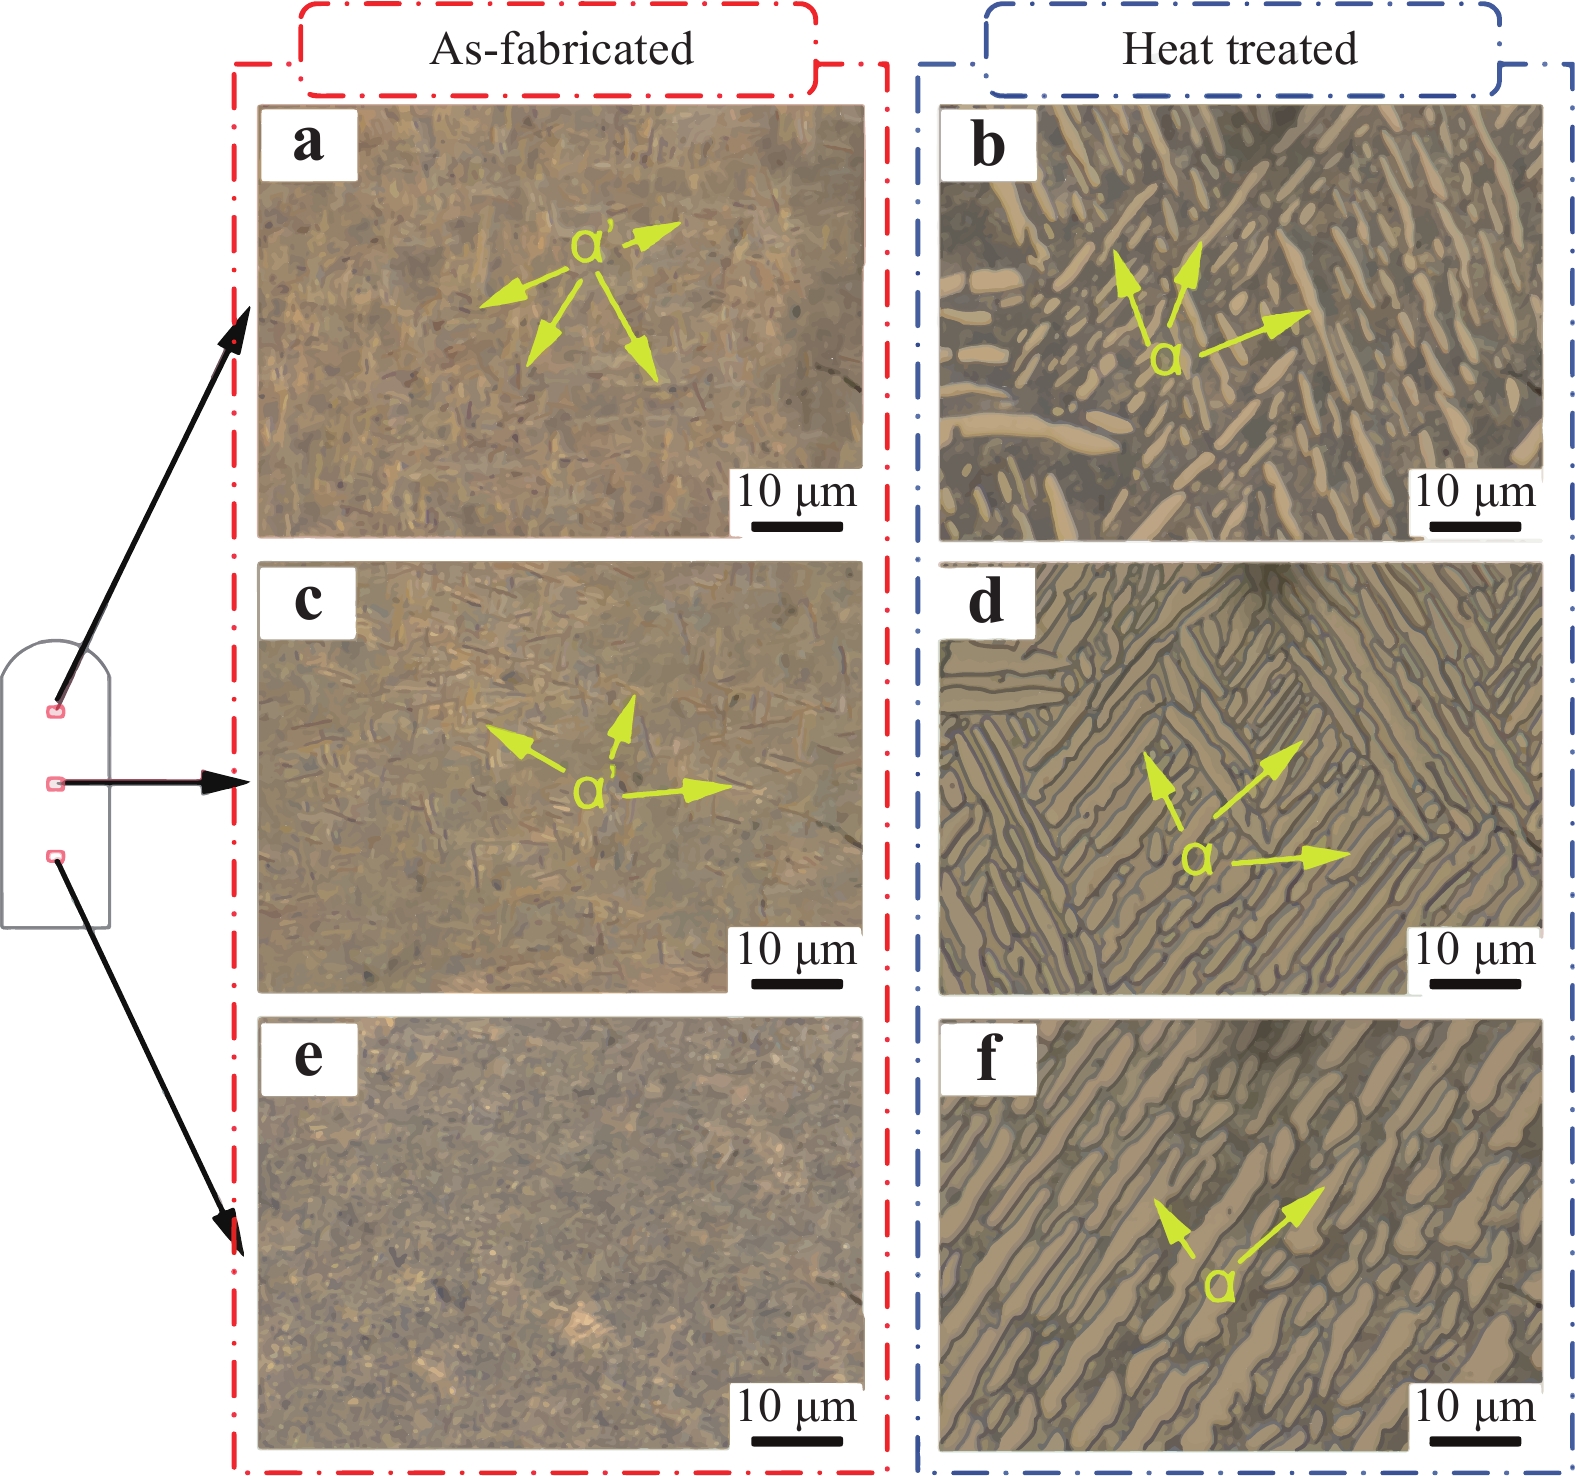
Fig. 1 Microstructure of DED processed Ti-Mo sample at top, middle, and bottom positions: (a, c and e) as-fabricated and (b, d and f) heat-treated conditions. (α, hcp-Ti; α’, martensitic hcp-Ti).
The XRD patterns of the DED-processed Ti-Mo sample in the as-fabricated and heat-treated conditions from altitudes of P1–P8 are presented in Fig. 2a, b. For both conditions, the DED-processed Ti-Mo specimens possess mixed phases of hcp-α and bcc-β without any non-melted Mo phase and oxidation, which is similar to the equilibrium phase diagram of Ti-Mo26. Interestingly, in the case of the as-fabricated sample, the relative intensity of the β-phase peaks increases significantly with a continuous improvement starting from P3. This result indicates a graded phase constitution from α dominant at the top to β dominant at the bottom. By contrast, the heat-treated sample presents a more homogenous phase distribution from the entire scale of the part, which is attributed to the non-equilibrium to equilibrium transition behaviour in rapidly solidified Ti-based alloys during heat treatment27, 28. However, owing to the limitation of using an X-ray diffraction in a quantitative analysis, an EBSD phase analysis is described in the next section as a supplement.
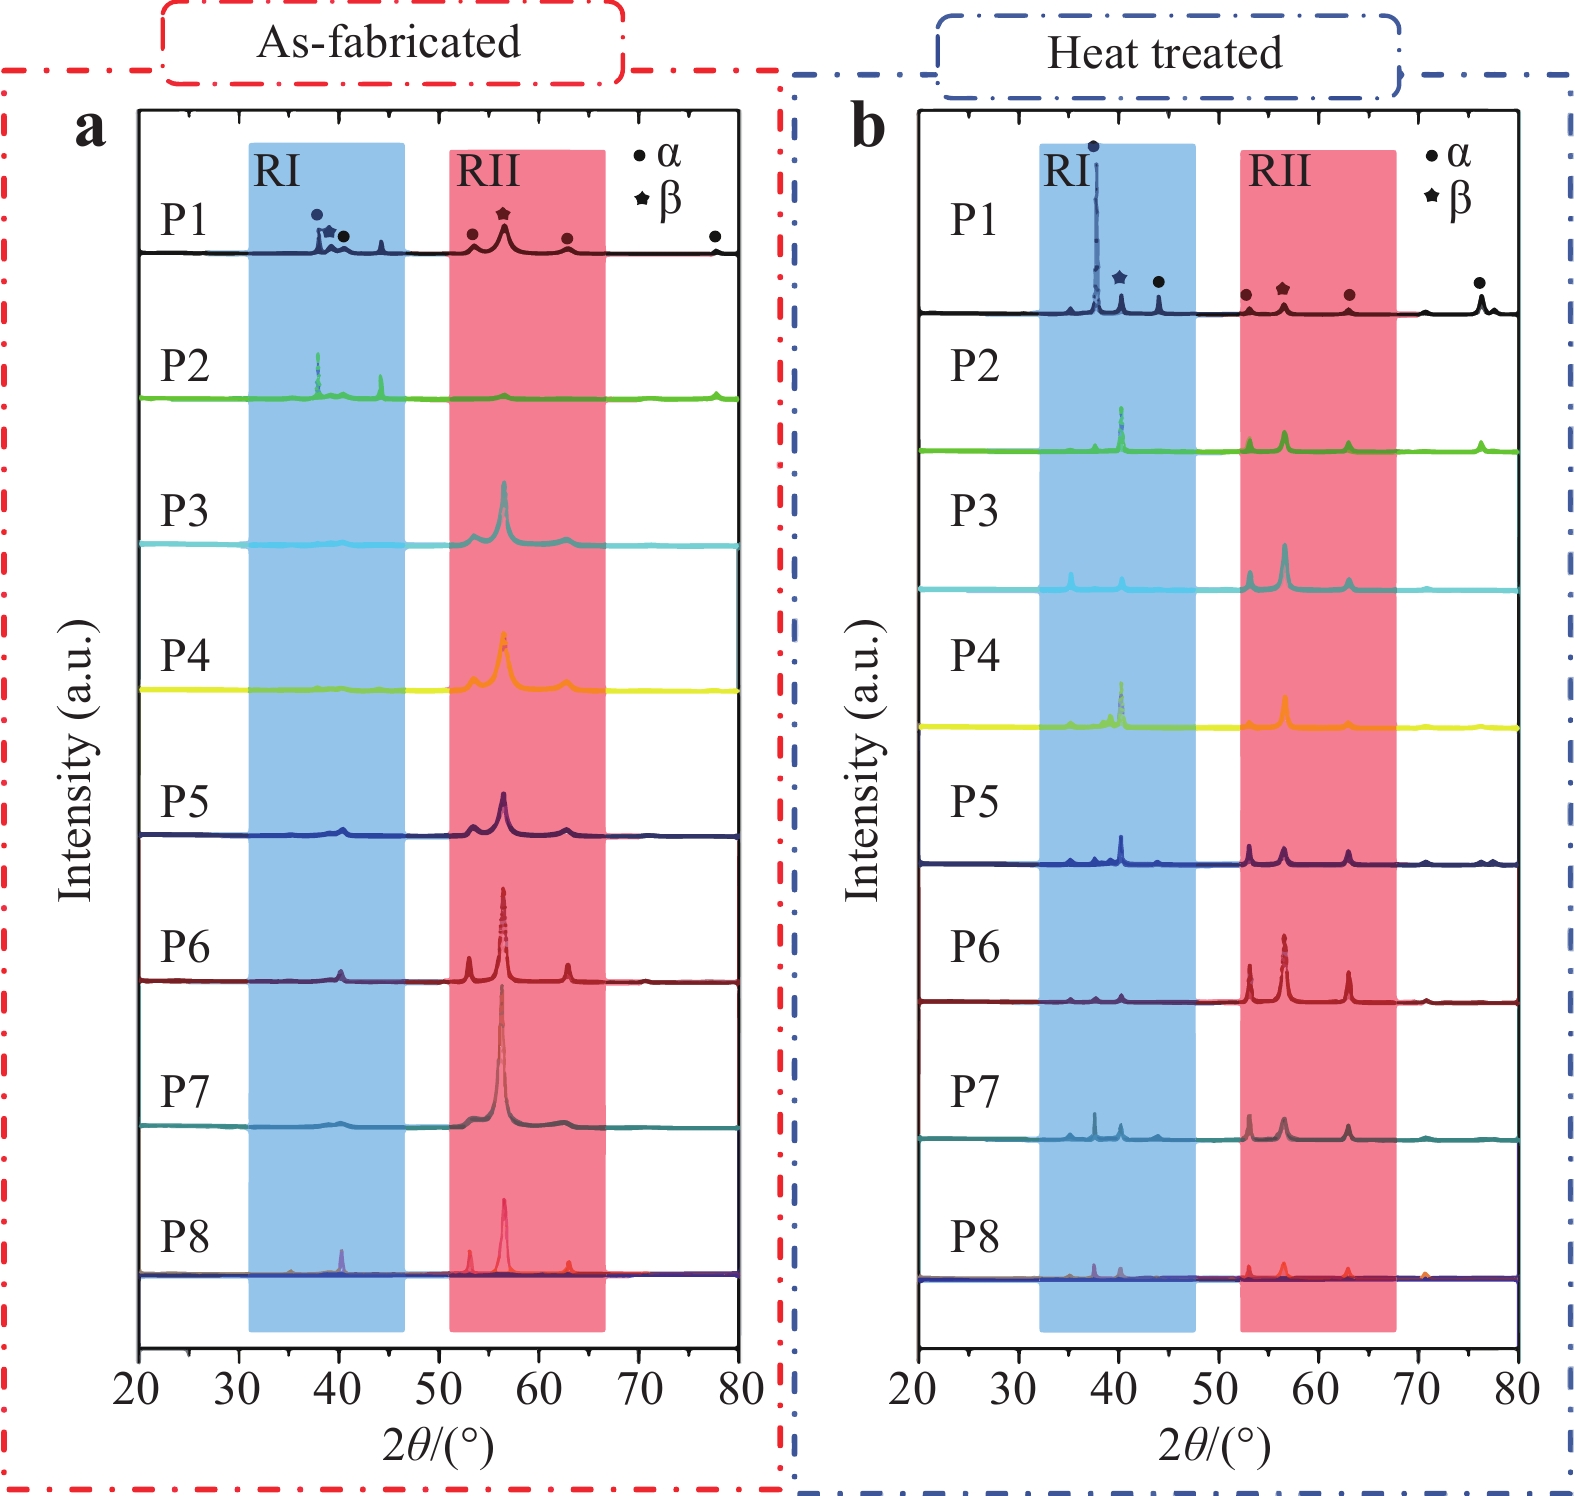
Fig. 2 XRD patterns of DED processed Ti-Mo sample in a as-fabricated and b heat-treated conditions from altitude positions 1–8. (RI, region I for α phase; RII, region II for β phase)
The distribution and morphology of α-hcp Ti and β-bcc Ti in the as-fabricated Ti-Mo sample, which were taken from the top, middle, and bottom regions, are shown in Fig. 3. As shown in Fig. 3a, d, the top region (P1) presents a high content of the α phase of approximately 95% in a submicron-sized morphology. In the middle region (P4), the α phase content decreased from 95% to 75% (see Fig. 3b, d). In the meantime, the α phase shows a large-sized lath-like morphology at the micrometre scale with the β phase located between them. As shown in Fig. 3c, d, bbc-β (70%) is the main phase in the bottom region instead of the α phase at the top. This phenomenon was attributed to two factors: (1) the effect of thermal cycling on the fully melted Mo particles in the Ti matrix during the DED process29 and (2) the high cooling rate during solidification of the bottom region, which leads to the α-β transition24. The effect of the Mo element, as an effective β phase stabiliser, was amplified under non-equilibrium conditions. Thus, the β phase content in the bottom region was much higher than that in the top region.
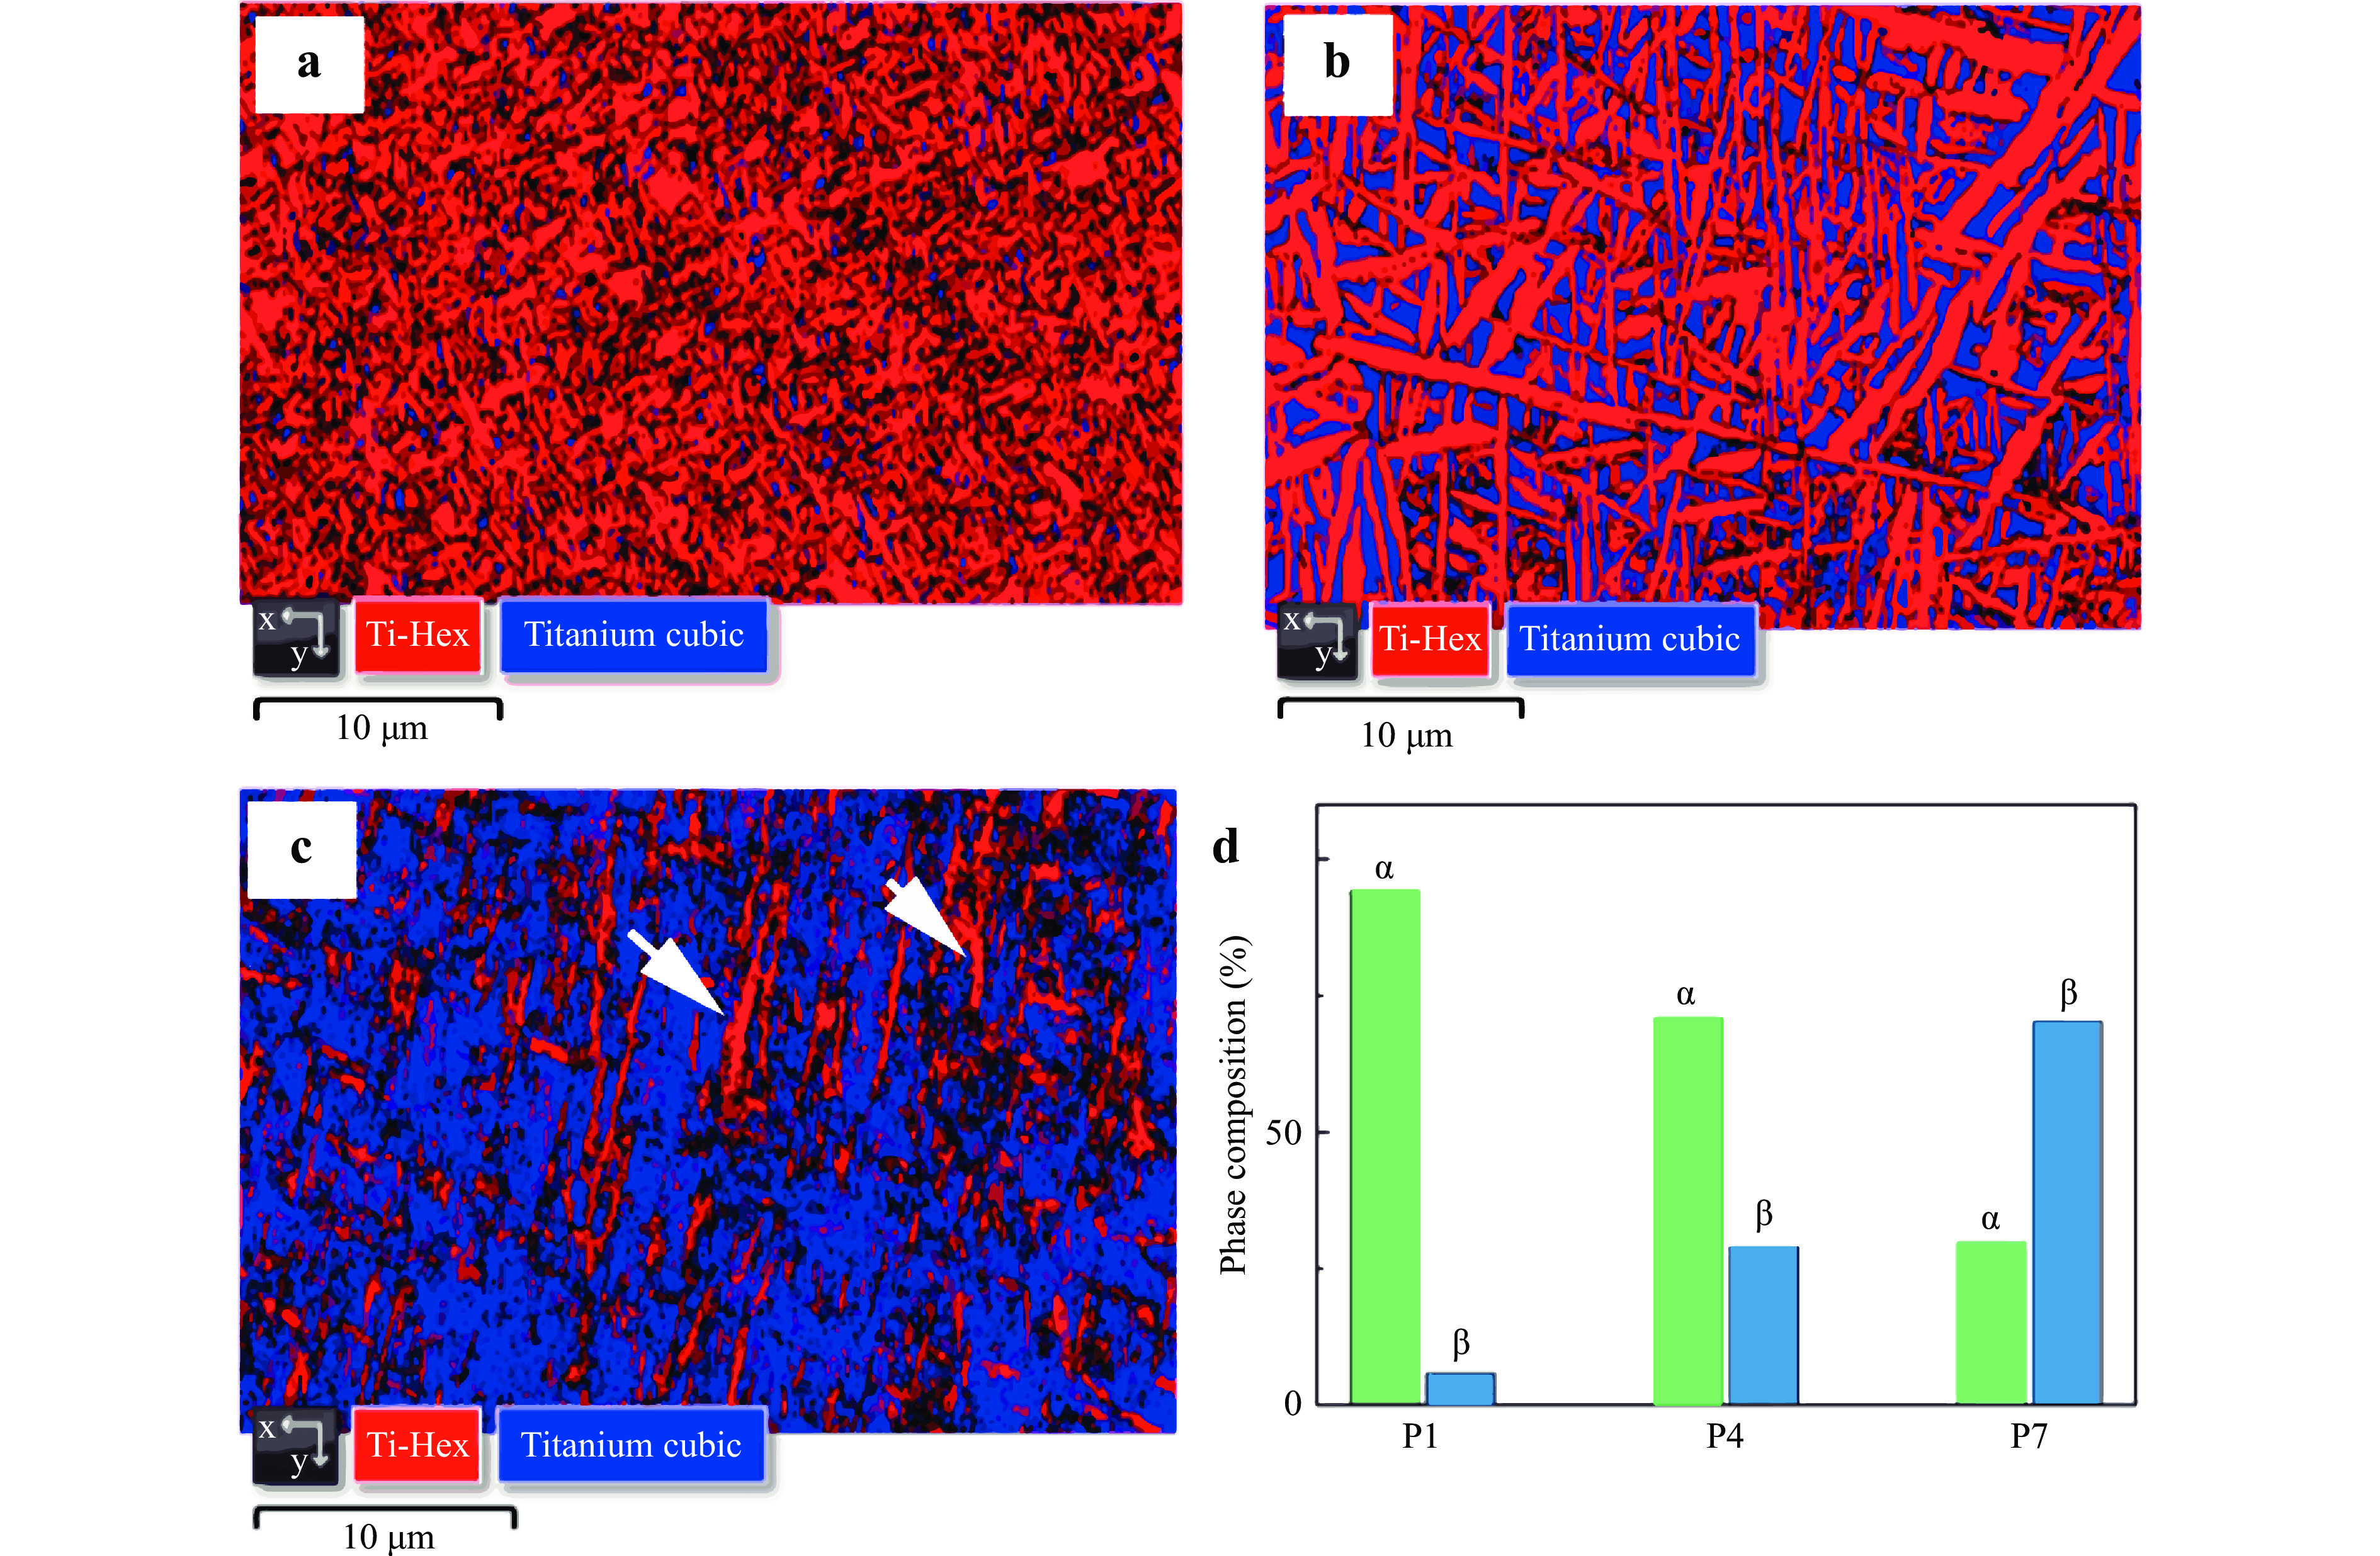
Fig. 3 Distribution and morphology of α-hcp Ti and β-bcc Ti in DED processed Ti-Mo sample.
a P1-top, b P4-middle, and c P7-bottom regions and d statistical data on the phase.Fig. 4 shows the dual phase (α+β) distributions and morphologies of the heat-treated DED-processed sample from the corresponding positions to the as-fabricated sample (see Fig. 3). Overall, compared with the as-fabricated sample, the heat-treated sample presents a relatively uniform phase constitution, distribution, and morphology at the top, middle, and bottom regions. As summarised in Fig. 4d, the phase constitution of the entire sample showed approximately hcp-α (90%) and bcc-β (10%) phases. Moreover, it can be seen from Fig. 4a–c that no lath-like α phases appear, but nearly equiaxed grains can be observed. It should be noted that a slight decrease in β appears at the bottom region (Fig. 4c), which also possesses a certain lath α phase. This phase transition can be explained using the equilibrium phase diagram26. During the designed triple cycling heat treatment, the solution treatment step possesses a high temperature of approximately 960 ℃, which is much higher than the β-α transition temperature of 800 ℃. With the long holding time and low cooling rate of furnace cooling, a metastable β phase with non-equilibrium is transferred into an α phase with equilibrium. In addition, the importance of Mo diffusion and segregation in the phase transition between α and β cannot be ignored. The results of our previous study17 on the as-DED-processed sample indicate that Mo micro-segregation was observed at the bottom region, which led to a high β phase content. After heat treatment, the phase constitution changed to a state of equilibrium in the phase diagram (Ti-7Mo)26, which is similar to the top region in the as-fabricated sample. Thus, it can be concluded that Mo diffusion appears in the bottom region to eliminate segregation after heat treatment.
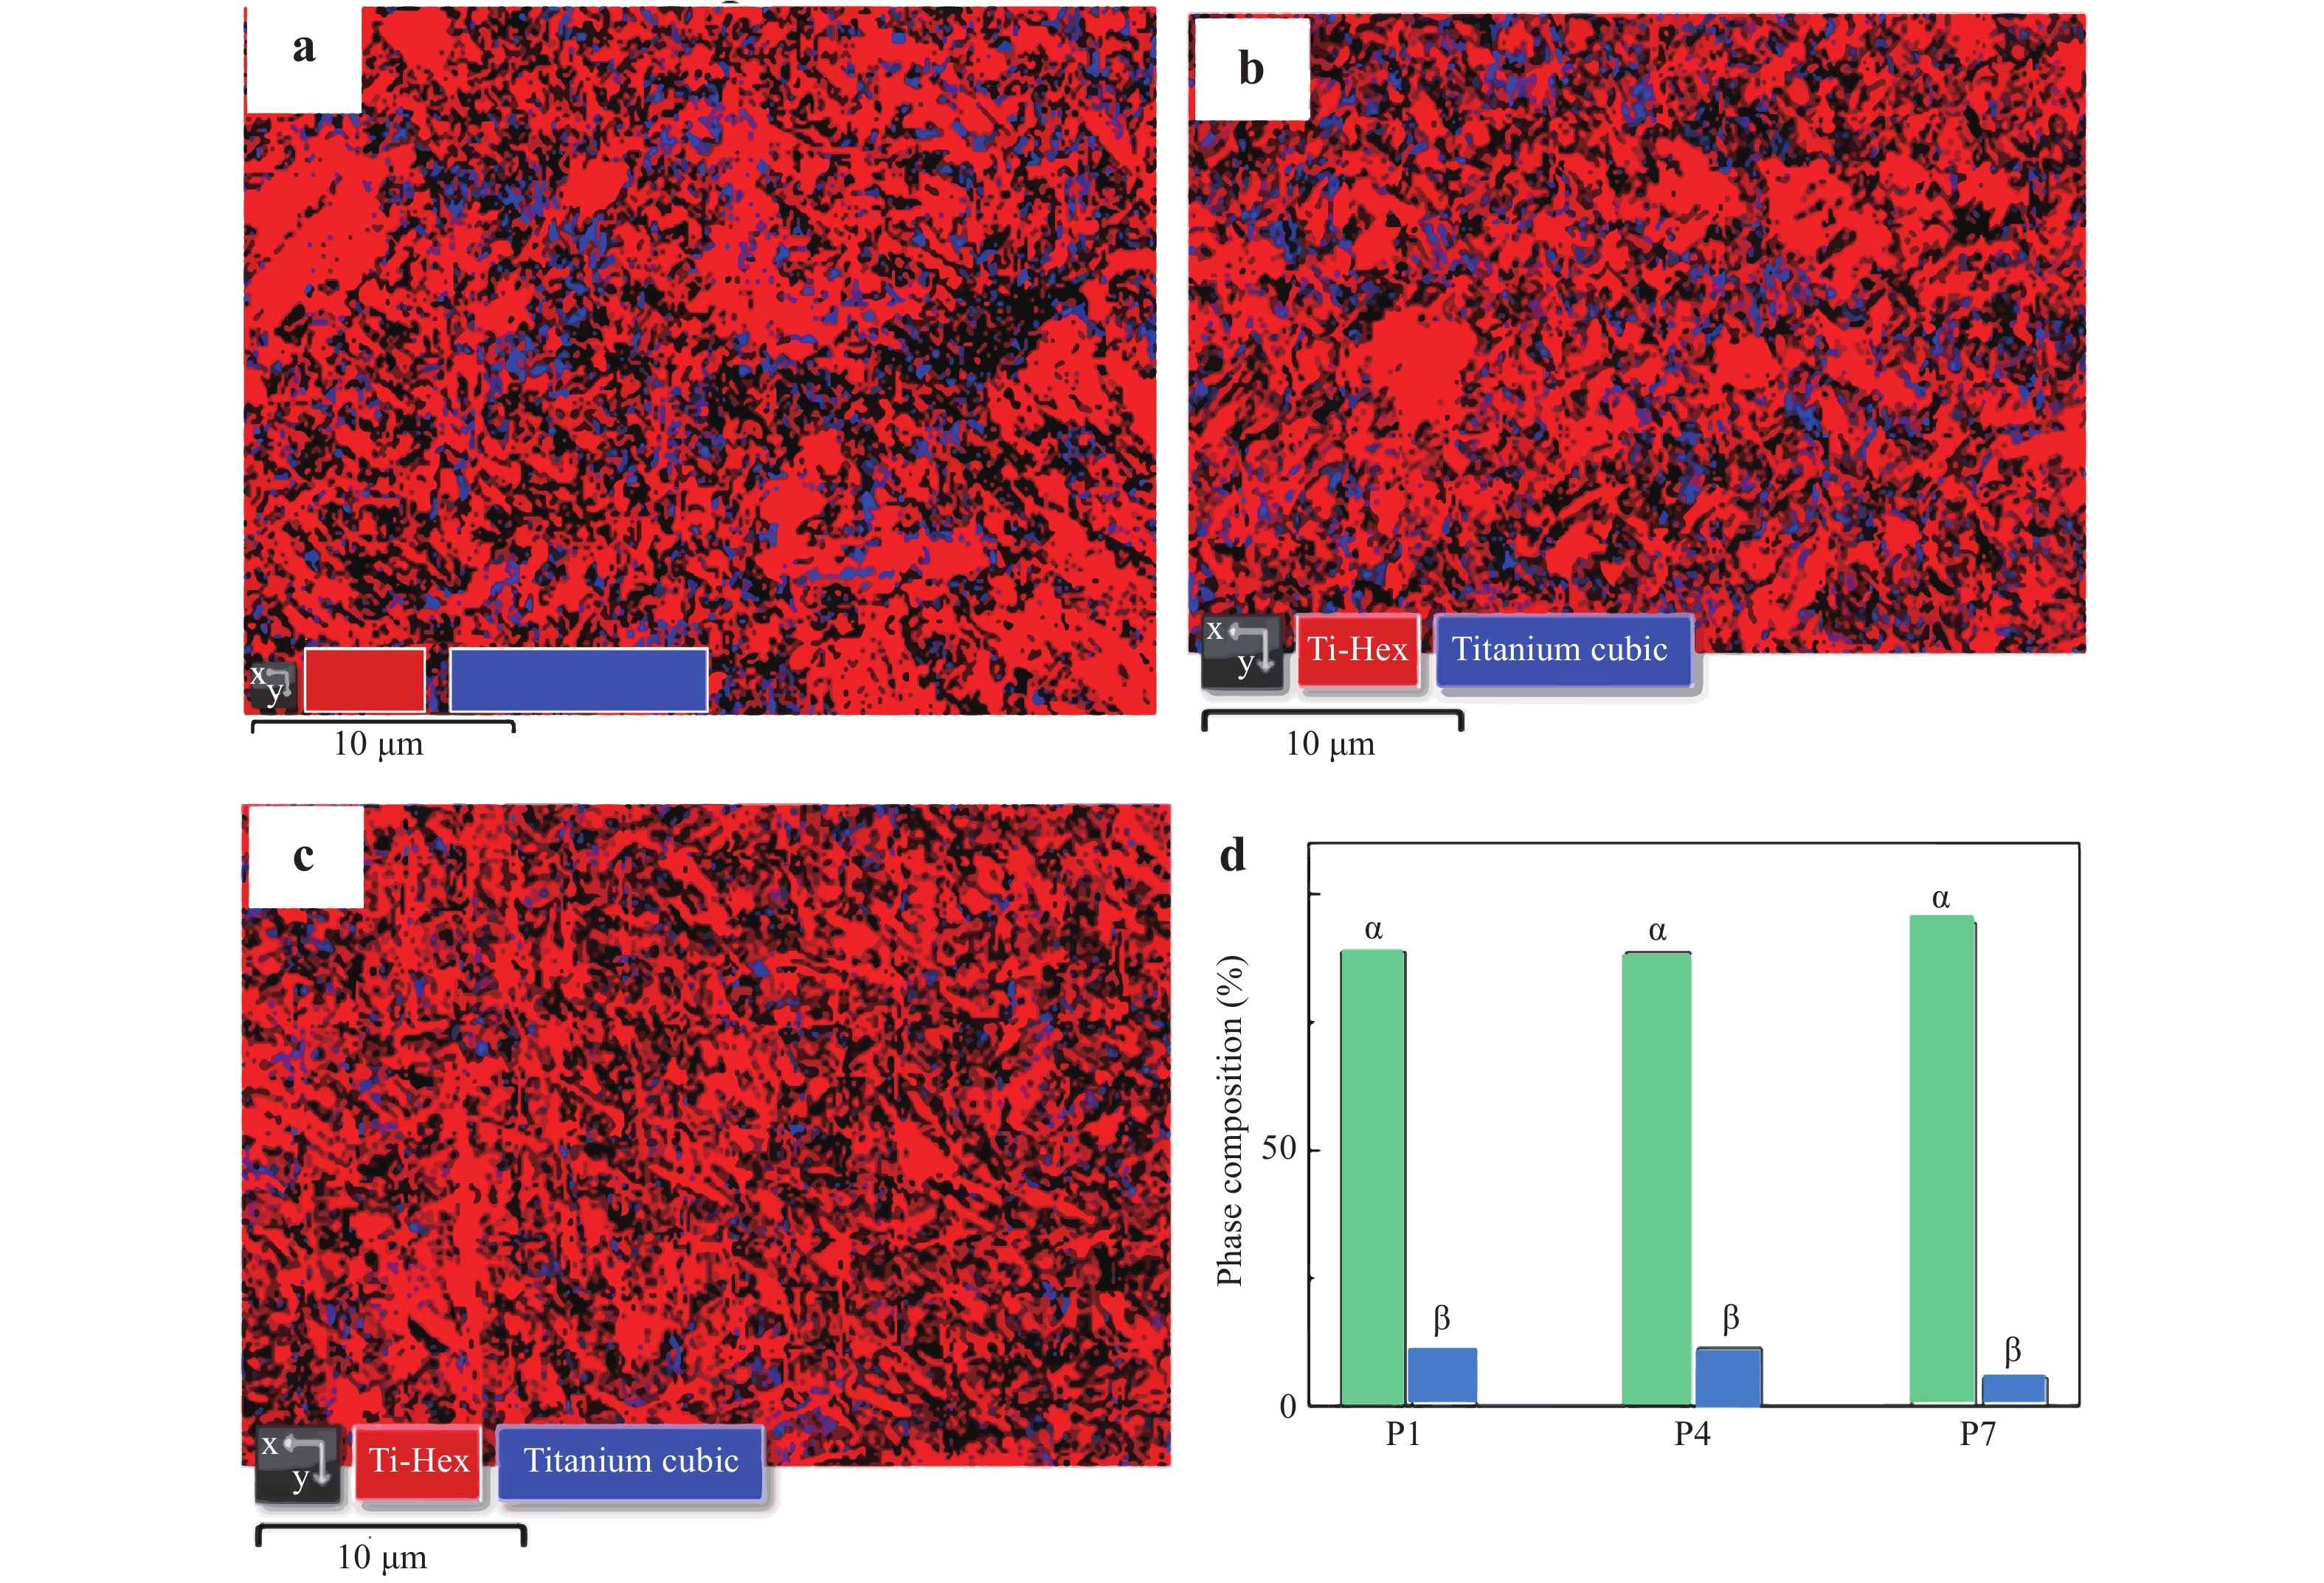
Fig. 4 Distribution and morphology of α-hcp Ti and β-bcc Ti in cycling heat treated DED processed Ti-Mo sample.
a P1-top, b P4-middle, and c P7-bottom regions and d statistical phase data.The texture analysis results of α and β Ti in the as-fabricated and heat-treated DED-processed Ti-Mo samples from the top to bottom regions are shown in Fig. 5 and 6. In the case of the as-fabricated condition, the top region presents a random orientation distribution with a grain size of approximately 5 μm and a width of 1–2 μm (see Fig. 5a). As the distance from the top surface increased, the α grain changed from a small-sized lath to large-sized acicular morphology (see Fig. 5b). The length of the α phase reaches 20 μm, which is attributed to the thermal cycling and thermal accumulation induced grain growth behaviour. Moreover, it can be seen that both the top and middle regions exhibit texture-less features. By contrast, both α and β present a clear texture in the bottom region, given the high thermal gradient near the substrate17. Owing to the Burgers orientation relationship in Ti-based alloys, where the close-packed plane of the α phase (0 0 0 1) is parallel to the (1 1 0) plane of the β phase, the highly textured primary β phase induces a high texture of the α phase. Specifically, from the point of example density, the α phase (0 0 0 1) plane at the bottom region exhibits a higher density of 51.64 than that of the top region (32.25)17.
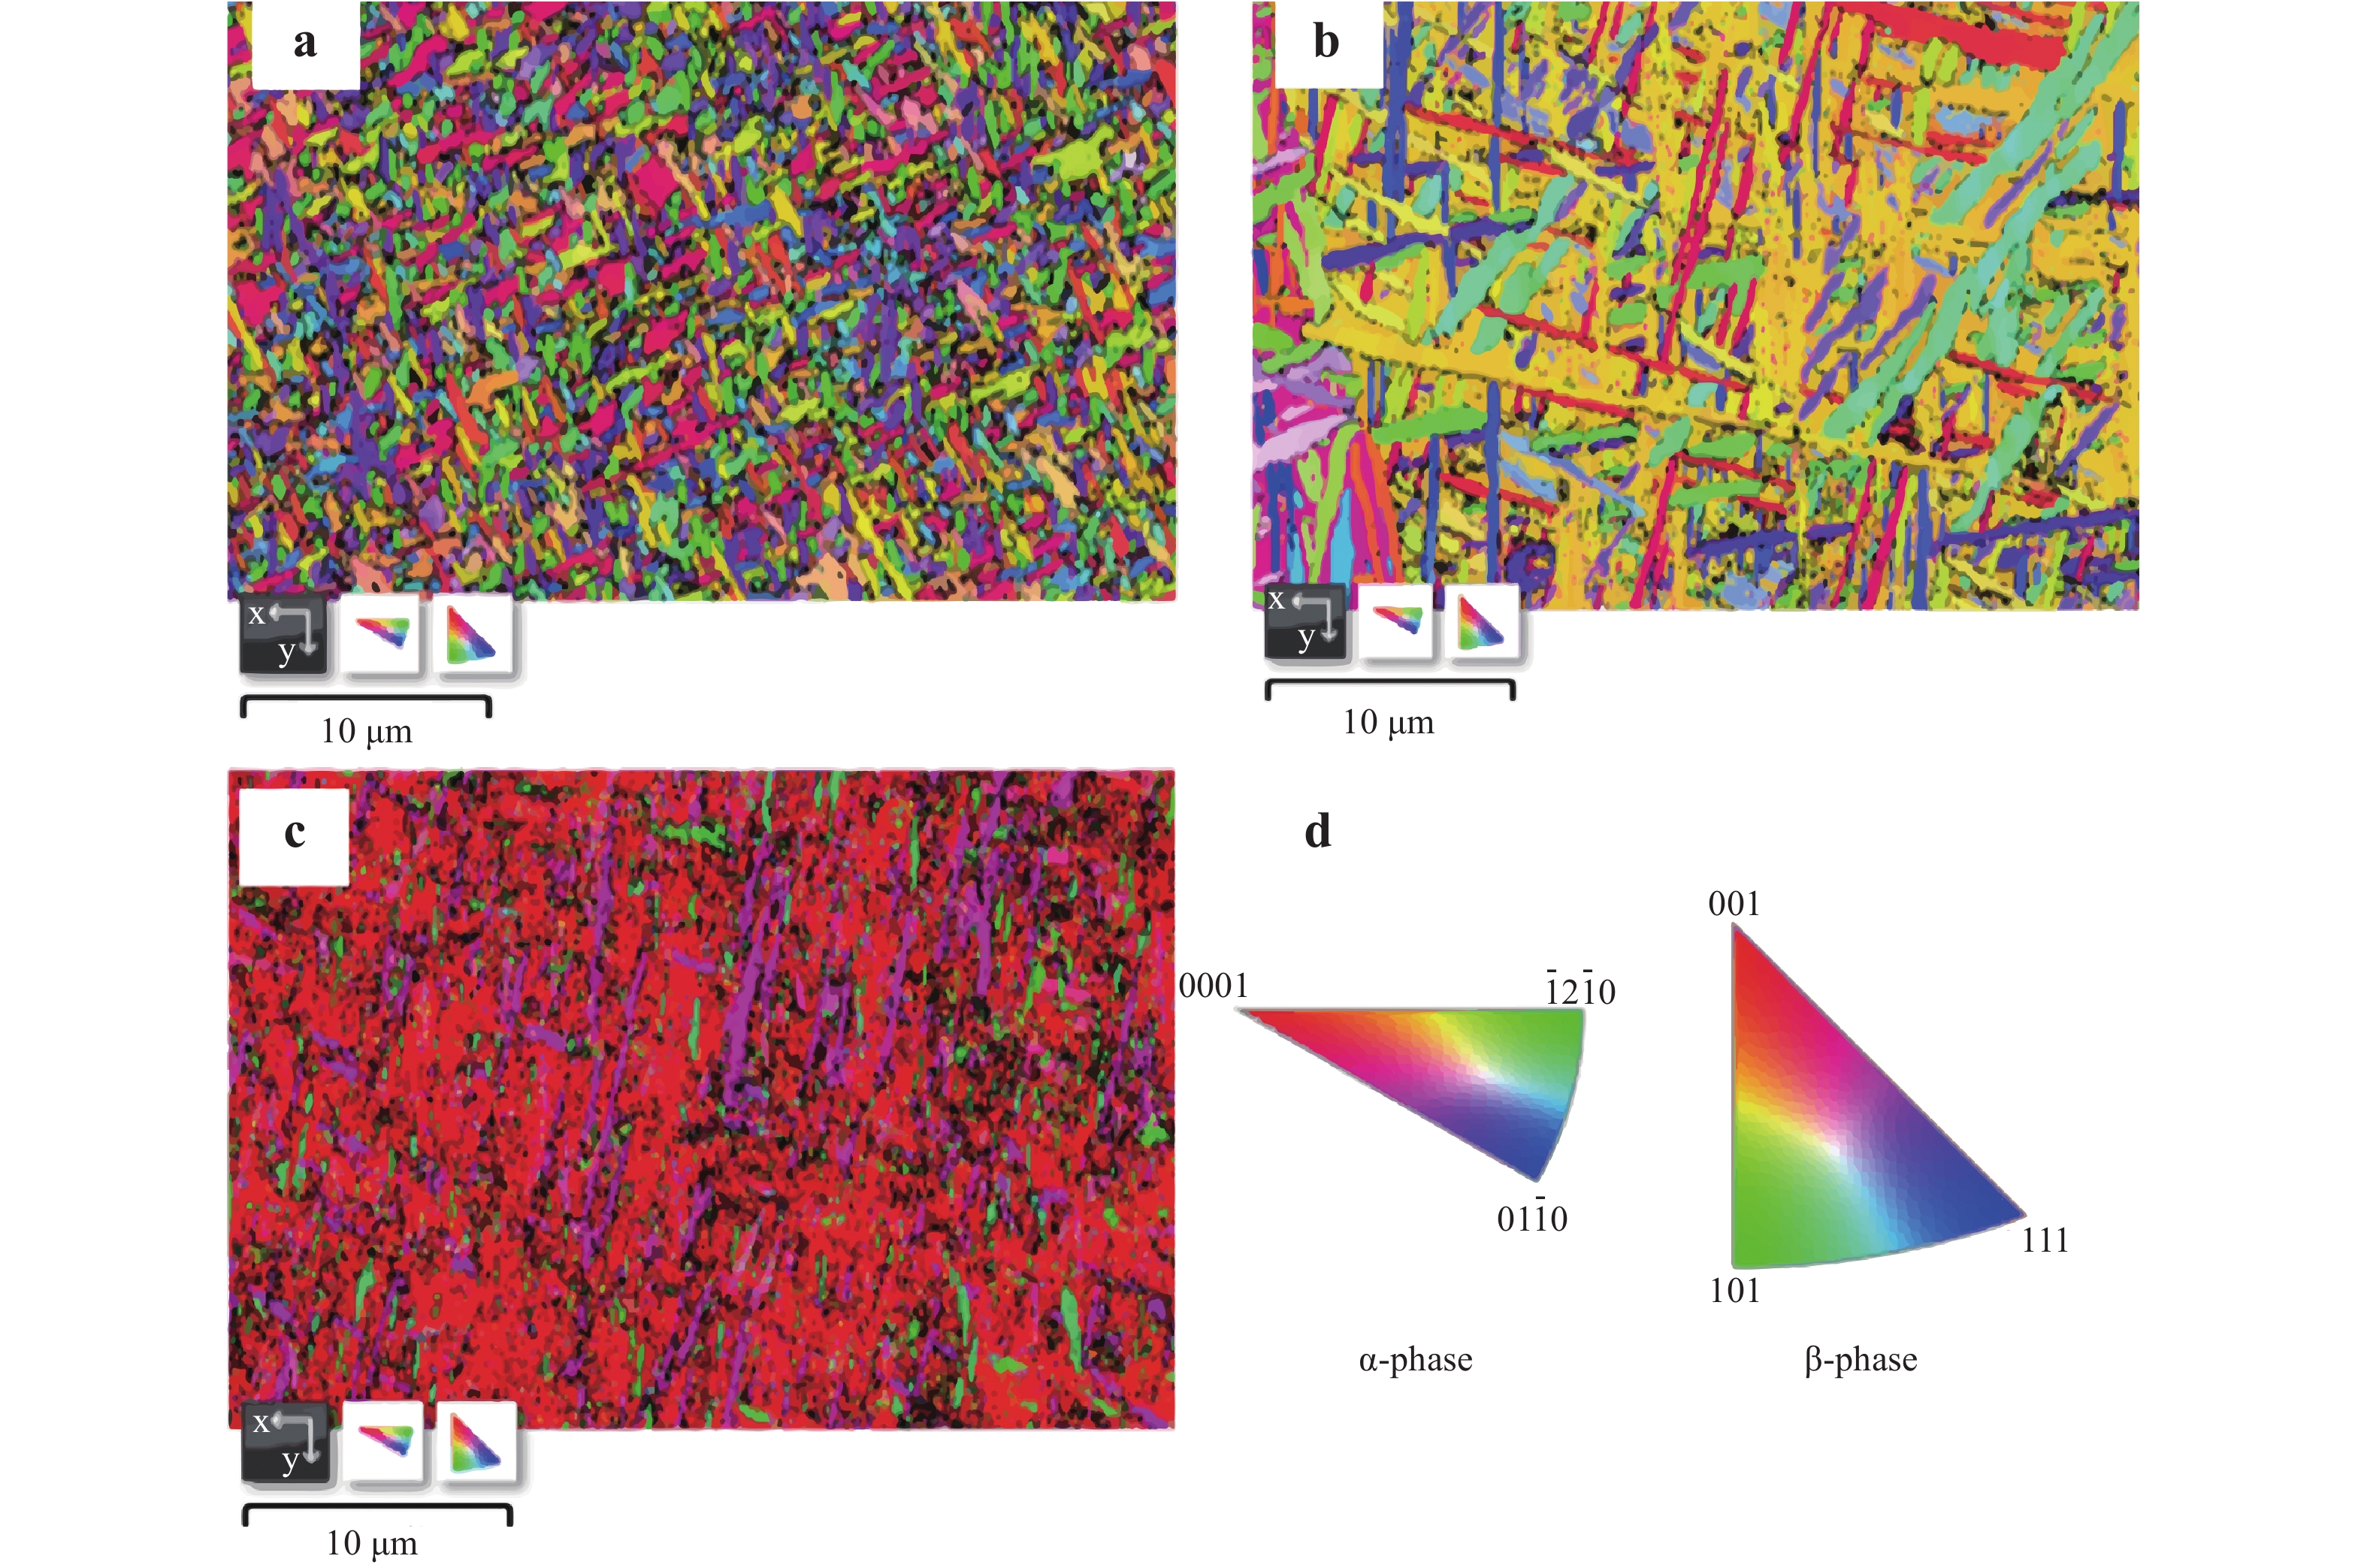
Fig. 5 EBSD orientation maps of α-hcp Ti and β-bcc Ti in DED processed Ti-Mo sample: a P1-top, b P4-middle, and c P7-bottom regions and d scale plate.
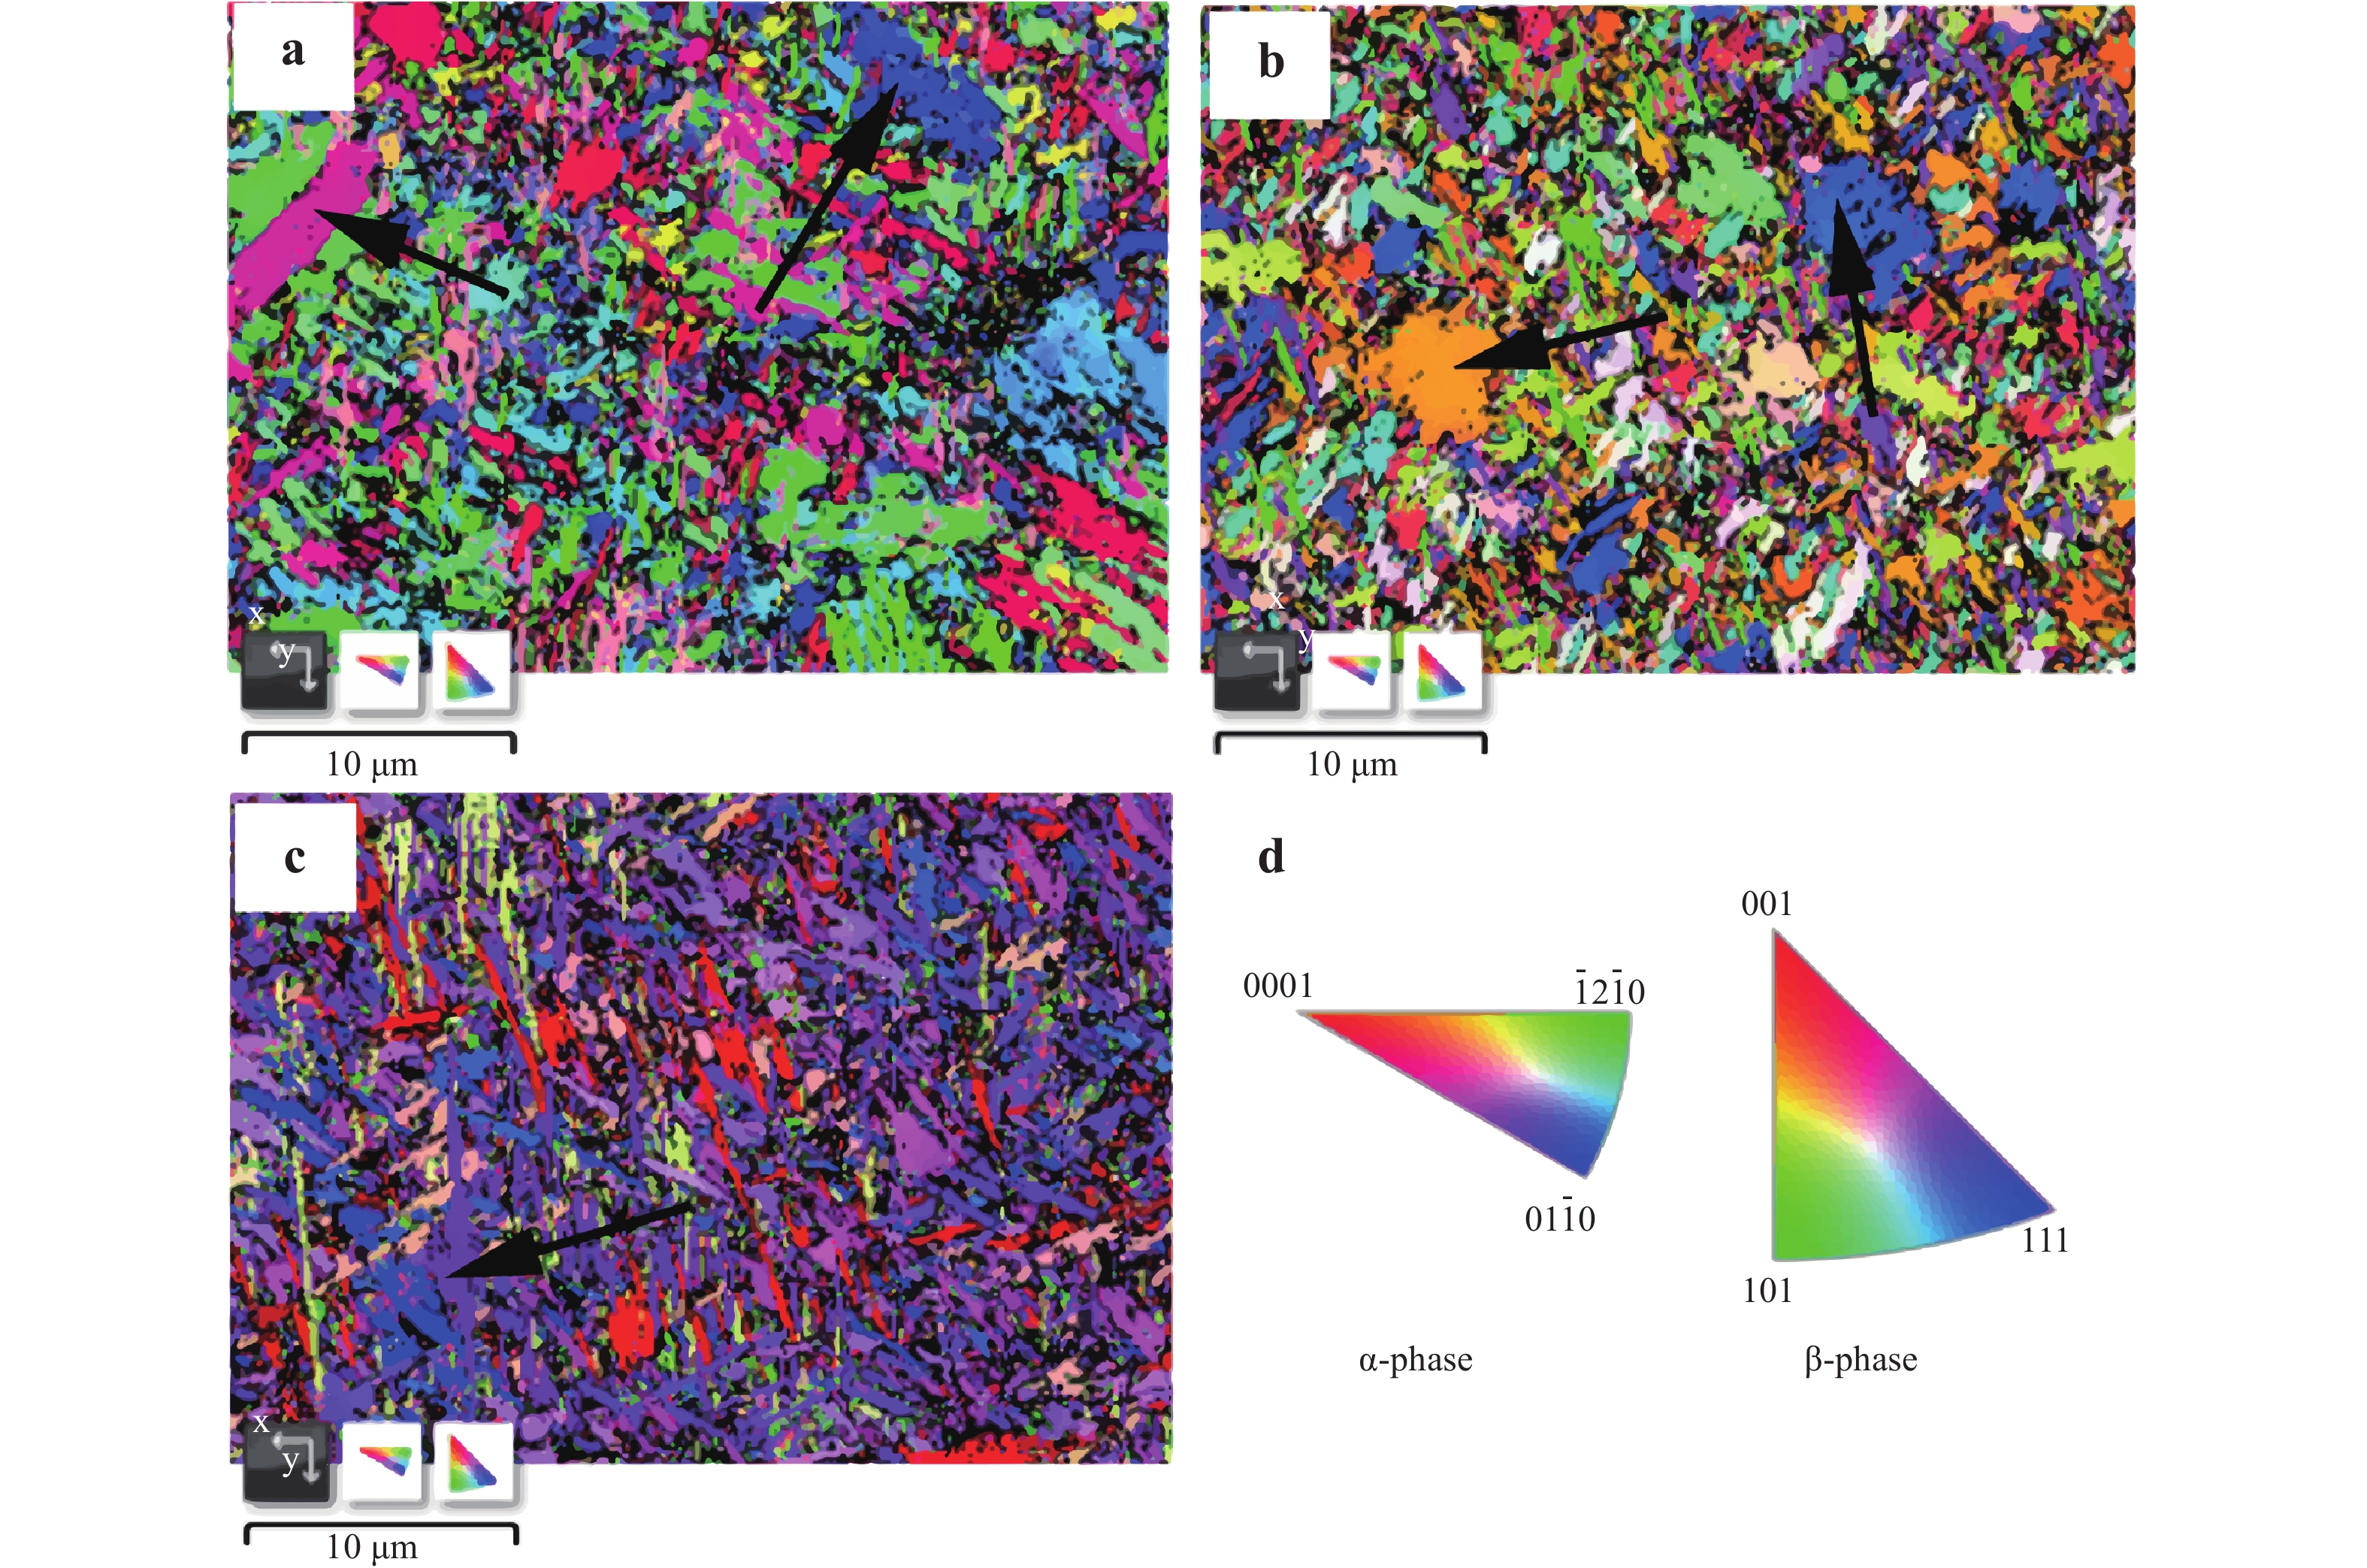
Fig. 6 EBSD orientation maps of α-hcp Ti and β-bcc Ti in cycling heat treated DED processed Ti-Mo sample: a P1-top, b P4-middle, and c P7-bottom regions and d scale plate.
Fig. 6 shows the texture analysis results of the heat-treated sample from the top to bottom regions. Compared with the as-fabricated sample, no texture was observed for the entire sample. Moreover, some large equiaxed grains appear instead of lath and acicular grains, as indicated by the black arrows in Fig. 6a–c. Considering the phase transition from β to α during heat treatment, it can be concluded that metastable β (0 0 1) transfers to α (0 1 -1 0). The grains then grow with an obvious reduction in the texture. Given that the phase transition induced a misorientation between α (0 1 -1 0) and α (0 0 0 1), the grain equiaxed growth velocity at the bottom region is smaller than that of the middle and top regions.
Fig. 7 shows the microhardness of the DED-processed Ti-Mo samples under the as-fabricated and heat-treated conditions. In the case of the as-fabricated samples, the bottom region presents a higher hardness (392 HV) than that of the middle and top regions (approximately 280 Hv), which is attributed to the graded structure with a high content of the β phase and fine microstructure at the bottom. After heat treatment, the microhardness significantly increased from the entire sample by approximately 50%, in which the highest hardness also appears in the bottom region. Owing to the microhardness improvement appearing from the entire sample, it can be concluded that the phase transition is not the main reason. Thus, this improvement can be attributed to the spheroidization behaviour of the α phase (see Figs. 1 and 6), which results in a simultaneous improvement in the strength and ductility. The reason behind the spheroidization behaviour is discussed in the discussion section.
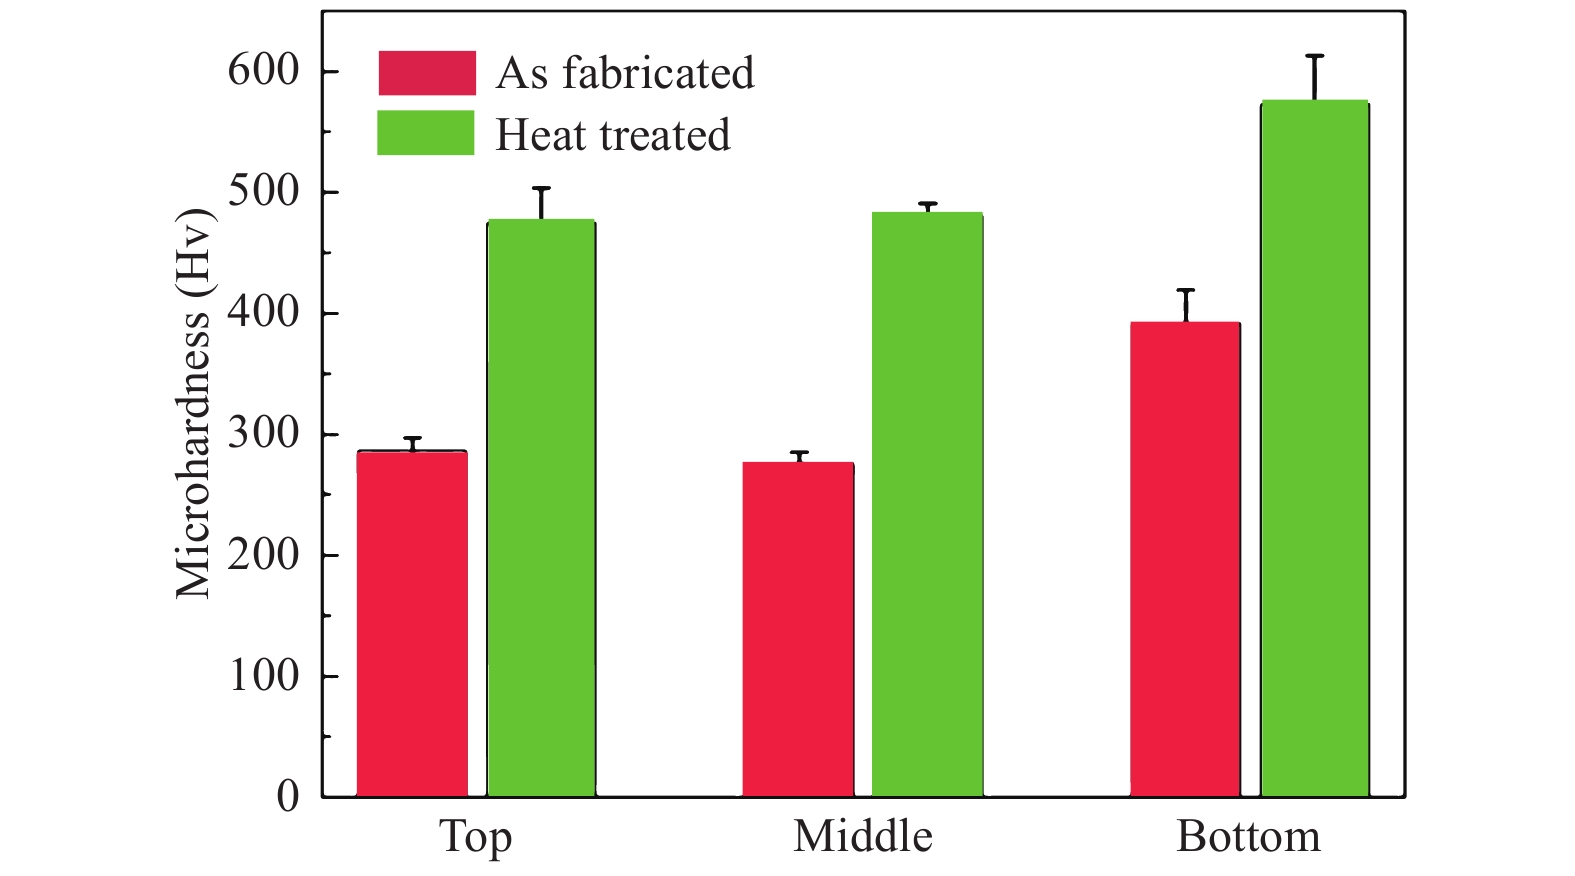
Fig. 7 Microhardness of DED processed samples in as-fabricated and heat-treated conditions from top, middle, and bottom regions.
The compression strain–stress curves of the DED-processed samples in the as-fabricated and heat-treated conditions taken from different altitudes are presented in Fig. 8. The compression properties and fracture behaviour are listed in Table 1. As shown in Fig. 8a, for the as-fabricated sample, the top region (P1) possesses low strength but high ductility without a crushing failure. By contrast, P1, the sample taken from the bottom region (P5 and P7) of the as-fabricated sample presents a high strength but low plasticity. Moreover, a crushing failure was observed during the compression test. Fig. 8b shows that a transition stage with a multistep failure appears between the top and bottom regions (see P3 in Fig. 8b). Therefore, it can be clearly seen that the as-fabricated sample possesses graded mechanical properties because of the graded structural features. In detail, the yield strength (YS) increases from 648 MPa to 1074 MPa from the top to bottom regions, which is attributed to the increase in high strength β from the top to bottom regions (see Fig. 3). Meanwhile, the plastic deformation and strength at the cracks show a similar tendency. It should be noted that a crushing phenomenon appears in almost the entire sample with the exception of the high-ductile top region. In the case of the heat-treated sample, the entire sample exhibited uniform mechanical properties such as strength, ductility, and fracture behaviour (see Fig. 8c, d). For instance, the difference between the maximum and minimum values of the YS of samples taken from different altitudes decreased from 39% to 3.9% after heat treatment. Only the bottom (P7) region exhibited a crushing failure. This homogenisation in mechanical properties is significantly influenced by the mitigation of the microstructure gradient after cycling post heat treatment, which is described in the discussion section.
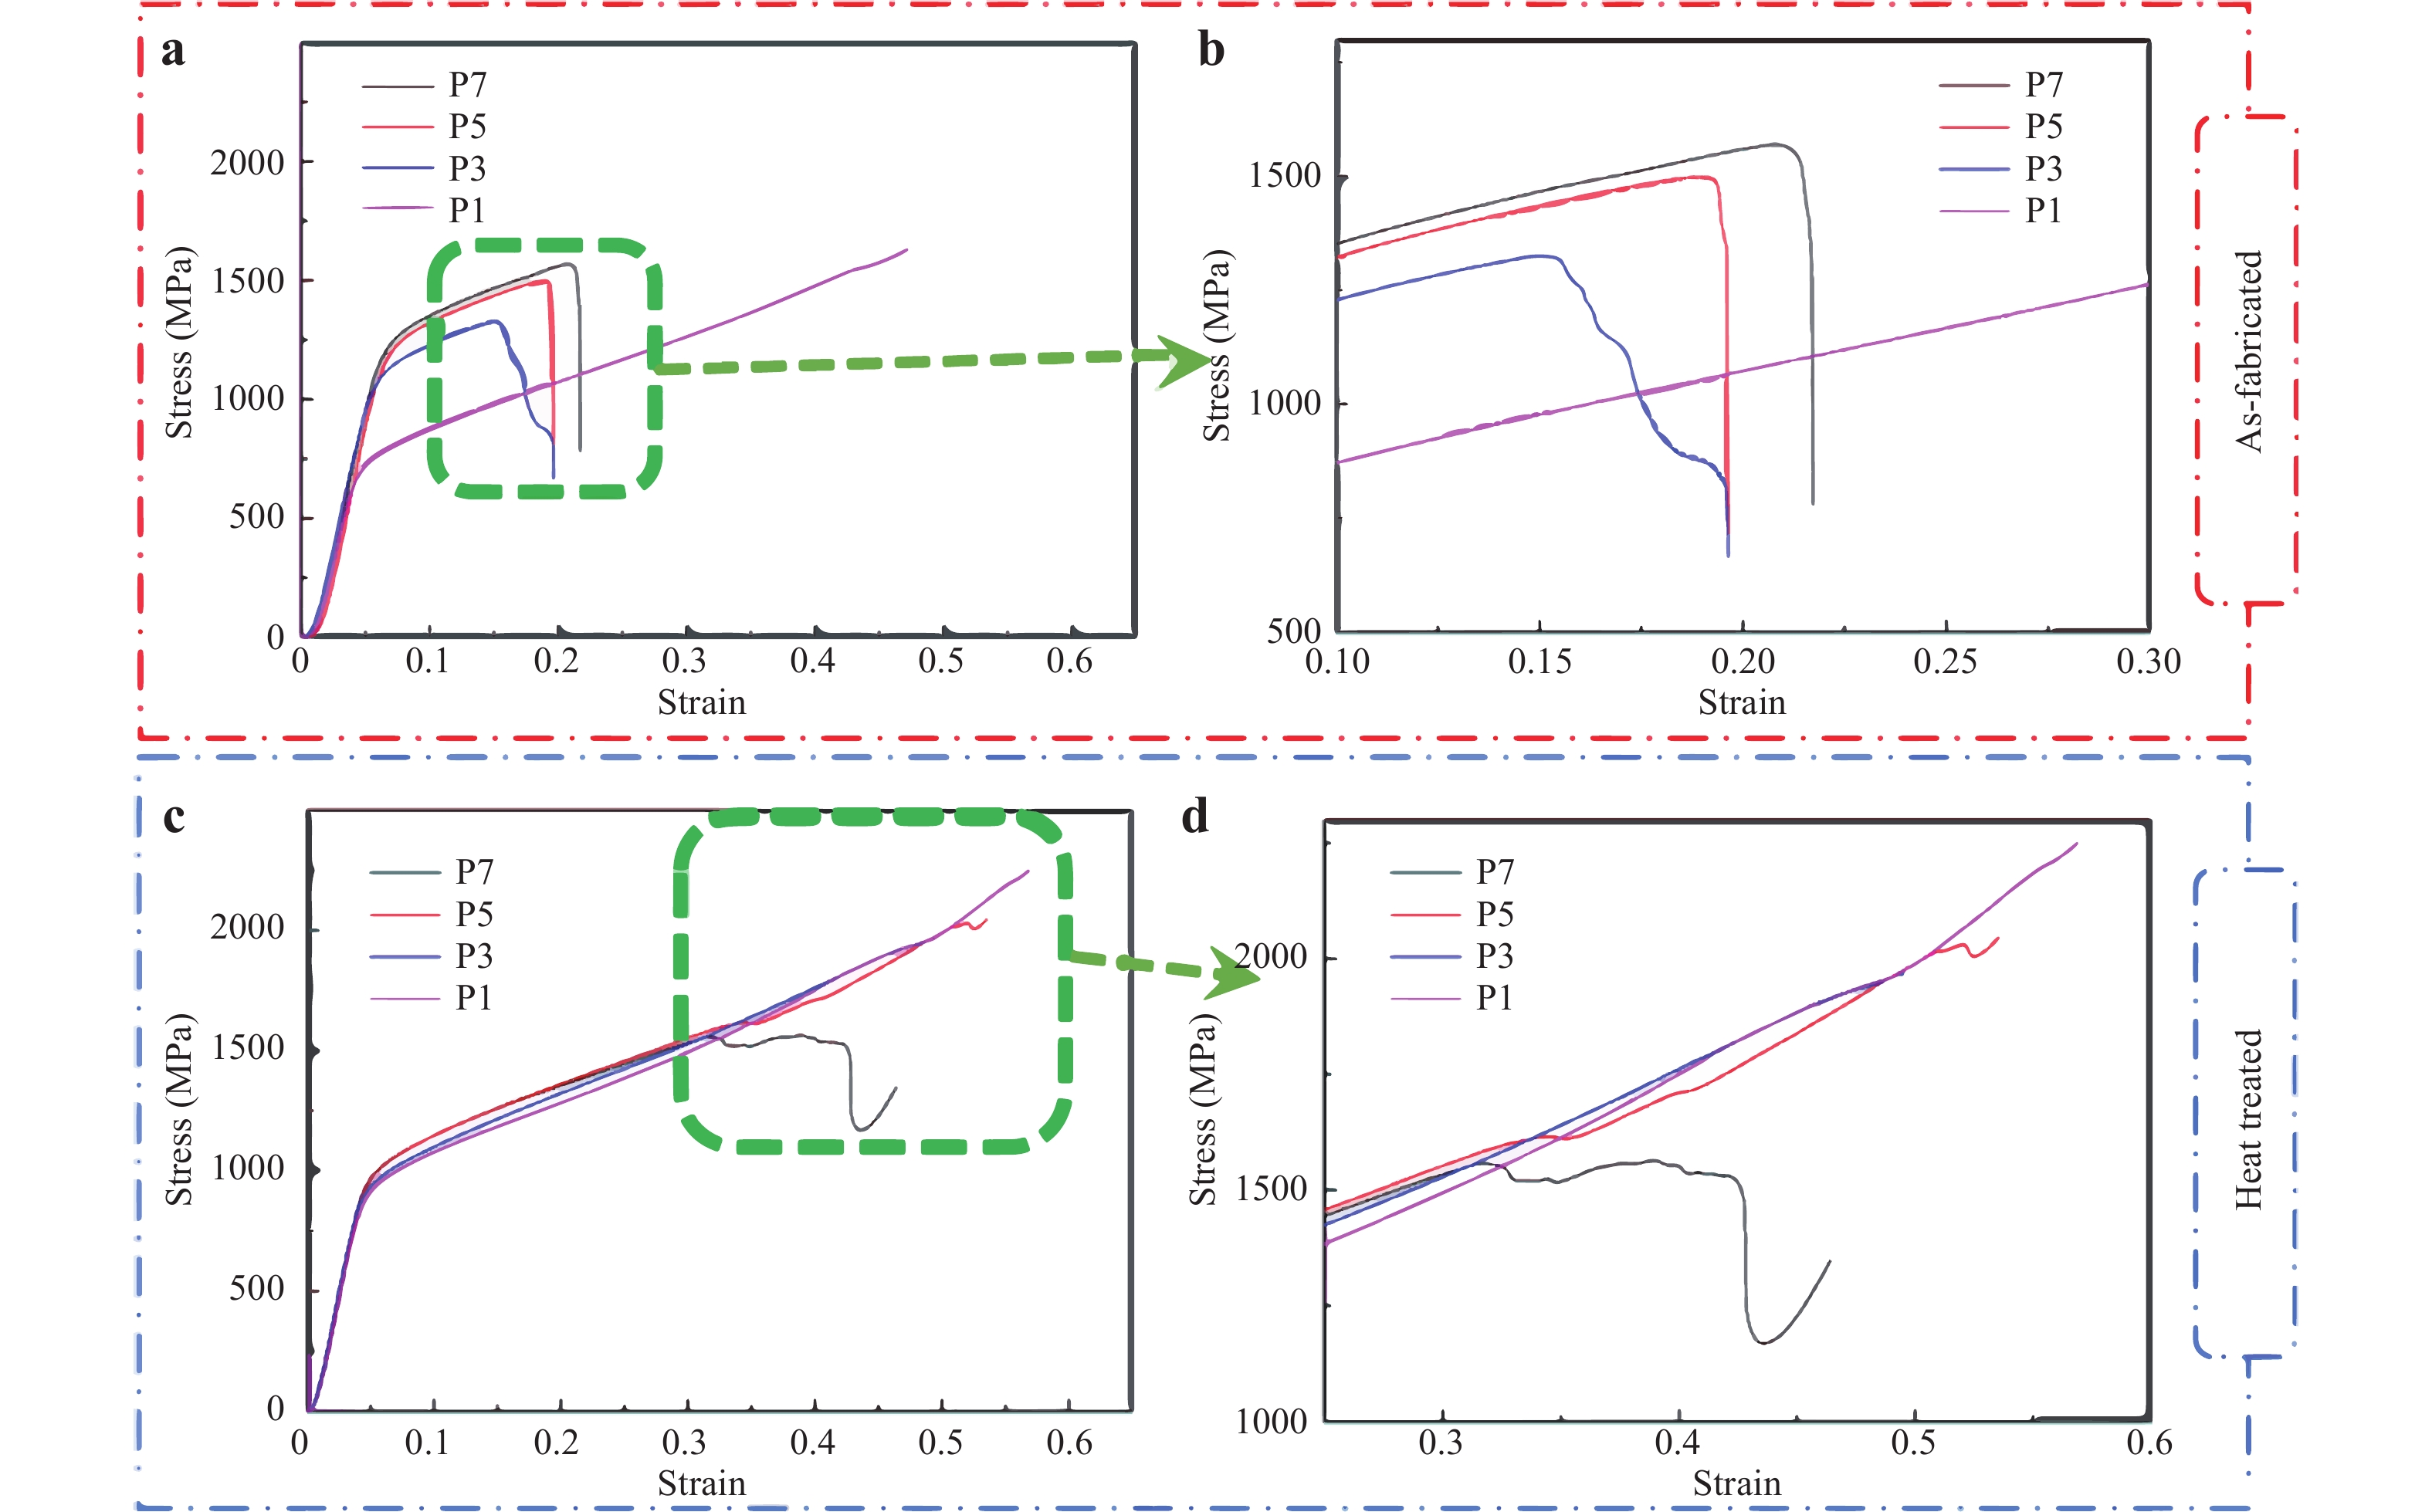
Fig. 8 Compression strain–stress curves of DED processed samples in a and b as-fabricated and c and d heat-treated conditions.
b and d partial enlarged drawing of a and c.Sample Number Yield strength (MPa) Plastic deformation(%) Strength at cracks(MPa) Crush failure or not AF HT AF HT AF HT AF HT P1 648.4 851.5 Non Non Non Non N N P3 942.6 836.8 9.8 Non 1325.6 Non Y N P5 1041.2 887.8 11.2 Non 1498.4 Non Y N P7 1074.6 886.4 14.3 27.3 1569.8 1564.7 Y Y Table 1. Compressive properties and fracture behaviour of DEDed Ti-Mo alloys under as-fabricated (AF) and heat-treated (HT) conditions.
-
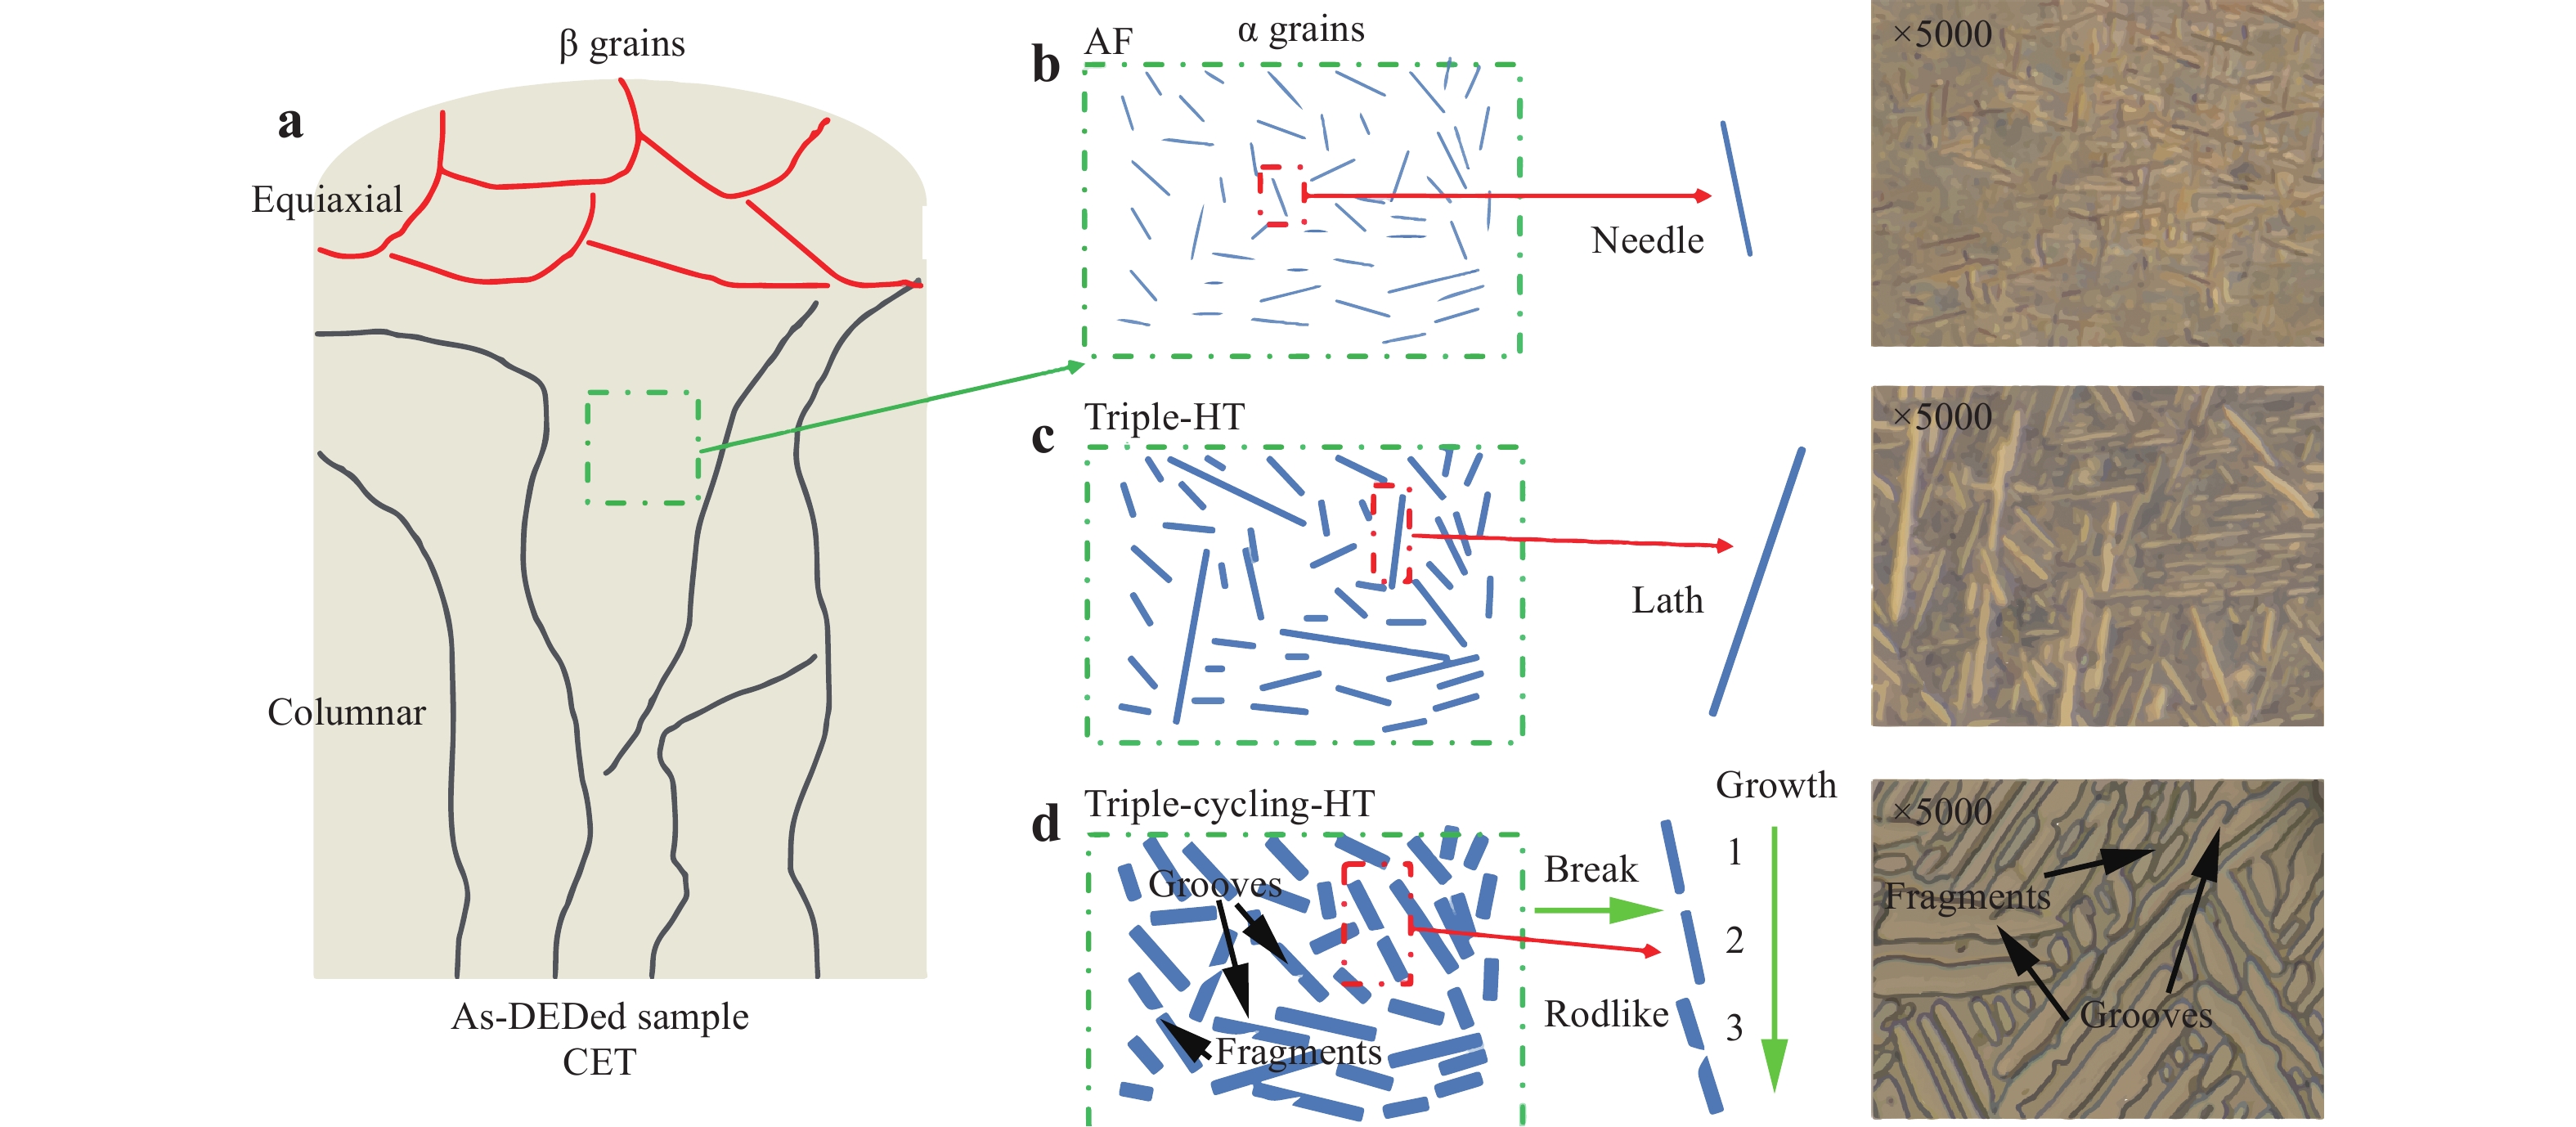
The phase transition during triple cycling heat treatment was described above, and to explain the morphological lath-rod transition mechanism of the α phase, Fig. 9 is employed. First, the DED-processed sample presents an obvious columnar-to-equiaxial transition (CET) phenomenon from the bottom to the top region, which was also reported by Zhang et al.30 in the case of Ti-Al-Mo alloys. To avoid this effect, the metallographic samples were cut off from the middle region (see Fig. 9a). Triple heat treatment (triple HT) was designed between the as-fabricated and triple cycling heat-treated conditions, which removes the cycling during solution treatment. From the optical microscopic image in Fig. 9, it can be seen that the triple HT only leads to the growth of the lath α phase, and no lath-rod transition appears. Thus, it can be concluded that cycling during solution treatment is a key to the formation of a rod-like α phase. In the case of the as-fabricated condition, the needle α phase appears because of the high cooling rate of the DED process (see Fig. 2b). After the triple HT, the needle α phase grew rapidly from three dimensions into a lath morphology (see Fig. 2c). In the case of triple cycling heat treatment, the needle α phase first grows into a lath morphology and then partially breaks into fragments, which is attributed to the termination migration mechanism31. During the cycling heating process, a defect or groove appears at the margin of the α lath, given the unstable thermal condition, which possesses a high curvature with the formation of an inhomogeneous distribution of Mo. Then, with an increase in the number of cycles, the Mo element migrates between the α lath margin and grooves, leading to a breaking of the α lath. Finally, the rod-like α phase appears instead of the α lath in the triple cycling heat-treated sample with grain coarsening, as shown in Fig. 9d.
-
From the compressive curves in Fig. 8, it can clearly be seen that the fracture behaviours of samples extracted from different regions differ. Therefore, the fracture surface, cracks, and deformation must be analysed. Fig. 10 presents the fracture surface of the as-fabricated sample at multiscale taking from the P3 position. As shown in Fig. 10a, the macrocrack possesses an angle of 45° to the loading direction, which is the maximum shear stress direction. The fracture surfaces were observed by SEM and are shown in Fig. 10b, which indicates the radical and fibre zones. A shear lip can be observed at the boundary of the fractural surface. The radical zone is analysed in detail in Fig. 10c, with the appearance of a radical pattern parallel to the crack propagation direction. The fibre zone presents two morphologies, i.e., a cleavage and dimple, which indicate the mixed fracture of fragile and ductile behaviours. It is worth noting that some large-sized parabola dimples can be observed in the dimple zone.
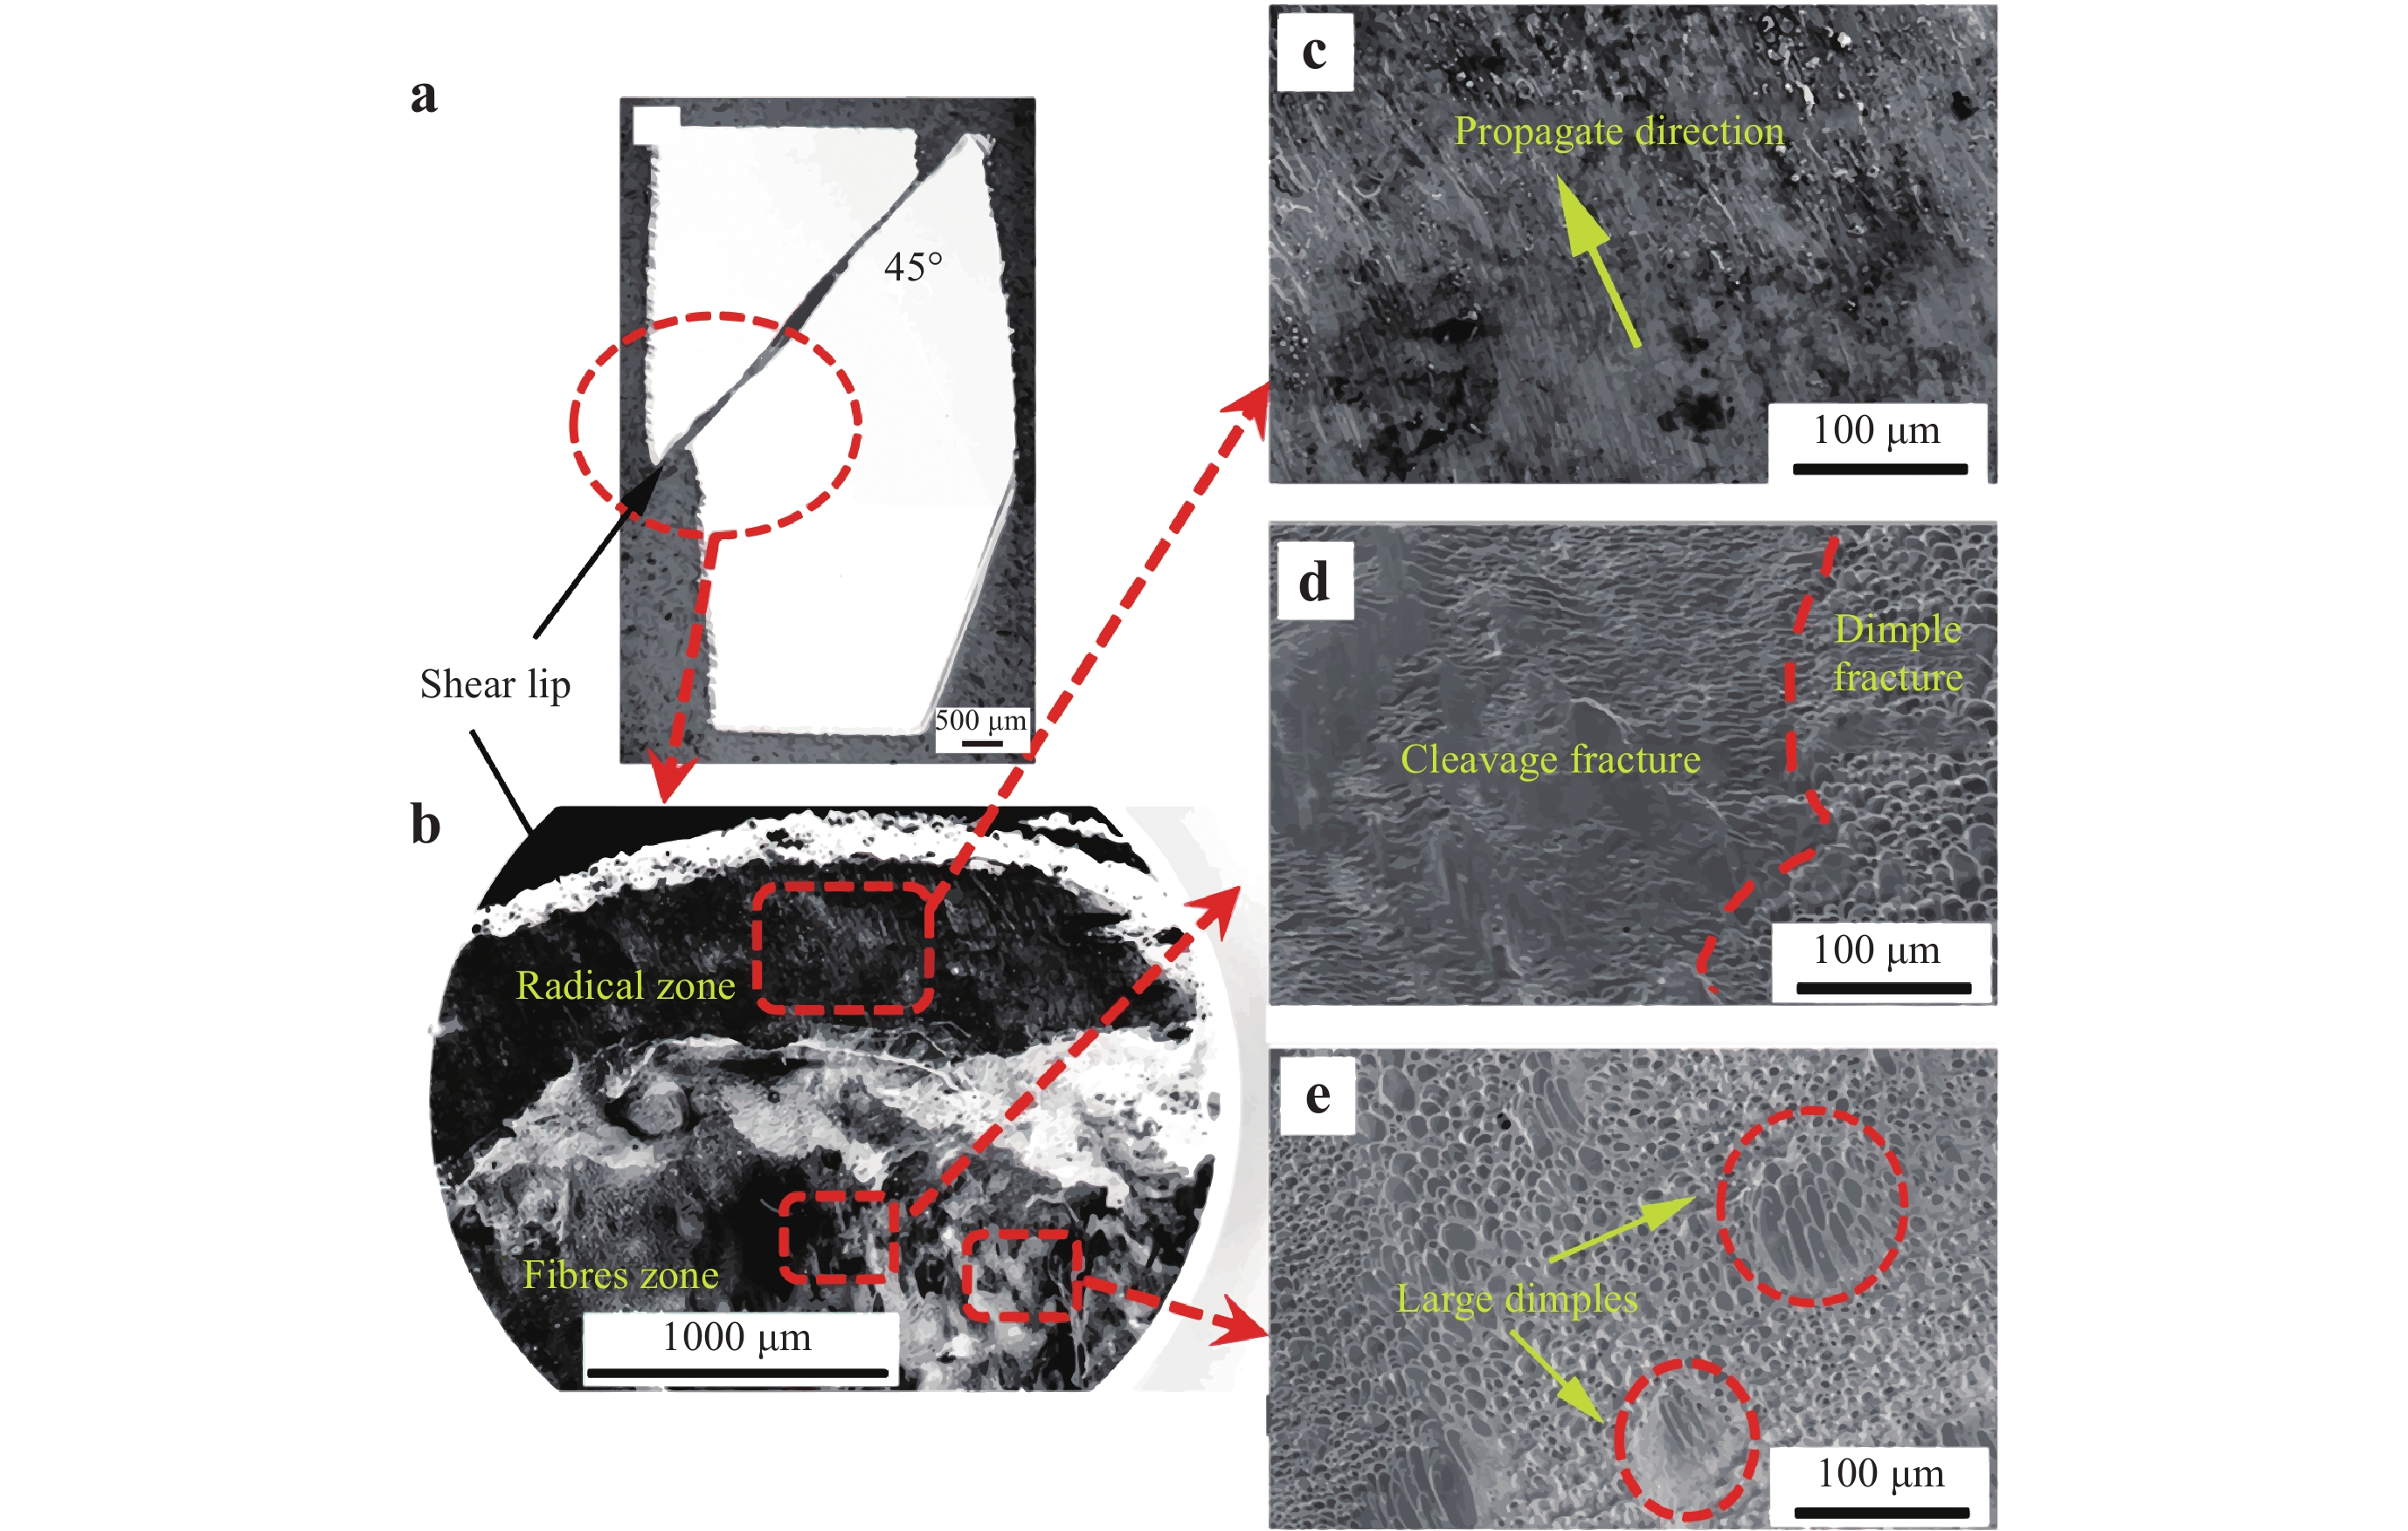
Fig. 10 Fractural surface analysis of as-fabricated Ti-Mo sample (P3): a broken sample morphology, b fractural face overview, c radical zone, d cleavage-dimple mixed region, and e large dimple fracture region.
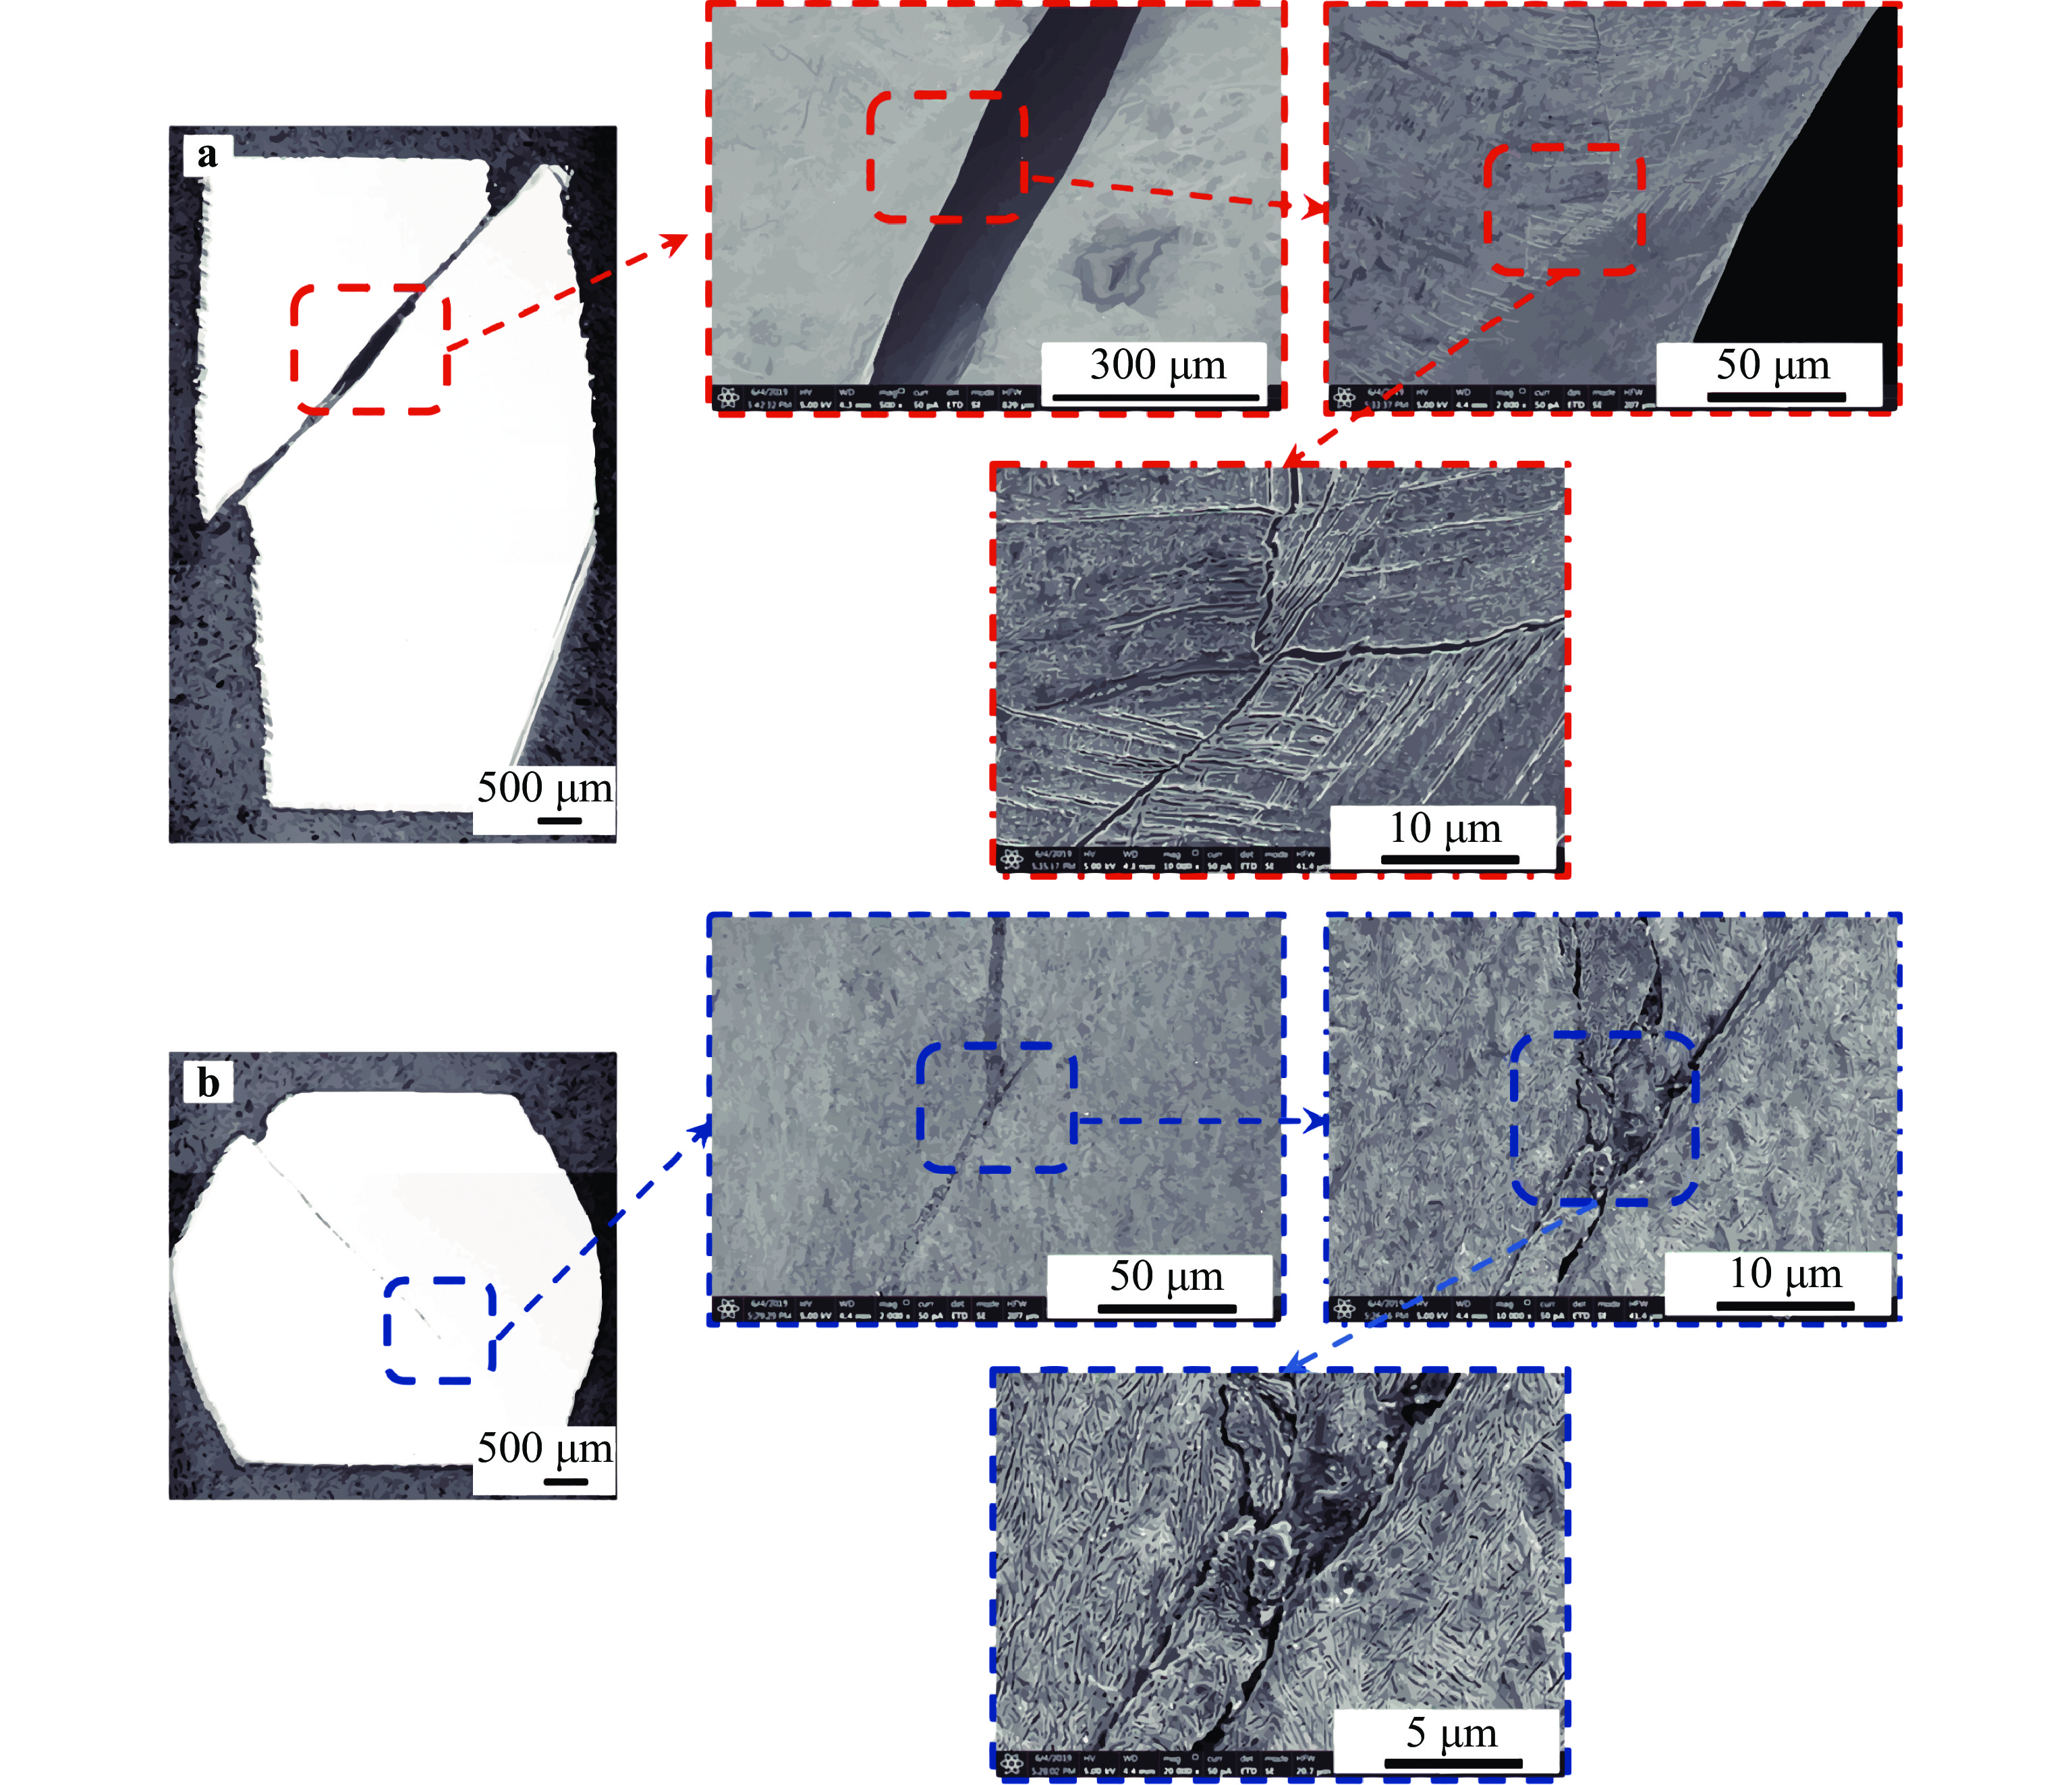
Because the heat-treated sample exhibits a high ductility without a crushing failure, the crack propagation behaviour of the as-fabricated and heat-treated samples is investigated, as shown in Fig. 11 from the middle region. In the case of the as-fabricated sample (see Fig. 11a), the crack passes through the entire sample. Some slippage-induced microcracks were observed near the grain boundary. According to Fig. 1 and previous studies, these microcracks are related to the size and morphology of the lath α phase. In the case of the heat-treated sample, the main crack does not pass through the sample with a large plastic deformation (see Fig. 11b). Moreover, the frontier of the crack stops with a bifurcate feature, where some fragments appear.
Microstructural evolution
Fracture behaviour
-
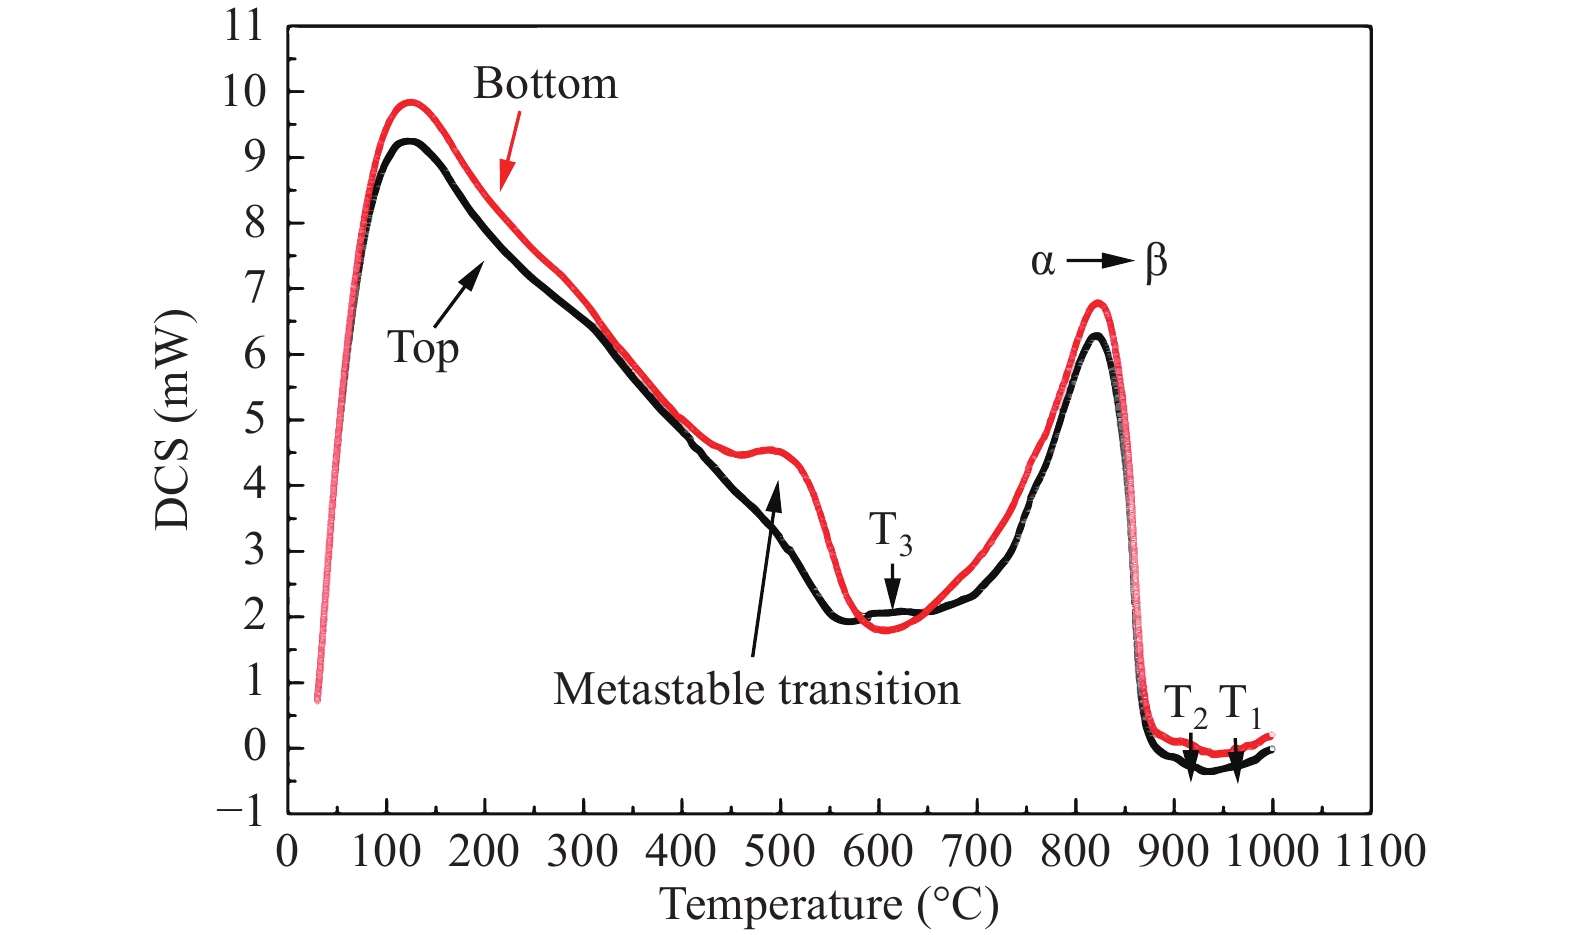
The Ti-7.5Mo bulk sample, with dimensions of 15 × 90 × 40 mm3, was prepared using a self-developed DED system equipped with a semiconductor laser source (IPG, USA) with a maximum power of 6 kW (as shown in Fig. 12a). The feedstock powder, which is pure Ti powder with a low oxygen content (O ≤ 0.09 wt. %) (YGFL, China), with a particle size of +100–150 μm, and a pure Mo powder (Tianjiu, China) with a particle size of +5–20 μm, was mechanically mixed using a ball milling machine with alumina balls for 2 h and then delivered by 4 co-axial injector nozzles in the DED system17. During sample preparation, the laser power, scanning speed, powder feed rate, and layer thickness, as determined from previous experiments, were kept constant at 2.5 kW, 900 mm min–1, 25 g min–1 and 0.7 mm, respectively. The scanning mode incorporated a 90° rotation after each layer. More information about the feedstock materials and DED system can be found in our previous study17. According to the results from Thermal-Calc® and previous optimised investigations, the optimised heat treatment, which consists of a cycling homogenisation and solution-aging, is employed. Fig. 13 presents the DSC curves, which were measured using a Netzsch instrument at a heating rate of 15 ℃ min–1 under a temperature range of 35 ℃ to 1000 ℃. The results indicate that metastable and α-β transitions appear at approximately 500 ℃ and 800 ℃, respectively. Thus, to obtain a uniform stable structure, the cycling temperature (T1), solution temperature (T2), and aging temperature (T3) were set to 960 ℃, 920 ℃, and 600 ℃. Detailed information is schematically illustrated in Fig. 12b. After heat treatment, no obvious geometric changes were observed. Positions 1–9 are labelled P1, P2…P9 from nine different altitudes for a microstructure and mechanical property characterisation (Fig. 12c).
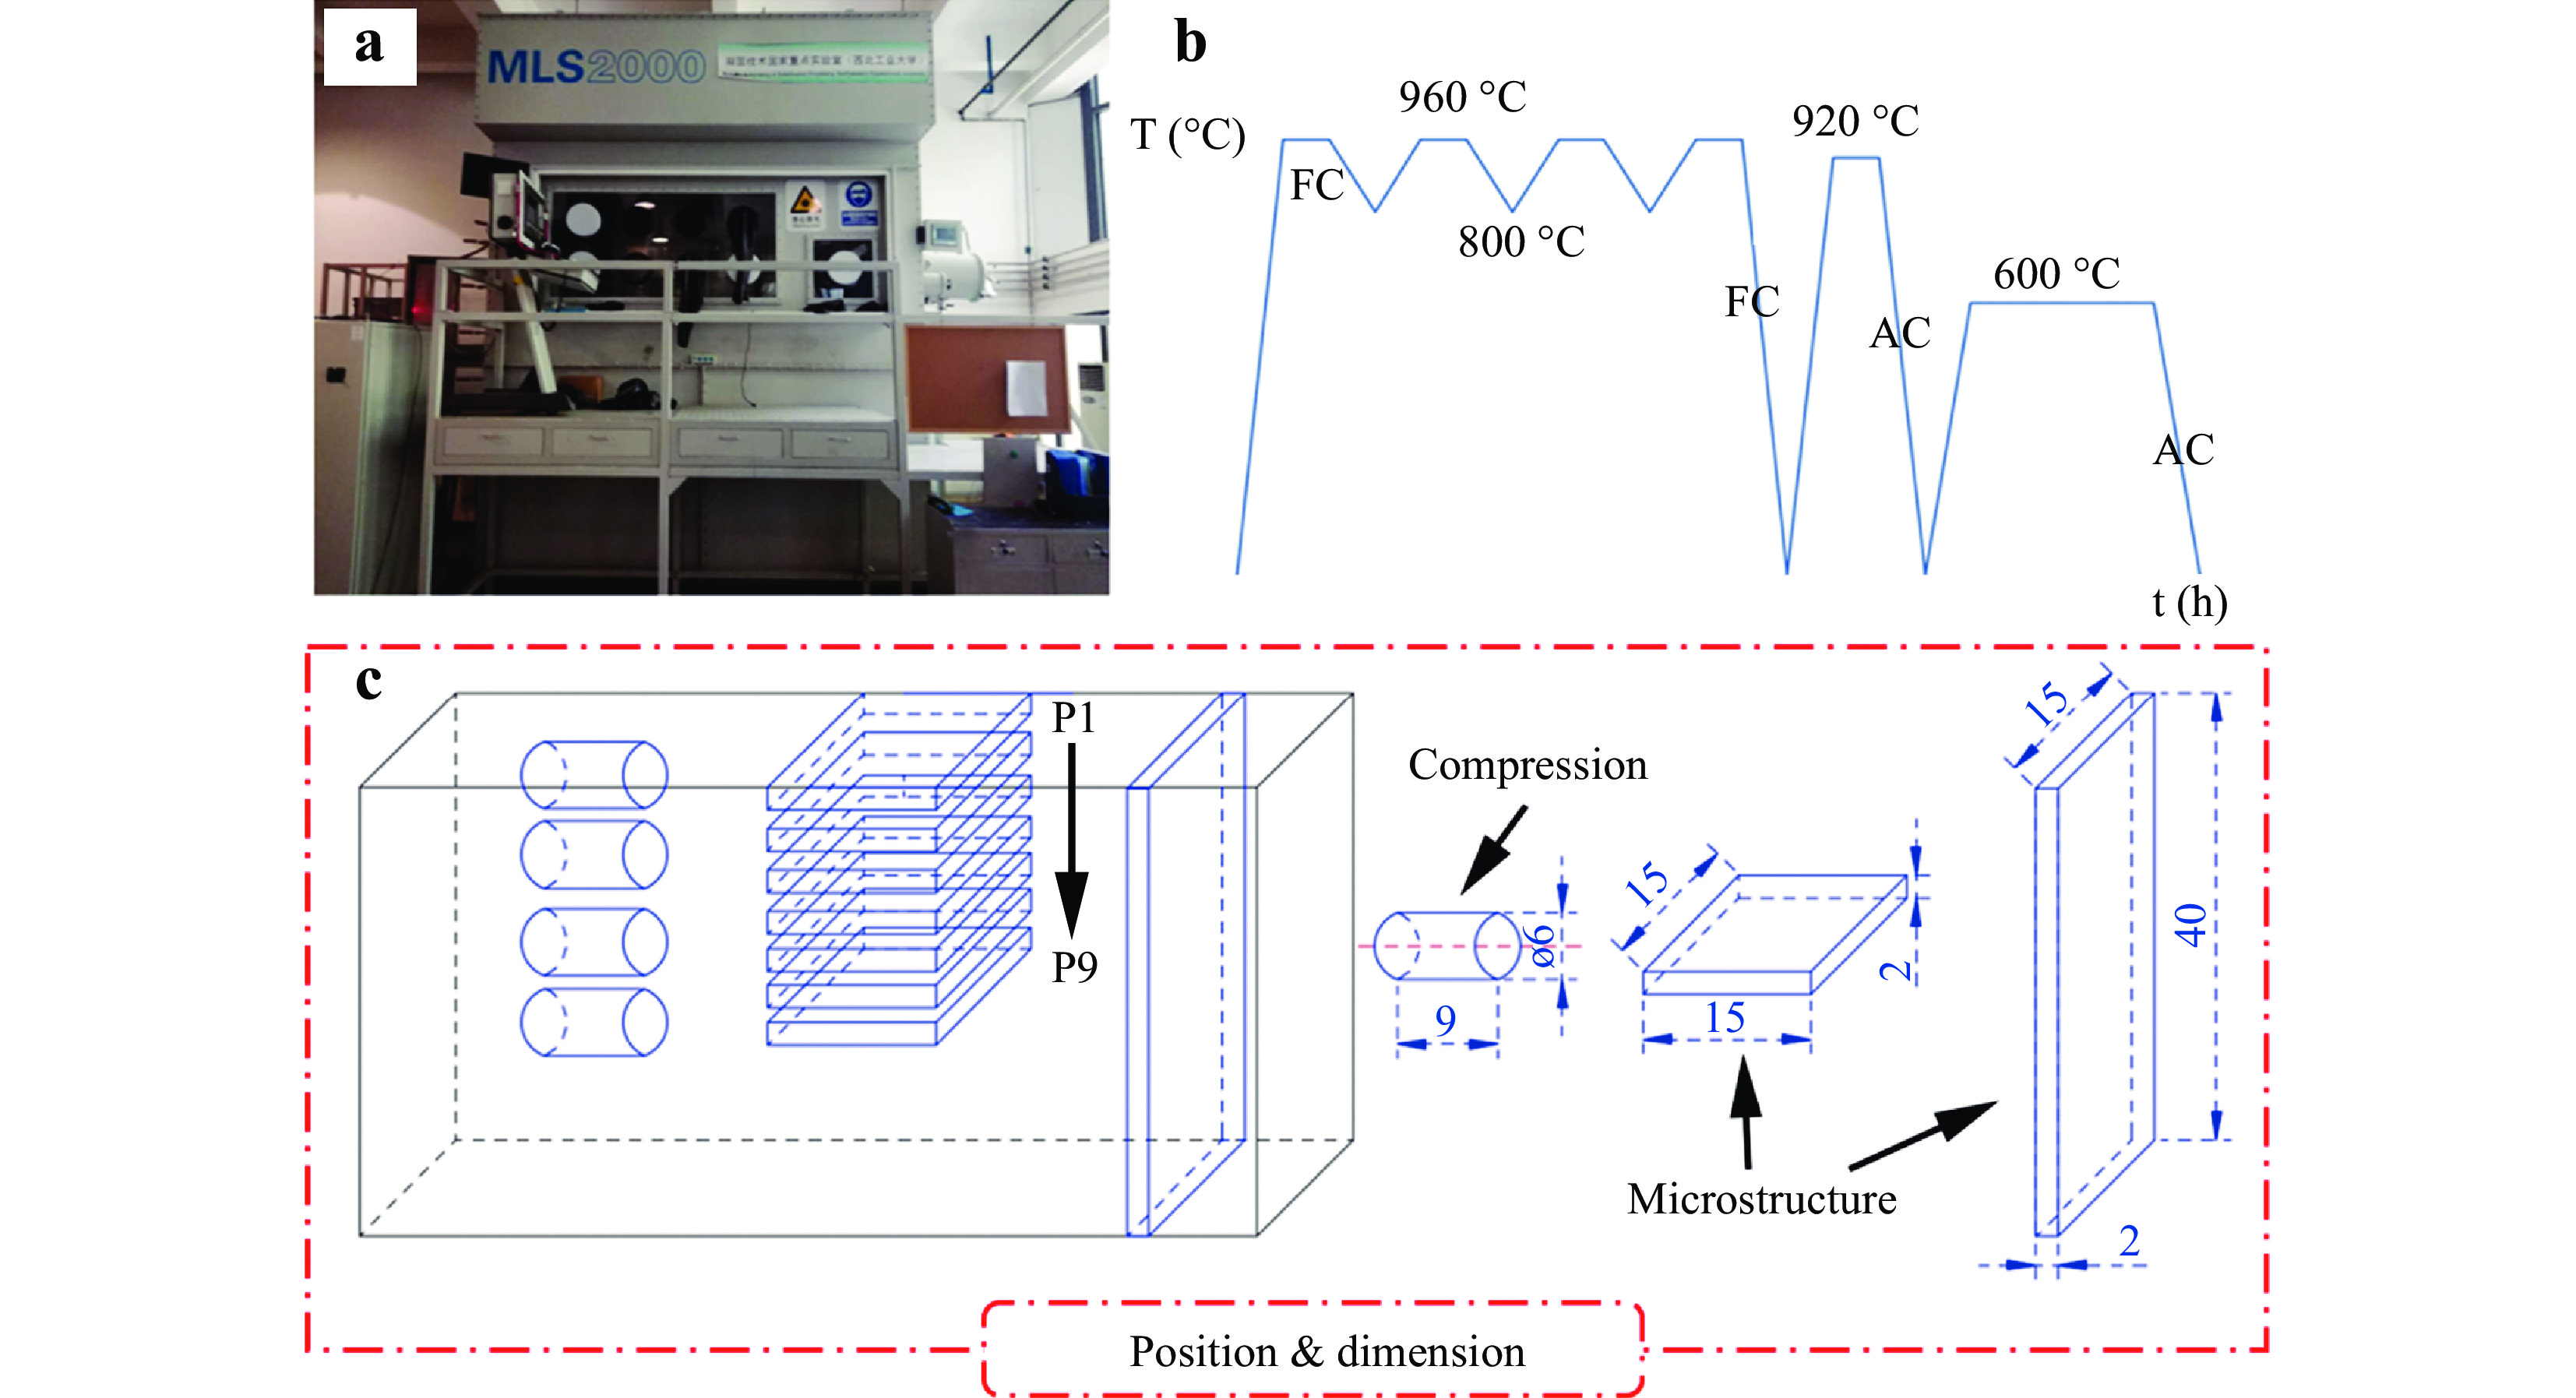
Fig. 12 Self-made laser direct energy deposition system in NPU (MLS2000), b optimised critical multiple heat treatment (FC, furnace cooling; AC, air cooling), and c Schematic illustration of sampling method from positions 1–9 for a compression and microstructural analysis (mm).
-
A phase analysis was conducted using X-ray diffraction (XRD, PANalytical, Netherlands) with a Cu Kα source at scanning speeds of 10° min–1 and 1° min–1 on polished X-Z and X-Y cross sections. Metallographic samples were prepared by mechanical and OP-S polishing. A chemical solution of 1 mL HF, 3 mL HNO3, and 50 mL H2O was used as the etching agent. The chemical composition was estimated using inductively coupled plasma optical emission spectrometry (ICP, ThermoFisher), and the microstructure was characterised by optical microscopy (OM, Keyence VH-Z50L) and scanning electron microscopy (SEM, Tescan VEGAIILMH) coupled with energy-dispersive X-ray spectrometry (EDS, Ican). Electron backscattered diffraction (EBSD) analyses were conducted on an SEM system equipped with an HKL Nordlys camera from Oxford Instruments and controlled by the CHANNEL5 software suite. The microhardness was measured on a polished sample (Ra = 0.02 μm) with a Vickers pyramid (LECO, USA). Loads of 200 gf were applied with a dwell time of 25 s. The average values given here correspond to a set of 10 measurements. The rod specimens for the compression test were machined to confirm the GB/T 7314 standard (see Fig. 12c). Compression testing was conducted at room temperature on an Instron-3382 machine with a constant crosshead displacement rate of 0.25 mm min–1.
Sample preparation
Characterisations
-
This work was supported by the National Key R&D Program of China (Grant No. 2016YFB1100100), Fundamental Research Funds for the Central Universities (Grant No. 31020180QD130), and Production-Education-Research program of Aero Engine Corporation of China (Grant No. HFZL2019CXY019).






 DownLoad: