


-
Fiber cladding diameter is one of the most basic geometric parameters which must be controlled during optical fiber manufacturing. In optical fiber communication devices and systems, severe loss at the splicing points could occur if the cladding is not precisely matched, which may worsen for multicore fibers because the alignment of off-center cores is more sensitive to the difference in cladding diameter1. Anti-resonant hollow-core fibers (AR-HCFs) have great potential to replace conventional single-mode and multi-mode fibers in optical fiber communication owing to their low-level excellent transmission performance, such as extreme Rayleigh backscattering2, reduced attenuation3, suppressed nonlinear optical effect4, and broad bandwidth for guidance4,5. The cladding diameters and inner 2D microstructures fundamentally determine the guidance performance of AR-HCFs6. Nonetheless, no technique exists for characterizing their geometric size in a distributed manner. The cladding diameter is also a vital parameter considering optical fiber sensing. For example, the error of fiber-optic gyroscopes is partly owing to the nonreciprocal effect induced by the non-uniformity of fiber windings7,8. It is directly determined by the coating diameter, which tends to be affected by the cladding diameter. Moreover, when the application includes, for example, cladding-guided modes, nonlinear effects under phase-matching conditions, or acoustic grating generation9,10, accurate control over the fiber diameter is essential.
Because of spatial resolution and ubiquity, scanning electron microscopes (SEMs) or optical microscopes are widely employed in industry for imaging the cross-sections of fibers under test for measuring fiber diameter. However, optical and electron microscopy are useful only for point measurements. Moreover, the measurements are destructive as the fiber must be cut at the measurement locations, causing irreversible damage to the fiber. These conventional microscopy techniques involve a trade-off between the resolution and the field of view (FOV) of the microscope11,12, which limits the resolution approximately 100 nm for fiber diameters of approximately 125 μm. Non-destructive estimation of fiber diameter has been explored since the 1970s. These methods are based on the analysis of the interference fringe pattern produced by forward and backward scattering13-15, with a best precision of 250 nm over a fiber diameter range of 50−150 μm. To date, this so-called shadowing technique has been used in most practical commercial devices for estimating fiber diameter.
However, the diameter resolution achieved by the aforementioned methods is insufficient for demanding applications. Thus, methods such as spectral interferometry16 have been introduced to achieve a precision greater than 10 nm. A more accurate measurement of the fiber cladding diameter can be realized by near-field resonance in backscattered light17. The spectrum of the resonances allows relative and absolute measurement of the cylinder diameter to an accuracy of ~1 part in 105 for a fiber approximately 100 µm in diameter, which yields accuracy better than 1 nm. Another high-accuracy scheme exploits the properties of whispering gallery modes (WGMs) generated by an auxiliary microfiber, achieving a resolution of 1 part in 104 (angstrom accuracy) as reported18,19.
To date, the schemes used for measuring fiber diameter are mostly based on point measurements. To measure the diameter across the entire length of the fiber, the location of the side illumination or the microfiber must be scanned axially, which is time-consuming and difficult to control. Unfortunately, few, if any, current methods can realize truly distributed diameter measurements along the entire fiber, leaving the fiber manufacturing process with high uncertainty. Recently, Alcusa-Sáez, et al20,21 have realized a quasi-distributed diameter measurement with a centimeter-scale spatial resolution and a limited fiber length based on a time-resolved acousto-optic technique using a flexural wave. However, the application of WGMs and acousto-optic techniques can only detect the relative diameter variations along the fiber, but are unable to obtain the absolute value of the diameter.
Forward stimulated Brillouin scattering (FSBS), which was first applied to monitor single-mode fiber diameters in 199222 , has been recently extended to the measurement of AR-HCF structure23. However, distributed monitoring of fiber diameters by FSBS is inherently because of its forward characteristic24. Recently, two methods were claimed to fulfill distributed chemical sensing by FSBS, where different backward scatterings were inspected25,26. The reported axial spatial resolutions were tens of meters. These axial spatial resolutions are inadequate for investigating fluctuations in the fiber diameter. To improve the spatial resolution, we introduced a novel optomechanical protocol called optomechanical time-domain analysis (OMTDA) for measuring the acoustic impedance of fibers and achieved an axial spatial resolution of 2 m27. The enhanced spatial resolution provided by the OMTDA system led us to believe that a fully distributed measurement of the fiber diameters was possible. In our work, we accurately measured the axial non-uniformity caused by both industrial manufacturing and hydrofluoric acid solution along two unjacketed 30-meter single-mode fibers with distinct nominal cladding diameters of 125 μm and 80 μm. We achieved a diameter resolution of ~3.9 nm and the results agreed well with SEM measurements. For the first time, this technology facilitates the non-destructive, distributed, high-resolution measurement of optical fibers with ~nm precision.
-
FSBS is a third-order optomechanical nonlinear effect in which two co-propagating laser beams interact with a transverse acoustic wave enhanced by laser-induced electrostriction.
Under ideal conditions, the cross-section of an ordinary single-mode fiber can be regarded as a perfect circle with diameter
$ d $ . The precise resonant frequency of the mth-order radial acoustic mode R0m can be expressed as$$ {f_{0m}} = \frac{{{V_L}}}{{2\pi }}\sqrt {{k^2} + \frac{{4y_m^2}}{{{d^2}}}} $$ (1) We denote
$ {v}_{L}=5968\;m/s $ as the longitudinal acoustic velocity, and${y_m}$ is the mth-order root of the boundary equation of the circular cladding24.The axial wave vector
$k$ the transverse acoustic wave was approximately zero. Thus, the resonant frequency${f_{0m}}$ is inversely proportional to the fiber diameter$d$ . To generate FSBS, the phase-matching condition requires that the phase velocity of the acoustic wave be equal to the group velocity of the light wave in the fiber. The slope of the dispersion relation curve is approximately zero, implying that the phase velocity is approximately infinite, and the phase-matching condition of FSBS can be satisfied automatically at the resonant frequency of a specific acoustic wave. Thus, the absolute diameter of the fiber can be determined by extracting the spectral information.However, the cross-section of an actual fiber is not perfectly circular. Thus, Eq. 1 is no longer a valid dispersion relation. Instead, the frequency and acoustic wave distribution
$ u $ must be quantified by the more general elastic dynamic equation28:$$ \rho \frac{{{\partial ^2}{u_i}}}{{\partial {t^2}}} - {\left[ {{c_{ijkl}}{u_{kl}} + {\eta _{ijkl}}\frac{{\partial {u_{kl}}}}{{\partial t}}} \right]_j} = {\left[ {{\varepsilon _0}{\varepsilon _{im}}{\varepsilon _{jn}}{p_{klmn}}E_k^{(1)}E_l^{(2)*}} \right]_j} $$ (2) where ρ, cijkl, ηijkl, ε, and pklmn are the medium density, stiffness matrix, viscosity matrix, dielectric constant, and polarization tensor, respectively.
Considering that the deviation from the standard circle is generally slight, to simplify the physical model, we assumed the cross section to be elliptical with a known non-circularity given by the ratio of the difference between the diameters of the major and minor axes to the average fiber diameter, which is used as a boundary condition for Eq. 2. After inspection, we found that the non-circularity was less than 0.006 for well-made fibers. Using finite element analysis, we calculated the displacement fields of R07 for non-circularities of 0 and 0.005, as illustrated in Fig. 1a and b. In general, the basic acoustic wave distributions present similar ring structures. However, the gradual destruction of the radiation symmetry of the R07 mode distributions can be observed with an increase in non-circularity. In particular, for non-zero non-circularity, the energy is concentrated more toward the minor axis of the ellipse compared to the ring structure of the acoustic wave in a perfectly circular geometry. Correspondingly, the dispersion relation reveals an overall shift toward a higher frequency when the elliptical cross-section is considered, as depicted in Fig.1c. In the following studies, we focused on two types of single-mode fibers with nominal diameters of 125 μm and 80 μm, respectively. Fig. 2 illustrates the simulation of evolution in the demodulated diameter based on the FSBS resonance frequency with non-circular fiber cross sections. As the non-circularity increases, the average diameter remains constant in geometry, while the diameter calculated from the FSBS spectrum exhibits a downward trend, indicating that the effect of boundary shrinkage is more obvious than the expansion. Thus, a bias exists when FSBS is applied to the fiber diameter measurement. The maximal measured results are tens of nanometers smaller than the average of the major and minor axes.
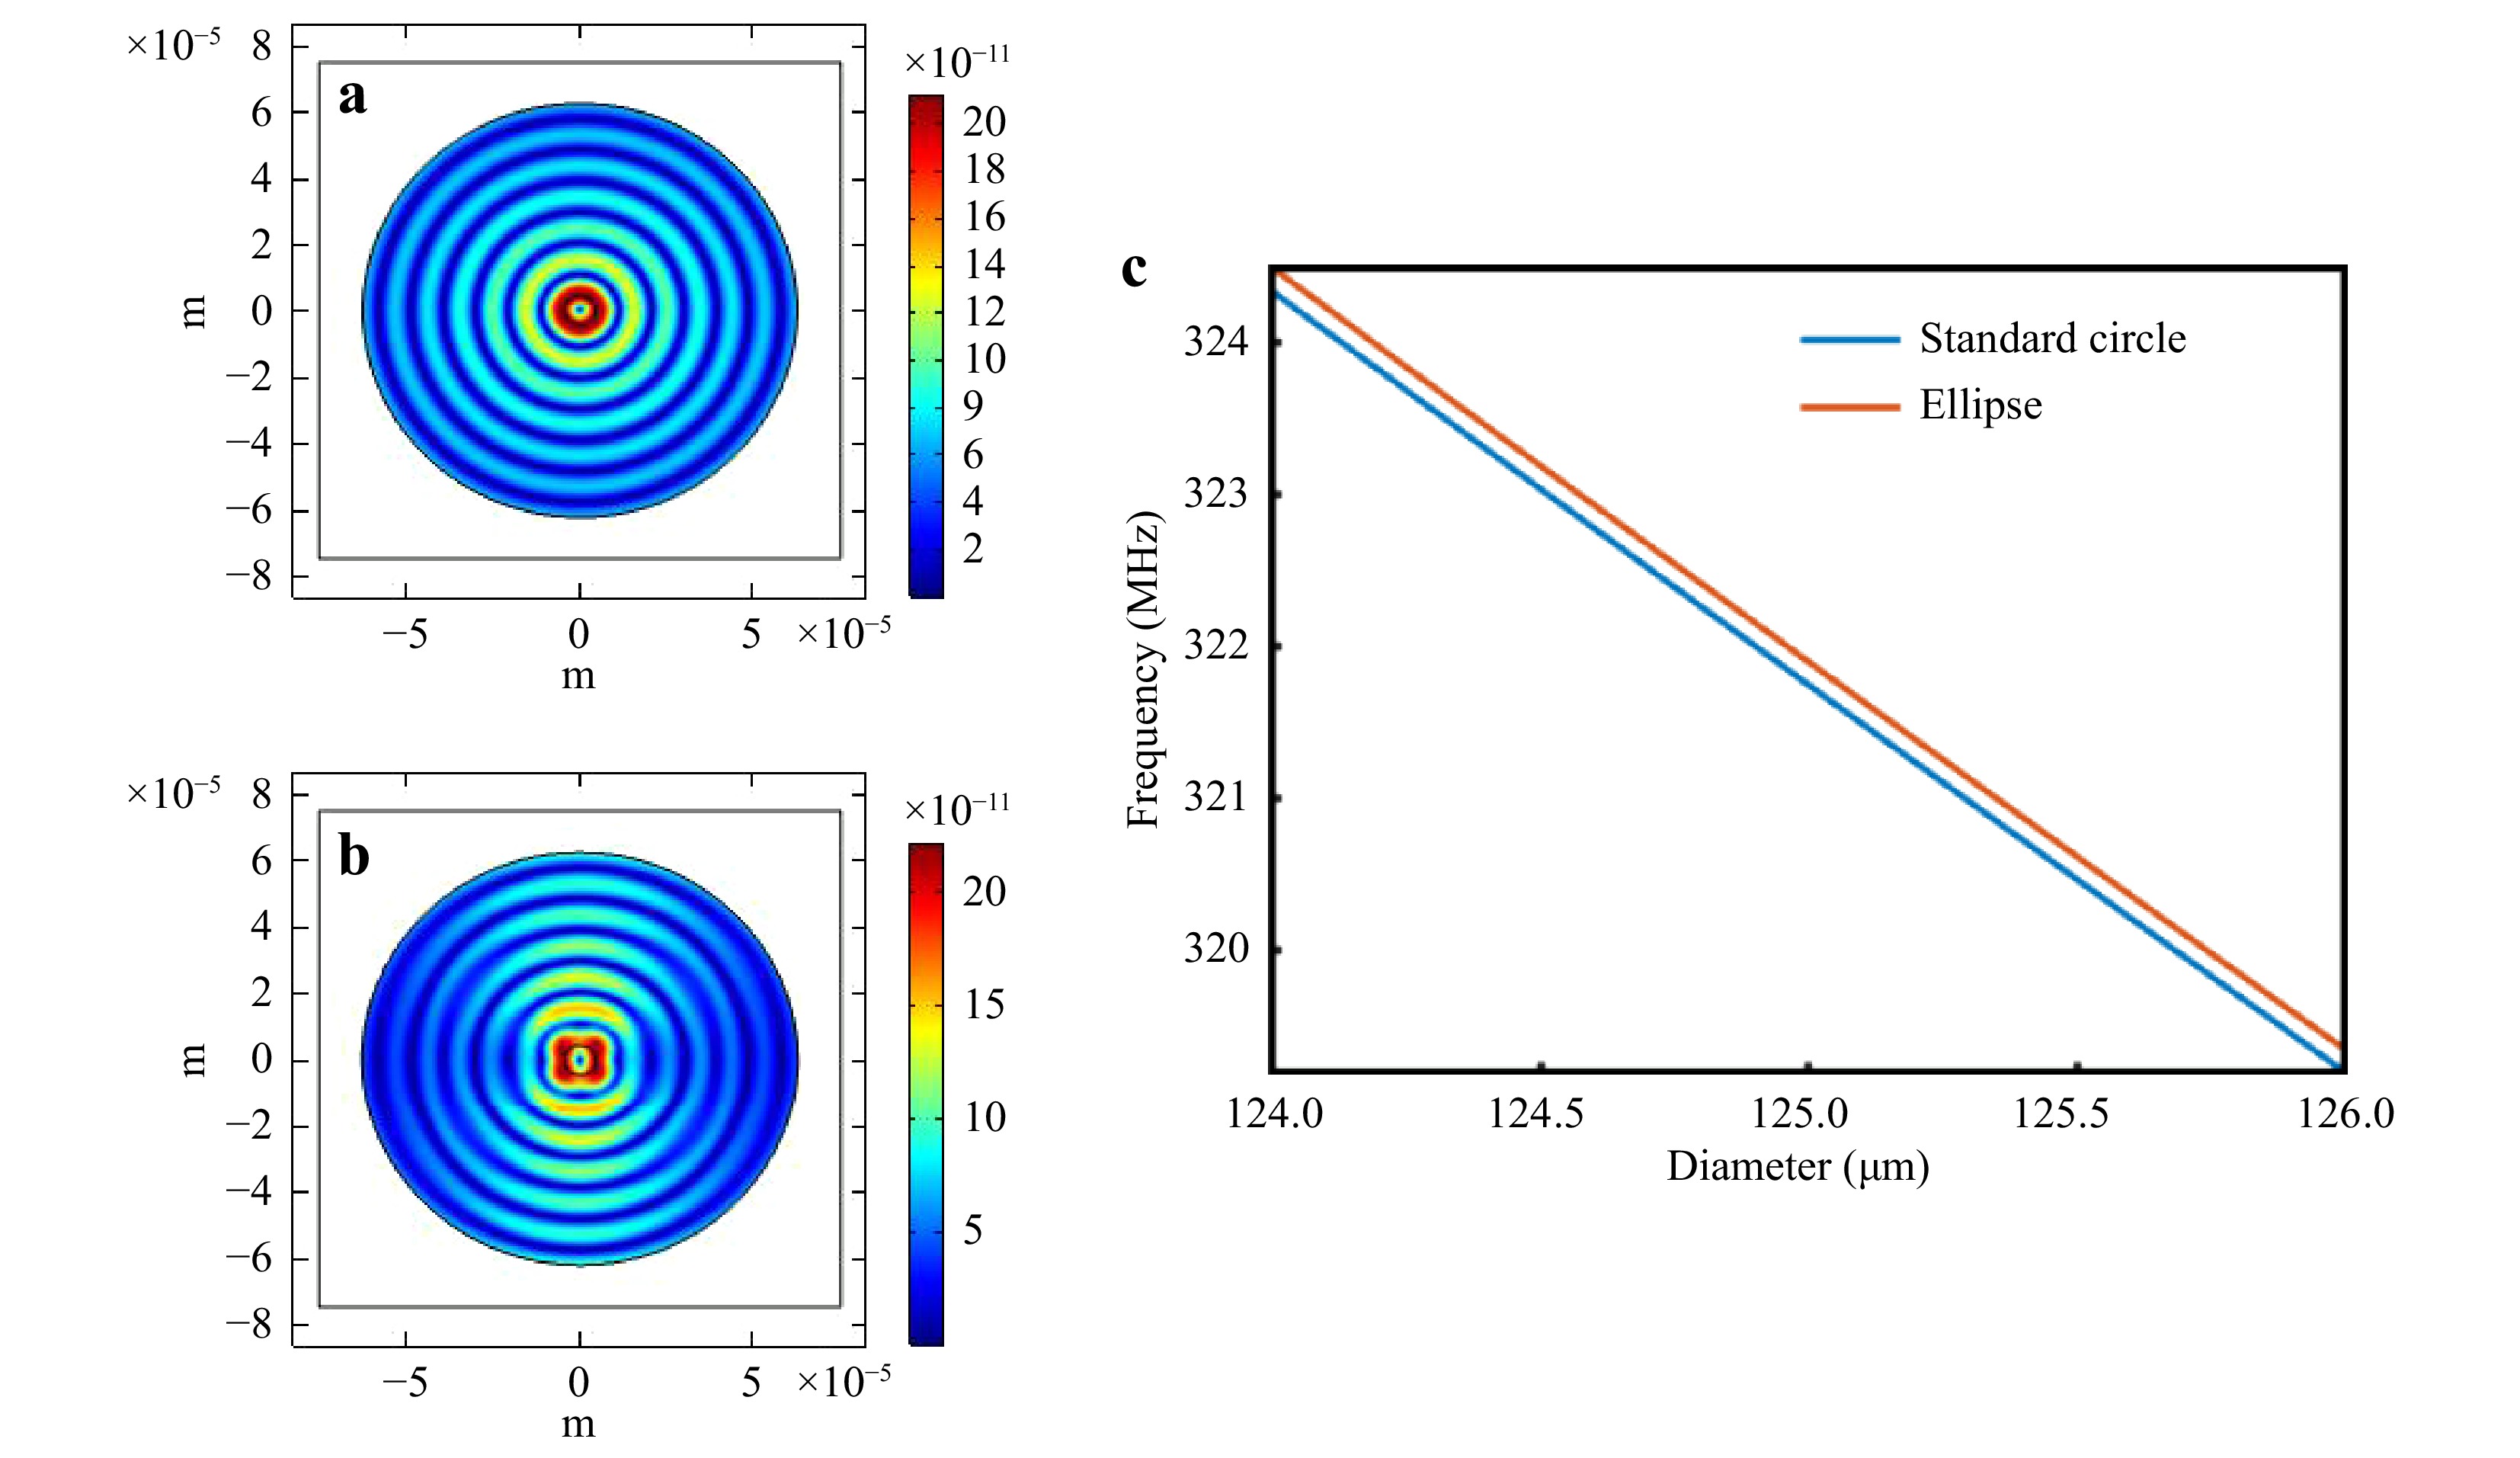
Fig. 1 Displacement distribution of the R07 mode when the non-circularity of fiber cross section is a 0; b 0.005 and c dispersion relation between frequency and diameter.
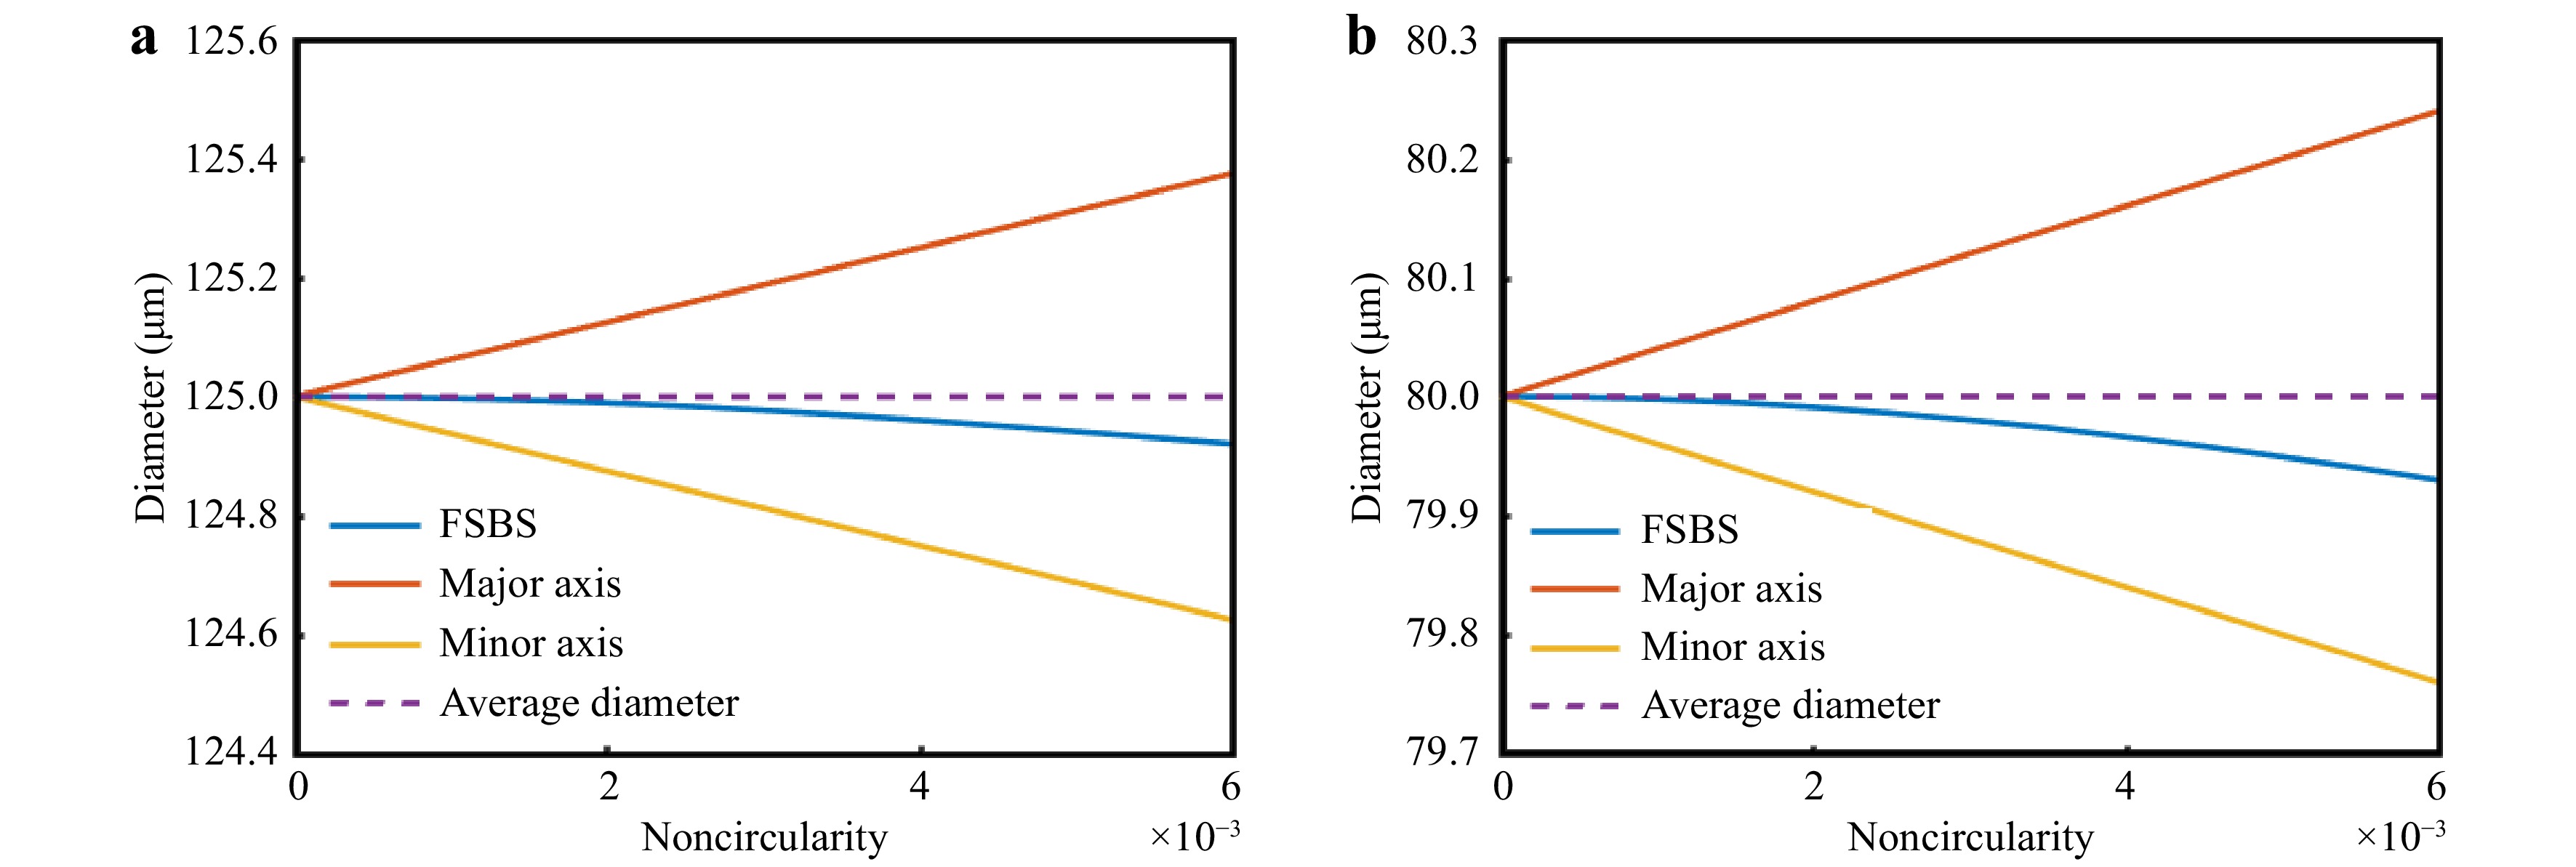
Fig. 2 Diameter extraction by FSBS under distinct non-circularities.
a 125-μm fiber; b 80-μm fiber. -
To measure the distributed FSBS resonant frequency and calculate the diameter profile, we used an optimized OMTDA system, as illustrated in Fig. 3a. The core of the OMTDA is the coherent FSBS, whose schematic diagram is shown in Fig. 3b. A long activation pulse containing beats of frequency
$ {f}_{m} $ around the FSBS resonant frequency$ {f}_{0m} $ stimulates the R0m mode to a steady state. This is followed by a short probing pulse with two sidebands with a frequency difference$ {f}_{m} $ for probing the resonant frequency. The probing pulse interacts with the pre-excited R0m mode, causing an intensity evolution of both sidebands. By recording the sidebands through the linear mapping relationship between the backward Brillouin gain of detecting light and the pump intensity under a small gain approximation27, the absolute value of the distributed diameter profile can be demodulated with the help of backward stimulated Brillouin scattering. The probing process coherently strengthens the activated acoustic wave and enhances the signal-to-noise ratio (SNR). The extra frequency shift$ {f}_{1} $ , which is loaded onto the activation pulse to differentiate from the probing process, is a beneficial feature. Similar to the conventional BOTDA system29, the input light, produced by a narrow linewidth laser source with a wavelength of 1550 nm and output power of 100 mW, is divided into upper and lower branches via a 50/50 optical fiber coupler. The upper branch, containing 50% of the laser power, generates the activation and probing pulses involved in the FSBS process using an arbitrary waveform generator (AWG, Tek AWG70001A), which imposes the RF pulse signal onto the light wave through electro-optic modulator 1 (EOM1) under the suppressed carrier condition. The RF pulse consists of two parts. The longer part (1.5 μs), which acts as the activation pulse, contains two frequencies$ {f}_{1} $ and$ {{f}_{1}+f}_{m} $ , and therefore adds four frequency components to the light wave. The influence of the activation pulse is completely removed in the following acoustic wave probing process by adjusting the extra frequency$ {f}_{1} $ is adjusted to 1.5 GHz. The shorter 10 ns part of the RF pulse is a single frequency pulse, which creates two frequency components of the light wave. Considering the phase sensitivity of FSBS, a shorter pulse is injected into the fiber under test (FUT) following a longer pulse in the time sequence, ensuring zero phase difference between the two pulses at the conjugation and maximum energy transfer efficiency. The peak power of the pulses is amplified to 1.5 W via an erbium-doped fiber amplifier (EDFA) and injected into the FUT through port 1 of the circulator. Notably, a high-speed orthogonal polarization scrambler (PS) accompanied by polarization controller 2 (PC2) was used to smooth and stabilize the BOTDA traces, making them immune to polarization fading and fluctuation. Compared to the scheme in Ref. 27, which used a random PS, both the averaging times and polarization noise were reduced. Here, averaging was performed only 2000 times. In the lower branch that originates from the other 50% port of the coupler, a microwave generator (MG, Agilent E8257D) applies a microwave signal with a frequency approximately equal to the Brillouin frequency shift of the FUT ($ {\nu }_{B} $ ~11 GHz) to the EOM2, which is also in the carrier suppressed state, creating two sidebands on the light wave. Next, optical filter 1 (OF1) is used to filter out the carrier, while the lower sideband with the Stokes component is retained. Then, ~80 μW of detecting light was injected into the FUT via an isolator (ISO) in opposite directions. The sideband was adjusted to fall within the Brillouin amplification of the probing pulse. In contrast to the previous work, where the sweeping frequency of the microwave signal covered the Brillouin gain domain, we optimized the system by locking the frequency of the detecting light. This is appropriate because the temperature and strain in the fiber remained stable during the measurement of fiber diameter. Specifically, the upper and lower sidebands of the probing pulse were recorded separately by locking the detecting light to distinct frequencies. When the microwave frequency was equal$ {{\nu }_{B}+f}_{m}/2 $ , the upper sideband is detected via the BSBS effect with the detecting light. Similarly, the detection results of FSBS on the lower sideband correspond to the microwave frequency$ {{\nu }_{B}-f}_{m}/2 $ . Combining the optimization of frequency sweeping and polarization scrambling, we effectively reduced the measurement time by approximately 50 times, suppressed the interference caused by changes in temperature and system stability over time, and achieved a higher SNR along with a better spatial resolution of 1 m. The detection of light containing frequency shift information passed through the FUT and exits from port 3 of the circulator. Subsequently, OF2 with a narrow bandwidth of 3.7 GHz was placed to remove additional noise such as the Rayleigh scattering signal and amplified spontaneous emission, whose passband covers the components in detecting light and rejects the reflected and Rayleigh scattered signals of the activation and probing pulses. Finally, the output Brillouin signal was recorded by a photodetector with a bandwidth of 300 MHz and a data acquisition card with a sampling rate of 2GS s−1.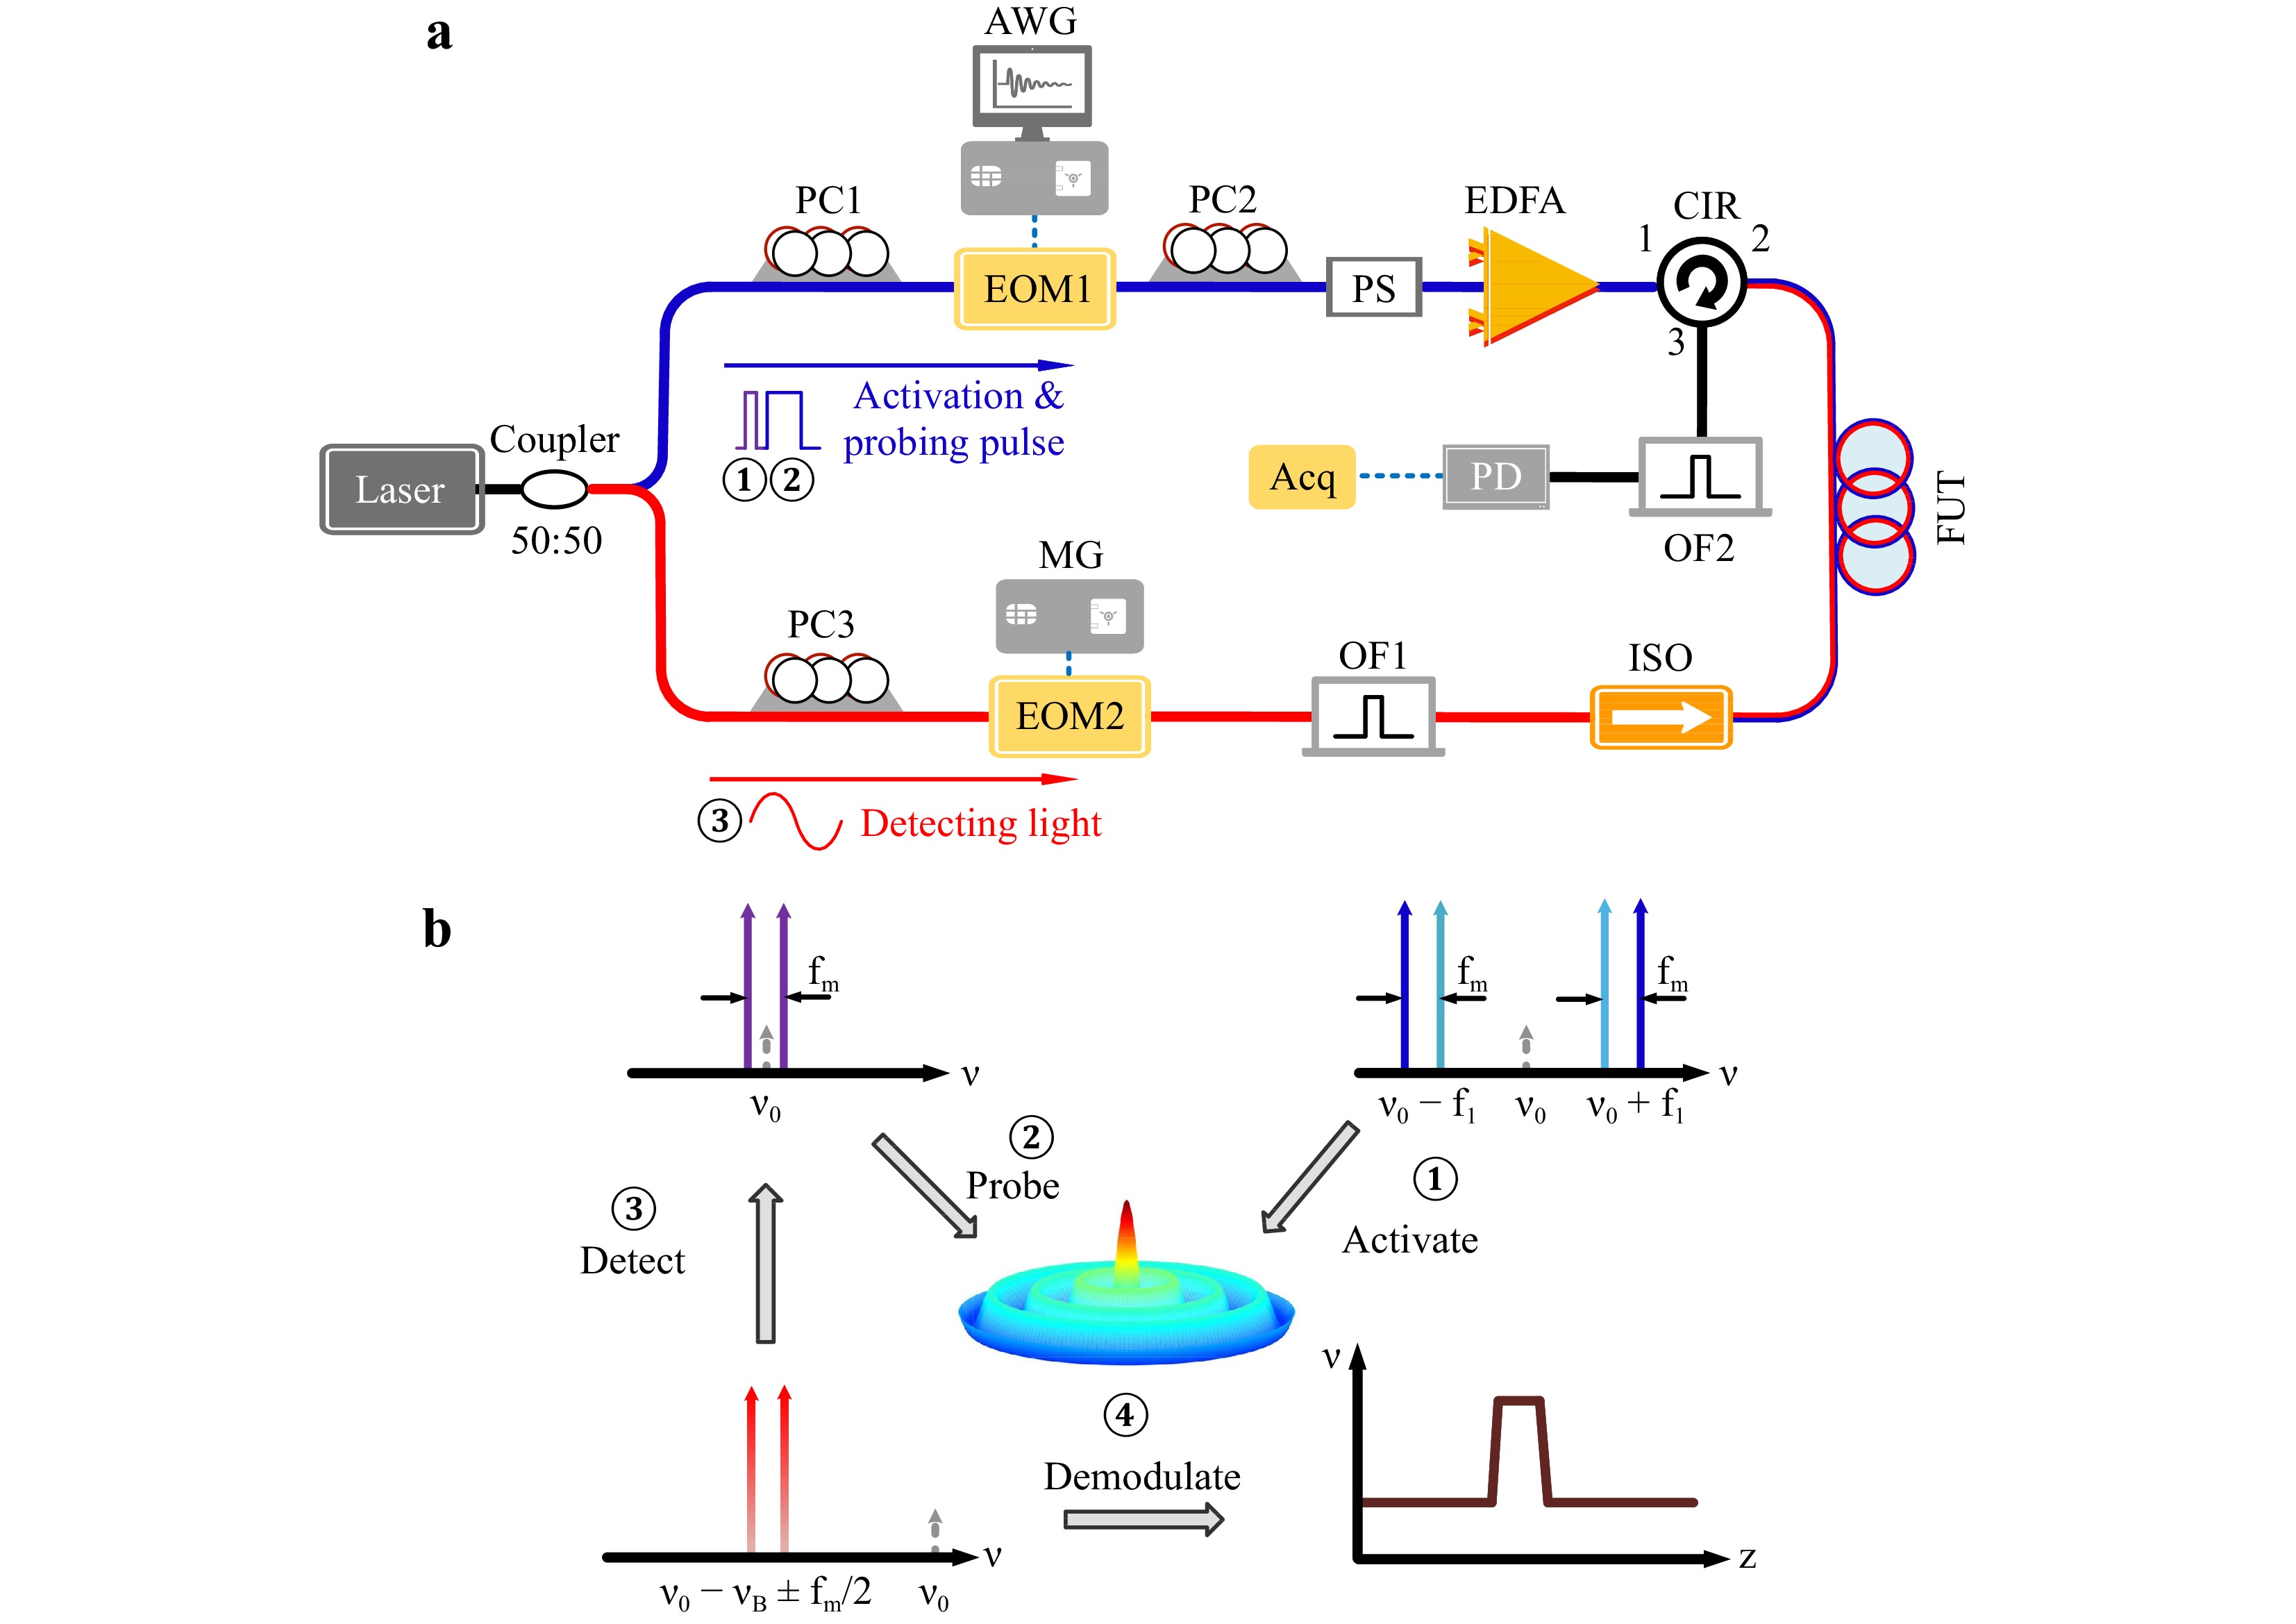
Fig. 3
a Experimental configuration for the optimized OMTDA system. EOM, electro-optic modulator; AWG, arbitrary-waveform generator; PC, polarization controller; PS, orthogonal polarization scrambler; MG, microwave generator; EDFA, erbium-doped fiber amplifier; CIR, circulator; FUT, fiber under test; OF, optical filter; ISO, optical isolator; PD, photodetector; Acq, data acquisition module. b Basic principle of the OMTDA. -
The cylindrical structure of the fibers can support the existence of multiple transverse acoustic modes, which can be divided into two categories: radial mode, R0m, and torsional-radial mode, TR2m, where m denotes the order of the acoustic modes. The purely radial mode, R0m, is fully symmetrical and causes pure phase modulation of the light wave. It is considered the main source of FSBS in fibers with a circular cross section. Thus, we only consider the FSBS induced by the R0m mode, and neglect the influence of TR2m. The strength of the FSBS involving the mth-order radial acoustic waves is determined by the overlap integral of the light wave and acoustic wave30,31. In particular, both optical and mechanical properties, such as the mode field diameter and geometry of the fiber cross-section influence the FSBS spectral line shape and frequency distribution. The intensity of each FSBS spectrum is given by the accumulated energy transfer between the upper and lower frequencies of the probing pulse, as given by
$ {ln[P}_{l}\left(z\right)/{P}_{u}\left(z\right)] $ . The simulated and measured FSBS distributions and intensities at the end of each FUT ranging from 100 MHz to 520 MHz are illustrated in Fig. 4. A near-perfect match between the simulation and experimental measurements can be observed from the multiple discrete peaks that reveal FSBS resonances induced by distinct acoustic modes in addition to the slight differences in relative peak intensity induced by the differences in the optical and mechanical properties of the FUTs involved. The FSBS intensity distribution of the 80-μm fiber is sparser than that of the 125-μm fiber, because the larger frequency interval between each peak corresponds to the inverse of the shorter round-trip time for sound waves propagating across the fiber. The frequency intervals are 47.97 MHz and 74.95 MHz for the fibers with diameters of 125 μm and 80 μm, respectively. Fig. 4 contains eight peaks representing the acoustic modes R03–R10 for the 125-μm fiber. However, the coverage for the 80-μm fiber shrinks to six peaks, of which the acoustic mode orders are from 2 to 7 over the same frequency range. We chose one of the most prominent peaks within the distribution for further investigation. For the 125-μm fiber, the peak corresponding to R07 is the strongest, and its frequency is approximately 322 MHz. Although the peak for R06 in the 80-μm fiber is the strongest, we chose the peak corresponding to R07 so that the order of the involved acoustic mode would not deviate far from the acoustic mode chosen for the 125-μm fiber while maintaining sufficient intensity.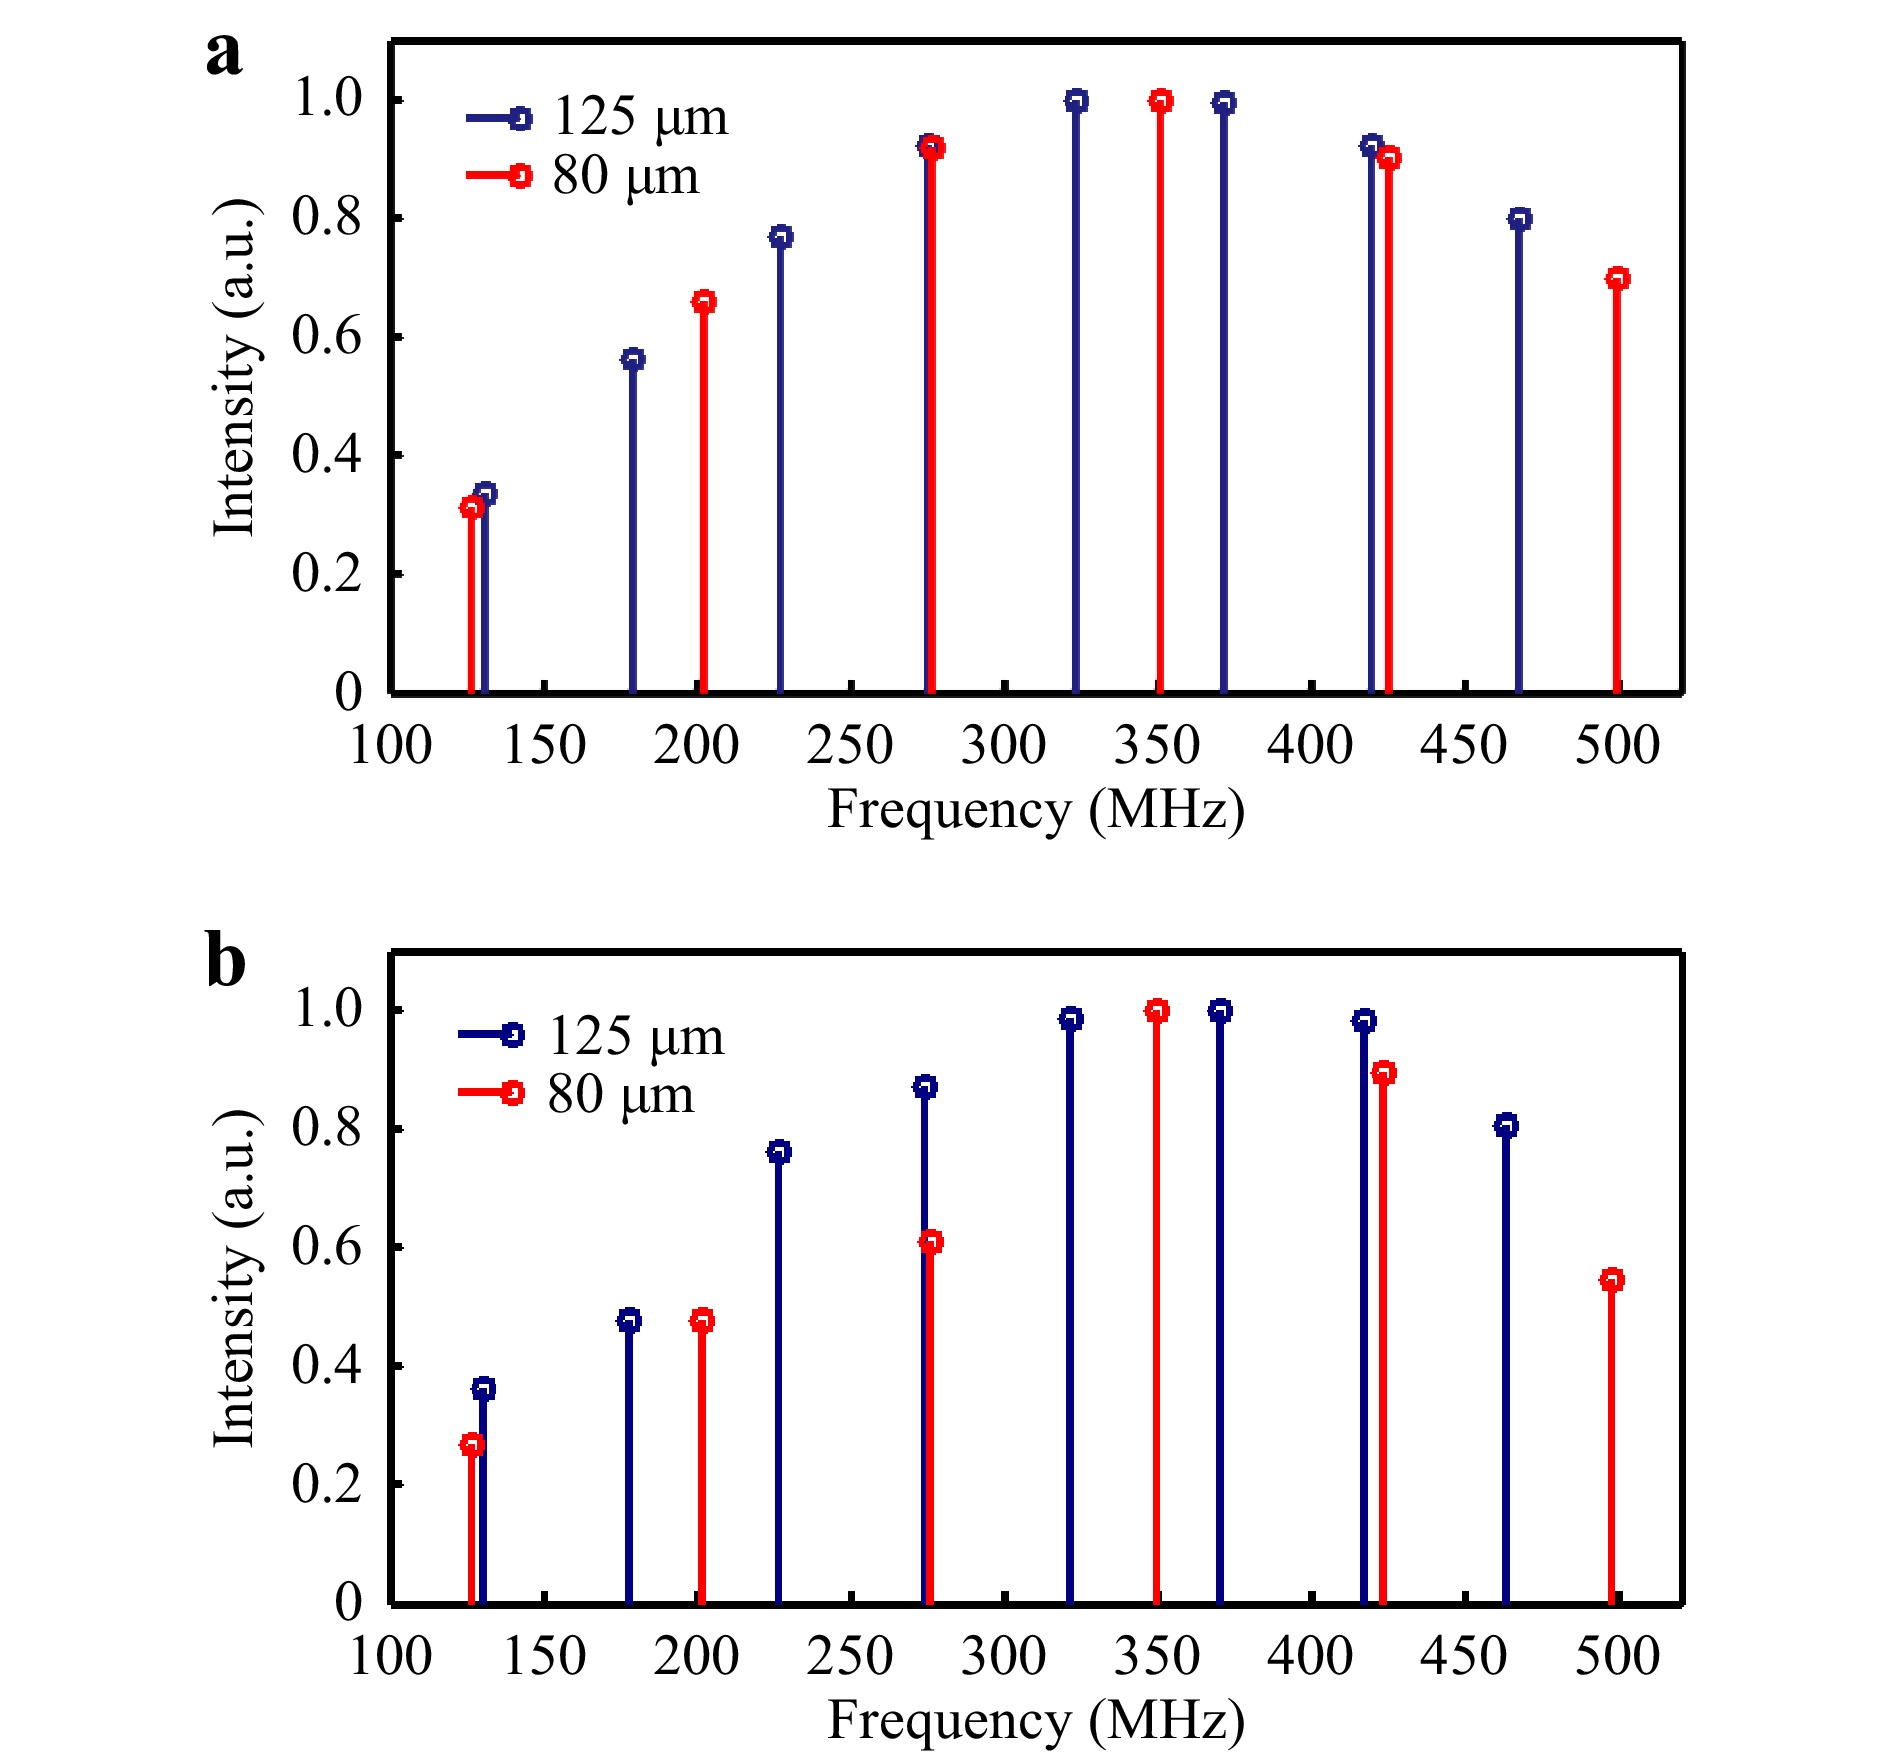
Fig. 4 FSBS frequency distribution and strength of different acoustic modes.
a Simulation of the FSBS distributions for 125-μm (blue circles and bars) and 80-μm (red circles and bars) fibers, based on acousto-optic integral. b Experimentally measured FSBS distributions and intensities for both fibers. -
We first investigated the diameter measurements of the 125-μm fiber based on the FSBS resonance of R07, as mentioned above. For the initial FUT, the location-dependent normalized 3D map of the distributed FSBS spectra obtained by sweeping the frequency from 321 MHz to 326 MHz with a fine step of 10 kHz is shown in Fig. 5a. The observed spectra benefit from the optimization of the OMTDA system, along with the obvious air-cladding impedance difference; thus, the FSBS spectrum exhibits an extremely narrow linewidth and relatively high SNR, enabling high-resolution diameter measurements. The FUT was then etched at different locations (see Materials and Methods). The resulting 3D FSBS spectra are illustrated in Fig. 5b, with obvious frequency shifts in the three etched sections.We fitted the measured distribution spectra with a Lorentzian lineshape to obtain the central frequencies along the FUT before and after etching, as shown in Fig. 6a. The step-like frequency trace of the etched fiber coincides with the curve corresponding to the original fiber at the unetched position. The representative spectra at positions marked in Fig. 6a as A, B, C, and D are presented in Fig. 6b, with central frequencies of 322.571, 324.397, 325.868, and 327.933 MHz, respectively. Despite slight differences in the linewidths of the spectral peaks resulting from the non-uniform etching of the cladding surface, which causes the cross-section to deviate from a perfect circle, the differences are too small to affect the accuracy of the fitting. The maximum linewidth was 0.671 MHz at B, while the minimum was 0.473 MHz at A, resulting in a degradation of the fitting uncertainty from 0.002 MHz to 0.003 MHz. The linewidths of the spectra at C and D were 0.537 MHz and 0.513 MHz, respectively.
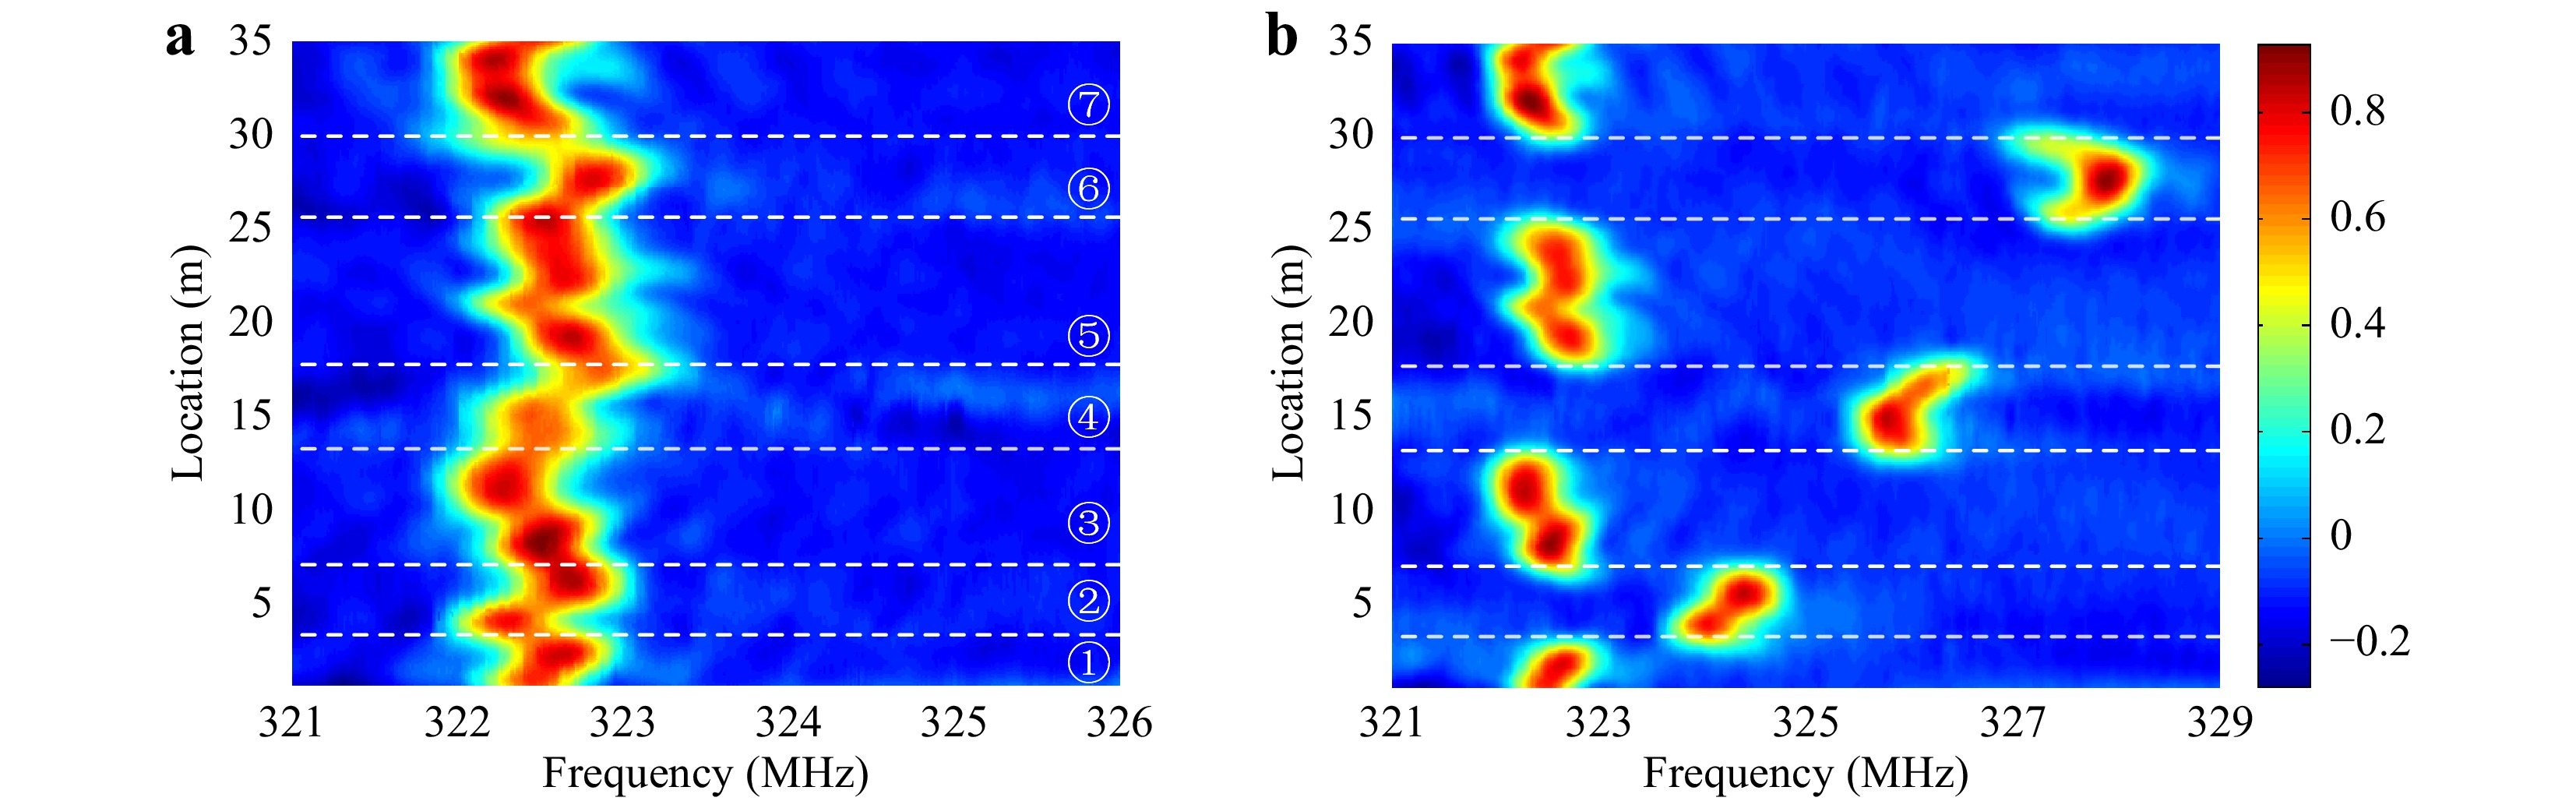
Fig. 5 Distributed FSBS spectra of the a initial and b etched 125-μm fiber.
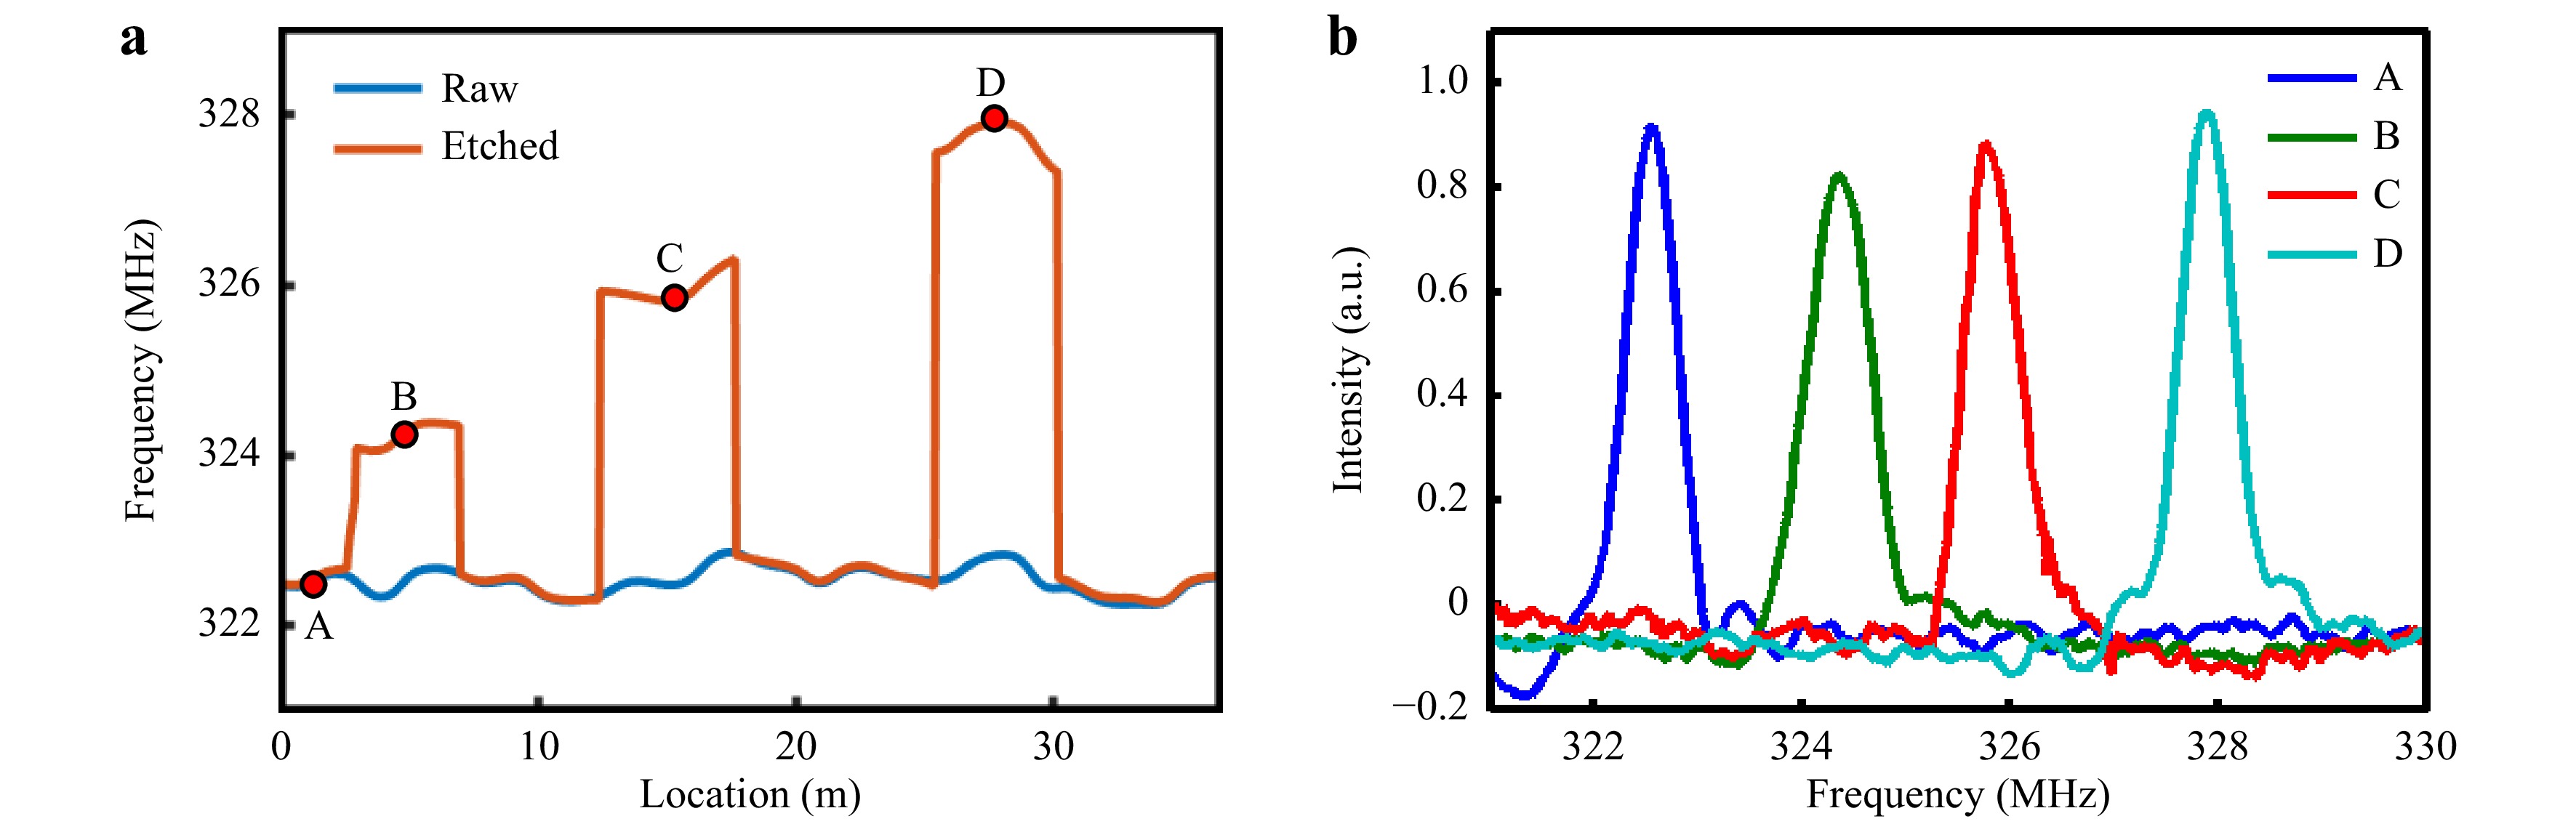
Fig. 6
a Fitted FSBS resonant frequency distribution along the 125-μm FUT. b FSBS spectrum at the axial locations 1.5, 5, 15, and 27 m along the FUT.First, we assume that the fiber cross-section is a perfect circle. According to the measured FSBS spectra, we demodulated the fiber diameter distribution within the sensing range using Eq. 1. Fig. 7 presents the changes in the absolute diameter for both the raw and etched fibers (Fig. 7a) and the resulting relative diameter variation from the difference between the diameters of the raw and etched fibers (Fig. 7b). The intrinsic diameter of the unetched fiber is approximately 125.3 μm. In addition, an intrinsic diameter fluctuation within 250 nm was observed with a maximum diameter of 125.42 μm and a minimum diameter of 125.18 μm. This is expected to result from optical fiber processing. At the etched regions, the diameters are smaller, as expected, and the curve of the relative diameter variation is basically flat, reflecting uniform etching along the treated fiber lengths.
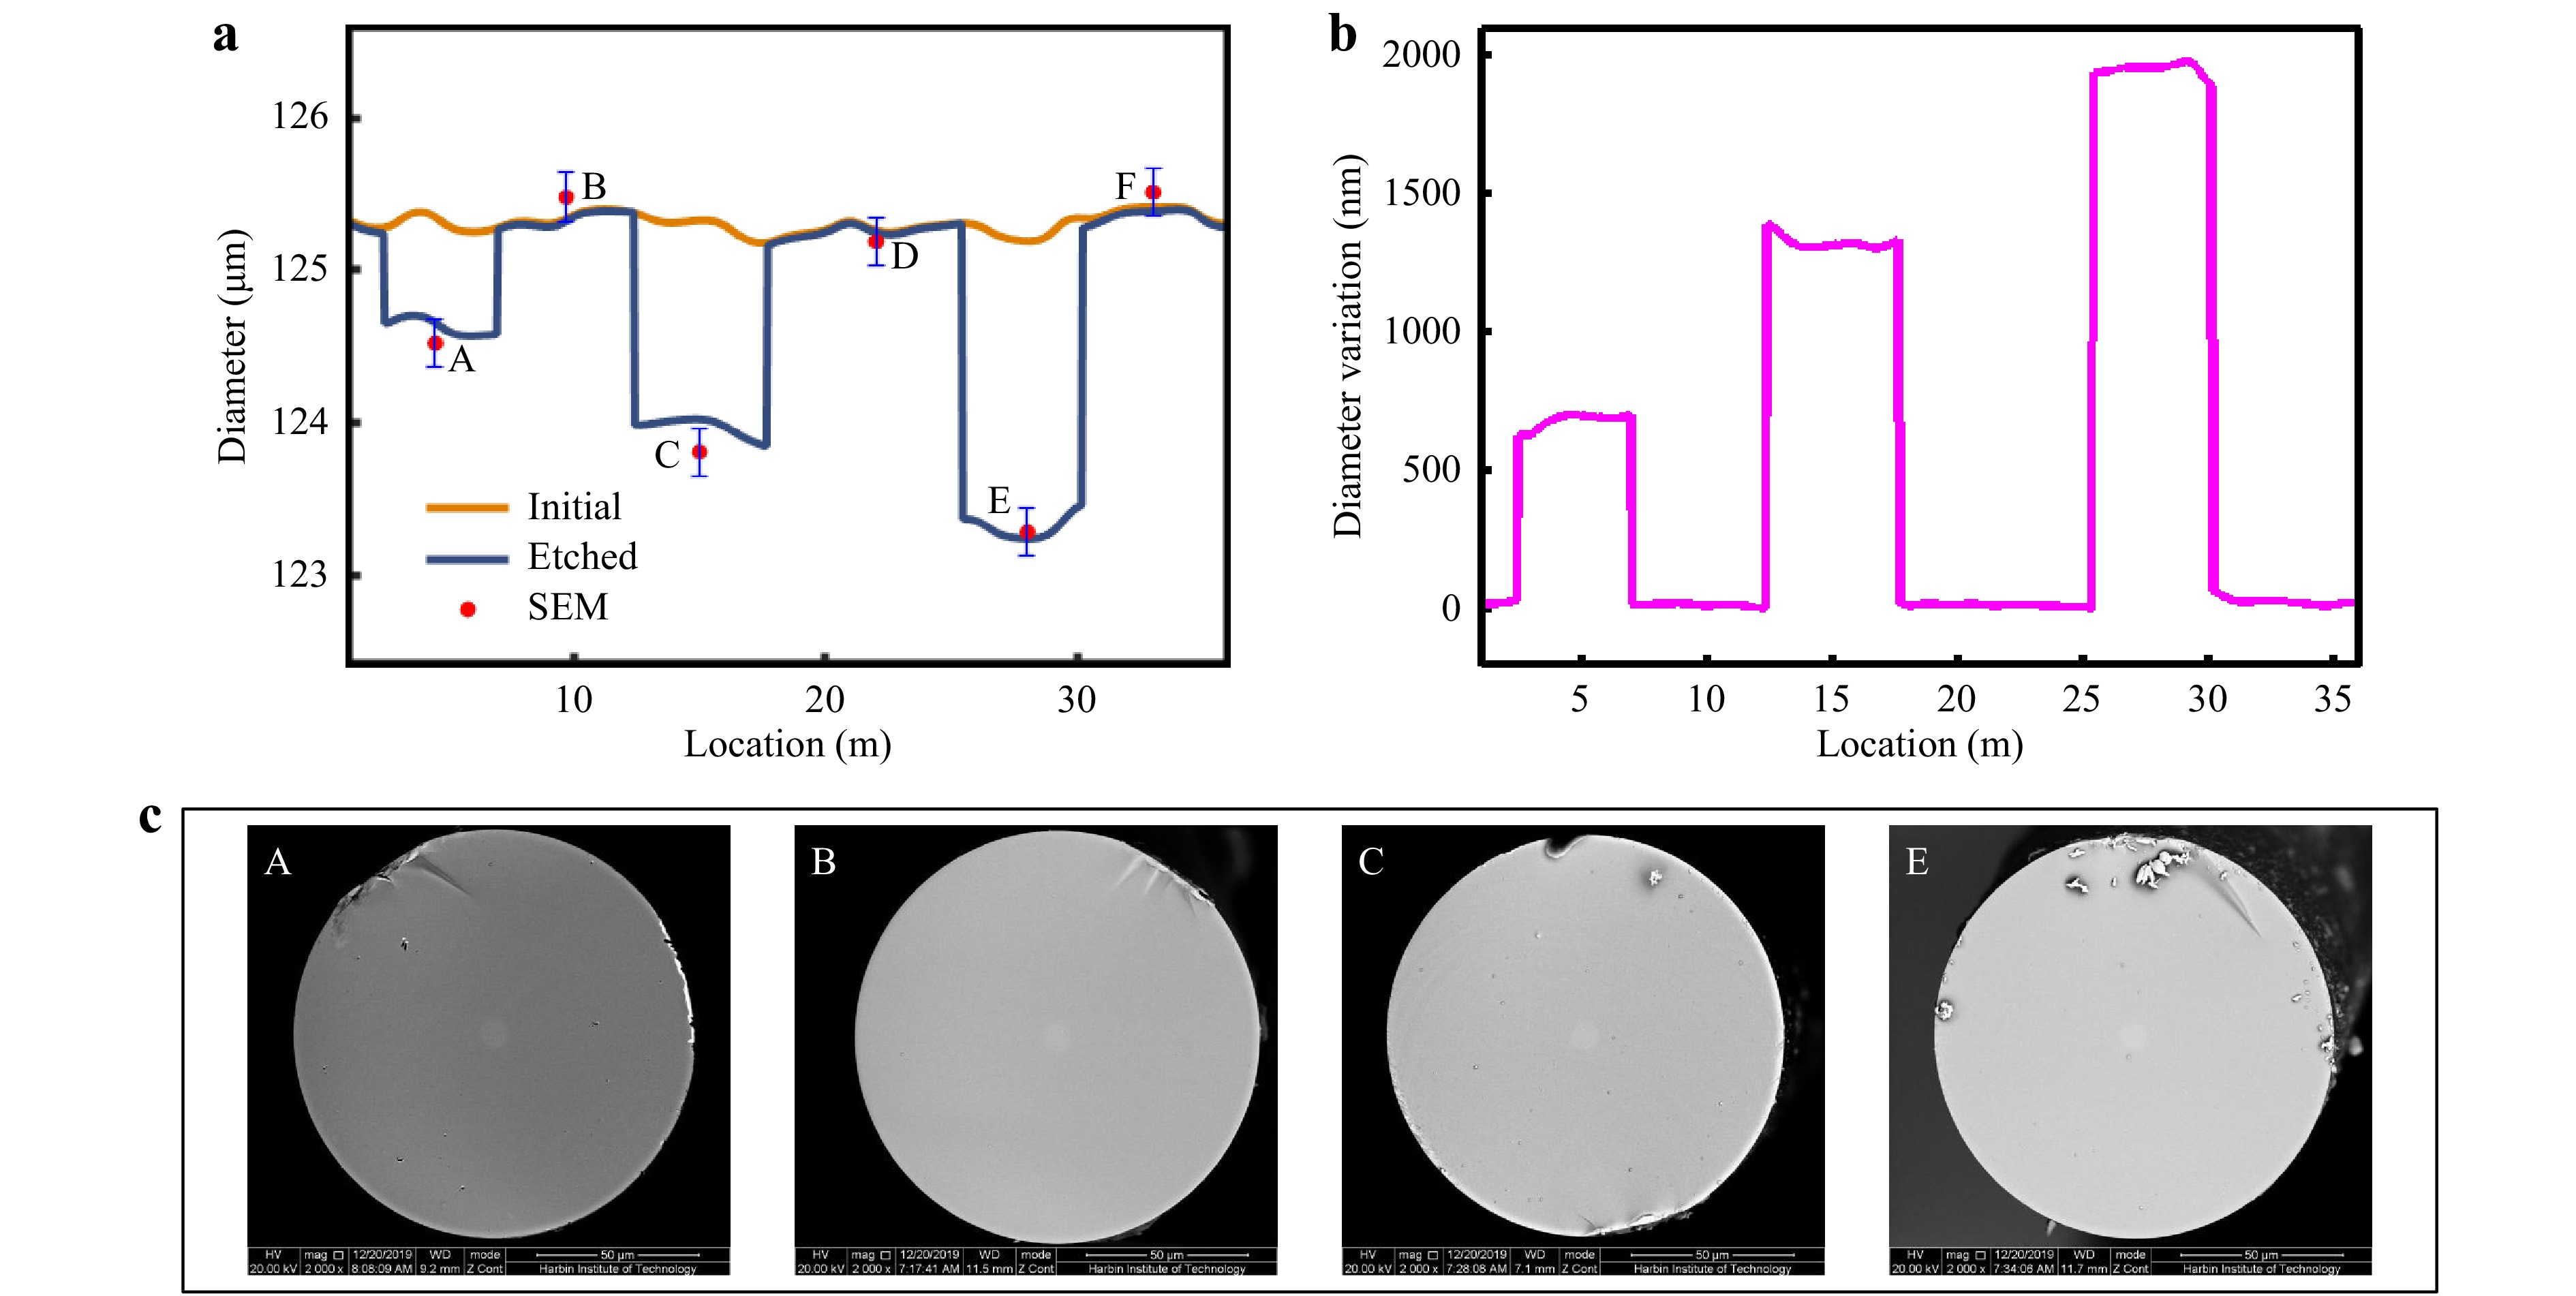
Fig. 7 Results of distributed diameter measurements on the 125-μm fiber.
a Demodulated diameter distribution before and after etching and its comparison with the SEM results (A-F). b Diameter variations along the FUT. c Four representative images of the fiber cross section at A ,B, C and E in a captured by SEM.In addition, we conducted a controlled experiment in which snapshots of fiber cross-sections taken by a SEM were analyzed to verify the accuracy of the measurements by our scheme (Fig.7, Materials and Methods). When the sample is a 125-μm fiber, the resolution reaches 159.1 nm. The dots and error bars in Fig. 7a represent the diameters and their uncertainties obtained by SEM using an arc-support line segment algorithm32. Apparently, the SEM-based diameter determinations (red dots) are consistent with the measured FSBS curve, within the uncertainty represented by the error bars. In general, the measurements conducted by the two methods are consistent with each other, verifying the feasibility of distributed fiber diameter measurement with high accuracy in our method.
-
To demonstrate the ability of our scheme to conduct high-resolution distributed measurements with different nominal diameters, we performed an identical procedure on another fiber with a diameter of approximately 80 μm (see Materials and Methods). The normalized 3D maps of the distributed FSBS spectra of the unetched and etched fibers are shown in Fig. 8. The corresponding acoustic mode was R06 with a resonant frequency of approximately 423 MHz. Detailed information about the spectra is presented in Fig. 9, including the fitted central frequency (Fig. 9a) along with the local spectra at the axial positions A, B, C, and D (Fig. 9b). The central frequencies of the four spectra were 423.393 MHz, 425.217MHz, 426.707 MHz, and 427.566 MHz. Notably, the shortest etched section that is fully detectable is 1.5 m, confirming a spatial resolution of 1 m. Similar to the situation of the 125-μm fiber, the raw testing fiber exhibits intrinsic diameter fluctuations as well,
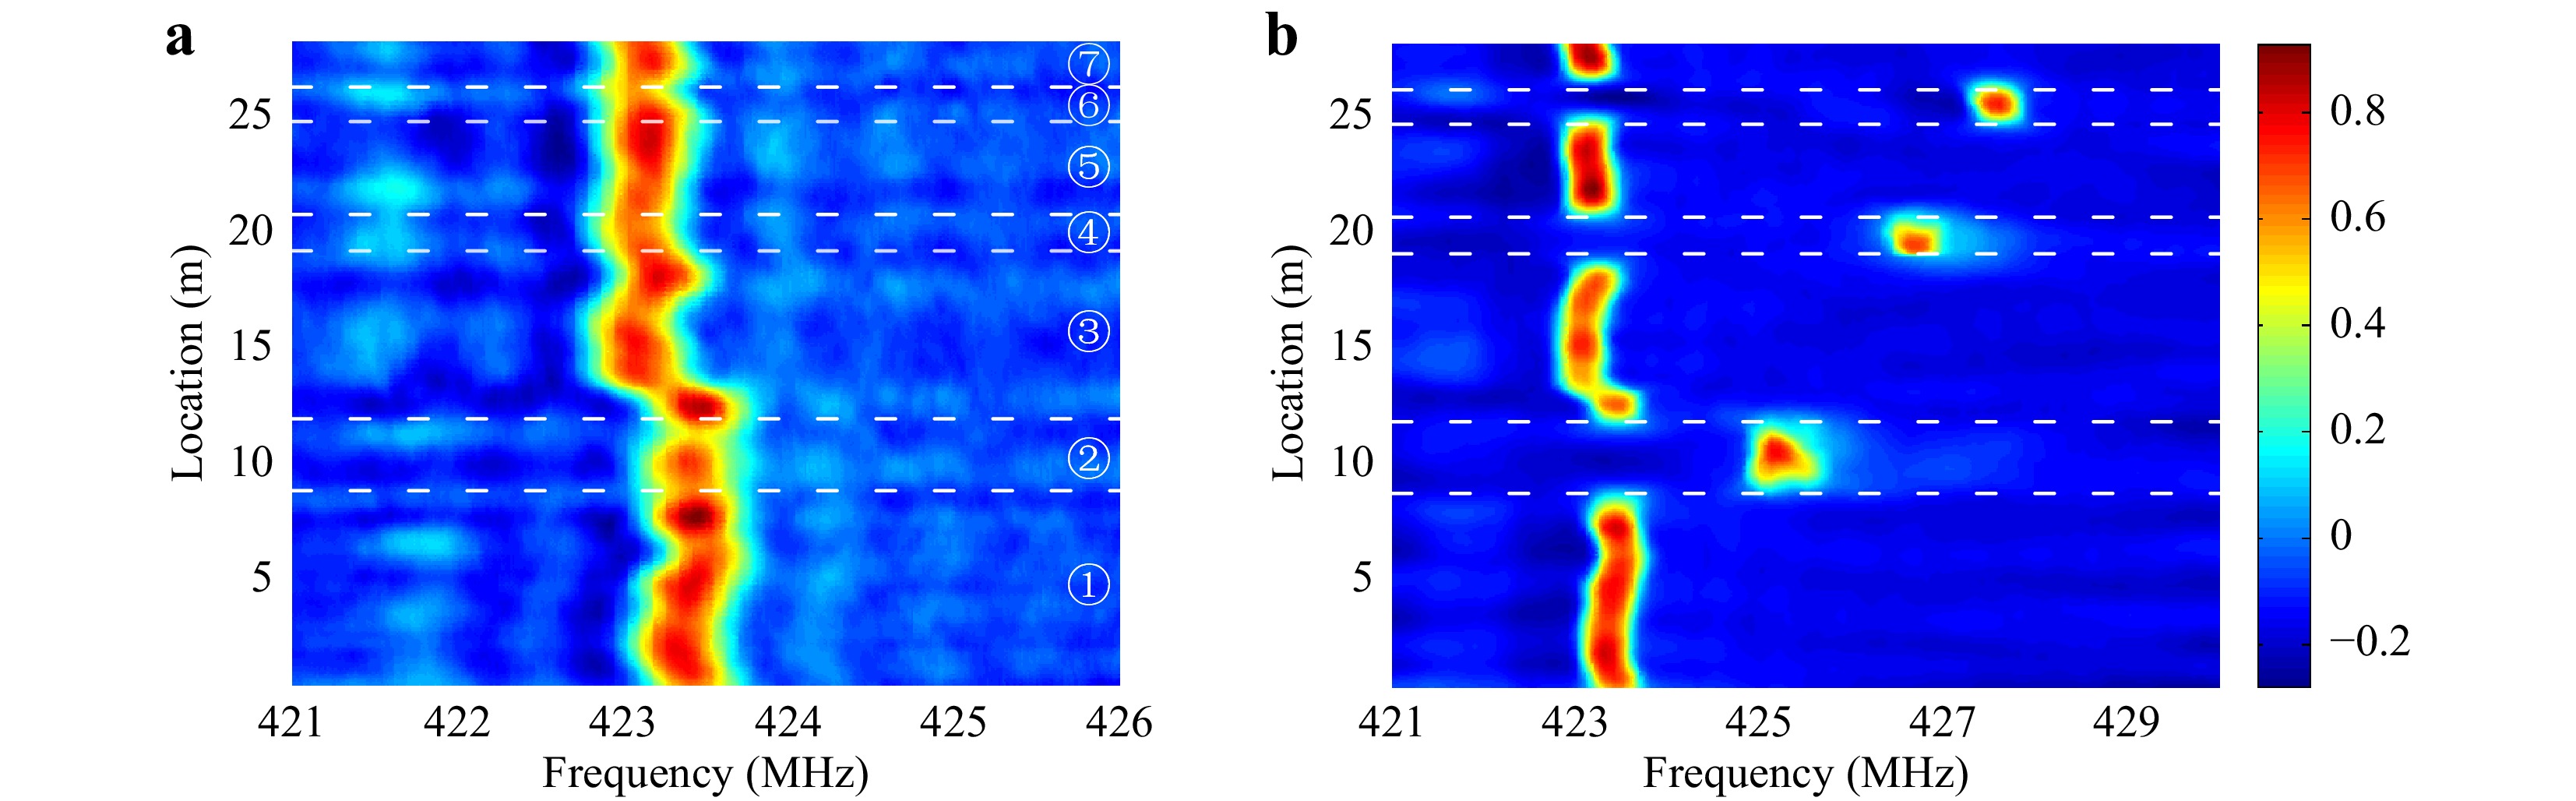
Fig. 8 Distributed FSBS spectra of the a initial and b etched 80-μm fiber.
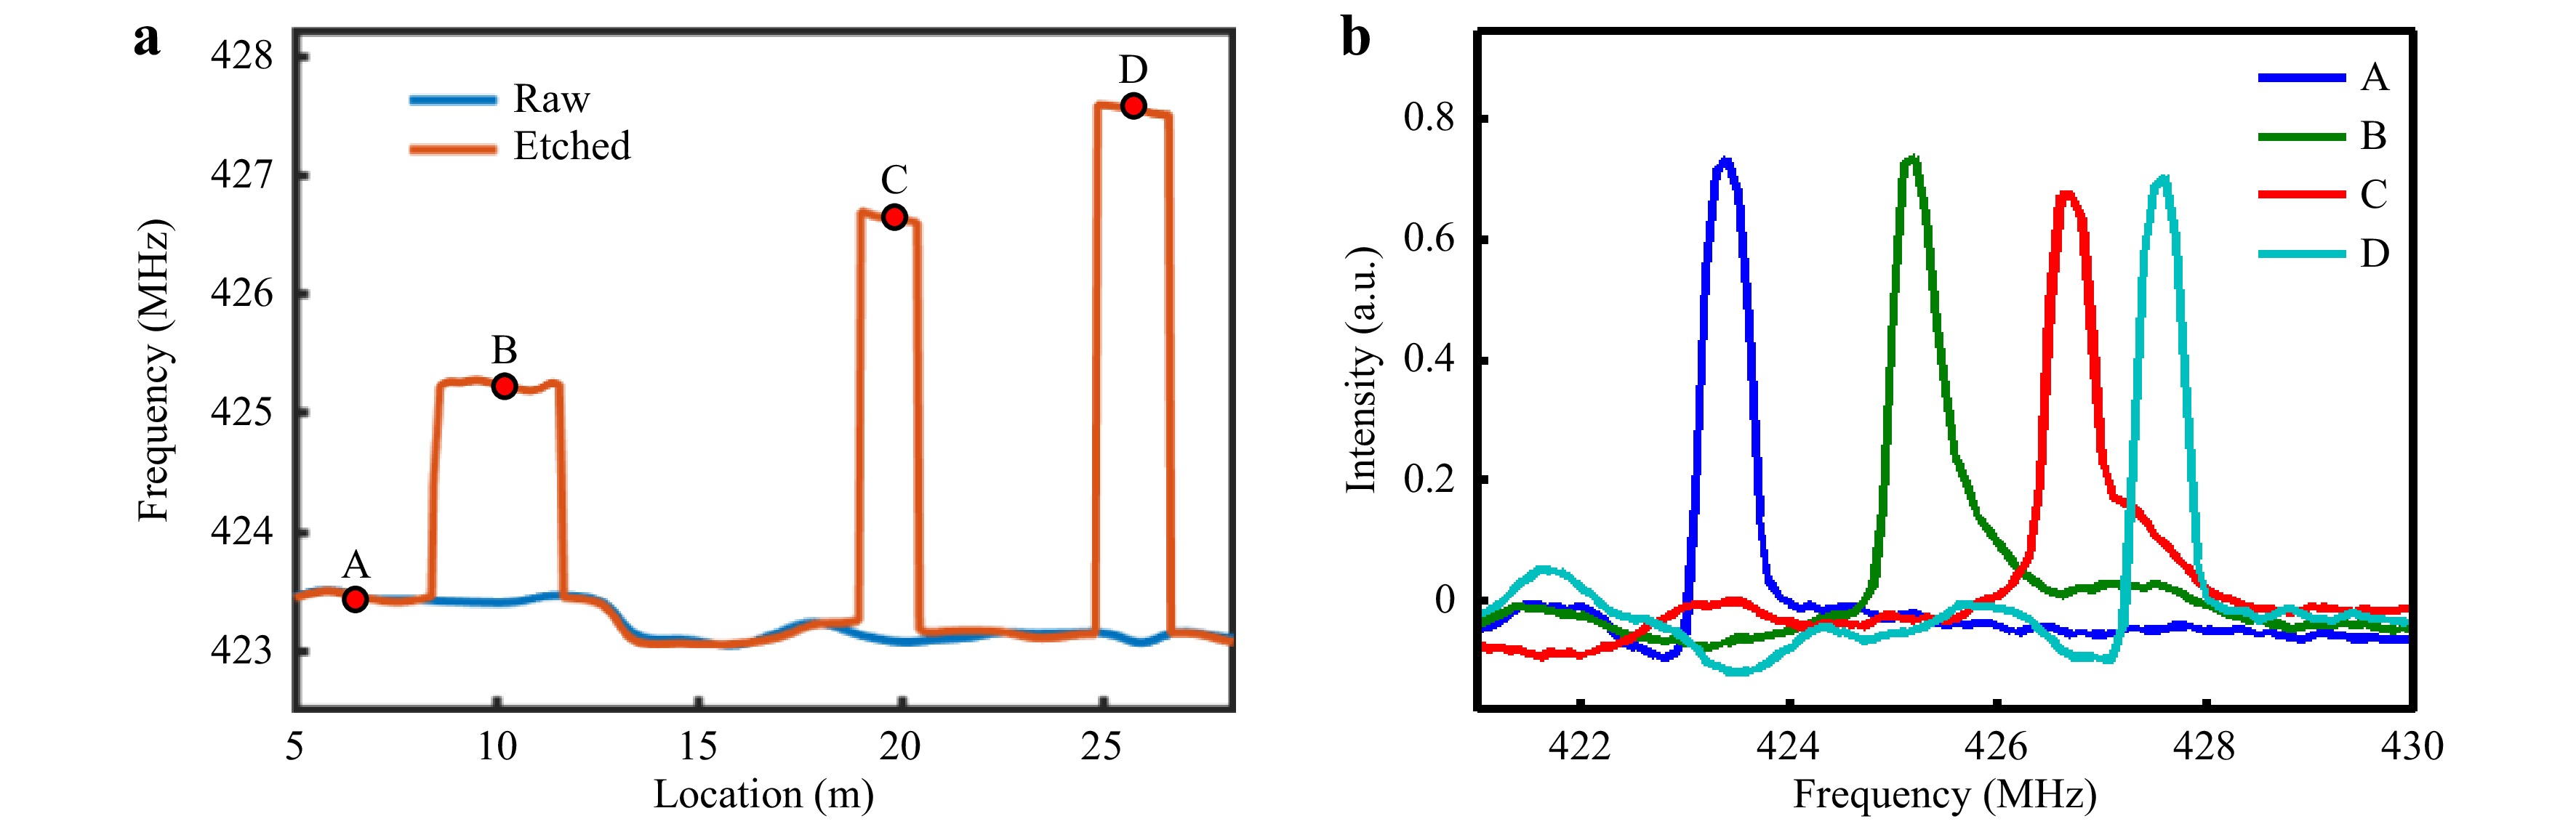
Fig. 9
a Fitted FSBS resonant frequency distribution along the 80-μm FUT. b FSBS spectrum at the FUT axial locations 5, 10, 19, and 26 m.which lie within 100 nm. We further compared the demodulated diameter distribution with high-quality SEM image samples at each typical position (Fig.10, Materials and Methods). The diameters derived by the arc-support line segments are plotted in Fig. 10a and the measurements of both raw and etched FUT using FSBS are represented by solid lines. The basic consistency between the two measurement methods further confirms that our new method can reliably measure the diameters of fibers with different diameter ranges. Notably, the resolution of the SEM results for the 80 μm-diameter fiber is reduced to 106.0 nm, confirming the tradeoff between the resolution and FOV during microscopy. Furthermore, despite the frequency shift being comparable to that of the FSBS spectra of the etched 125-μm fiber, the shorter etching time produces smaller diameter changes along the FUT, as confirmed in Fig. 10b. The etch depths at B, D, and F were 352 nm, 678 nm, and 850 nm, respectively. Fig. 10c shows four examples of SEM images at typical positions A, B, D, and F.
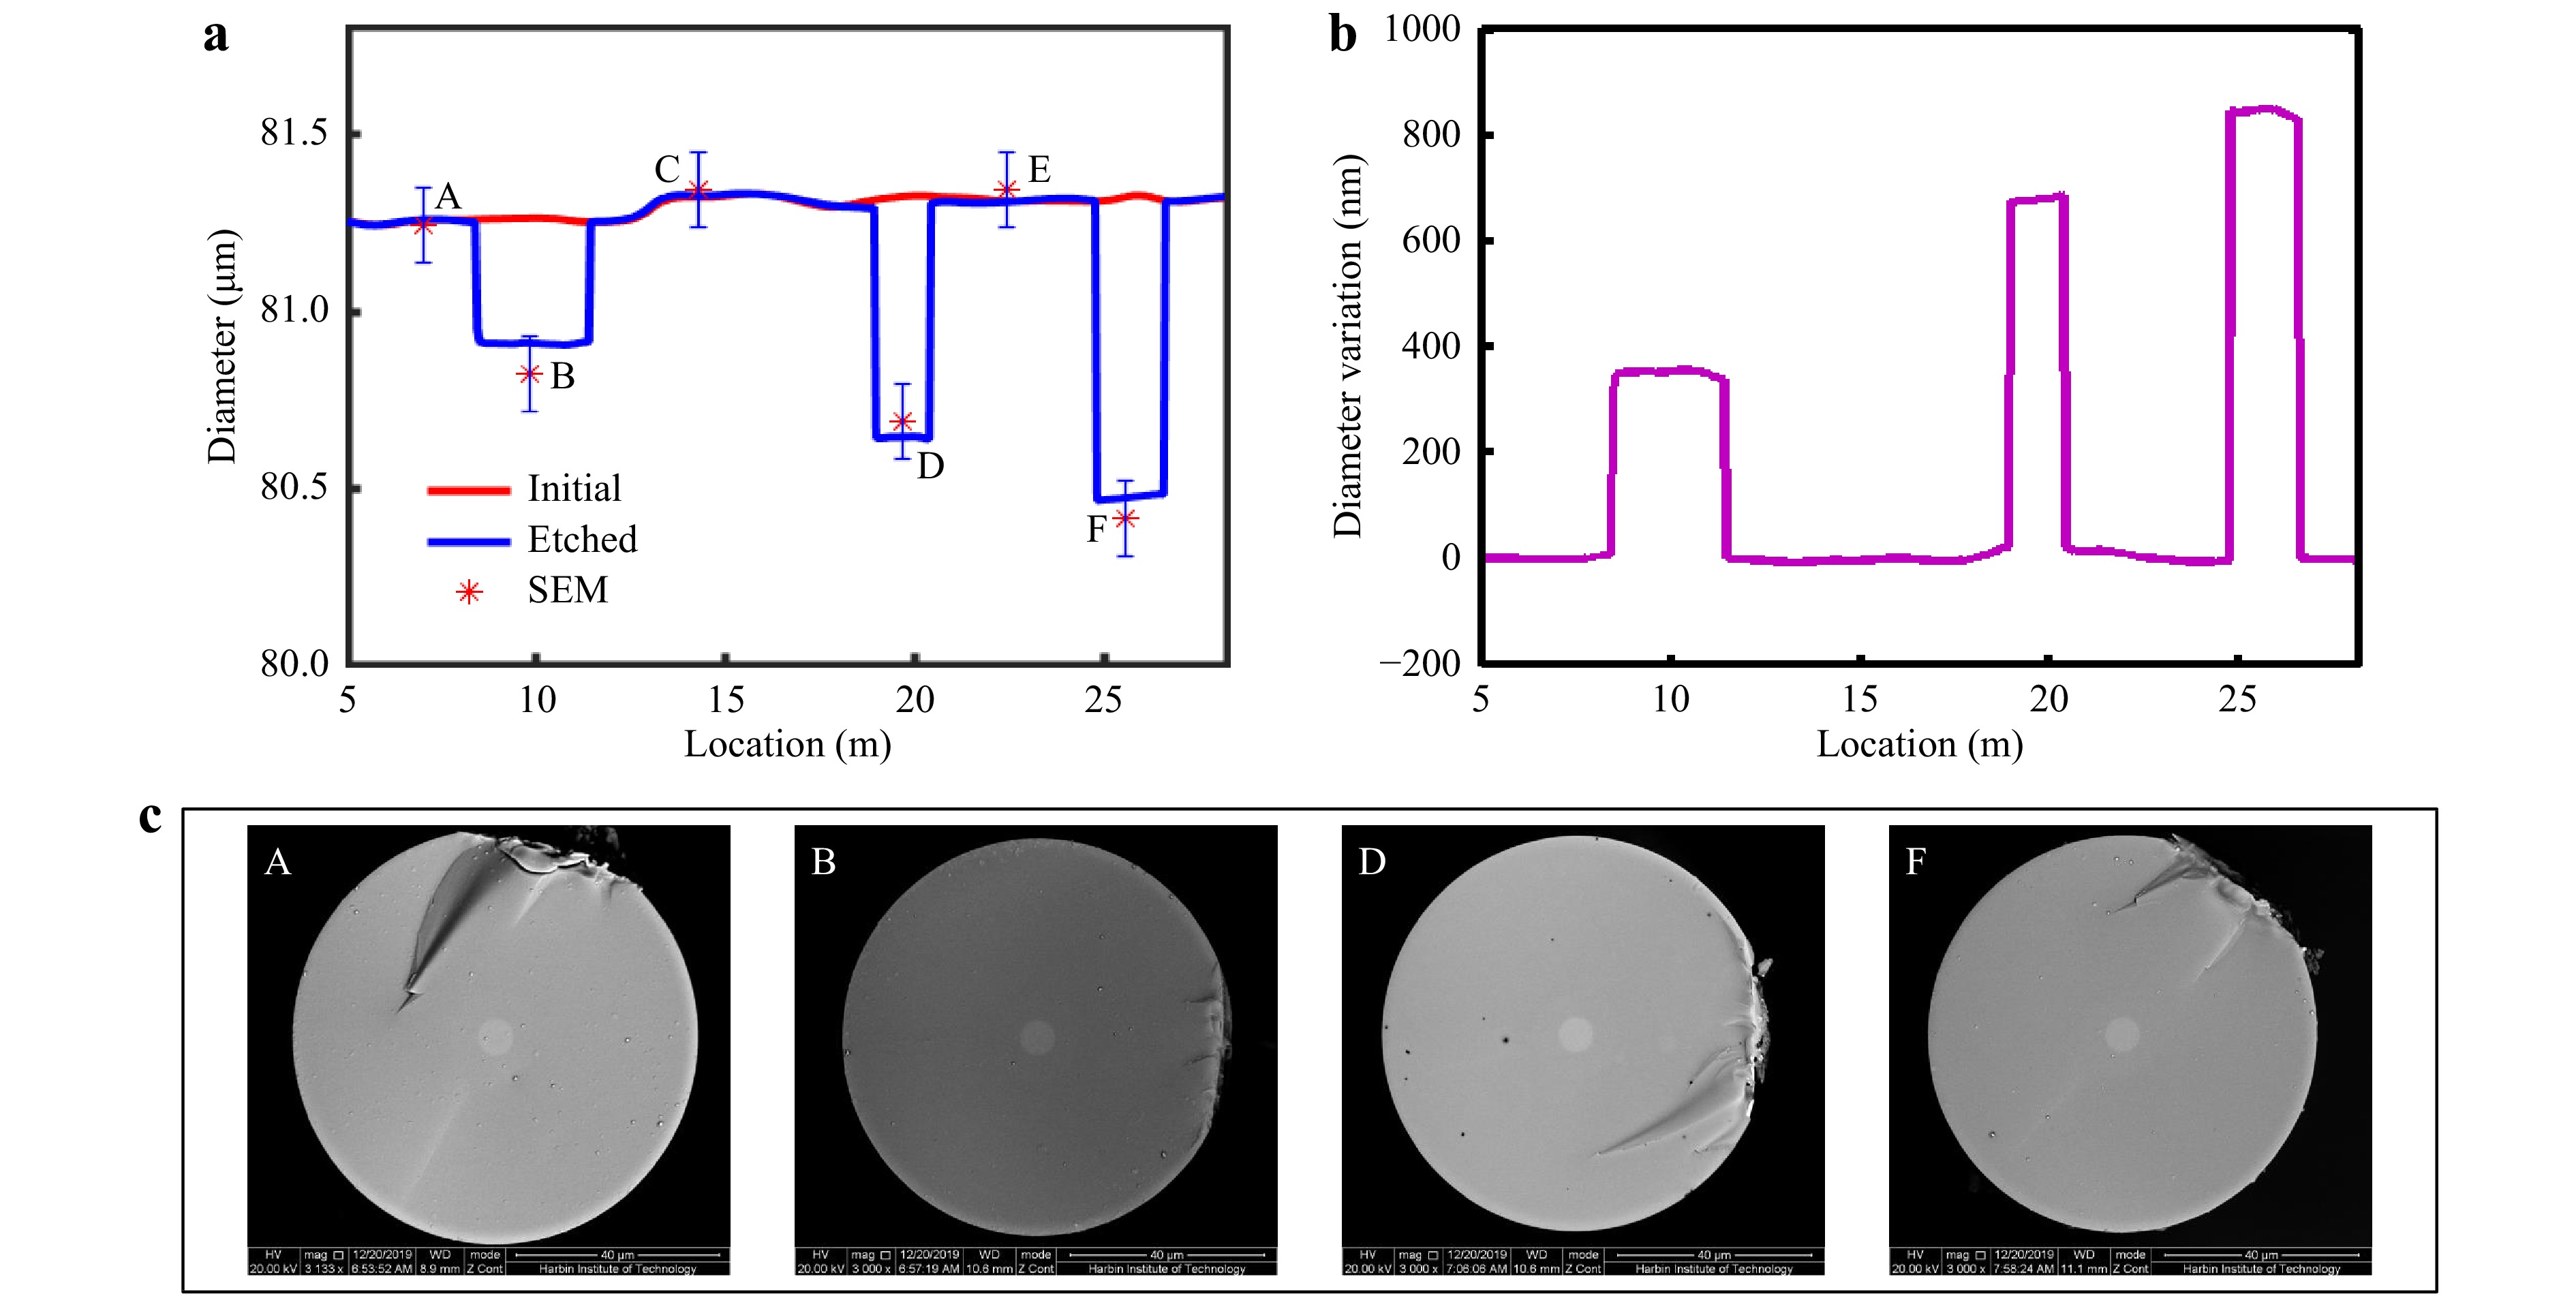
Fig. 10 Results of distributed diameter measurements on the 80-μm fiber.
a Demodulated diameter distribution before and after etching and its comparison with the SEM results (A-F). b Diameter variations along the FUT. c Four representative images of the fiber cross-section at A, B, D, and F in a captured using SEM. -
The measurement of fiber diameter by coherent FSBS benefits from the high SNR, resulting in small uncertainties and high reliability.
As mentioned above, there is a trade-off between the resolution and FOV when either optical or electron microscopes are used to measure the fiber diameter. This drawback is solved by our scheme, which skips the imaging process entirely and focuses on the spectral information of FSBS instead. The ultra-narrow linewidth of the FSBS resonance leads to an extraordinarily high frequency resolution of FSBS spectra
$ {\delta f}_{m} $ , rendering a remarkable diameter resolution which is expressed as$ \delta d={\delta f}_{m}/(\partial {f}_{m}/\partial d) $ . In order to visually indicate the diameter resolution, we conducted FSBS spectrum measurements of the 125-μm fiber ten times with fibers kept in a thermally insulated enclosure to eliminate temperature variation effects. The results show a high similarity between the ten superimposed traces presented in Fig. 11. We used the maximum standard deviations of the ten sets of measurements at each location as the diameter resolution of our system. We determined the diameter resolution to be 3.9 nm. Hence, we can claim that our technique can detect diameter fluctuations below 10 nm. This level of precision significantly outperformed the traditional diameter estimation methods.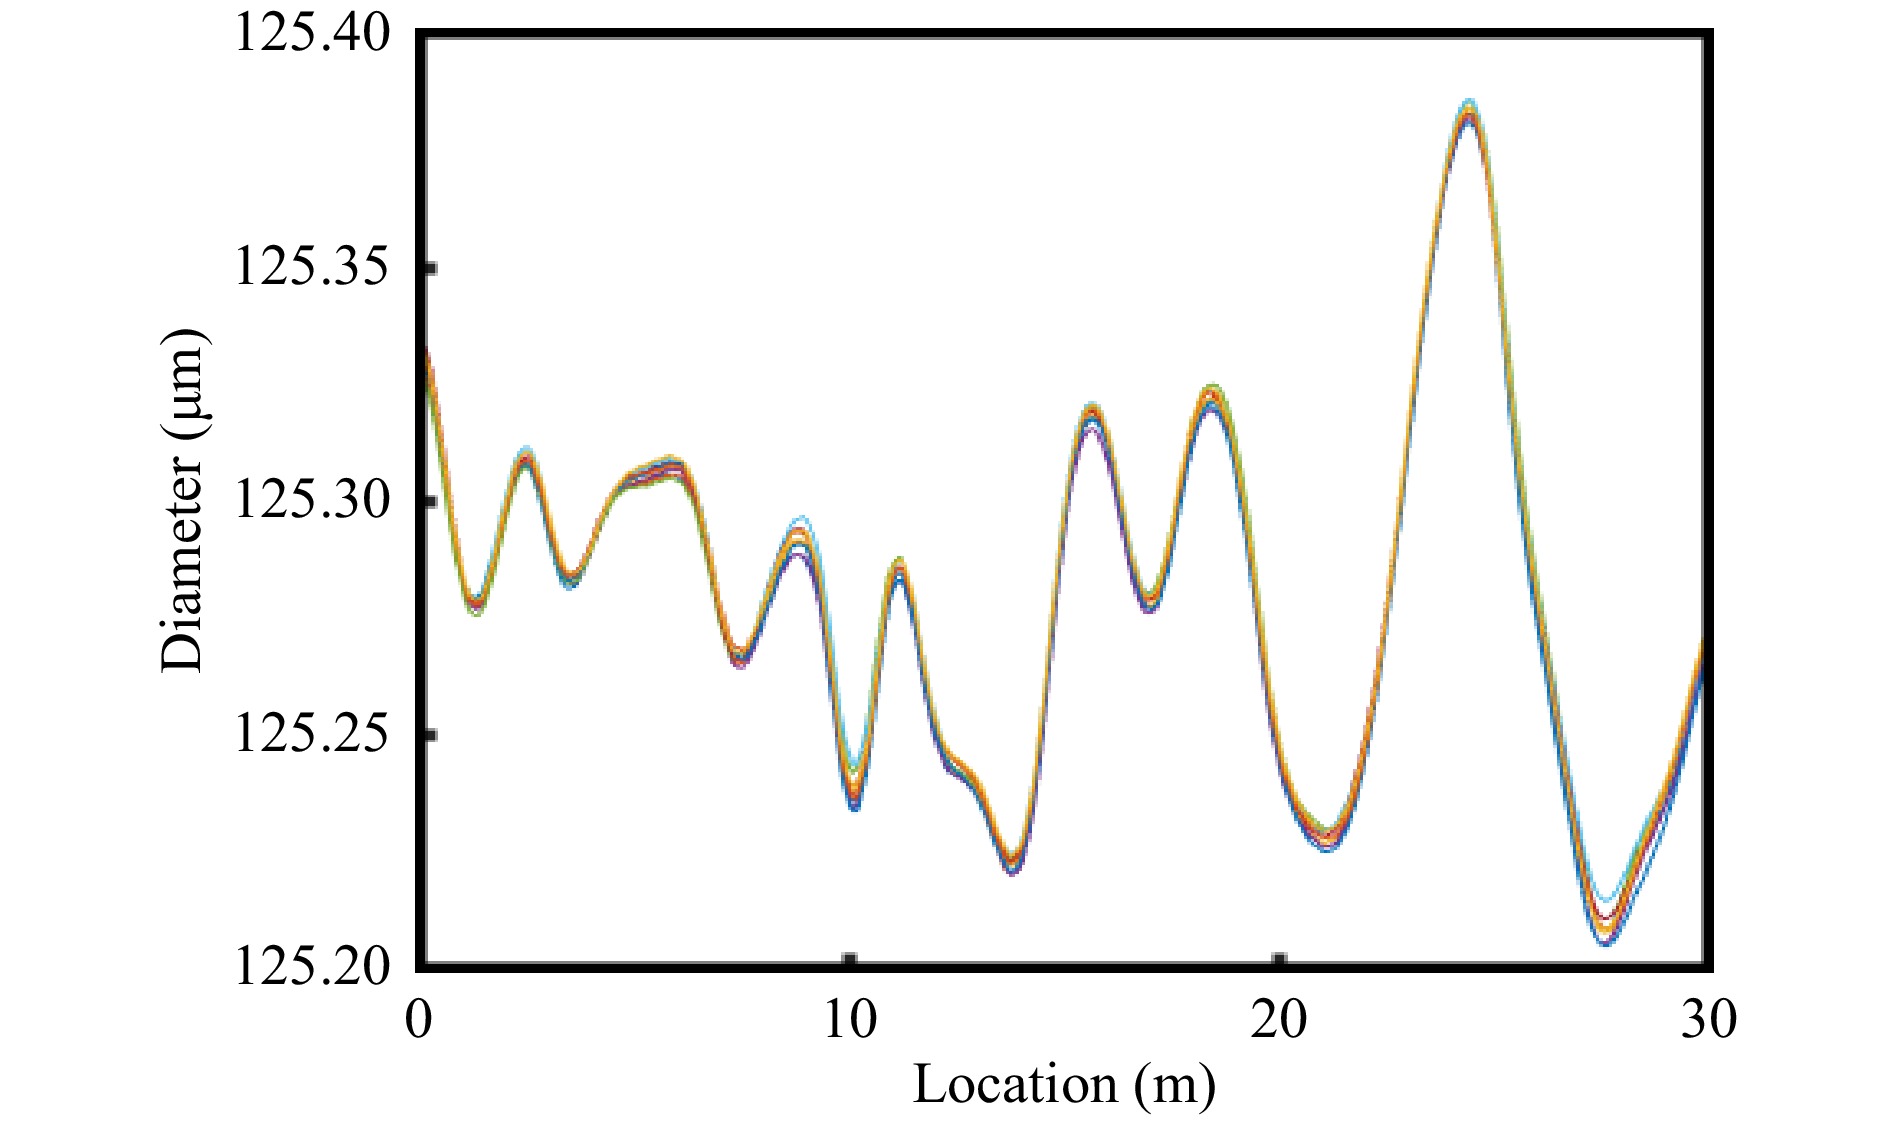
Fig. 11 Multiple sets of measurements of the diameter distributions for the fiber with a diameter of 125 μm.
-
Finally, we investigated the effect of temperature on the accuracy of fiber diameter measurements using our scheme. During the aforementioned implementation of diameter measurements, we precisely maintained the ambient temperature at
$ 298.9\pm 0.1\mathrm{K} $ . However, in practice, the temperature varies over a wide range and tendsto undermine the accuracy of the diameter measurement owing to the temperature dependence of the acoustic velocity. Similar to the case of backward Brillouin scattering, the temperature and acoustic velocity are linearly related, leading to a linear response of the FSBS resonant frequency33,34:
$$ {f_m}(T) = {f_m}({T_0}) + C_T^m(T - {T_0}) $$ (3) where denotes
$ C_T^m = {{\partial {f_m}} \mathord{\left/ {\vphantom {{\partial {f_m}} {\partial T}}} \right. } {\partial T}} $ the temperature coefficient of FSBS resonant frequency. However, when we demodulate the diameters from the FSBS frequencies, we assume that the longitudinal acoustic velocity remains constant at 5996 m s−1, resulting in a deviation from the actual velocity value when the temperature changes. This deviation resulted in a bias in the demodulated diameters away from their actual values. Fig. 12 presents the measured effect of temperature on the FSBS spectra of the 125-μm fiber. We increased the fiber temperature from 293.15 K to 315.65 K in steps of 2.5 K using a thermostat and measured the FSBS spectrum of the fiber end at each temperature. The results are presented in Fig. 12a. A gradual blue shift was observed as the temperature increased. The Lorentz-fitted central frequency of each spectrum, plotted against temperature in Fig. 12b, exhibits a linear response as expected, with a coefficient of 31.2 kHz K−1. Thus, the demodulated diameter temperature coefficient is 11.77 nm K−1. Fortunately, despite the distortion of the frequency distribution owing to temperature fluctuations, its effect can be compensated by canceling out the influence of the temperature on the acoustic velocity along with the same proportional influence on the FSBS frequency shift. Thus, the practical implementation of our scheme requires a precise record of temperature at 0.1 K.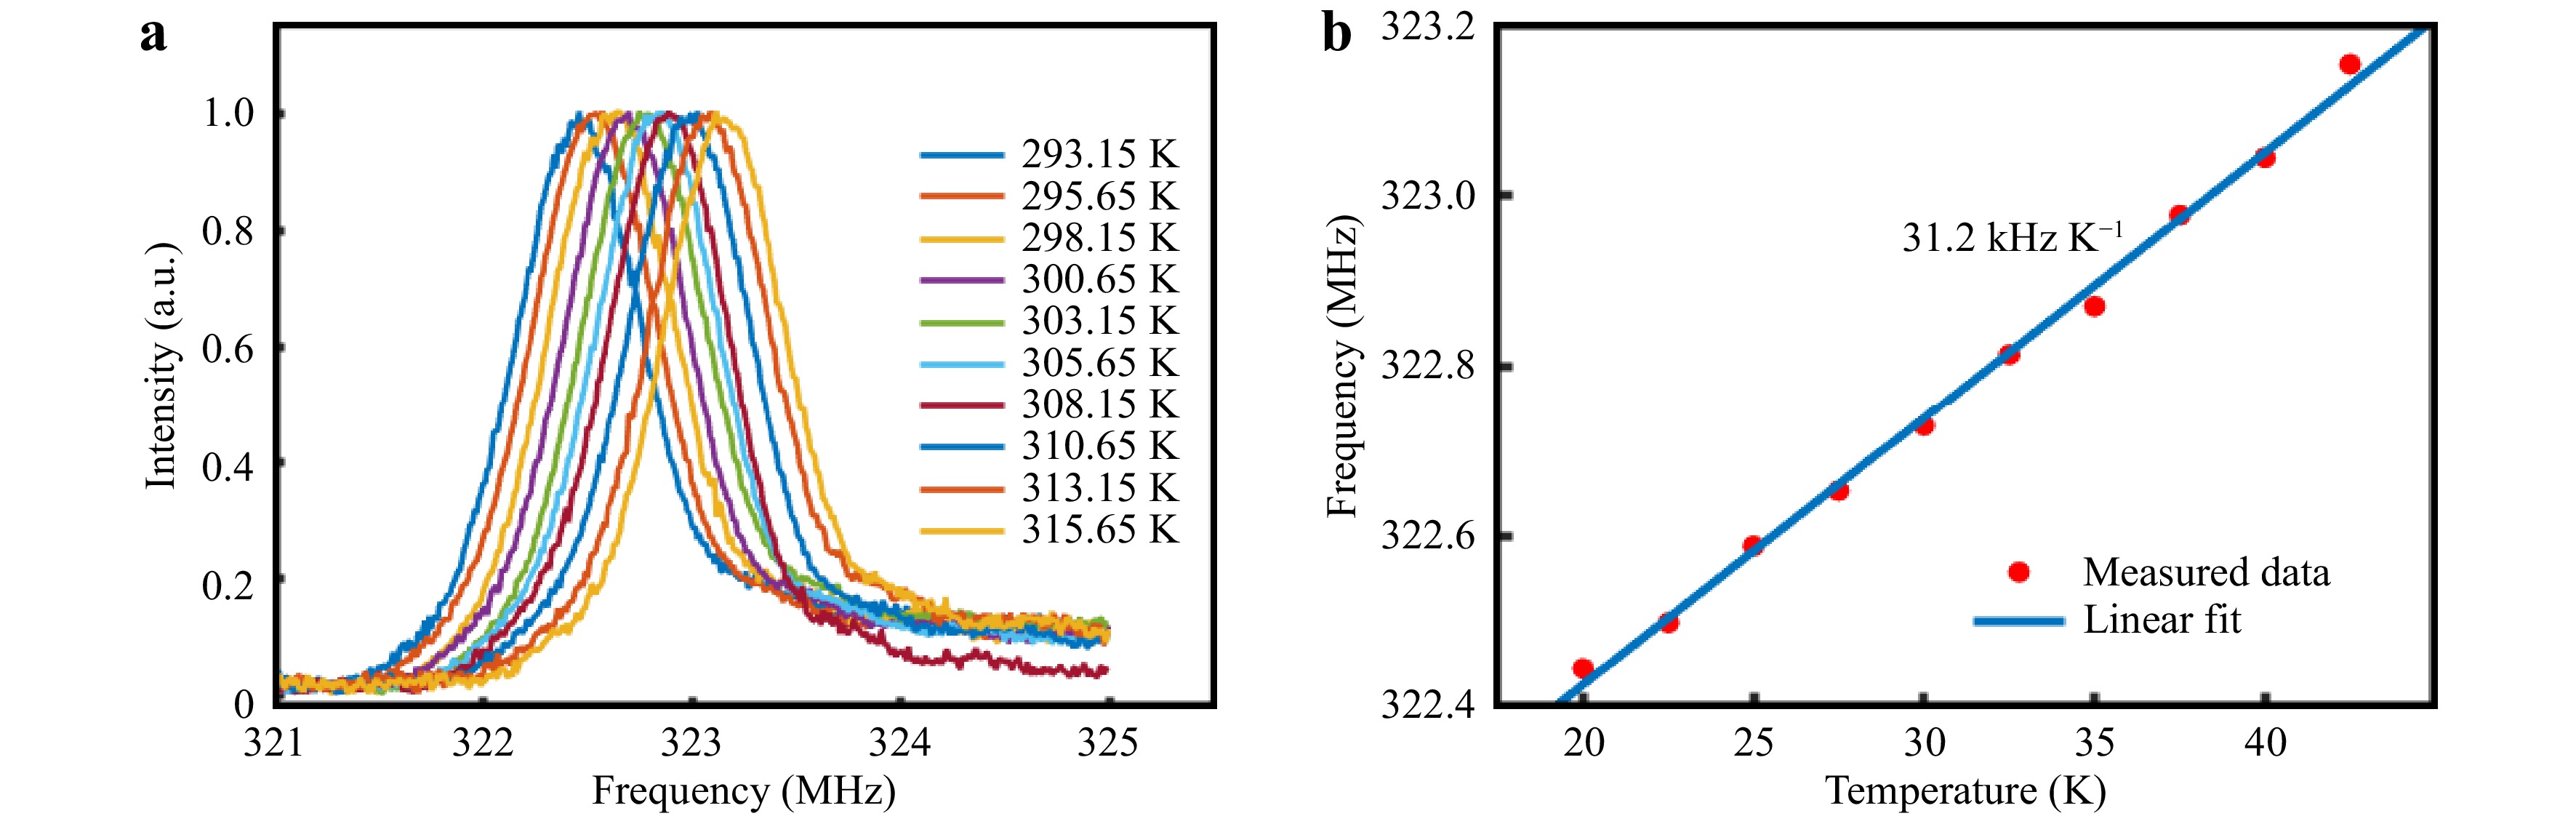
Fig. 12
a FSBS resonance spectra at different temperatures. b Temperature coefficient of the FSBS resonant frequency. -
In this work, a fully distributed fiber diameter measurement is realized for the first time to the best of our knowledge. We employed an optimized OMTDA system based on an optimized coherent FSBS to record the distributed FSBS spectra with high speed and enhanced SNR. We chose two fibers with nominal diameters of 125 μm and 80 μm as the testing fibers. Before etching, the two fibers exhibited intrinsic diameter fluctuations of approximately 250 nm and 100 nm, respectively. A comparison of the diameters measured by our scheme and SEM after etching proves the feasibility of our scheme. Two main drawbacks of conventional microscopes in determining fiber diameter have been overcome by our method: the irreversible destruction caused by sample preparation and the trade-off between resolution and FOV. Our method, which works by investigating the spectral information of the FSBS resonance, achieves an extremely good resolution of a few nanometers for both 125-μm and 80-μm FUTs. The merits of our proposed scheme will enable the fiber manufacturing industry to control the geometry of fibers during fiber production with higher precision and accuracy.
Although the testing fiber used in the experiment was approximately 30 m, the measurement distance could be readily expanded to a few kilometers, which is mainly restricted by nonlinear effects and reduced FSBS efficiency with propagation distance. Moreover, the coverage of detectable objects can be expanded to special fibers such as multi-core fibers, AR-HCFs, and other custom-made waveguide structures23,31. This may fill the technical gap in the distributed measurement of the intrinsic parameters of optical fibers in optical fiber communication and sensing in the future. In addition, in field applications where the coatings are required, the linewidth of the FSBS spectrum tends to broaden to approximately 5 MHz, which eventually limits the resolution of the diameter to a few tens of nanometers. In addition, several variant Brillouin optical time-domain analysis (BOTDA) configurations such as vector BOTDA35,36 and differential pump pulse BOTDA37,38 are expected to be applied to the field of OMTDA to further improve the performance, for example, a much better spatial resolution.
-
We applied a 20% hydrofluoric acid solution (HF) to etch specific segments of the fiber. The principle of the etching method is as follows:
$$\rm SiO_{2} + 4HF == SiF_{4} + 2H_{2}O (4) $$ (4) In addition, since the etching rate of HF on the fiber possesses a certain value under the same conditions (temperature, concentration, and fiber material), the stepped fluctuation of the fiber cladding diameter can be constructed by using HF.
For diameter measurements of the 125-μm fiber, we chose a 35.5 m FUT as the sensing fiber whose coating was stripped in advance. It was then divided into seven segments and marked as segments 1–7 from the start to the end. Segments 2, 4, and 6 were immersed into the pre-made HF solution for 1, 2, and 3 min, respectively, to create step changes in the fiber diameter for intuitive observation.
On the other hand, a 27-meter FUT was chosen for diameter measurements of the 80-μm fiber. It was subjected to the same HF etching process as the other fiber, with the etching time halved at each location.
-
The scanning electron microscope used in the experiment was a Quanta 200FEG. In the experiments involving the fiber with a diameter of 125 μm, we took six segments from the typical positions of the etched fiber at axial positions 4.5, 10, 15, 22, 28, and 33 m, and tested them using the SEM at 2000x magnification with an acceleration voltage of 20 kV.
In the case of the fiber whose diameter was 80 μm, owing to the comparatively smaller FOV required, we used a larger magnification of the SEM (3000x), ideally increasing the resolution in the same proportion. Similarly, we took six segments from the typical positions of the etched fiber, corresponding to the axial positions 7, 10, 14, 20, 22.5, and 25.5 m.
The precision of the image acquired by SEM can be expressed by:
$$ \Delta {r_{\min }} = \max \left( {\Delta {r_{SEM}},\frac{{{\rm{FOV}}{_x}}}{{{N_{pixel}}(x)}},\frac{{{\rm{FOV}}{_y}}}{{{N_{pixel}}(y)}}} \right) $$ (5) Here
$ {\Delta {r}}_{SEM} $ is the highest resolution obtained by SEM, which is typically smaller than the last two terms (~5 nm) when the tested objects are optical fibers with diameters of approximately 100 μm. FOVx (FOVy) denotes the spatial coverage of the image in the x (y) direction, and Npixel(x) (Npixel(y)) is the number of pixels contained in the image in the x (y) direction. Thus, the resolution is determined by the number of pixels and FOV. -
This work was supported by the National Key Scientific Instrument and Equipment Development Project of China (2017YFF0108700), National Natural Science Foundation of China (62005067), National Postdoctoral Program for Innovative Talents (BX20200104), China Postdoctoral Science Foundation (2020M681088), and the Heilongjiang Postdoctoral Fund to pursue scientific research (LBH-Z20067).
Non-destructive and distributed measurement of optical fiber diameter with nanometer resolution based on coherent forward stimulated Brillouin scattering
-
Zijie Hua1,
 ,
, - Dexin Ba1,
- Dengwang Zhou1, 2, 3,
- Yijia Li1,
- Yue Wang1,
- Xiaoyi Bao4,
-
Yongkang Dong1, *, ,
- Light: Advanced Manufacturing 2, Article number: (2021)
- Received: 30 September 2021
- Revised: 20 October 2021
- Accepted: 27 October 2021 Published online: 16 November 2021
doi: https://doi.org/10.37188/lam.2021.025
Abstract: Precise control and measurement of the optical fiber diameter are vital for a range of fields, such as ultra-high sensitivity sensing and high-speed optical communication. Nowadays, the measurement of fiber diameter relies on point measurement schemes such as microscopes, which suffer from a tradeoff between the resolution and field of view. Handling the fiber can irreversibly damage the fiber samples, especially when multi-point measurements are required. To overcome these problems, we have explored a novel technique in which the mechanical properties of fibers are reflected by forward stimulated Brillouin scattering (FSBS), from which the diameters can be demodulated via the acoustic dispersion relation. The distributed FSBS spectra with narrow linewidths were recorded via the optimized optomechanical time-domain analysis system using coherent FSBS, thereby achieving a spatial resolution of 1 m over a fiber length of tens of meters. We successfully obtained the diameter distribution of unjacketed test fibers with diameters of 125 μm and 80 μm. The diameter accuracy was verified by high-quality scanning electron microscope images. We achieved a diameter resolution of 3.9 nm, virtually independent of the diameter range. To the best of our knowledge, this is the first demonstration of non-destructive and distributed fiber diameter monitoring with nanometer resolution.
Research Summary
Optomechanical measurement: distributed optical fiber geometry characterization
Scientists have developed a nondestructive and fully distributed optical fiber characterization which can provide guidance during optical fiber manufacturing. Conventional point measurement techniques such as microscopes for optical fiber diameter measurement will lead to irreversible damage to the testing fibers, and meanwhile suffers from the tradeoff between the diameter resolution and field of view. Now, a team of researchers from China and Canada, led by Yongkang Dong from Harbin Institute of Technology in China, has developed an innovative technique that takes the advantage of forward stimulated Brillouin scattering (FSBS). Opto-mechanical time domain analysis (OMTDA) is applied to record the distributed FSBS spectra of the fiber through which the fiber diameter can be extracted. The work overcomes the long-standing problems of fiber diameter measurements which facilitates monitoring of fiber geometry along the axial direction.


Rights and permissions
Open Access This article is licensed under a Creative Commons Attribution 4.0 International License, which permits use, sharing, adaptation, distribution and reproduction in any medium or format, as long as you give appropriate credit to the original author(s) and the source, provide a link to the Creative Commons license, and indicate if changes were made. The images or other third party material in this article are included in the article′s Creative Commons license, unless indicated otherwise in a credit line to the material. If material is not included in the article′s Creative Commons license and your intended use is not permitted by statutory regulation or exceeds the permitted use, you will need to obtain permission directly from the copyright holder. To view a copy of this license, visit http://creativecommons.org/licenses/by/4.0/.

 DownLoad: