HTML
-
Precise measurement of deformations and vibrations is required in a wide range of industrial applications. Classical approaches such as laser Doppler vibrometers (LDVs) offer the possibility of measuring object vibrations at high temporal and spatial resolution. However, as soon as multiple simultaneous measurements are required, the use of single LDVs quickly becomes impractical and costly. The market-driven need for simultaneous vibration measurements at multiple positions manifested itself in the development of LDVs with multi-beam1−4 and multi-sensor5−7 applications. In addition, commercial solutions consisting of multiple sensor heads are available8, but these systems are either limited by the flexibility of beam orientation or costly in terms of adjustment of sensor heads, signal synchronization, and especially in terms of price. Scanning laser interferometers9, 10 can be used to measure full-field vibrations, but the obtained signals cannot be acquired simultaneously, making it impossible to measure transient signals.
Image-based vibration measurement techniques inherently offer the possibility of measuring the movement of an object remotely at multiple positions as well as measuring the displacement of several objects simultaneously.
In many cases, planar, passive targets are used, reaching accuracies in the range of 0.6 mm at a distance of 100 m and 0.1 mm for a distance of 15 m and only low-frequency vibrations are detected11, 12. As an alternative to the planar target, active elements (LEDs) and edge detection can be used13, 14. Especially in the field of edge detection, a lot of research regarding motion magnification, a technique that allows magnifying small displacements, has been conducted recently. A promising approach was presented by Wu et al., where small movements were magnified in video sequences by applying a bandwidth filter in the spatial frequency domain15. This method was used in the vibration analysis of structures and achieved impressive accuracies of 0.006 pixel16, 17. Nevertheless, the method is limited to stationary vibrations and can produce misleading artifacts18. The time-varying motion filtering proposed by Liu et al. can be a solution for the problem of limited bandwidth19.
Higher frequency vibrations of up to 1000 Hz were analyzed by several authors20−22, using techniques such as phase-based optical flow and pattern-matching. The reported standard uncertainties are 0.032 mm for vibration frequencies of 100−300 Hz and 0.013 mm for 400−600 Hz using passive targets and a pattern-matching technique22. This corresponds to a dynamic range of 12000:1 (measurement range/uncertainty).
-
Our approach for measuring the vibration of an object is shown in Fig. 1. Multiple light sources (shown in red) were attached to a vibrating object and imaged to a camera. By monitoring the position of each object light source with a fixed acquisition frame rate, movements between each frame can be ascribed to a superposition of the object vibration and ambient vibrations of the laboratory room, neglecting other error sources such as air turbulence and sensor noise. One static light source (green) is not attached to the vibrating object; therefore, it is only exposed to ambient vibrations. By calculating the relative displacement between an object and a static light source, these unwanted vibrations can be compensated for. This is schematically visualized in the two spectra shown in Fig. 1. The upper spectrum is given for the absolute movement of an object light source
$ x_{abs} $ in the presence of unwanted ambient vibrations. The lower shows the spectrum of the relative displacement$ x_{rel} $ between a vibrating and a static light source without ambient vibrations.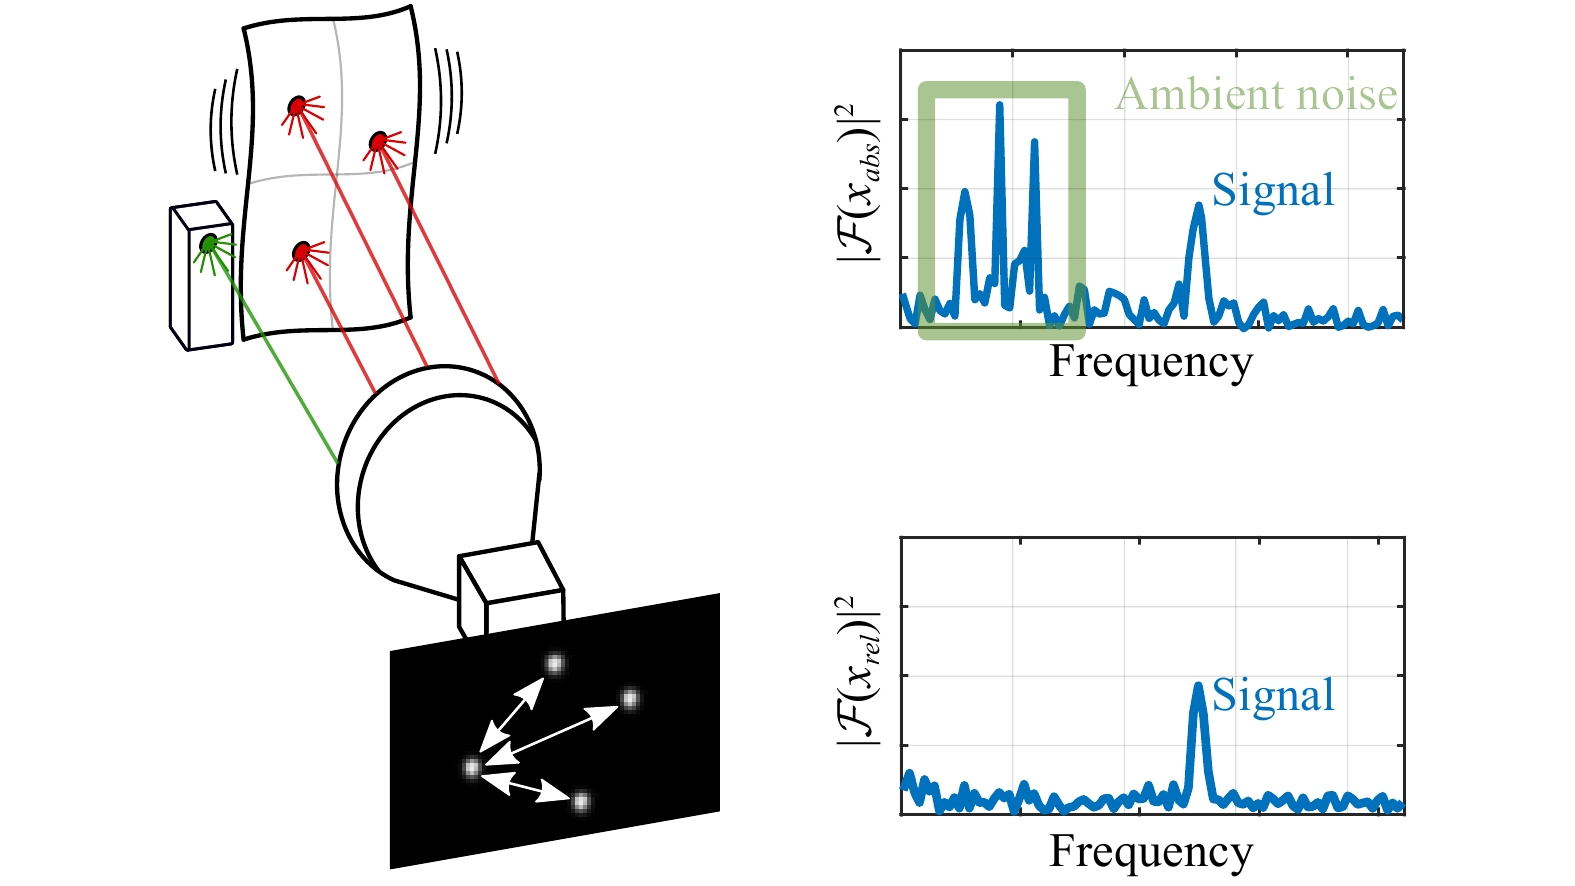
Fig. 1 Scheme of the vibration measurement method, including the spectra of the absolute and relative spot position signals.
Point light sources on a vibrating object (red) and a static object (green) are imaged to a camera. The center of the imaged spot is used as the position signal. Environmental vibrations (marked with a green square) are present in the absolute position spectrum$ x_{abs}$ $ x_{rel}$ In the following, this method is improved by using holographical image replication to reach very high resolution, and we present experimental results to support the ability to compensate for ambient vibration in relative position measurement.
In our measurement system, the position of each light source is defined by the location of the intensity distribution (spot) on the camera sensor. Therefore, it is crucial for our measurement system to detect the spot position as accurately as possible. To this end, the holographic multipoint method is applied23. In the following, we provide a brief introduction to the underlying spot detection.
-
The accuracy of subpixel spot position detection is limited by several factors such as photon noise, electronic noise24, discretization and quantization of the camera sensor25, and the choice of centroiding algorithm26. The number of collected photons that contribute to the intensity distribution of a spot is directly correlated with the uncertainty of its position determination. Starting from a single object point, if M photons are imaged to the camera and individual position measurements are made for each photon, the mean over all individual measurements leads to a positional standard deviation that is reduced by a factor of
$ \sqrt{M} $ 27. Temporal averaging is one way to increase the number of collected photons and therefore improve accuracy. However, temporal averaging reduces neither the fixed pattern noise of the image sensor nor the discretization error. In terms of image-based vibration measurements, temporal averaging would also reduce temporal resolution.The principle of our vibration measurement method is based on spatial averaging. The spot of a single light source is holographically replicated into a cluster of
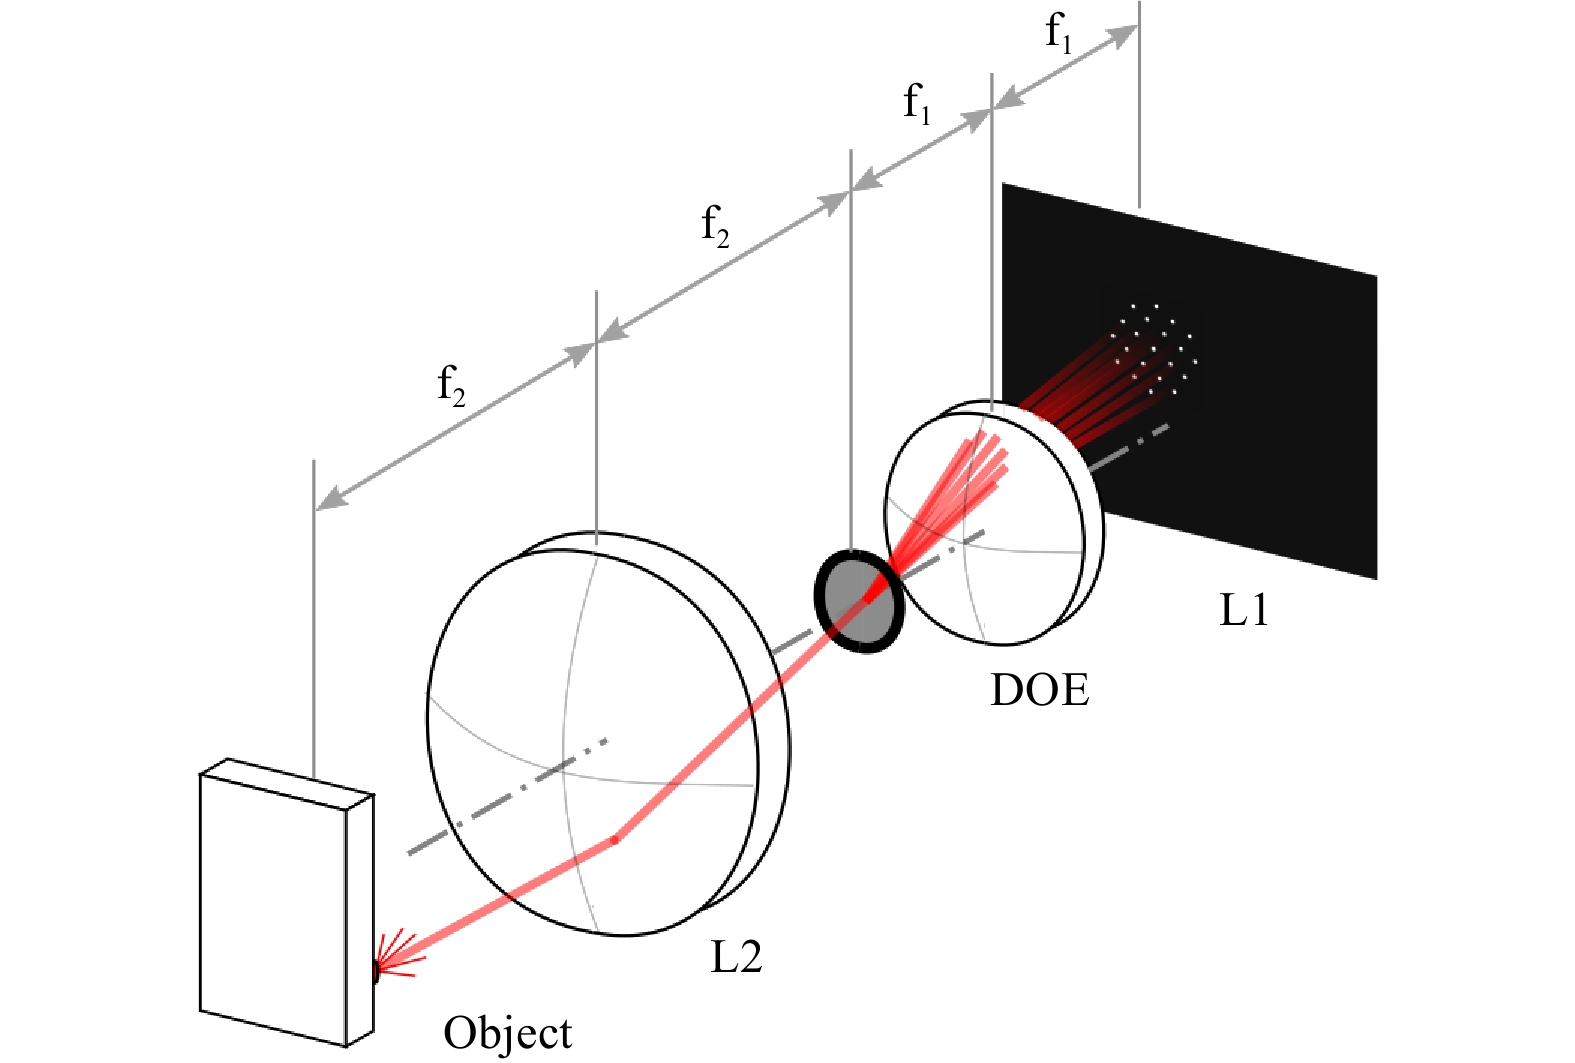
$ N\; = \; 21 $ spots. The spot cluster is generated using a lithographically fabricated diffractive optical element (DOE)28, which is placed in the Fourier plane of a bi-telecentric lens, as shown in Fig. 2. If the light source is moved, all replicated spots move by the same amount (Fourier shift theorem). As described above, by making the light source brighter, the number of photons and simultaneously the number of pixels that sample the intensity distribution are increased. By calculating the mean of all spot centers per cluster, the position accuracy of the light source can be improved ideally by a factor of$ \sqrt{N} $ . This has been shown by Haist et al.23, where a single light source was replicated into a cluster of$ N\; = \; 16 $ spots. The detection accuracy was improved in experiments from 0.01 pixels to 0.0028 pixels, which corresponds to an improvement factor of 3.6 (theoretical factor of 4). -
A schematic of the measurement setup is depicted in Fig. 2. We use a camera system consisting of a bi-telecentric lens (6) (Vico DTCM110-150-AL,
$ NA $ = 0.0085,$ |\beta'| $ = 0.11, distortion < 0.1%) and a high-speed camera (8) (Mikrotron EoSens 4CXP, 4 Mpix, pixel size$ d_p $ = 7 µm, 563 fps full frame). In the aperture plane of the bi-telecentric lens (6), a DOE (7) is mounted to perform the multipoint replication. Light sources (Roithner LaserTechnik, SMB1N-D630,$ \lambda $ = 630 nm, FWHM = 16 nm, radiant intensity = 120 mW/sr) are attached to a static object (5) and to an object (5) that is mechanically actuated by a piezo stage (2) (Physik Instrumente P-611.2S,$ X/Y $ -travel range = 100 µm, resolution = 0.2 nm). In front of each light source, a pinhole ($ D $ = 200 µm) is mounted to obtain comparable radiation profiles and small spots on the camera. The displacement of the object (4) is measured in the$ X_W $ - and$ Z_W $ -directions using two vibrometers (1) and (3) (Polytec NLV 2500). In this study we use only the$ X_W $ -direction.The piezo stage is operated in a closed-loop with a commercial controller (PI E-727.3SDA, 20 kHz). The position references for generating the vibrations are supplied from a dSpace DS-1005 1 GHz PowerPC (2 kHz/ 3 kHz sampling rate), which is also used for signal acquisition. The camera is hardware-triggered using a frequency generator (Rigol DG1022Z). The maximum acquisition frame rate of the camera is defined by the size of the captured image region of interest (ROI). For an ROI size of 900 pixels
$ \times $ 576 pixels, the maximum frame rate is 2000 frames per second (fps). The size of one cluster in the$ X $ - and$ Y- $ directions is 170 pixels$ \times $ 170 pixels, so a total of 15 object points (clusters) can be monitored simultaneously at 2000 fps. For an image size of 700 pixels$ \times $ 300 pixels, the maximum frame rate can be increased to 3000 fps.The two-dimensional measurement field is defined by the camera sensor size divided by the magnification of the imaging lens. For the measurement setup presented in this study, the field size is 148 mm
$ \times $ 110 mm. This enables the simultaneous monitoring of a total number of 130 equally spaced object points with a frame rate of 563 Hz. -
To measure the vibration of each light source, it is necessary to calculate the position of each corresponding cluster in the image. The procedure for determining the subpixel cluster position is summarized in Fig. 4.
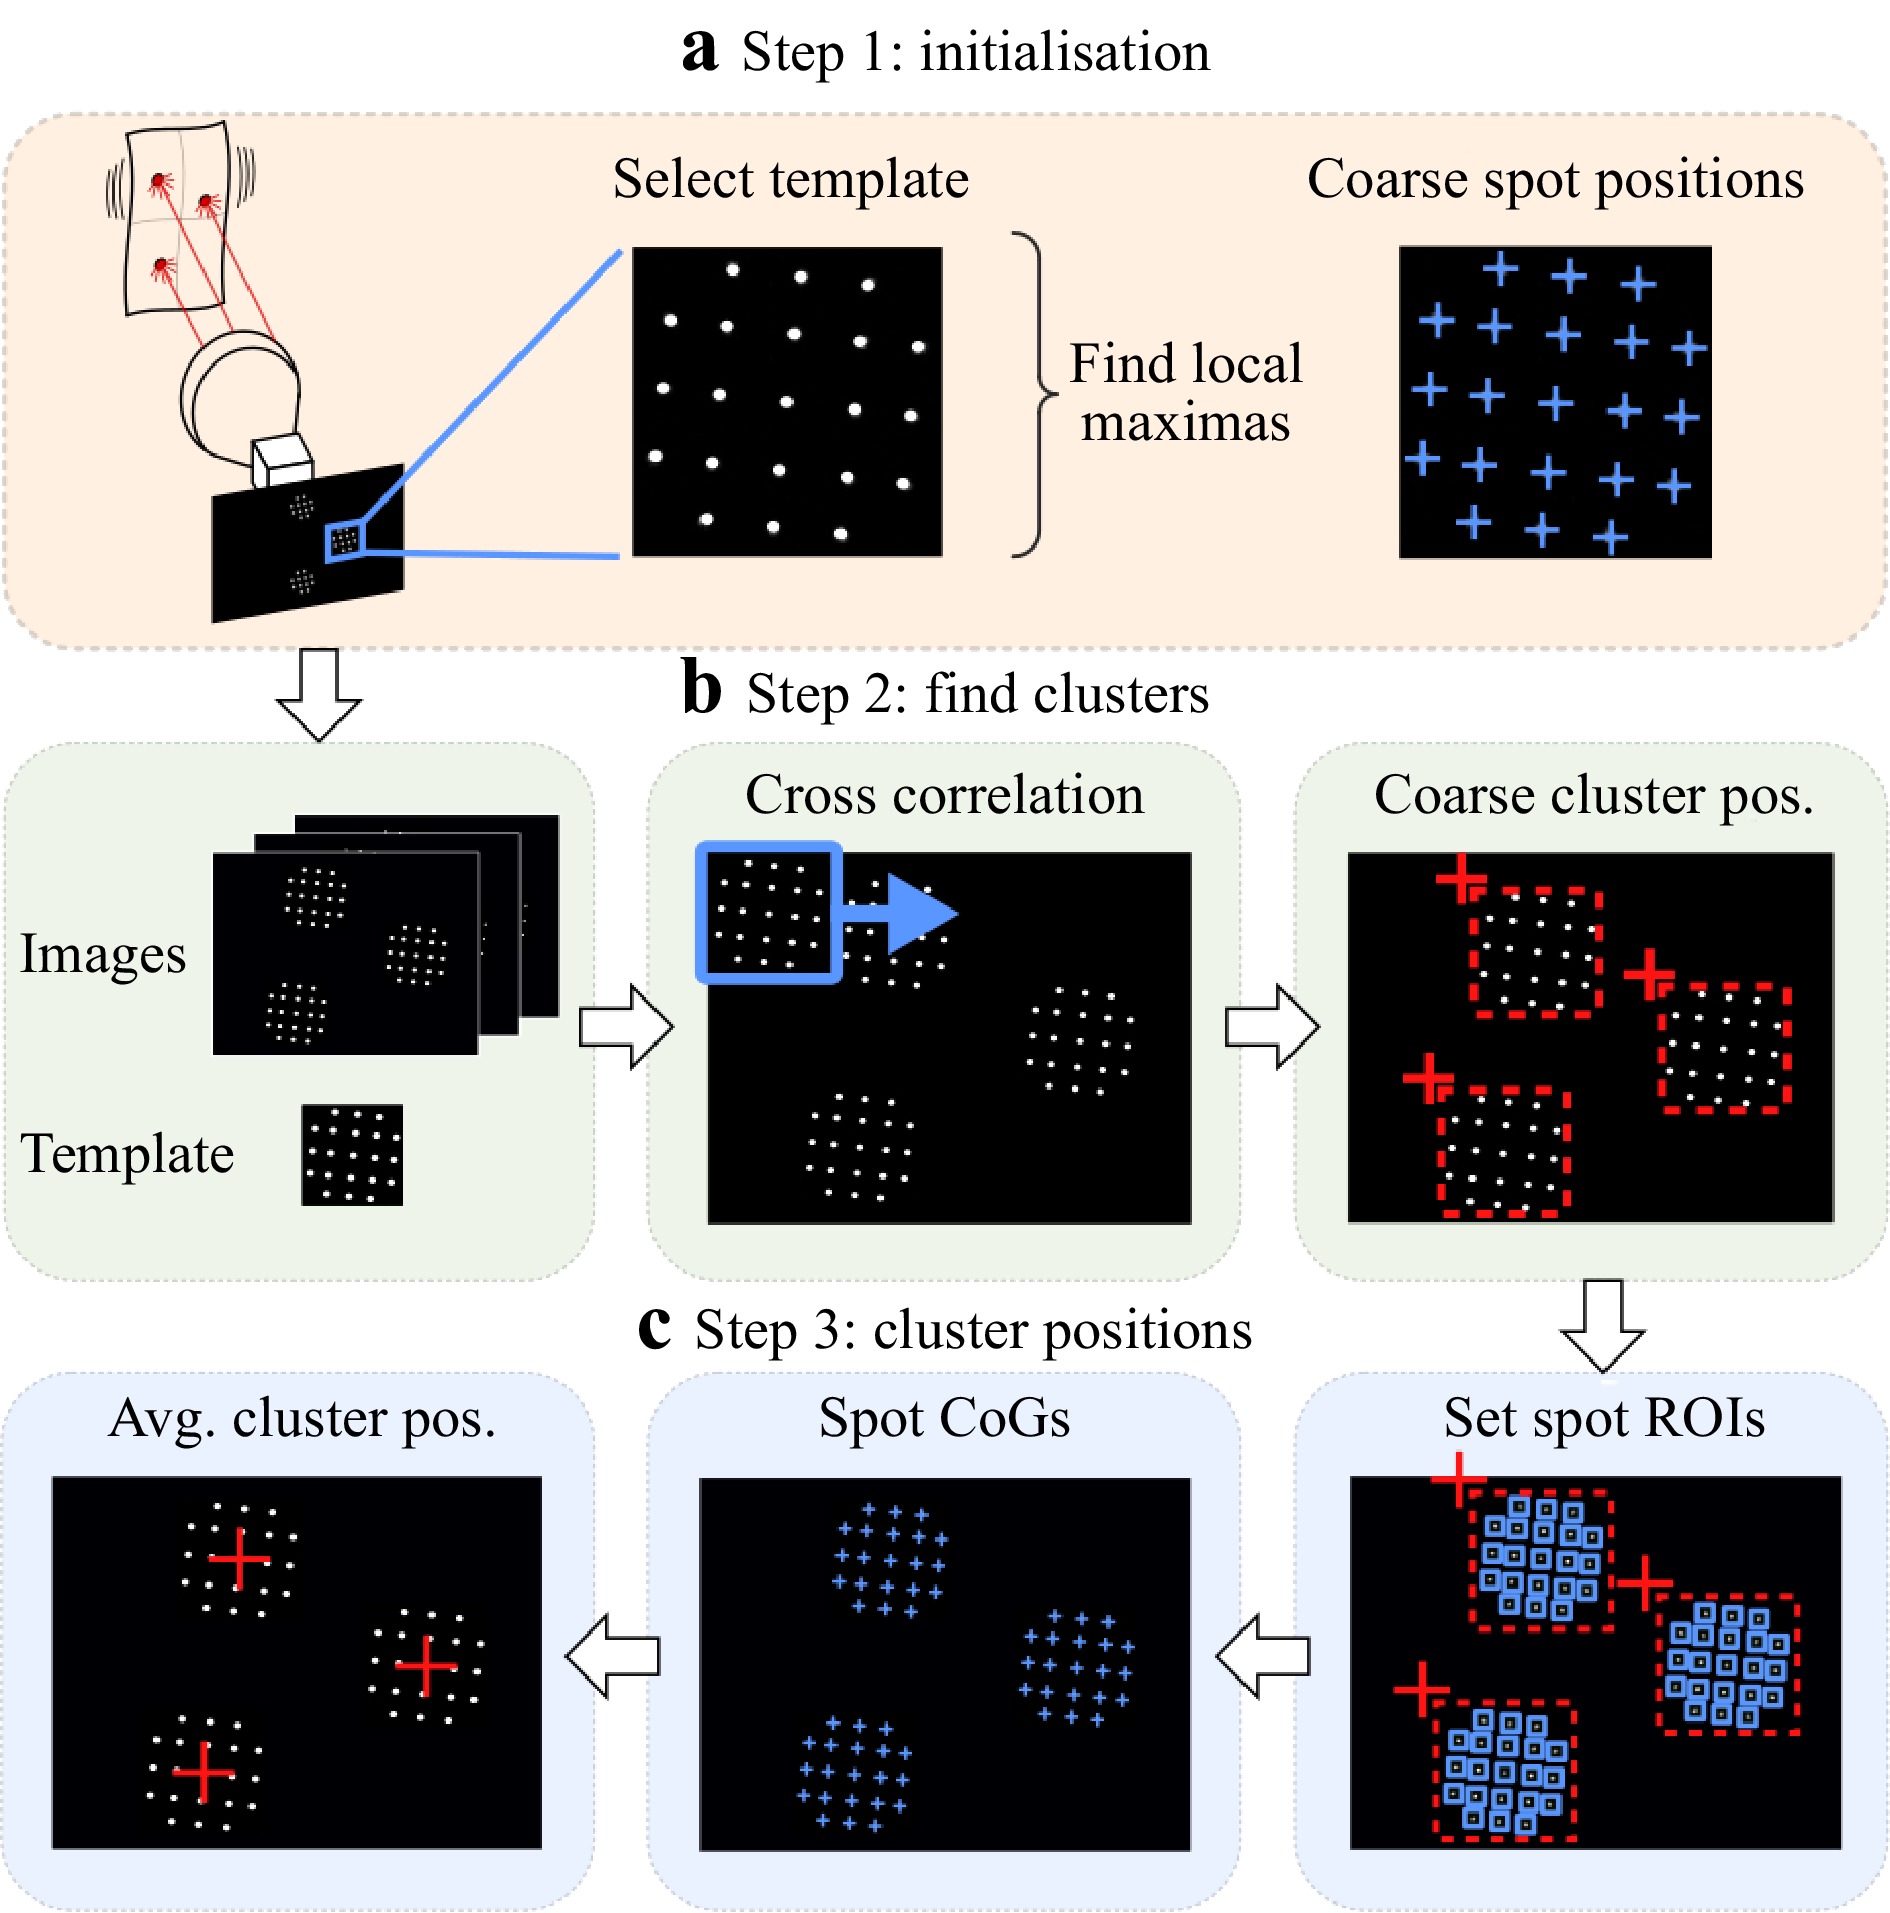
Fig. 4 Three-step image processing procedure:
a Initialization with spot map; b Find clusters; c Calculate averaged subpixel cluster positions.Step 1: In the first step, an image region containing one cluster is selected, saved, and used for cross correlation with the captured images. In this template image, the coarse position of each spot is localized by convolution with a blur kernel and by the application of a local maxima algorithm. The coarse spot positions (marked as blue crosses) are given in the local template coordinate system and are stored in a vector (spot map). As a consequence of the Fourier-Shift-Theorem, all replicated spots move by the same amount and, therefore, the relative position between all spots per cluster is in good approximation constant over the whole image. Therefore, once the spot map is generated, it can be applied to all clusters in all images of the image stack.
Step 2: In the second step each cluster position is localized coarsely. The upper left corners of each cluster are found using cross-correlation with the template from step 1. The correlation result is blurred, and local maxima are obtained by applying a local maxima algorithm. For vibration measurements, it is sufficient to detect the cluster positions only for the first image and to keep those positions for all subsequent images of the stack, because the cluster movement does not exceed a few pixels.
Step 3: The coordinates of the spot map (step 1) are combined with the coarse cluster positions from step 2. An ROI can be applied around each single spot per cluster. The ROIs are marked in Fig. 4c using blue squares. The spot diameter is approximately 8 to 10 pixels, so the square ROI around each spot is selected to be 30 pixels wide, which corresponds to 1.9 mm in the object space.
The subpixel position
$ (x_ {sp}, y_{sp}) $ of one spot inside the ROI is calculated as$$ (x_ {sp}, y_{sp}) = \left(\frac{\sum\limits_{x}\sum\limits_{y}xI(x, y)} {\sum\limits_{x}\sum\limits_{y}I(x, y)}, \frac{\sum\limits_{x}\sum\limits_{y}yI(x, y)} {\sum\limits_{x}\sum\limits_{y}I(x, y)}\right) $$ (1) using the gray value weighted center of gravity (CoG), where
$ I(x, y) $ is the intensity at position ($ x $ ,$ y $ ). All intensity values below a threshold are set to zero to remove background noise. The position of one cluster containing$ N $ spots is given by$$ (x_ {cl}, y_{cl}) = \left(\frac{1}{N}\sum\limits_{i = 1}^{N}x_{sp,i}, \frac{1}{N}\sum\limits_{i = 1}^{N}y_{sp,i}\right) $$ (2) The position of each cluster is given in pixel coordinates. A conversion to a metric length unit can be achieved using the magnification
$ \beta' $ of the bi-telecentric lens and the pixel size$ d_p $ of 7 µm. The conversion factor$ k $ is given by$$ k = \frac{d_p}{\beta'} = \frac{7 \mu \mathrm{m}}{0.11} = 63.64 \frac{\mu \mathrm{m}}{\mathrm{Pixel}} $$ (3) This linear mapping can be applied only for small movements on the sensor, because the lens distortion introduces an error that is position dependent. However, for vibrations, linear mapping is a valid assumption.
-
The goal of the presented experiments is to obtain an overview of the capabilities of the proposed vibration measurement method in terms of accuracy improvement and resolution limit. To investigate the sensitivity of the proposed measurement method over a wide frequency range, an inertial shaker is used to create a chirp signal up to high frequencies.
-
The measurement setup shown in Fig. 3 is used to demonstrate the accuracy improvement using the multipoint method. The piezo stage is actuated in the
$ X_W $ -direction with a sinusoidal oscillation of amplitude 1 µm and frequency of 50 Hz for a time period of 0.4 s. The camera image has a size of 900 pixels$ \times $ 576 pixels, and the sampling rate of the camera is set to 1000 fps.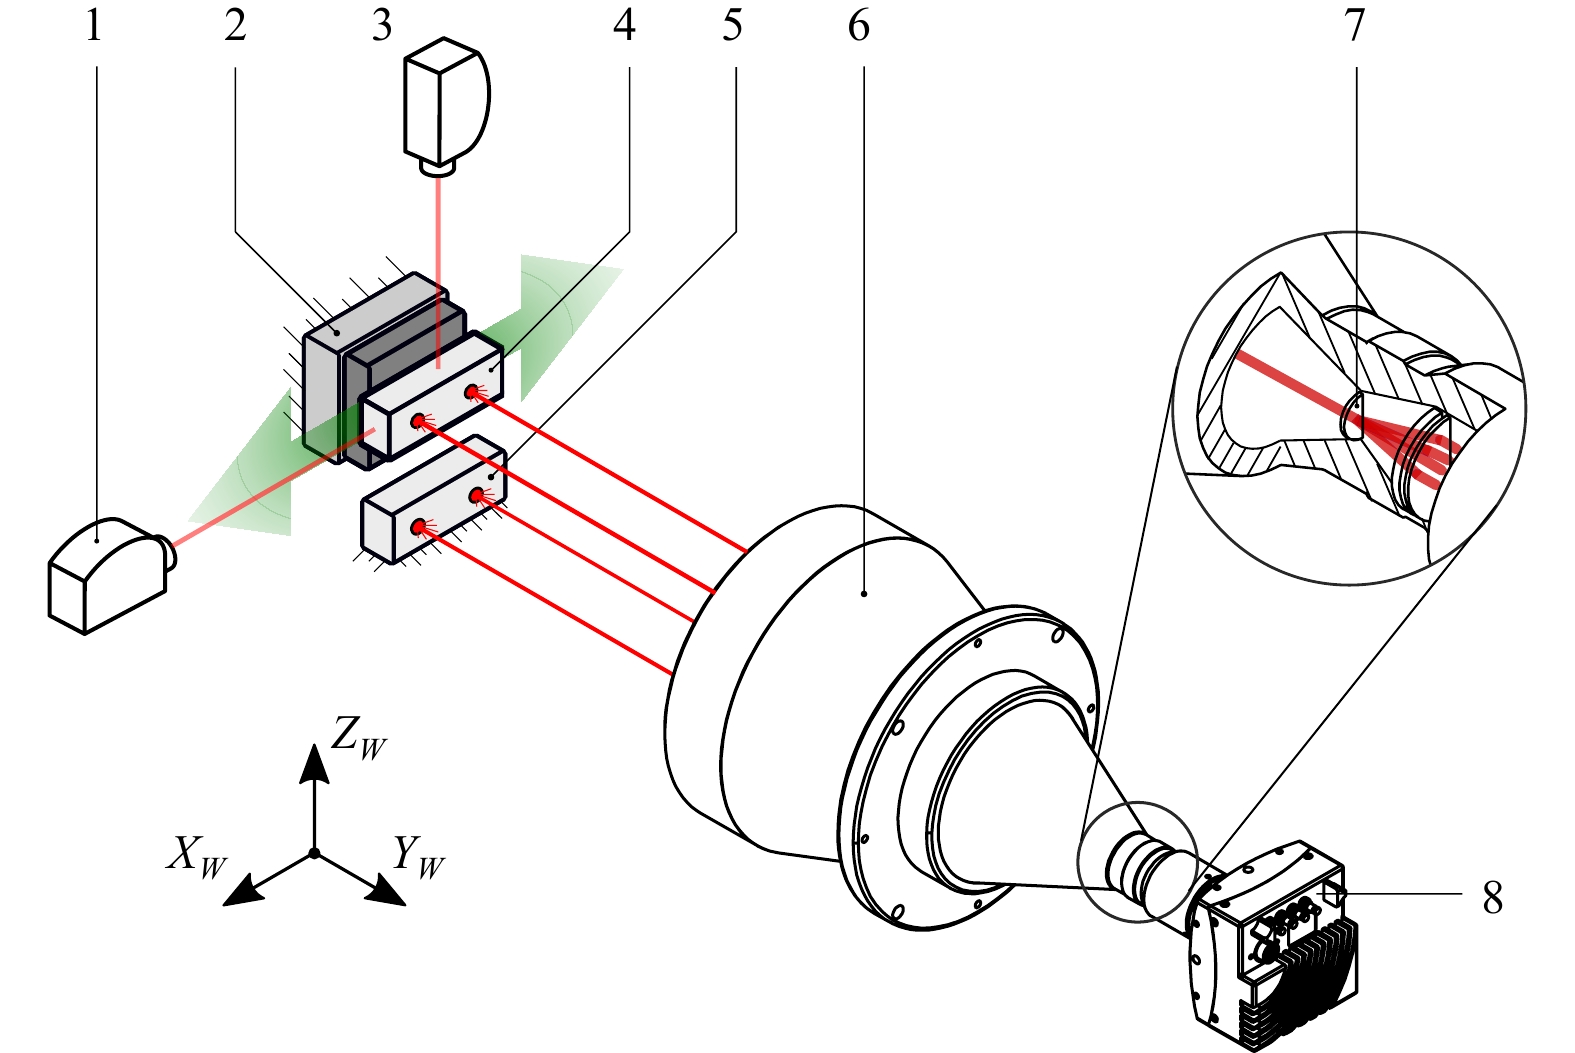
Fig. 3 Experimental setup:
A telecentric lens (6) images the light sources of a moving (4) and a static (5) object using a high-speed camera (8). Each spot of a light source is replicated using a DOE (7). A piezo stage (2) is used to actuate an object (4), and its displacement is measured by two vibrometers (1,3).In Fig. 5, the positional signals of the vibrometer and the camera are given in micrometer and pixel units. The reference signal of the
$ X $ -vibrometer is plotted in the middle (red). For clarity, the camera signals have an additional offset. The signal is evaluated using a conventional single spot (upper, blue signal) as described in Eq. 1, shifted by +3 µm. The averaged cluster position using the multipoint method (lower, green signal), calculated according to Eq. 2, is shifted by -3 µm. Both signals are high-pass filtered (30 Hz cutoff frequency). In the lower plot, the difference between the two camera signals and the reference signal is shown. It is clearly visible that the multipoint position signal ($ x_{cl} $ ) matches the vibrometer signal ($ x_{vib} $ ) better than the conventional single-spot evaluation ($ x_{sp} $ ) by a factor of 4. The standard deviation of the difference signals is$ \sigma_{sp} $ = 0.402 µm for a single spot, and$ \sigma_{cl} $ = 0.104 µm for the averaged cluster position. Applying the conversion factor$ k $ (Eq. (3)), this corresponds to$ \sigma_{sp} $ = 0.0069 pixels and$ \sigma_{cl} $ = 0.0017 pixels.
Fig. 5 Accuracy improvement of multipoint method:
$ X- $ oscillation measurement (frequency 50 Hz, 1 µm amplitude) with the proposed camera system and a vibrometer as a reference.The upper signal$ x_{sp} $ $ x_{cl} $ $ \pm $ $ x_{vib} $ -
To analyze the lower bound on the measurable amplitudes, we use the same experimental setup as in the previous section.
Our experiments show that an amplitude of 100 nm can still be measured using this method. Together with the measurement range of 148 mm this corresponds to a dynamic range of 1480000:1. In Fig. 6a the camera (red) and the vibrometer (blue) signals are depicted for an oscillation amplitude of 100 nm. Both signals are high-pass filtered (30 Hz cutoff frequency) to obtain the pure motion signals detected by the vibrometer and the camera. Despite the noise of the camera signal, the oscillation frequency is clearly visible and matches the vibrometer signal. An amplitude of 100 nm in the object space can be converted to the imaging sensor using the magnification
$ \beta' $ or the conversion factor$ k $ . This corresponds to 11 nm (0.0016 pixels) on the sensor. The difference between the vibrometer and the camera is plotted in the lower chart. The standard deviation of the difference signal in the image plane is$ \sigma_{d} $ = 0.095 µm or$ \sigma_{d} $ = 0.0015 pixels.
Fig. 6 Piezo stage oscillation (
$ X_W $ -direction) of 50 Hz and 100 nm amplitude measured by the proposed camera setup and a vibrometer as reference.a Position signals over time of camera (red) and vibrometer (blue); the difference is plotted beneath. Both signals are high-pass filtered (30 Hz cutoff frequency). b Amplitude spectrum of the camera signal (upper) and the vibrometer signal (lower). Both have a peak frequency at 49.62 Hz. The filtered-out ambient vibration spectrum is shown in light blue.Fig. 6b shows the amplitude spectrum of the camera (upper plot) and the vibrometer (lower plot). The filtered-out ambient vibration spectrum (below 30 Hz) is shown in light blue. It can be observed that both measured frequency spectra show good correspondence. The detected peak frequency of the proposed measurement system as well as that of the reference system is 49.62 Hz. Small stimulations at a frequency of approximately 100 Hz are also detected with both systems.
-
Ambient vibrations are present in almost every vibration measurement scenario. Conventionally, they are suppressed using a high-pass filter, as done in the previous sections. The frequency peaks of the ambient vibrations in our laboratory room are 10.4 Hz, 16.2 Hz, and 22.1 Hz. In the case of the vibrometer, those disturbing vibrations are not easy to avoid, whereas with the camera system, they can be suppressed almost entirely. Therefore, as described in the introduction, we use the relative movement between the moving and static light sources in the image.
A typical image containing four clusters,
$ C_0 $ to$ C_3 $ , is depicted in Fig. 7a. The blue clusters$ C_0 $ and$ C_1 $ belong to the light sources that are attached to the piezo stage, and the yellow clusters$ C_2 $ and$ C_3 $ belong to the static light sources (see Fig. 3a).
Fig. 7
a The camera image of the experimental setup of Fig. 3 containing four clusters. The blue clusters$ C_0 $ $ C_1 $ $ C_2 $ $ C_3 $ $ X $ $ (x_{c_0}+x_{c_1})/2-(x_{c_2}+x_{c_3})/2 $ $ x_{c_0} $ The relative position is calculated as
$$ x_{rel} = \frac{x_{c_0} + x_{c_1}}{2} - \frac{x_{c_2}+ x_{c_3}}{2} $$ (4) with
$ x_{\mathrm{c},i} $ being the$ X $ -coordinates of clusters$ C_{i} $ , i = 0,1,2,3.A spectral analysis was performed for the vibrometer, the absolute position signal of cluster
$ C_0 $ , and the relative position signal according to Eq. 4. The results are shown in Fig. 7b. Ambient vibrations introduced by the laboratory environment are marked in the spectrum of the absolute cluster position$ C_0 $ (middle plot) and in the vibrometer spectrum (lower plot) with green squares. The upper plot shows the spectrum of the relative position signal obtained using Eq. 4. It can be seen that all three peaks of the ambient vibrations are compensated almost entirely. We would like to emphasize that with this method, the signal to be measured does not have to be spectrally separated from ambient vibrations. The reason we have chosen a signal frequency higher than the ambient vibration frequencies was to be able to compare our results with the LDV. -
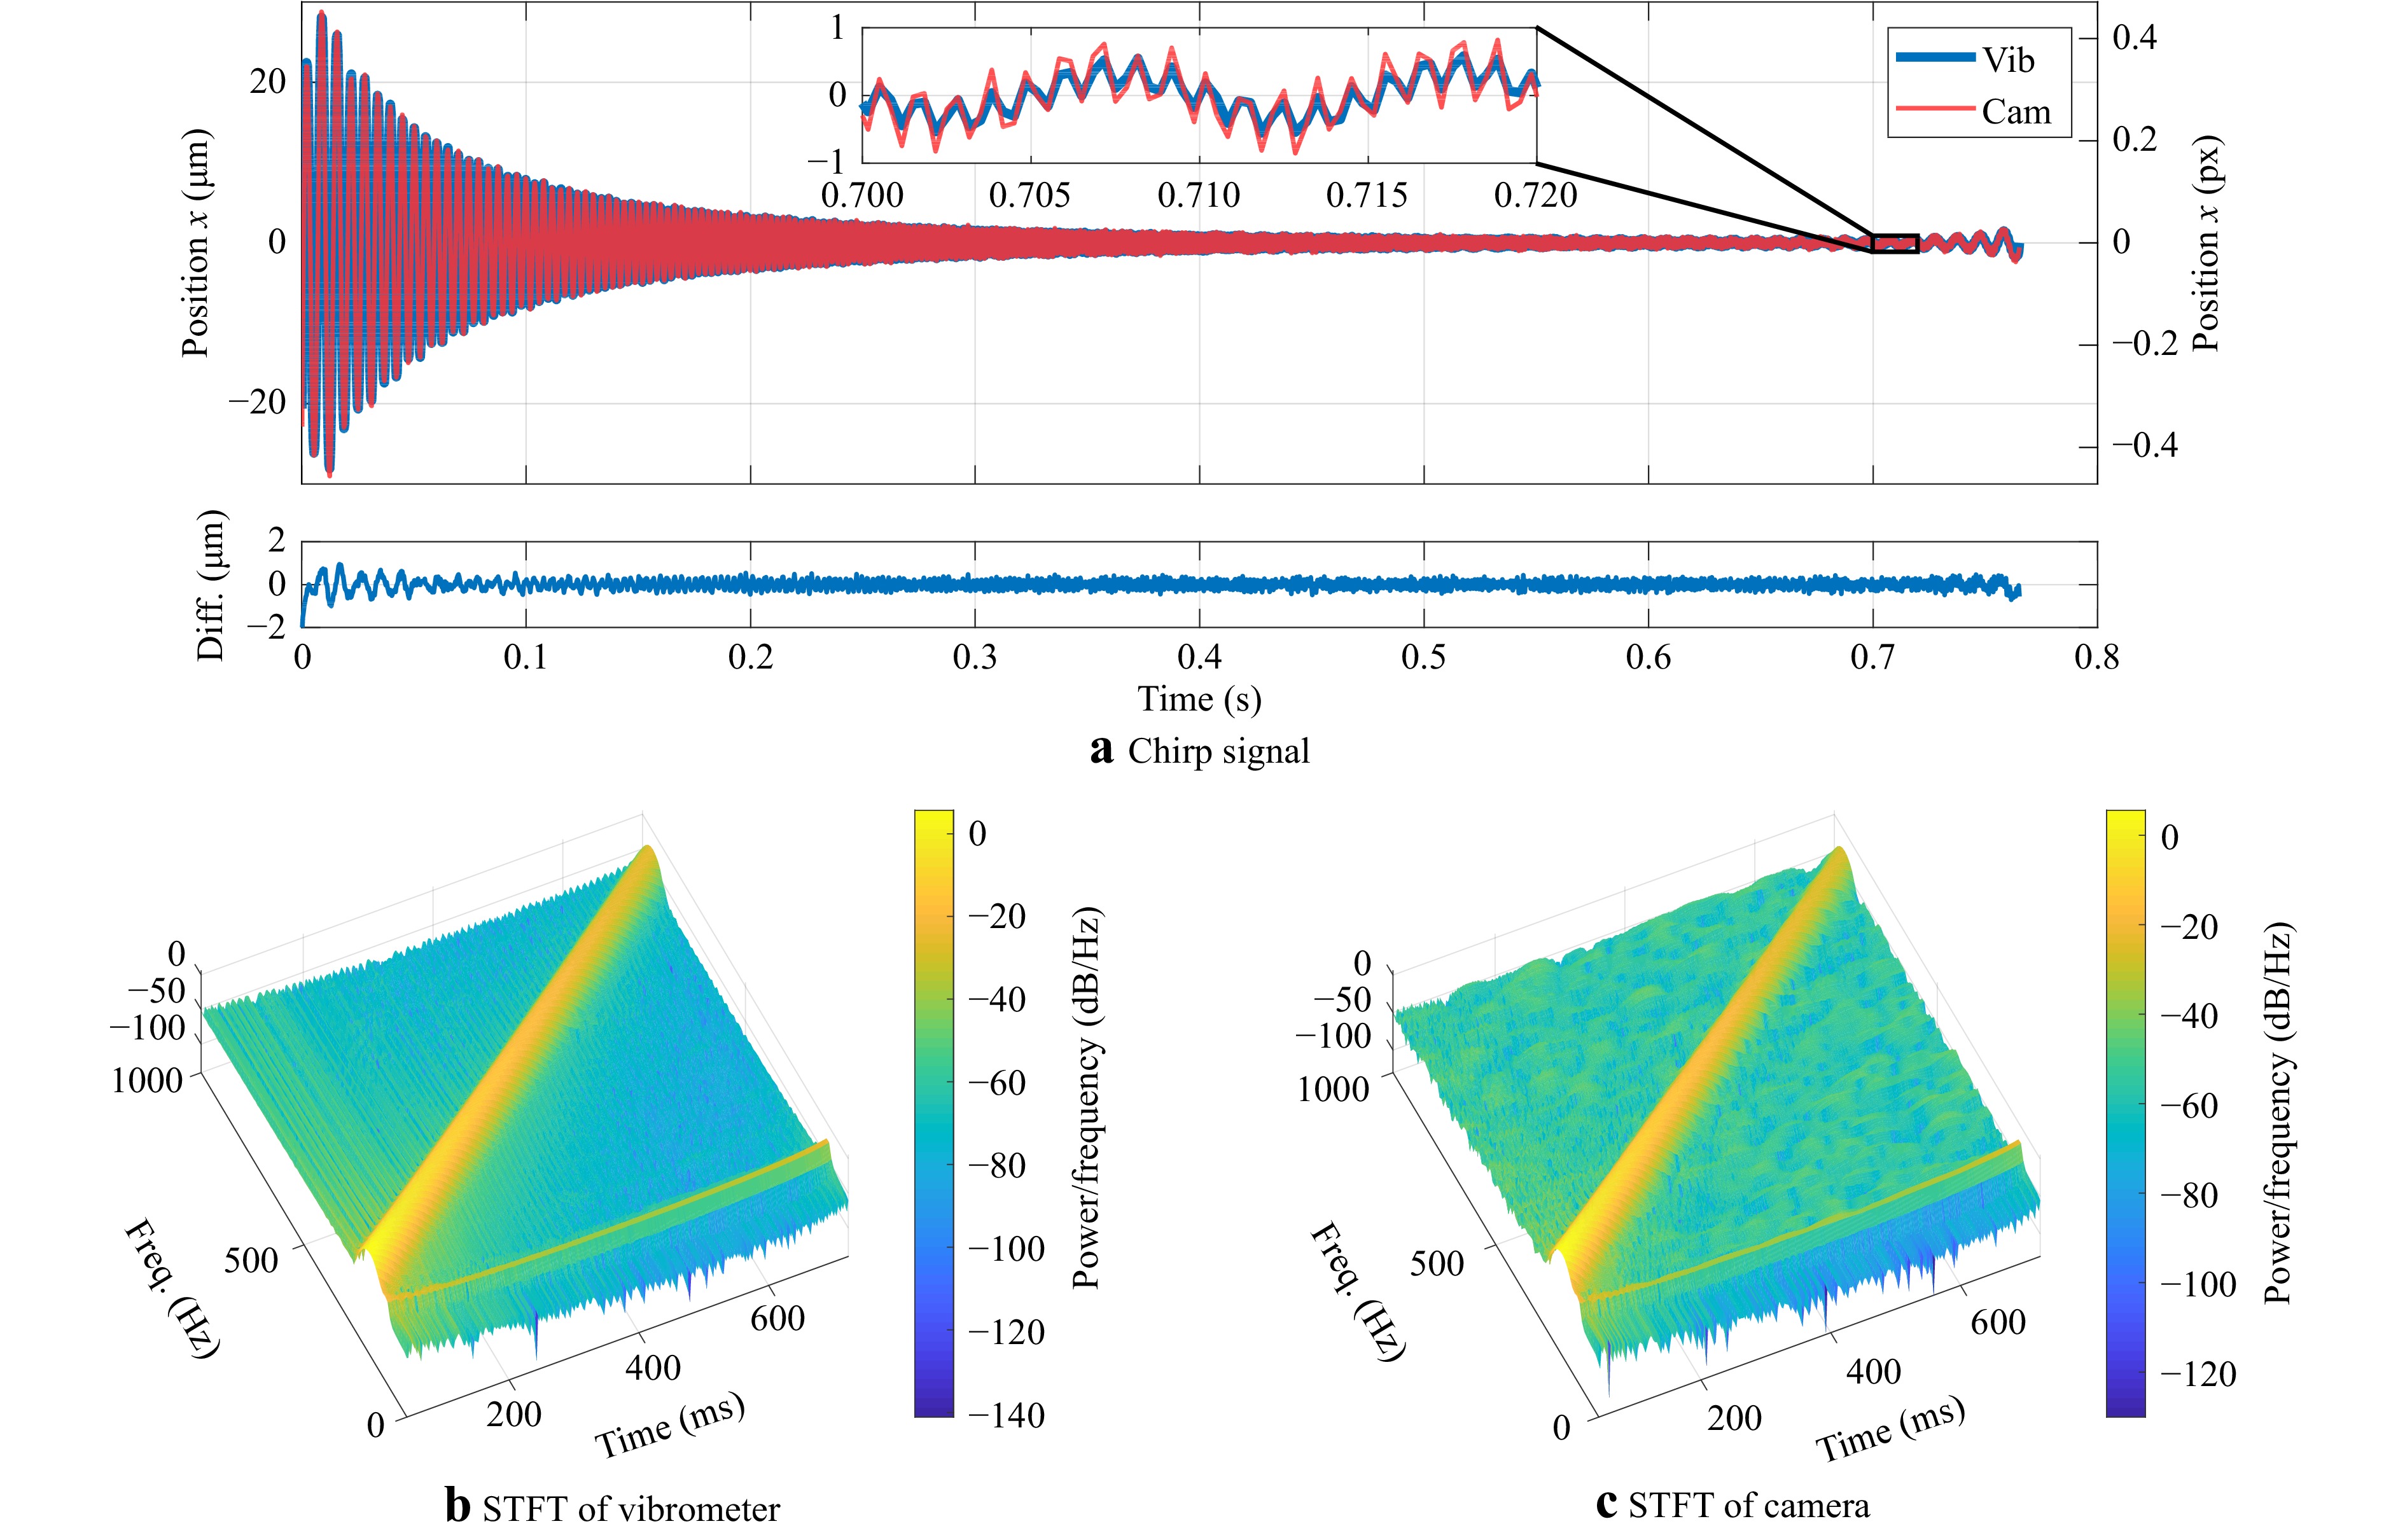
We also use a chirp signal to verify the sensitivity of the proposed measurement method over a wide frequency range. The chirp signal consisted of frequencies that linearly increased from 200 Hz to 1000 Hz at a constant amplitude. An inertial shaker is used to convert the chirp signal to a movement in the
$ X- $ direction, and a single light source is attached to the shaker tip. The camera frame rate is set to 3000 fps, requiring a reduced image resolution of 700 pixels$ \times $ 300 pixels. The vibrometer signal is also acquired at 3000 Hz.Fig. 8 shows the measurement results of the vibrometer and the camera, including the position signals in the time domain and their difference (a), as well as the short-time Fourier transform (STFT) of each signal in (b) and (c). The vibrometer and the camera signals are high-pass filtered with 30 Hz and both are compensated for positional and time offset. The time-domain plot demonstrates that the change in amplitude and frequency can be accurately measured by the proposed system. The standard deviation of the difference signal is
$ \sigma_{d} $ = 0.242 µm or$ \sigma_{d} $ = 0.0038 pixels. -
All presented measurement results were achieved by applying a (linear) conversion factor
$ k $ from the image domain to real-world units. However, as the vibrational amplitude increases, the influence of lens distortions on the position signal increases. To evaluate the introduced error due to the linear mapping, an accurate calibration of the camera system would be necessary. However, if larger amplitudes are to be measured, a resolution of 100 nm often is not necessary. In [29, 30], it was reported that the standard deviation of the reprojection error for a linear conversion factor is 16 µm (standard deviation) for a measurement field of 100 mm × 74 mm. Simulations using 1000 different measurements with amplitudes ranging from 0.1 mm to 50 mm show that the standard deviation is in good approximation linearly dependent on the amplitude. Therefore, depending on the application (vibration amplitude size, desired accuracy), it has to be decided whether calibration is necessary. For our experiments, this error was negligible because the measured amplitudes were very small.Similar to any other vibration measurement method, the proposed system has certain advantages and disadvantages. The precision of the proposed method depends on the amount of light available at the object points. To achieve a high signal-to-noise ratio, we applied active light sources with commercial pinholes (Thorlabs, P200K) mounted in front to obtain small spots and a similar intensity distribution for all clusters. A commercial pinhole is rather inconvenient for use in industrial applications because it makes the light sources bulky and difficult to attach. Here, a blackened aluminum foil with small holes can be used as the aperture, placed in front of the LEDs. Together with a small coin cell, the LED modules can become very small, easy to attach, and can operate independently. Another disadvantage compared to an LDV is the need for active light modules that must be attached to the object. One solution for this issue is the use of fluorescent particles or micro reflectors (spheres) that are attached to the object, in combination with external illumination. The resulting effect on measurement resolution, in particular for small amplitudes and high frequencies, will be discussed in a following publication.
On the other hand, the advantages of the system include its high resolution and ease of use regarding application and signal processing. Furthermore, with the proposed camera-based method, it is possible to measure the vibration amplitudes directly in two dimensions without the need for time-based integration of the acceleration signal, as would be necessary for LDVs. This also offers the opportunity to measure the relative movements between multiple target points.
The concept of averaging over a certain lateral domain to increase the measurement uncertainty is used not only in our method, but also in digital image correlation (DIC), which is a common technique for measuring full-field vibrations. In DIC, the resolution as well as the accuracy of lateral (in-plane) and axial (out-of-plane) position measurements depend on the size of the correlation patch. Using large correlation patches, the in-plane and out-of-plane resolution of DIC can be very good. In [31], for example, a sensitivity of 3.3 µm was reported for a field of view of 100 mm
$ \times $ 80 mm. Large patches, however, also lead to reduced lateral resolution and sampling of this lateral and axial position measurement. This is a problem for high lateral resolution measurements, which are necessary, especially for objects that deform. In DIC, even slight deformations over the extent of the correlation patch lead to inaccuracies in the correlation. Our method avoids this problem by averaging while maintaining the highest lateral resolution of the object by using localized small object points. Averaging is realized in the image space instead of the object space.To date, the multipoint method has been used for the measurement of building deformation and 2D/3D coordinate measurements29,30,32,33. In the case of building deformation measurement, accelerometers are often employed because of their high resolution and ease of use. However, accelerometers measure only changes in velocity and, therefore, tend to drift, especially for slow movements. In addition, they often need wiring for power supply and data transfer, which makes them more inconvenient to apply, compared to an independent light module.
The application scope of our method is mainly seen in the industrial sector, for example, in measuring vibrations of car engines, car body parts (e.g., brakes), or other objects where it is helpful to measure at multiple positions simultaneously. Applications that are not practicable for the proposed method are those in which the mass or stiffness of the measured object is changed significantly by the applied light modules, for example in mini- or microsystems or perhaps in ultra-lightweight constructions. For larger applications such as bridges or buildings, the multipoint method can also be used, but error influences resulting from air turbulence and thermally induced refraction index changes must be considered. As long as these restrictions are considered, this measurement system offers a cheap and simple way to measure a large range of amplitudes with very high resolution.
-
The proposed vibration measurement system is based on the detection of active light markers attached to a vibrating object. A diffractive optical element is used to replicate each light source holographically into a cluster of
$ N $ = 21 spots in the image plane. Spatial averaging of all spot centers per cluster improves the detection accuracy of the light marker position ideally by a factor of$ \sqrt{N} $ .The proposed vibration measurement setup is able to detect vibration amplitudes of 100 nm clearly in both the spatial and frequency domains with a standard deviation of
$ \sigma_d $ = 0.095 µm, which corresponds to$ \sigma_d $ = 0.0015 pixels. To the best of our knowledge, this is the highest reported accuracy for imaging-based spot position measurements. The dynamic range of the proposed system is 1480000:1. High frequencies were analyzed by attaching a light source to an inertial shaker. A chirp signal from 200 Hz to 1000 Hz with amplitudes from 28 µm to 0.3 µm was measured. Both spectrograms (STFT) of the camera and the vibrometer show good correspondence.We also showed that ambient vibrations can be compensated almost entirely by calculating the relative movement between the light markers attached to the environment and to the object, making it possible to avoid the use of band-pass filters. In addition, the concept of band-pass filtering may also be combined with the aforementioned subtraction method. In this way, the signal quality in terms of noise of the specimen, which vibrates with a frequency in the range of the ambient, can be improved even further. The main advantages of the proposed method are its simplicity and cost regarding components and signal processing, and in the high resolution that can be achieved even under external disturbances.
-
We gratefully thank the German Research Foundation (DFG - Deutsche Forschungsgemeinschaft) for funding the projects “Dynamische Referenzierung von Koordinatenmess- und Bearbeitungsmaschinen” (OS 111/42-2 and SA 847/16-2).









 DownLoad: