


-
In many digital signal applications, compression of the digital data is often required because of the scarce storage available in comparison to the volume of data that needs to be stored, or because the utilized transmission channel has insufficient bandwidth to allow for timely delivery of the desired content. Hence, enormous efforts have been invested by the research and industrial communities in standardization bodies such as the International Standardization Organization (ISO), the International Electrotechnical Committee (IEC) and the International Telecommunication Union (ITU), more recently international industrial consortia such as the Alliance for Open Media (AOM) or individual organization solutions. Leading international committees are the Joint Photographic Experts Group (JPEG) and Moving Picture Experts Group (MPEG) for still image coding and video & audio coding, respectively, both representing working groups of ISO/IEC which are regularly producing joint standards with ITU-T Subgroup 16. The importance of these initiatives, representing huge efforts, cannot be underestimated. The delivered standard frameworks enable interoperability between devices and applications and as such also shape the bases for a whole ecosystem that gives rise to a whole range of (novel) media products & services that are supporting worldwide communication and media distribution platforms.
Important to mention here as well is that the impact of the above standards is not limited to the ‘multimedia’ application domain, but also impacts biomedical ecosystems. These standards are actually ‘horizontal standards’, meaning that they are considered as components that can be integrated in several vertical application chains. Digital Imaging and Communications in Medicine (DICOM) has adopted for example several JPEG and MPEG standards that are now being used in medical imaging (CT, US, MRI, etc.), pathological imaging, and so forth.
A bold statement though, but if one desires holography to flourish, one of the key enabling factors — besides naturally the availability of underlying generation, processing, and rendering technologies — will be whether one succeeds in defining efficient ways to exchange holographic content as it is the case for more classical multimedia content. In fact, large data volumes is one of the biggest challenges faced by digital holography, where efficient compression solutions are key to widespread adoption of these techniques.
A single phase measurement in interefometric applications like digital holographic microscopy (DHM) and holographic tomography (HT) requires one (for the Fourier Transform Method of phase retrieval) or a few holograms (for the Phase Shifting Method) captured for example by a popular Sony IMX250 camera (4.8 MB). However, the storage requirements increase significantly in the case of time-lapse, long-term experiments (1 hour, 1 frame per sec – ap. 173 GB), and large fields of view for multi wells cell culture or pathology slides analysis (15 mm × 15 mm – ap. 100 GB/slide). A typical single tomographic measurement requires capturing between 45-180 holograms per measured volume (0.2−0.8 GB). However, nowadays systems utilizing solutions that better allow to understand the microbiological world by taking into account multi-spatial-temporal scales1. Such an approach requires capturing tomographic data from large fields of view (stitching multiple volumes) and for thick samples (digital phase histopathology) and/or for long term monitoring of cell cultures or organoids. This brings us to severe storage requirements reaching several TB per measurement sample or time lapse measurements.
The quality of holographic displays powering visualization applications like XR/VR/AR is measured by the space-bandwidth product (SBP)2,3, which constraints both the size of the display and its field of view (FoV) aperture. Indeed, to achieve their diffractive behaviour and provide a large viewing angle, displays need very small pixels, with pixel pitches in the order of the wavelength of visible light. For instance, a monochromatic green hologram of size 10 cm × 10 cm with a wavelength of 535 nm and a FoV of around 120° would require a pixel pitch of 0.3 μm and a resolution of more than
$ (300\;K\; \times\; 300\;K) $ , which implies an uncompressed single frame would be larger than 1 TB.And this represents actually the challenge; few investigations — relatively seen — have been spent on efficient compression and representation of holographic content. Though we can build upon the expertise related to more classical media content, holographic content represents a set of particular challenges, which cannot be easily by-passed; to name a few: its interferometric nature leading to completely different data behaviour and statistics not matching those expected by classical coding engines. Natural imagery is predominantly low pass, where the power spectra tends to be
$ \propto {1}/{f^2} $ , where f is the spatial frequency4. In the case of holograms, each component in the frequency domain represents the contribution of plane waves travelling from some corresponding direction incident at the hologram plane. In particular, they contain high-frequency coefficients which play a major role in 3D visualization and cannot be discarded as in typical image coding techniques. The other difference is related to signal representation, as holograms can be described in myriads of forms, e.g. complex-valued or amplitude-phase based representations. Luckily, this demand has been picked-up by the international research community and moreover, the JPEG committee has identified this need and did recently launch a Call for Proposals for Holographic Content Coding5.Another related challenge that requires some particular attention is how to assess the quality of holographic content. For regular image content this is rather straightforward; what an observer sees is immediately interpretable by our brain and a photographic representation of the scene. Hence, it is relatively easy for humans to adhere a quality score to the observed content. Measuring whether this appreciation is scientifically correct is more difficult, but sound subjective quality assessment procedures have been designed and validated. Quality scores that can be validated on the ‘ground truth’ produced by the earlier mentioned subjective quality assessment procedures can also be obtained numerically, by deploying mathematical measurement procedures accounting for the signal’s fidelity, typical image features and potentially also aspects of the human visual system. These subjective and objective quality assessment procedures are evidently not perfect and operate within certain probability bounds, but nonetheless provide sufficient bases for codec evaluation procedures and visual quality measurement products.
Unfortunately, holograms are wave-based projections of a 3D scene and hence not immediately interpretable by human observers. Hence, even measuring the quality of a hologram directly on the hologram itself by solely a numerical quality measure is not necessarily telling the full story of the signal’s quality. The numerical or optical reconstructions of the hologram might for example depict a completely different quality depending on the viewing angle or viewport at which this content is being consumed. Also here significant steps forward have been made in recent years, at least from a methodological perspective, on which we will elaborate too.
In the next two sections of the paper, we give an overview on two distinct application domains of holography - biomedical imaging and autostereoscopic visualization. Thereafter, the state of the art on compression technology with respect to holographic content is discussed. In the subsequent section, quality assessment procedures are addressed, covering both subjective and objective procedures, after which we dive into a more elaborate discussion on the challenges faced and what to expect or ambition as future endeavours. Finally, this paper is winding up with a conclusion section.
-
In this section, we discuss a number of application domains that are in need of efficient hologram representation and compression technologies, starting with biomedical imaging that has experienced already a vast deployment of holographic imaging techniques.
Quantitative phase imaging (QPI)6, is a label-free approach to imaging cells and tissues, that combines qualities found in microscopy, holography and light scattering techniques: nanoscale sensitivity to morphology and dynamics, 2D, 3D and 4D non-destructive imaging of transparent structures, and quantitative signals based on intrinsic (phase) contrast.
DHM and HT are the most popular and powerful techniques applied in QPI7-9. It should be noted that microscopy, which deals with small objects, is the best suited application for digital holography, as the space bandwidth product (SBP) of these objects can easily be matched to the SBP of available detectors. All these facts are fully confirmed by the success of many commercial DHM (e.g. Lyncée Tec and Ovizio) and HT systems (Nanolive10 and Tomocube11). Also, it should be noted that the big players on the optical microscopy market (e.g. Carl Zeiss AG, FEI Company, Hitachi High Technologies Corporation, JEOL Ltd, Leica Microsystems, Nikon Corporation, Philips Healthcare, Olympus Corporation) are moving towards digital and quantitative microscopy in which digital holography is a natural future choice.
DHM can efficiently overcome the most severe limitations of microscopy, namely the very limited depth of field as well as enabling the imaging of phase (transmissive) micro-objects. Holographic microscopy records the light wavefront originating from an object instead of the projected image of the object recorded in common microscopy. The viewable image and quantitative (phase) representation of a micro object is created using a numerical reconstruction algorithm12. The numerical reconstruction of the digitally recorded holograms makes it possible to obtain the whole complex diffracted wavefront, i.e. both its amplitude and phase, thus offering the possibility of propagating it further. Such numerical propagation provides many advantages including accurate measurements of an integrated phase of an object (dry mass of a cell), performing autofocusing, extending depth of focus and correcting any kind of aberrations. Examples of life science applications of DHM include cell dry mass extraction and monitoring13, cell culture inspection14, automated cell counting, recognition, and classification for diagnostic purposes with the use of artificial intelligence15, digital phase histopathology16, assessing cellular responses induced by new drugs17, and performing label-free high content screening18 to name just a few.
Due to the integrated character of the data delivered by digital holography (each phase value laterally represents the accumulated phase along all points along the optical axis), QPI realized through DHM has limited capabilities for providing full 3D structural information about cells or tissues. To overcome this limitation, tomographic versions of QPI are applied6. Among these methods, optical diffraction tomography based on holographic projections9 demonstrates a wealth of possibilities for 3D imaging in biomedical applications9,19, not possible with conventional forms of tomography such as computed tomography (CT)20. CT scan techniques make use of X-rays to provide an accurate representation of a 3D object. However, since CT is based on ray optics, it assumes non scattering objects where object features are larger than the imaging wavelength. On the other hand, holographic tomography (HT) is based on the diffraction of light and can be used for capturing very fine details and enabling radiation-free biomedical imaging. Furthermore, in HT the reconstruction obtained from the measurements of multiple 2D holograms (projections) is the 3D refractive index (RI) distribution of the weakly scattering sample under study.
The optical setup for holographic tomography consists of a DHM equipped with a unit controlling illumination beams impinging onto a sample by means of one of two alternative schemes: an object rotation (Full Projection Angle HT, FAHT) or illumination beam rotation (Limited Projection Angle HT, LAHT)9. In LAHT, the specimen is stationary, while holographic projections are acquired for different object illumination directions. This makes it a perfect tool for measuring single biological cells, cell cultures and tissues directly at Petri dishes or microscopic slides. After all data is captured, specialized tomographic reconstruction algorithms are employed to retrieve the 3D refractive index distribution21. Because RI values depend on the number of intracellular biomolecules, LAHT allows label-free, high resolution quantitative 3D morphological mapping of biological specimens including fixed and live cells19,22, tissues23 and even organoids and small organisms24.
The most popular optical configuration of research and commercial digital holographic microscopes applied for transparent objects is a Mach-Zehnder interferometer with an additional microscope imaging setup in the object arm, to image the object on the image sensor with high magnification. The output hologram is captured as the result of interference between reference and object beams.
Depending on the detector location in an object diffraction field, the recorded digital hologram is an image plane (IPH) or Fresnel hologram (FH). An IPH’s capture yields several benefits: a) avoiding the need for numerical propagation, therefore simplifying QPI processing and allowing for easy switching between modalities that do not allow for numerical refocusing, such as white light or fluorescent imaging; b) compact design by shortening the object arm25; c) concentrating optimally the bandwidth of individual diffraction orders26. Also, in the case of IPHs, the amplitude of an object can be captured solely by recording the object beam intensity in the absence of the reference beam. On the other hand, if the object plane cannot be well identified or optical refocusing is required, the registration of a Fresnel hologram is necessary and the complex amplitude of an object is reconstructed by numerical propagation of the captured wavefront to the object plane12.
IPHs and FHs can be captured in two alternative ways depending on whether or not there is an angular difference between the propagation directions of the object and reference wavefronts: as on-axis or off-axis holograms. The spatial bandwidth product (SBP) of these two types of holograms vary significantly and so impose different requirements on the space-bandwidth of one’s detector. In the first case, the detector and object SBPs are comparable, while for off-axis holograms a significant carrier frequency is required, which increases the necessary detector pixel count at least four times. On the other hand, an advantage of off-axis holograms is that the three diffraction orders can be separated in Fourier space thus easily allowing reconstruction of the object wavefront. The off-axis tilt introduces a carrier frequency that allows one to spatially separate +1, −1 and 0 diffraction orders in the Fourier domain. In case of full spectral separation, a fast and robust Fourier filtering method27,28 is applied to a single hologram.
For on-axis holograms, or holograms with insufficient carrier frequency, the one wanted diffraction order cannot be separated in the Fourier domain. This is acceptable for applications that only require intensity reconstructions, such as for the three-dimensional localization of particles29. To obtain quantitative phase or full-complex reconstructions from an on-axis configuration, the concept of phase shifting digital holography (PSDH) can be used30. PSDH requires capturing at least three phase shifted holograms (although more provide robustness) of the same object wavefront. This redundancy of information enables numerical elimination of the twin and the zero-order terms and provides an accurate object phase reconstruction. Unfortunately, PSDH cannot be applied (or is difficult to apply) to measure dynamically changing objects or in the case of unstable environments or long time-lapse sessions, as it requires capturing multiple holograms for a single measurement. These are the reasons why off-axis holograms and the Fourier transform method (FTM) of phase retrieval are applied in most of the research and commercial DHM systems31.
Regardless of the phase retrieval method, the output data and results from DHMs are delivered in two main formats: a) holograms (interference patterns) being real-valued greyscale images representing high spatial frequencies (for off-axis holograms, dense fringes) and relatively low spatial frequencies (for on-axis and quasi on-axis holograms); and b) complex amplitudes (or real-imaginary components) of the object field. The phases are calculated by FTM or PSDH, while the amplitude is additionally captured (image with no reference wave). In FTM, the bandwidth of the first order term that encodes the received wavefield is limited to a well defined region in the Fourier domain26. These complex amplitudes represent objects directly (in the case of image plane holograms) or should be numerically propagated to an object plane in the case of Fresnel holograms.
For holographic tomography it is obligatory to deliver a set of complex amplitudes acquired within a range of viewing angles, which are later processed with one of the tomographic solvers1,21. HT setups are similar to their DHM counterparts, but utilize multiple consecutive oblique illumination beam incidences instead of the single normal illumination beam incidence used in DHM. The most common optical architecture for HT is a Mach-Zehnder interferometer with an illumination beam scanning module (LATH configuration) and in-plane off-axis holographic projections capture. Such configurations have already been used in commercial solutions such as NanoLive10 and TomoCube11 products. The basic output data from HTs are multiple holograms per a single measurement followed by retrieval of complex amplitudes (CA) of holographic projections gathered into CA sinogram. However, the final HT output is a 3D distribution of refractive indices reconstructed in the measurement volume. The most basic tomographic reconstruction algorithm taking diffraction into account, namely direct inversion, is a reconstruction method that utilizes the Fourier Diffraction Theorem. It assumes either the Born or Rytov approximations of single scattering. The latter has no restrictions on sample thickness and is thus more suitable for analysis of biological specimens.
DI allows for the reconstruction of a 3D scattering potential from multiple complex-valued projections. However, when this method is applied to data acquired with a LAHT system, highly distorted results are obtained21. Thus, numerous iterative algorithms with constraints applied in each iteration are reported in the literature1. The most often presently used approach is the Gerchberg-Papoulis (GP) method with total variation minimization or object support constraints21. The tomographic reconstruction algorithms for LAHT are still not fully mature and they are the object of extensive research by many groups, including the application of artificial intelligence methods1. Therefore, a compression type that preserves the original complex-valued object wavefield, permitting future changes in the processing pipeline used by reconstruction algorithms, is most suitable (Table 1).
System Recording set-up Representation Information output DHM Single DH measurement Hologram(s) (intensity images) 2D map and its changes over PSDH (multiple DHs) with or without carrier frequency time at multiple depths Multiplexed Complex amplitude Phase/dry mass Time-lapse (both real and imaginary terms) Movement trajectories in three Large-sample (FoV) dimensions Time-lapse + large FoV Visualization HT Single HT measurement Hologram (intensity image) 2D RI (at best focal plane) (projections differing through scanning) with or without carrier 3D RI illumination or wavelength frequency Changes in time of Thick sample (multiple depths) Complex amplitude sinogram 2D or 3D RI Time-lapse + large volume (or real/imaginary term) Visualization Table 1. Overview of the most common hologram recording setups, their preferred representations, and typical information extracted in biomedical applications
-
Another important use case for Holography is the field of 3D visualization. Indeed, by embedding all the information describing light waves scattered by a scene in 3D space, the holographic signal contains all the data needed to provide the most convincing depth illusion to the human eye. When looking at a hologram properly displayed and illuminated, viewers perceive the recorded 3D scene as if it were physically present, with proper shade, texture and geometry. More specifically, holography reproduces all the depth perception mechanisms, also called Human Visual System (HVS) depth cues, occurring in natural vision, and solves the Vergence-Accommodation Conflict of stereoscopic systems32.
To display a hologram, the typical approach is to use a beam shaping device called Spatial Light Modulator (SLM). These are electrically or optically addressed panels which reproduce the recorded object wave by modulating the amplitude or the phase of the illuminating light beam. Several SLM technologies can be used for holographic displays, including Liquid Crystal on Silicon (LCoS)33, Digital Micro-mirror Displays (DMD)34,35 and Acousto-Optics Modulators (AOM)36.
Current commercially available SLMs have resolutions typically limited to 1920 × 1080 or (3840 × 2160) and pixel pitches of about
$ 4\mu\rm{m} $ ; hence commercial holographic displays using SLM technology are now available on small devices such as Head-Mounted Displays37,38 or automotive windshields. To develop larger holographic TV screens, it is possible to spatially tile multiple SLMs, increasing the size and/or FoV of the displayed hologram39. However, building a system of seamless tiled SLMs is very challenging, and the resolution of such systems is still insufficient for very large holograms.To plot large holograms with a pixel size in the order of the wavelength of visible light, it is possible to print them onto a photosensitive plate using a wavefront printer40, whose general setup is shown in Fig. 1. These printers typically comprise a laser, controlled by an electronic shutter, an SLM, a demagnifying lens system, and a photosensitive plate mounted on an X-Y moving stage. The large-resolution hologram is segmented into several rectangular tiles, which are displayed one after the other on the SLM. For each displayed tile, the control system opens the shutter to illuminate the SLM by the laser beam. The reconstructed object wave is then demagnified by the lens system and exposed to the photosensitive plate, which is also illuminated by the laser beam from the other side. After exposure, the shutter is closed and the plate is translated by the X-Y stage to the next exposure position, while the next segment of the hologram is displayed on the SLM. This process is repeated until the entire hologram is exposed. In addition to enable the display of large holograms with a wide FoV, wavefront printers can also print Holographic Optical Elements (HOE) combining several custom optical functions to enable extreme miniaturization of complex optical systems41.
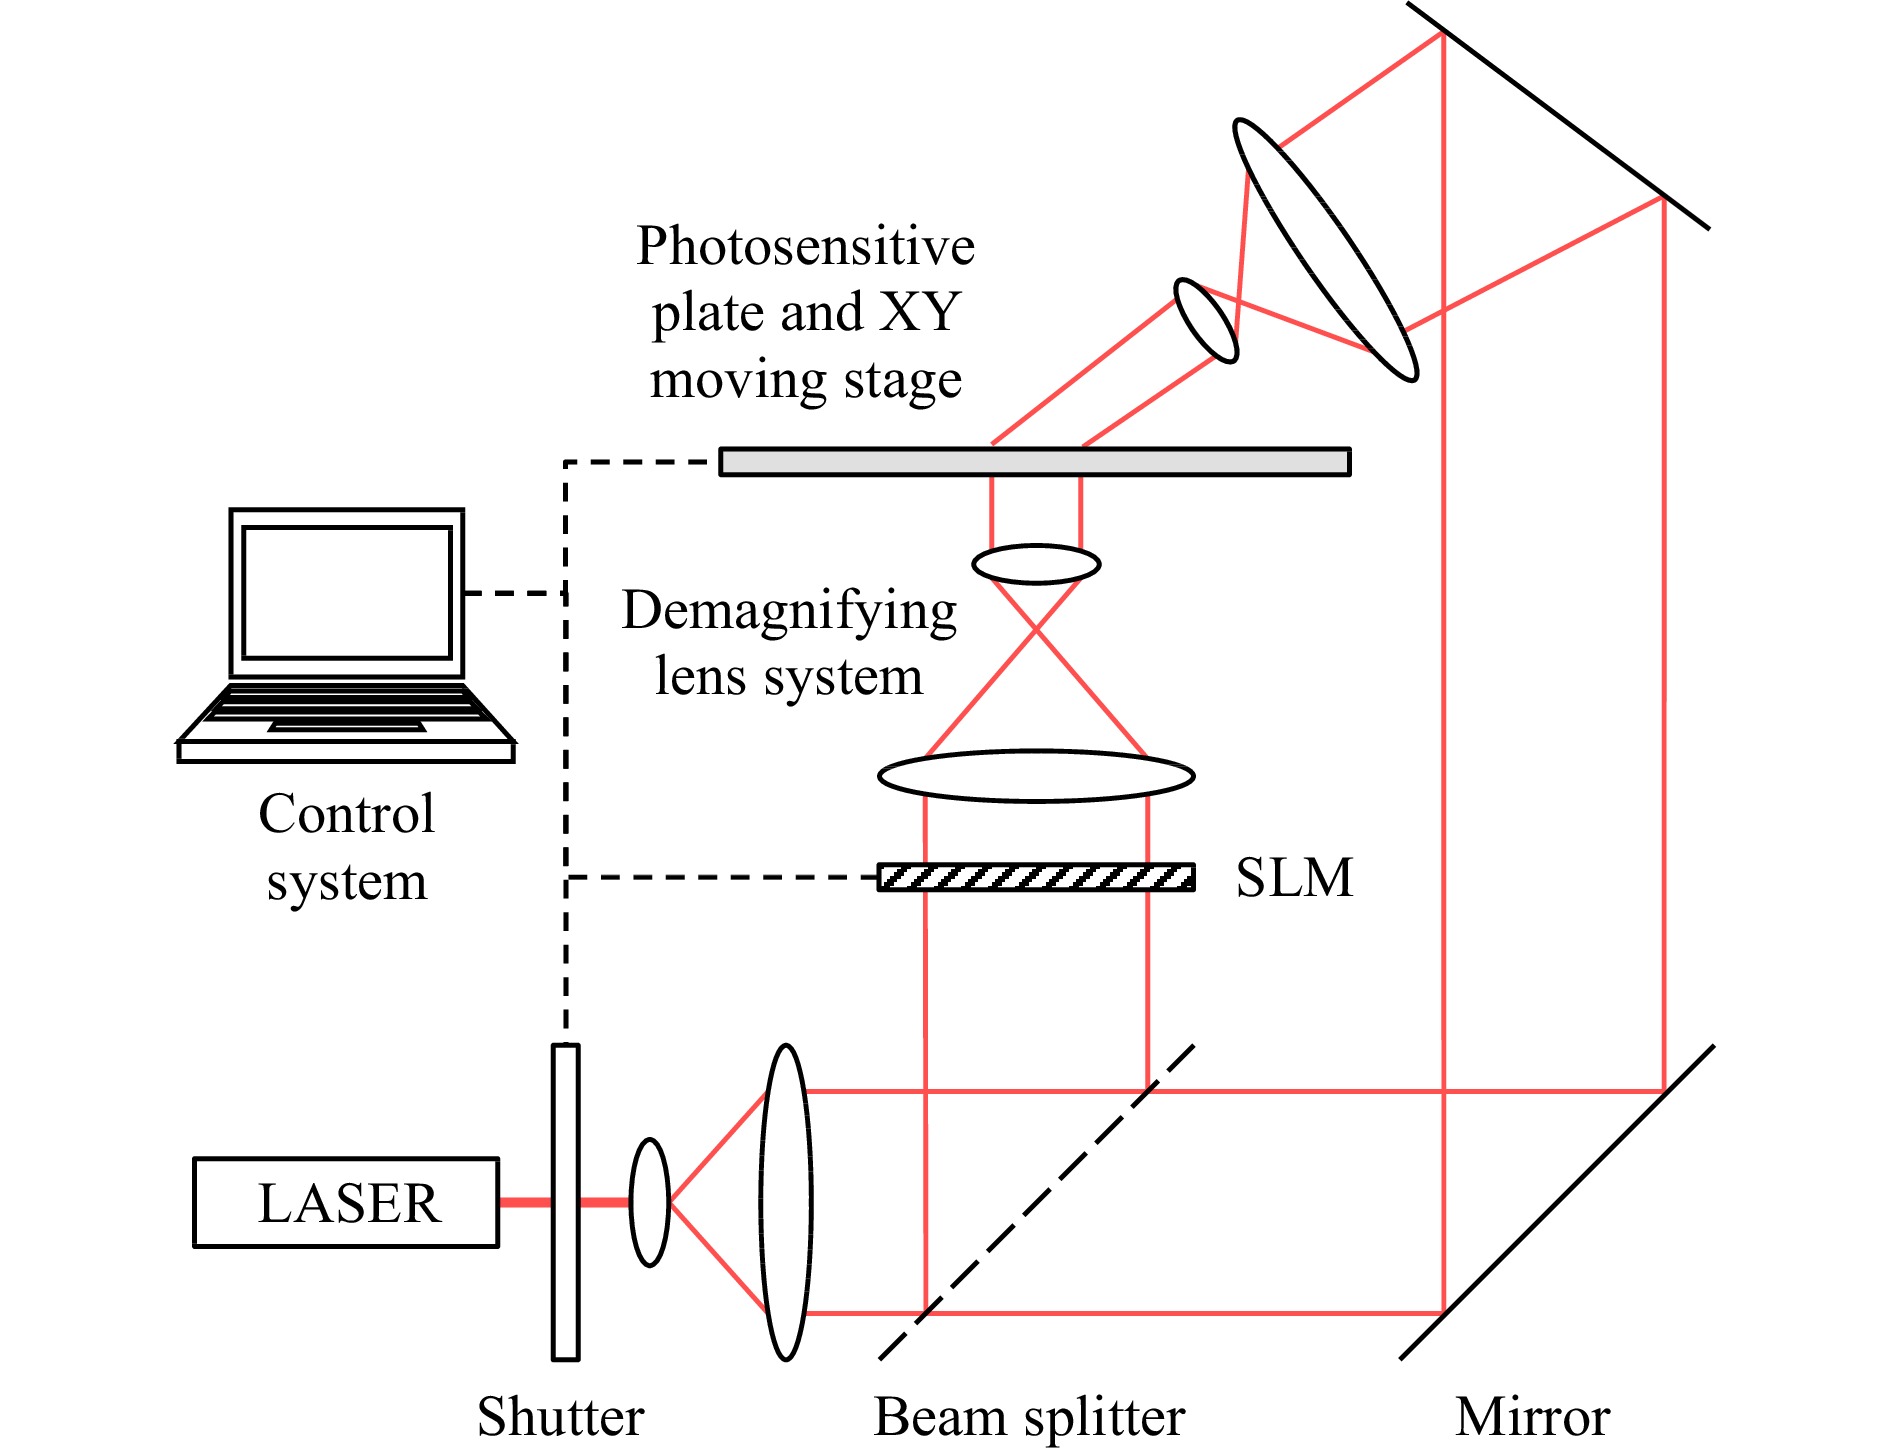
Fig. 1 Wavefront printer setup.
As explained previously, data transmission for holography is a major issue, requiring novel compression algorithms able to significantly reduce the memory and bandwidth consumption of holographic signals. From this observation, one could argue that it would be more efficient to compress and transmit the data representative of the scene – such as Multiview data or 3D meshes – and convert it to a hologram on the display side using Computer-Generated Hologram (CGH) synthesis methods42-44. Nevertheless, in the case of biomedical holograms, the 3D information of the scene is not available. Moreover, in this transmission scheme, the client terminal would have to convert the compressed 3D scene data to hologram sequences in real-time, which is still very challenging using state-of-the-art calculation methods, especially for holograms containing billions of pixels. This is particularly challenging in broadcast scenarios, i.e. one-to-many transmission where one attempts to globally optimize the system, and as such having an N times repeat CGH calculation is highly undesirable. This is of course all on the condition that decoders depict a low complexity — which is usually the case — and that the compression bitrate achieved is meeting the channel bandwidth capacity. Holographic data coding is therefore required for both biomedical and visualization scenarios. Table 2 synthesizes the most common hologram visualization methods.
Use case Visualization device Representation Resolutions Display Spatial Light Modulator (SLM) Complex amplitude or real/imaginery term 2 × 10⁶ to 3 × 10⁷ Printing Photosensitive plate Complex amplitude or bilevel phase Over 1010 Table 2. Overview of most common hologram visualization methods, their preferred representations and resolutions.
-
In this section, we provide an overview of the state-of-the-art in holographic compression solutions. We will start with an evaluation of existing coding standards, which are appealing because of their broad support, but that unfortunately do not cope well with the particular signal properties of holograms. Thereafter, we discuss solutions that have been proposed to handle the signal characteristics of holograms, and we end with a discussion addressing compression solutions in the context of metrological applications, which are important in the context of biomedical imaging.
-
In this section, we give a brief overview of the various image and video coding standards that are in popular usage for both lossless and lossy compression. Lossless compression bitrates are often significantly larger than for lossy compression and is usually only relevant for critical applications in the medical and metrological domain. For addressing these requirements, ISO launched in 1999 JPEG LS, an image compression standard designed for lossless/near lossless compression of continuous tone images captured in biomedical applications. Even when compared to the current state of the art compression standards, JPEG LS usually obtains better compression performance for continuous tone imagery45 while maintaining a much lower computational burden. Here, the LOCO-1 compression algorithm used is a ‘low complexity projection’46 of the universal context modelling algorithms that deliver the best compression ratios for these use cases. At its core LOCO-1 makes a gradient based prediction, where the prediction residuals are entropy coded using a low-complexity Golomb coder.
For digital holographic microscopy measurements captured with the off-axis setup, it was shown in31 that JPEG LS obtained the best intra (single frame) lossless compression performance. JPEG 2000, on the other hand, uses a fully reversible wavelet transform with integer coefficients (CDF 5/3) for lossless compression. For lossless binary image compression, the standards JBIG47 and JBIG248 are typically used. Both these standards make use of a context modelling scheme designed for bilevel imagery in conjunction with an adaptive arithmetic coder. More recently, the JPEG XL49 standard was introduced as a royalty free replacement for legacy JPEG, and is designed to operate on a variety of photographic and synthetic imagery. JPEG XL supports lossless compression of both bi-level and multilevel imagery. Moreover, JPEG XL makes use of the ANS entropy coder that can obtain compression ratios similar to arithmetic coding while having a computational complexity that is comparable to Huffman coding. However, when compared to JPEG XL, JBIG2 delivers a similar coding performance than JPEG XL at an overall lower computation complexity.
Though introduced in 1992, the most popular standard for lossy compression is still JPEG50. It was one of the first image compression standards to perform an additional frequency transform operation, before applying quantization and entropy coding. In JPEG, a blockwise DCT (discrete cosine transform) of size 8 × 8 is applied on the image, where the transform coefficients obtained are quantized using an application specific quantization table. For entropy coding, JPEG supports both Huffman coding and arithmetic coding. Due to the DCT transform used, JPEG was highly effective for compressing natural imagery and evolved to become one of the most widely used image standards for lossy compression. However, for lossless compression, the DCT transform is not performed as it would have lead to more stringent restrictions on the encoder/decoder hardware to ensure lossless transformations. Instead, a simple prediction based lossless compression mode was defined.
Although for lossy compression, JPEG is still a popular standard due to its universal adoption, more recent still image coding standards51-53 supersede it in terms of compression performance. For example, JPEG 200051 uses a discrete wavelet transform (CDF 9/7) with a Mallat style decomposition followed by entropy coding using the EBCOT (Embedded Block Coding with Optimized Truncation) engine, to obtain bitstreams that are not just smaller in size but also comprising of flexible layers supporting different types of progressive decoding modes. Similarly, JPEG XL also supports progressive decoding while having a perceptually optimized reference encoder that gracefully degrades the image quality for low bitrates. Well optimized implementations for JPEG XL are about as fast as legacy JPEG, while offering comparable visual quality to more modern, computationally demanding standards.
JPEG is actually a nice illustration of an ‘horizontal’ standard that has penetrated deep into so many application ecosystems, that is — while it is being outperformed by many contemporary standards — not being replaced by them, since it would break to many interoperability chains. Its low complexity and intellectual property right uncertainties for newer technologies add in addition to its still high popularity.
However, researchers always face the difficulty of using current lossy image compression standards applied to digital holograms. When the compressing model is applied to the object plane real and imaginary parts, 3D information might be removed, subsequently not allowing the reconstruction of the hologram at different reconstruction distances or different viewing angles with acceptable quality.
Moreover, compressing the hologram plane complex representation faces the problem that the frequencies do not correspond to the frequencies of the reconstructed hologram. As the typical compression technologies reduce the influence of the high frequencies by applying quantization methodologies, the lossy compression in the hologram plane tends to create aliasing. This is particularly evident when JPEG 2000 is applied to the real and imaginary parts of the hologram plane information. The wavelet quantization associated with the subsampling mechanism leads to a very visible aliasing for reconstructed holograms54.
While we have primarily discussed still image (intra) coding standards till now, the importance of video (inter) coding technologies cannot be understated. At its core, video standards splits the frame to be compressed into macroblocks. Macroblocks can be predicted from other such blocks residing within the same frame or from neighbouring frames, thereby exploiting both spatial redundancy as well as temporal redundancy respectively. The widely used H.264/AVC55 standard uses blocks up to size 16 × 16, while its successor H.265/HEVC56 achieves roughly up to 50% better compression performance and supports block sizes of up to 64 × 64. The latest iteration from the JVET group, H.266/VVC, aims to obtain 30−50% better compression rates than HEVC. To achieve this level of compression, the encoding complexity is expected to be several times higher than HEVC. Meanwhile, the video standard VP957 from the AOM group is also getting popular due to its royalty free nature.
Unfortunately, all those video codecs suffer from the fact that — as indicated in the previous subsection — the deployed motion estimation and compensation strategies are not compliant with the interferometric nature of holographic content.
-
Digital holograms are pixelated 2D patterns; it is thus natural that state-of-the-art holographic data compression methods are largely inspired by conventional image and video coding techniques. Early attempts for holographic data compression only considered the quantization and entropy coding steps. In58, the authors applied several off-the-shelf lossless and lossy data compression techniques to optically acquired holograms. While lossless coding led to low compression ratios, quantization proved to be a rather efficient technique, achieving compression ratios up to 16. Based on these conclusions, several authors investigated scalar and vector quantization schemes to compress holographic data, such as uniform quantization59, non-uniform histogram quantization60, k-means, k-medians and logarithmic quantization61, and using Lloyd-Max and Linde-Buzo-Gray algorithms62.
Whereas previously mentioned methods operated on the raw holographic data, it is also possible to use transform coding to improve the efficiency of the quantization and coding steps. Nevertheless, since holograms differ substantially from conventional 2D images, novel transforms are needed to fit holographic data features. In63, the authors proposed a novel wavelet-bandelet transform to determine the direction of holographic fringes, achieving higher compression ratios than Discrete Cosine Transform (DCT) and Haar wavelets. In64, the JPEG 2000 codec was modified with two extensions: a fully arbitrary wavelet decomposition and a Directional Adaptive Discrete Wavelet Transform (DA-DWT). Since a significant amount of information is contained in the high frequencies, the fully arbitrary wavelet decomposition enables the high-pass sub-bands to be decomposed with more than three levels, allowing for full packet decomposition. On the other hand, the DA-DWT uses oriented wavelets to better align with holographic fringes. In65, the authors proposed to extend HEVC with a novel mode-dependent directional transform trained with holographic data to take into account the directionality of the input fringes. In66 and67, two separable and non-separable vector lifting schemes were proposed to construct wavelets specifically designed for holographic data. Finally, in68, the suitability of wave atoms for hologram compression was demonstrated, outperforming HEVC for several test cases thanks to their near-optimal space-frequency localization.
While these methods take into account specificities of holographic signals, they do not exploit their 3D visualization properties. Understanding the correlation between the 3D scene content and holographic data could enable better compression ratios and interesting functionalities such as edition, viewpoint and quality scalability, as well as motion estimation and compensation. Aiming at such functionalities, a few works tried to extract relevant 3D visualization features from hologram pixels. In69, the author showed that the convolution kernel of Fresnel diffraction forms a family of wavelets whose scale parameter represents the propagation distance. This observation was used in70 to construct wavelet-like bases called Fresnelets by Fresnel transforming B-spline wavelets. They demonstrated that the Fresnelet transform of a hologram corresponds to its numerical reconstruction at user-defined resolutions. This feature was exploited in71 to compress digital holograms using a Set Partitioning In Hierarchical Trees (SPIHT) coding algorithm on the Fresnelet coefficients.
More recently, the authors of72,73 demonstrated that for shallow scenes and using standardized image codecs, encoding the light wave scattered by the hologram in a plane crossing the scene — called object plane coding in Fig. 2 — outperforms the direct encoding of the hologram. Based on this observation, they used a speckle reduction methodology to improve the compression efficiency of hologram coding in the object plane74. However, while the above-mentioned techniques are very efficient for semi-flat scenes where all 3D scene content can be brought into reasonable focus in the object plane, their compression performance might be severely decreased when handling deep scenes or holograms with a wide viewing angle. Indeed, in these cases, it is impossible to simultaneously refocus every scene object on a single plane. To overcome these limitations, in75 the authors proposed a unitary transform to model the propagation of light from non-planar surfaces using a generalization of linear canonical transforms. Using a piecewise approximation of this transform, they propagated the light wave scattered by the hologram on a surface fitting the depth profile of the scene to bring every object in focus. The obtained light wave was then encoded using JPEG 2000. This method introduces a new and elegant coding paradigm, but requires the approximated geometry of the scene to be known in advance. Indeed, extracting the depth information from holographic data is still an open issue that remains to be solved.
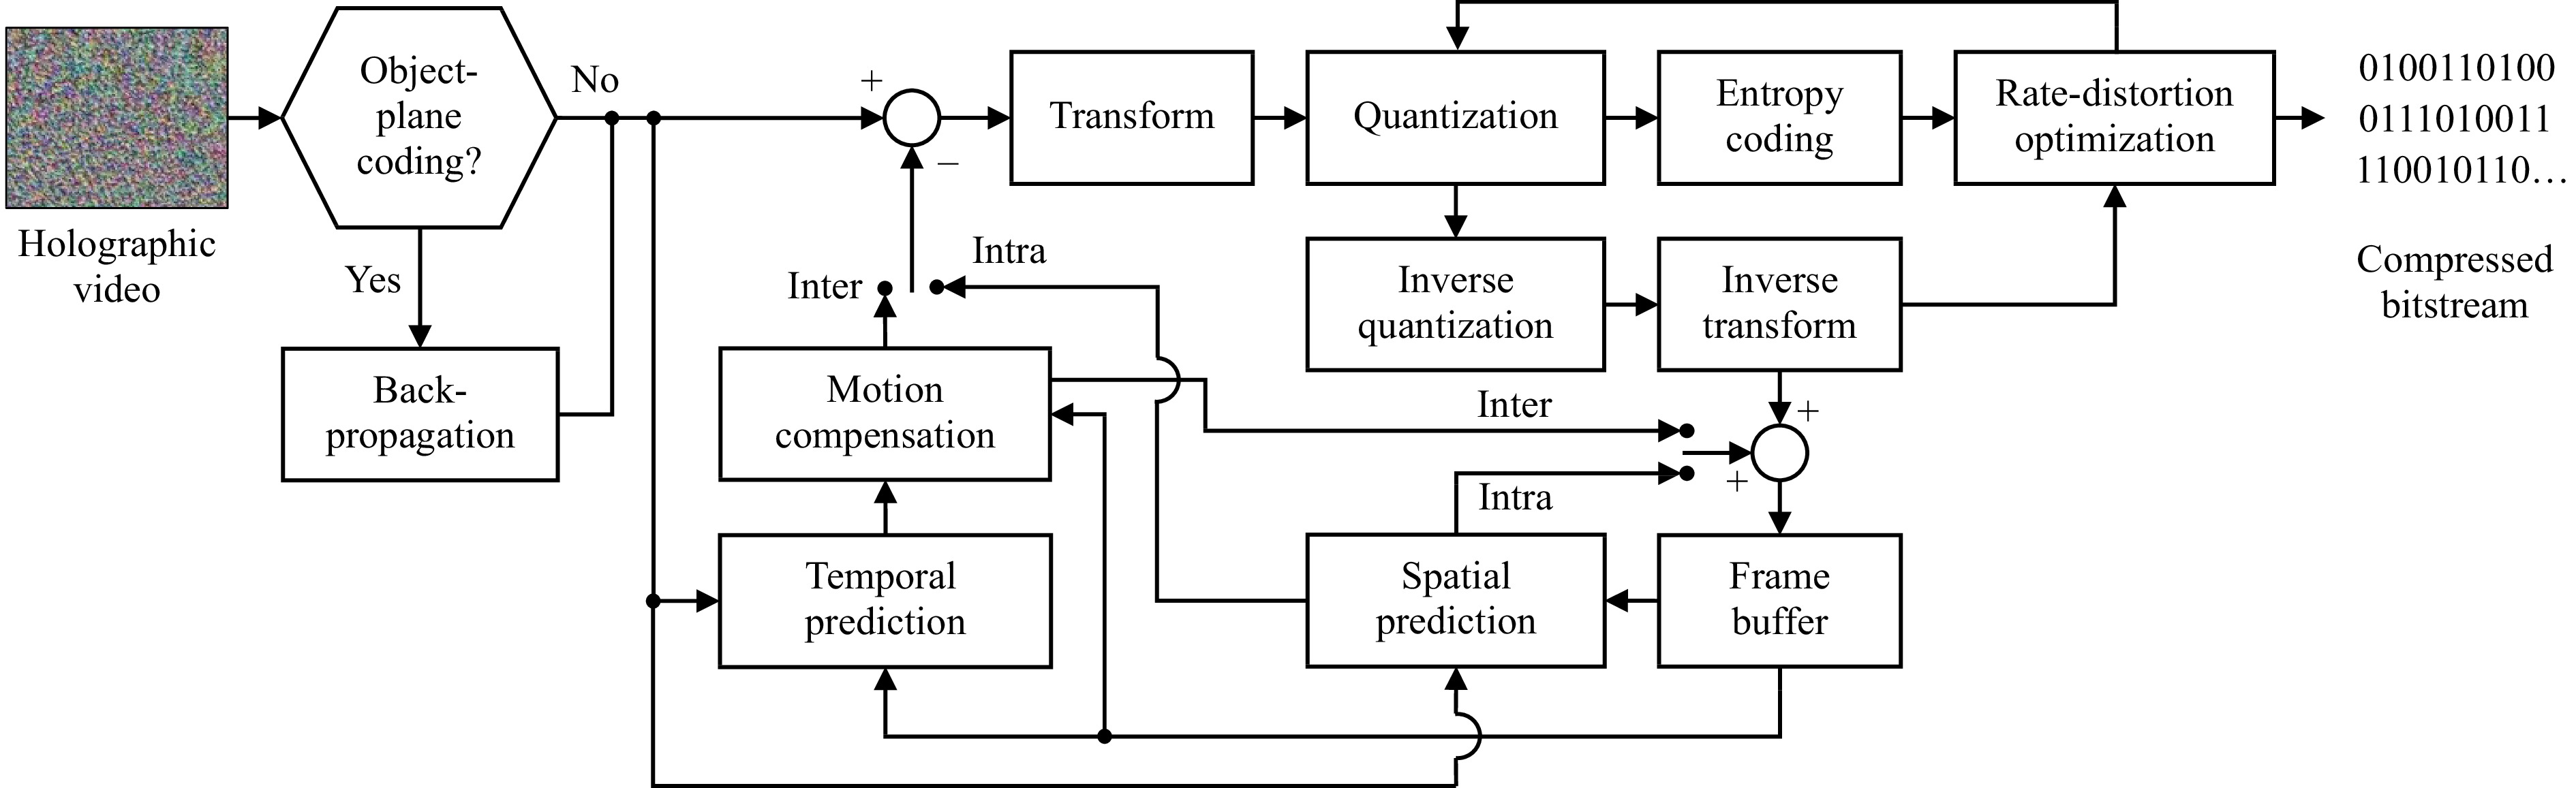
Fig. 2 Generic architecture of a holographic video compression engine.
Another approach to retrieve relevant 3D visualization features from a hologram was proposed in76. In this paper, the hologram is divided into rectangular segments which are DCT-transformed to obtain perspective views of the scene. These extracted views are then arranged as a pseudo-video sequence and compressed using the AVC standardized codec. A similar technique was proposed to compress extremely-high resolution holograms in77. In this paper, the pixels of the extracted views were rearranged to obtain speckle-reduced orthographic views of the scene, improving the efficiency of the pseudo-video sequence coding with HEVC. While these methods enable interesting functionalities such as viewpoint scalability78, the extracted views are only valid under the assumption that the viewer is located in the hologram plane, which is never the case in practice. To address these issues and handle arbitrary viewing positions, the authors of79 exploited the duality between light rays and the local spatial frequencies of a light wave to extract the individual light beams scattered by the hologram. To this end, they used the Matching Pursuit algorithm to decompose the hologram over an over-complete Gabor wavelets dictionary providing an optimal localization in both spatial and frequency domains. The extracted light beams were then compressed using an entropy coder. This method was latter extended to provide viewpoint80 and quality scalability81. This approach presents the advantage of providing a meaningful representation of a hologram’s 3D visualization features without any a-priori knowledge on the scene geometry. However, to provide additional functionalities such as edition or motion estimation and compensation, it is necessary to retrieve the scene geometry from the extracted light beams, which is still a very challenging research topic.
As shown in this section, since the early 2000s, several research works have been conducted towards the compression of holographic data. Nevertheless, most of these works were focused on static holograms without taking into account temporal redundancies from one frame to another in holographic sequences. While the static compression methods provide useful tools to understand and extract the most essential features for 3D visualization, they do not yet exploit temporal redundancies from one frame to another, leading to inefficient video compression.
Fig. 2 shows the generic architecture of a holographic video compression engine. As shown in this figure, it mainly comprises of four stages: the transform unit, which aims at concentrating the signal energy in a few number of coefficients, a motion compensation unit to reuse object information from nearby frames, a rate-distortion optimized quantization step to reduce the coefficients' bit depth, and a lossless entropy coding unit to reduce the overall bitstream size. When the hologram is segmented into rectangular blocks, the spatial prediction unit can further removes redundancies from one block to another. Finally, while all these steps can be performed on the raw holographic data, it is possible to use an optional back-propagation step to the object plane discussed previously to improve the overall compression efficiency in some cases.
Developing efficient motion compensation for removing temporal redundancies is crucial to significantly reduce the memory and bandwidth consumption of holographic videos containing billions of pixels per frame. In82, the authors used MPEG-4 to compress raw holographic data sequences, showing that inter-frame coding performs only slightly better than intra-frame coding. Indeed, because of the non-local nature of holographic signals, classical motion estimation and compensation algorithms based on block matching are inefficient to compress hologram sequences, especially those belonging to visualization use-cases. In83, a motion compensation solution based on a paraxial approximation was proposed for holograms featuring a singular object. In84, a motion compensation solution for holography based on the rotational transformation of wavefields85 was used, where the residuals were further compressed using a STFT transform with an adaptive quantizer, and gains were demonstrated exceeding 20 dB over HEVC. Similarly, a spherical hologram based rotational compensation solution was proposed for an object moving with an arbitrary trajectory described with locally varying curvatures86. Unfortunately, all these methods are limited to a single moving object, and require application of object-based hologram segmentation techniques such as87 to work for scenes with multiple objects. Another open issue yet to be solved is automated motion estimation from holographic videos, which will help to further increase the applicability of these methods. Holographic video coding thus demands a significant research effort.
-
In the context of addressing compression requirements for content typical in holographic metrology, the work in the literature is mostly limited to the use of existing conventional image/video codecs. While custom-made compression solutions may indeed prove to be beneficial, existing codecs are relevant here. Unlike CGH (computer generated holography) generated from deep and complex scenes, holograms captured for metrological purposes typically feature a singular shallow smooth object, where the object wavefield and its reconstruction are image-like after applying the appropriate processing (filtering, demodulation, propagation, and phase unwrapping) steps.
Two approaches to compression are popular here: (1) compressing the final reconstruction and (2) preserving the complex amplitude measurement of the object wavefield. Jaferzadeh et al. in88 is an example of the former approach where the effectiveness of various JPEG standards in compressing the reconstructed quantitative phase images of red blood cells obtained by off-axis DHM is studied. However, the latter is more applicable for preserving the originally captured data when: a) a need exists to support altering the phase-retrieval pipeline at a later stage; and b) when there is a need for numerical propagation of the optical field89, which requires the complex amplitude object wavefield.
In this context, a work like90 is relevant, where the effectiveness of popular wavelet transforms in compressing off-axis hologram measurements, obtained by the camera directly, is studied. Similarly in91,64 the performance gains obtained by modifying the wavelet transform and decomposition styles used in the JPEG 2000 is investigated. In31, the fact that the object wavefield was localized to a well-defined region in the Fourier domain for IPH was used to develop efficient compression solutions. Here, the obtained object wavefield after retaining only the required Fourier coefficients is demodulated by the reference carrier wave to obtain a predominantly low-pass signal. This was used to develop spatial bandwidth -optimized lossy and lossless compression solutions that can be implemented using any conventional codec. Similar application of the technique was shown in the context of HT, where it was possible to achieve a bitrate below 1 bit per pixel, while maintaining an RI RMSE less than
$ 10^{-4} $ for each of the three reconstruction algorithms used92.While tailor made solutions for utilizing temporal (inter-frame) redundancy seen in timelapses have yet to be proposed, application of HEVC inter-frame coding after utilizing the spatial bandwidth optimized compression was shown to further reduce bitrate by 15-35%31. However for addressing the similarity in different angular projections in HT, application of HEVC inter-frame coding did not bring any improvements92, underscoring the need for novel algorithms to tackle this problem. In FAHT, the object is rotated with respect to the hologram plane and motion compensation algorithms discussed previously may be utilized, while for LAHT, where the illumination beam is rotated, an appropriate demodulation needs to be developed for compensating for the change happening. The key challenge is developing a complete system that can address all above mentioned sources of redundancies at the same time.
-
Accurate visual quality analysis and reliable perceptual quality prediction of holograms is highly demanded. This is due to the rapid advances in developing processing modules of end-to-end holographic visualization pipeline. For example a number of fast numerical methods for CGH have been proposed recently94-99. Several approximations and compromises are required in their operations to ease the highly-demanding computations involved. The visual impact of these approximations needs to be analyzed and tested via conducting subjective experiments. Feedback-loops — without the need to reconstruct the object wavefronts — can be created by utilizing high performing objective quality measures to contribute on steering and optimizing the performance of these numerical operations. Another example is the need for systematic VQA of compression artifacts on the holograms and having objective measures to predict their visual impact on the reconstructed 3D scenes. Furthermore, high-end solutions for holographic compression can perform more efficiently, by embedding customized evaluation criteria that control their rate-distortion optimization process based on predicting visual quality of the reconstructed 3D scene after decoding. In this section, we will subsequently address subjective quality assessment procedures, objective quality assessment, and, finally, metrological quality assessment. In the latter category, which is particularly useful for the addressed biomedical use case, the impact of compression and hence, the performance of a particular compression technique, is assessed by evaluating the performance of a particular automated task – e.g. phase or refraction index retrieval, or segmentation – after compressing the hologram.
-
Conducting systematic subjective experiments for holographic data is the first step in their VQA process. To do so, open-access data sets of holograms recorded or numerically generated from various 3D models and real objects with varied scene-compositions are required. Over the past few years, more than a handful of such public data sets have been created72,100-104. The JPEG Pleno database105, hosts an updated portal with direct links to access these data sets. In106, a subset of holograms in JPEG Pleno database were chosen and for each one, several 2D reconstructions have been produced.
Next is to identify the testing procedure (illustrated for JPEG Pleno Holography in Fig.3). This mainly depends on the application use case(s) and more importantly the type of the display technology to visualize the holograms for the human observers. Ideally, the reference holograms and their distorted versions have to be visualized via holographic displays. However, holographic displays with acceptable visual characteristics are still rare107,108. Moreover, configuring and operating them requires advanced technical skills. One alternative, is to utilize analogue techniques to print them, e.g. on glass plates109. This way, very high definition holograms of deep scenes can be printed to illustrate the full potential of the holograms for recreation of a 3D scene110-115. However, using hard-copy holograms for subjective experiments is facing serious challenges. Those holograms can not be evaluated by objective quality metrics. From practical point of view, it requires flawless printing of a large number of holograms which normally will be several times bigger than the final hologram set utilized for the subjective test. Because preliminary experiments and mock-up tests are required to shortlist and choose the right scenes and objects, depth of the scenes and distortion levels to span over the full visual quality range. Furthermore, the holograms need to be permuted through and optically aligned multiple times per test subject which will prolong the test far beyond the recommended duration.
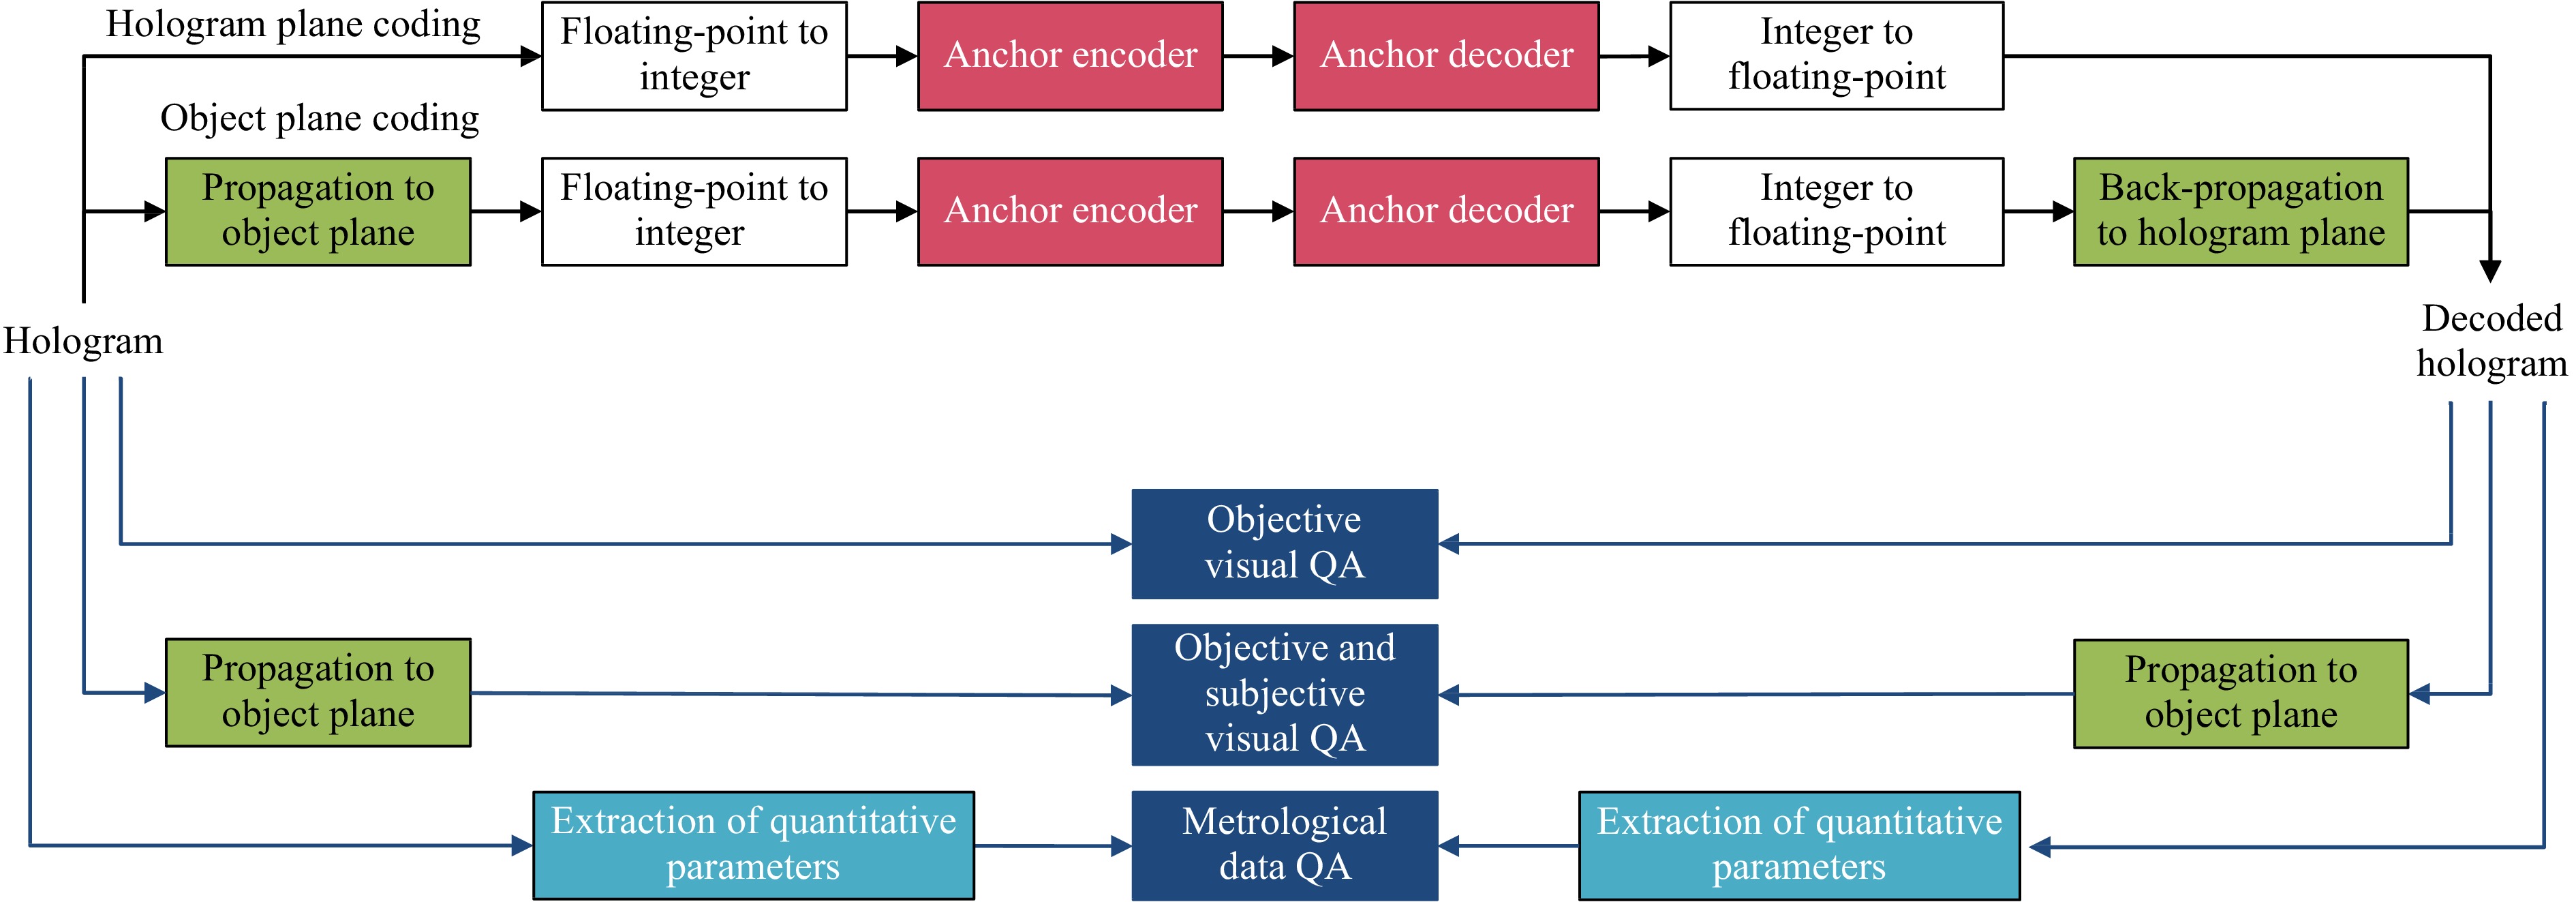
Fig. 3 Pipelines for the assessment of hologram compression methods utilized in the context of JPEG Pleno Holography93. The anchor codecs are tested in two pipelines, one performing the encoding in the hologram in the hologram plane, the other in the object plane. Visual quality assessment is performed in both planes, except for the subjective visual quality assessment, which is solely performed in the object plane. Metrological data quality is measured directly on the metrological data extracted from the uncompressed (original) and compressed holograms.
Another alternative is to utilize an indirect assessment method, by displaying a single or limited set of reconstructed views and depths on a non-holographic display. This is the most popular option for subjective testing of holograms. Lehtimäki et al.116 pioneered such efforts by conducting a limited subjective experiment utilizing an auto-stereoscopic display to visualize the holographic reconstructions. In this experiment, they evaluated the depth perception, where front and back reconstruction of each test hologram was generated with multiple aperture resolutions. Consecutively, in117, the same display technology was utilized to test the perceived quality of holograms produced with different aperture size. In this test, subjects were asked to choose the hologram reconstruction having the lowest distortion in terms of noise, blur (caused from defocus) and depth perception. Next, a 15 inch 2D LCD screen was utilized in118 to evaluate the relation between numerical error and the perceived quality of the hologram reconstructions. In this test, two simple cases of lossy compression were considered where in one case, a uniform quantization was applied on the hologram and on the other case, the same quantization was applied on the Fourier transform of the holograms. Later, in119 a methodology to evaluate visual quality of compressed holograms with partial-reconstructions shown on a UHD 2D display was proposed. The holograms were compressed using the real and imaginary parts of the reconstructed holograms on hologram plane. Conventional codecs, namely JPEG, JPEG 2000, H.265/HEVC intra coding were utilized to introduce the compression artifacts in 5 different bitrates. In120 a subjective experiment using a 2D screen was conducted to investigate the impact of several speckle removal methods. The best performing methods based on the visual appearance of the denoised hologram reconstructions were identified. Nonetheless, in all of these experiments, an important concern regarding the validity of achieved results on non-holographic displays was unresolved; whether or not subjective test results achieved by visualizing holograms on non-holographic displays can replicate at least the overall trend in distribution of the quality scores gathered from a subjective test conducted using an actual holographic display. Ahar et al.121 conducted the first subjective experiment using a holographic display. They also used the same test stimuli to conduct two separate subjective tests utilizing high-end light field and 2D displays. They also utilized a multi-perspective and multi-depth testing procedure to investigate the compatibility of the quality scores gathered from the 3 displays. In their analysis it was demonstrated that scores gathered from non-holographic displays replicated a very close overall trend compared to the one of holographic display, however observers gave slightly higher scores to the same compressed holograms when displayed on the holographic display than the other two.
All of the experiments using non-holographic displays, only considered reconstructed holograms in the focused position and a single or very limited set of 2D reconstructions were visualized which obviously does not provide information about other 3D aspects of the captured scenes e.g., parallax. A dynamic testing procedure was proposed in54 to address this issue. In this experiment, pseudo-video sequences were generated from the reconstructed views along a hologram-specific scan path that involved changes in focus and viewing angle. Then, they were displayed using a 4K 2D screen. This method not only allowed for watching the reconstructed scenes from several angles or focal distances, but also provided a better grasp of the parallax and its potential influence from the compression artifacts (see Fig. 4). A similar procedure was also utilized in122 for evaluating the object plane compression artifacts.
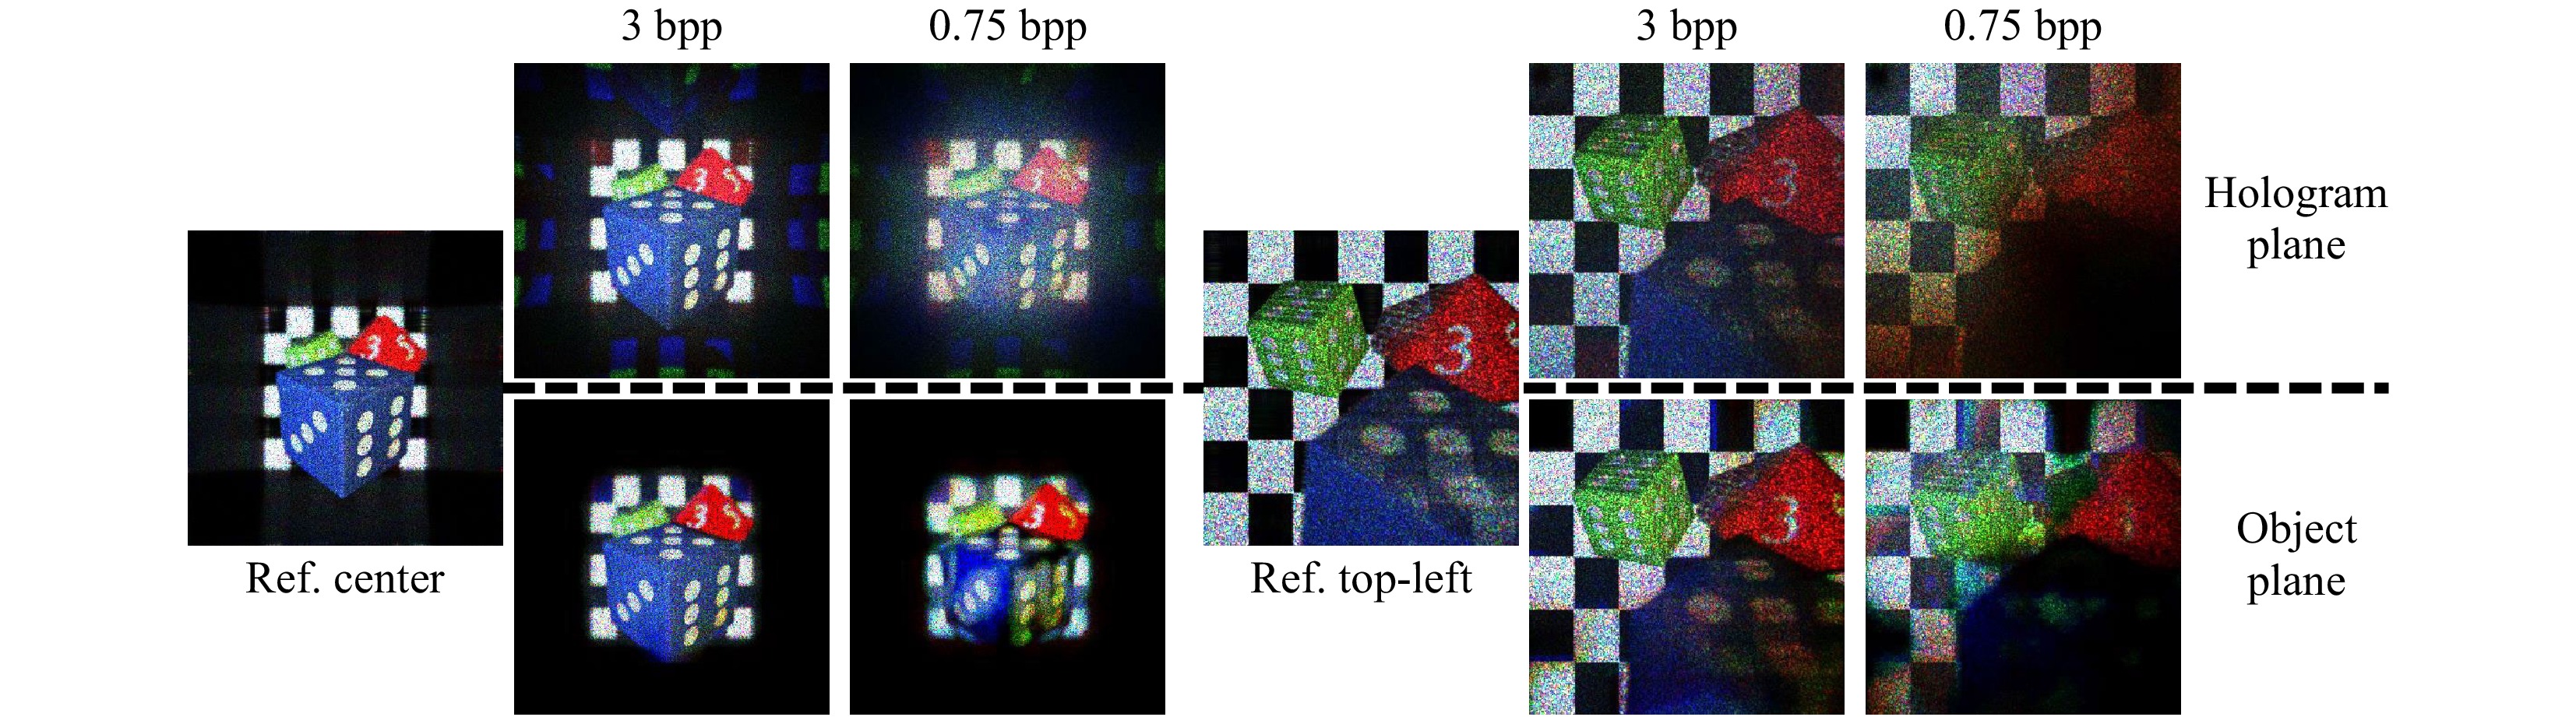
Fig. 4 Representation of JPEG 2000 compression artifacts on Dices16K hologram102. Looking at the Center view reconstructions: in hologram plane, the aliasing effect is visible both in high (3 bpp) and low (0.75 bpp) bitrates. Also note combination of the aliasing with heavy distortion in lower bitrate. In object plane, smoothing of the corners of the checker board is visible even in high bitrate (3 bpp). Top-left views for both object plane and hologram plane compression demonstrate significant loss of information and limitation of FoV especially in low bitrate.
-
Currently, no objective quality measure is introduced that is specifically designed for evaluating digital holograms. Therefore, hologram quality measurements are carried out by means of currently available measures mainly originated from digital imaging domain. In terms of functionality, two main groups are typically realized for classification of objective quality measures. It includes methods that essentially measure the mathematical fidelity and those algorithms which are designed to predict the perceptual quality of the visualized content. From the first group, Mean Squared Error (MSE), Signal to Noise Ratio (SNR) and Peak Signal to Noise Ratio (PSNR) are some of the most utilized measures for evaluating the quality of the distorted holograms118-120,122-124. In the second group, a quality measure called Structural SIMilarity (SSIM), has been commonly deployed for evaluating digital holograms as well. But since holograms are mostly processed in the form of complex-valued wavefield, quality measures are used separately in their Cartesian components. It is also possible to use the polar components. However, due to non-linear response of the wrapped phase, it was showed that measurements using Cartesian components will be more accurate72. The Versatile Similarity Measure (VSM) is a complex-valued fidelity measurement framework that was introduced in125. Not only it provides an adaptable bounded measurement for complex-valued data evaluations, but also solves the issue of comparing wrapped-phase data without unwrapping. Also, Sparseness Significance Ranking Measure (SSRM)126 is a perceptual quality predictor that initially proved its efficiency for digital imaging but due to solely working in the Fourier domain, without any modification could be utilized for complex-valued data as well. Both methods were shown to be more accurate than MSE and PSNR and SSIM, when tested on a limited set of CGHs127,128. The prediction accuracy of available objective measures can be analyzed by comparing with the ground-truth visual quality scores obtained from subjective tests. Nonetheless, their performance is influenced by the position in the processing pipeline that prediction of visual quality is required (i.e. quality assessment can be performed in the hologram domain, after numerically reconstructing the captured scene or even after performing post-processing on the reconstructions to remove the speckle noise). A comprehensive performance evaluation of some the most prominent fidelity and image quality measures was performed in129. In this experiment, Fourier holograms of DHMulti database105 were utilized. All holograms were distorted using compression artifacts and later visually annotated from different viewing angles and focal distances. Eventually, quality measures were tested in the hologram domain, right after the compression (QA_1). Additionally, to ensure that the test results are not biased by the characteristics of Fourier holograms, a lossless, numerical conversion to the more conventional Fresnel hologram type was performed and the evaluation was repeated (QA_2). Furthermore, all measures tested on the numerically reconstructed scenes and objects (for the same 2D viewes accompanied with the subjective quality scores) before (QA_3) and after applying a speckle denoising procedure (QA_4). Multiple figures of merit were utilized to evaluate the prediction accuracy, monotonicity and consistency of the tested quality measures. Based on the achieved results for all evaluation criteria and testing points, a usage guideline was provided such that helps interested user to choose the most appropriate method for the holographic VQA tasks until more hologram-oriented quality measures are designed (See Table 3). Experimental results showed that for each test track, a couple of quality measures present a significantly correlated performance compared to the subjectively attained visual scores. Nevertheless, no single measure is robust enough to reliably achieve best results across all 4 testing points. Therefore, none of the available options for objective quality measurement are at the level that confidently alleviate the strong need for design and development of especial VQA algorithms for the holographic data. For more detail on the testing procedure and analysis of the performance of each tested quality measure, interested reader is referred to the original publication in129.
Recommendations Hologram Plane Object Plane Metric QA_1 QA_2 QA_3 QA_4 MSE 

NMSE PSNR SSRM 
SSIM IW-SSIM MS-SSIM UQI GMSD FSIM NLPD VIFp Table 3. Usage recommendation of image quality measures for digital holograms, colour coded based on overall performance in each test-track.
-
Special attention in quality assessment is needed in case of QPI. Techniques such as DHM and HT address strict metrological requirements. Popular visual quality assessment metrics such as SSIM are not applicable here, and the impact of compression needs to be measured such that the induced differences are meaningfully expressed in terms of final required values, such as the RMSE calculated on phase/RI values. Presently, in QPI applications of DHM, a user is most often interested in the quantitative phase retrieved from a hologram, which is used for analysis as shown in Fig. 5a. Similarly, in the case of HT, it is more appropriate to measure the error in the refractive index distribution as shown in Fig. 5b.
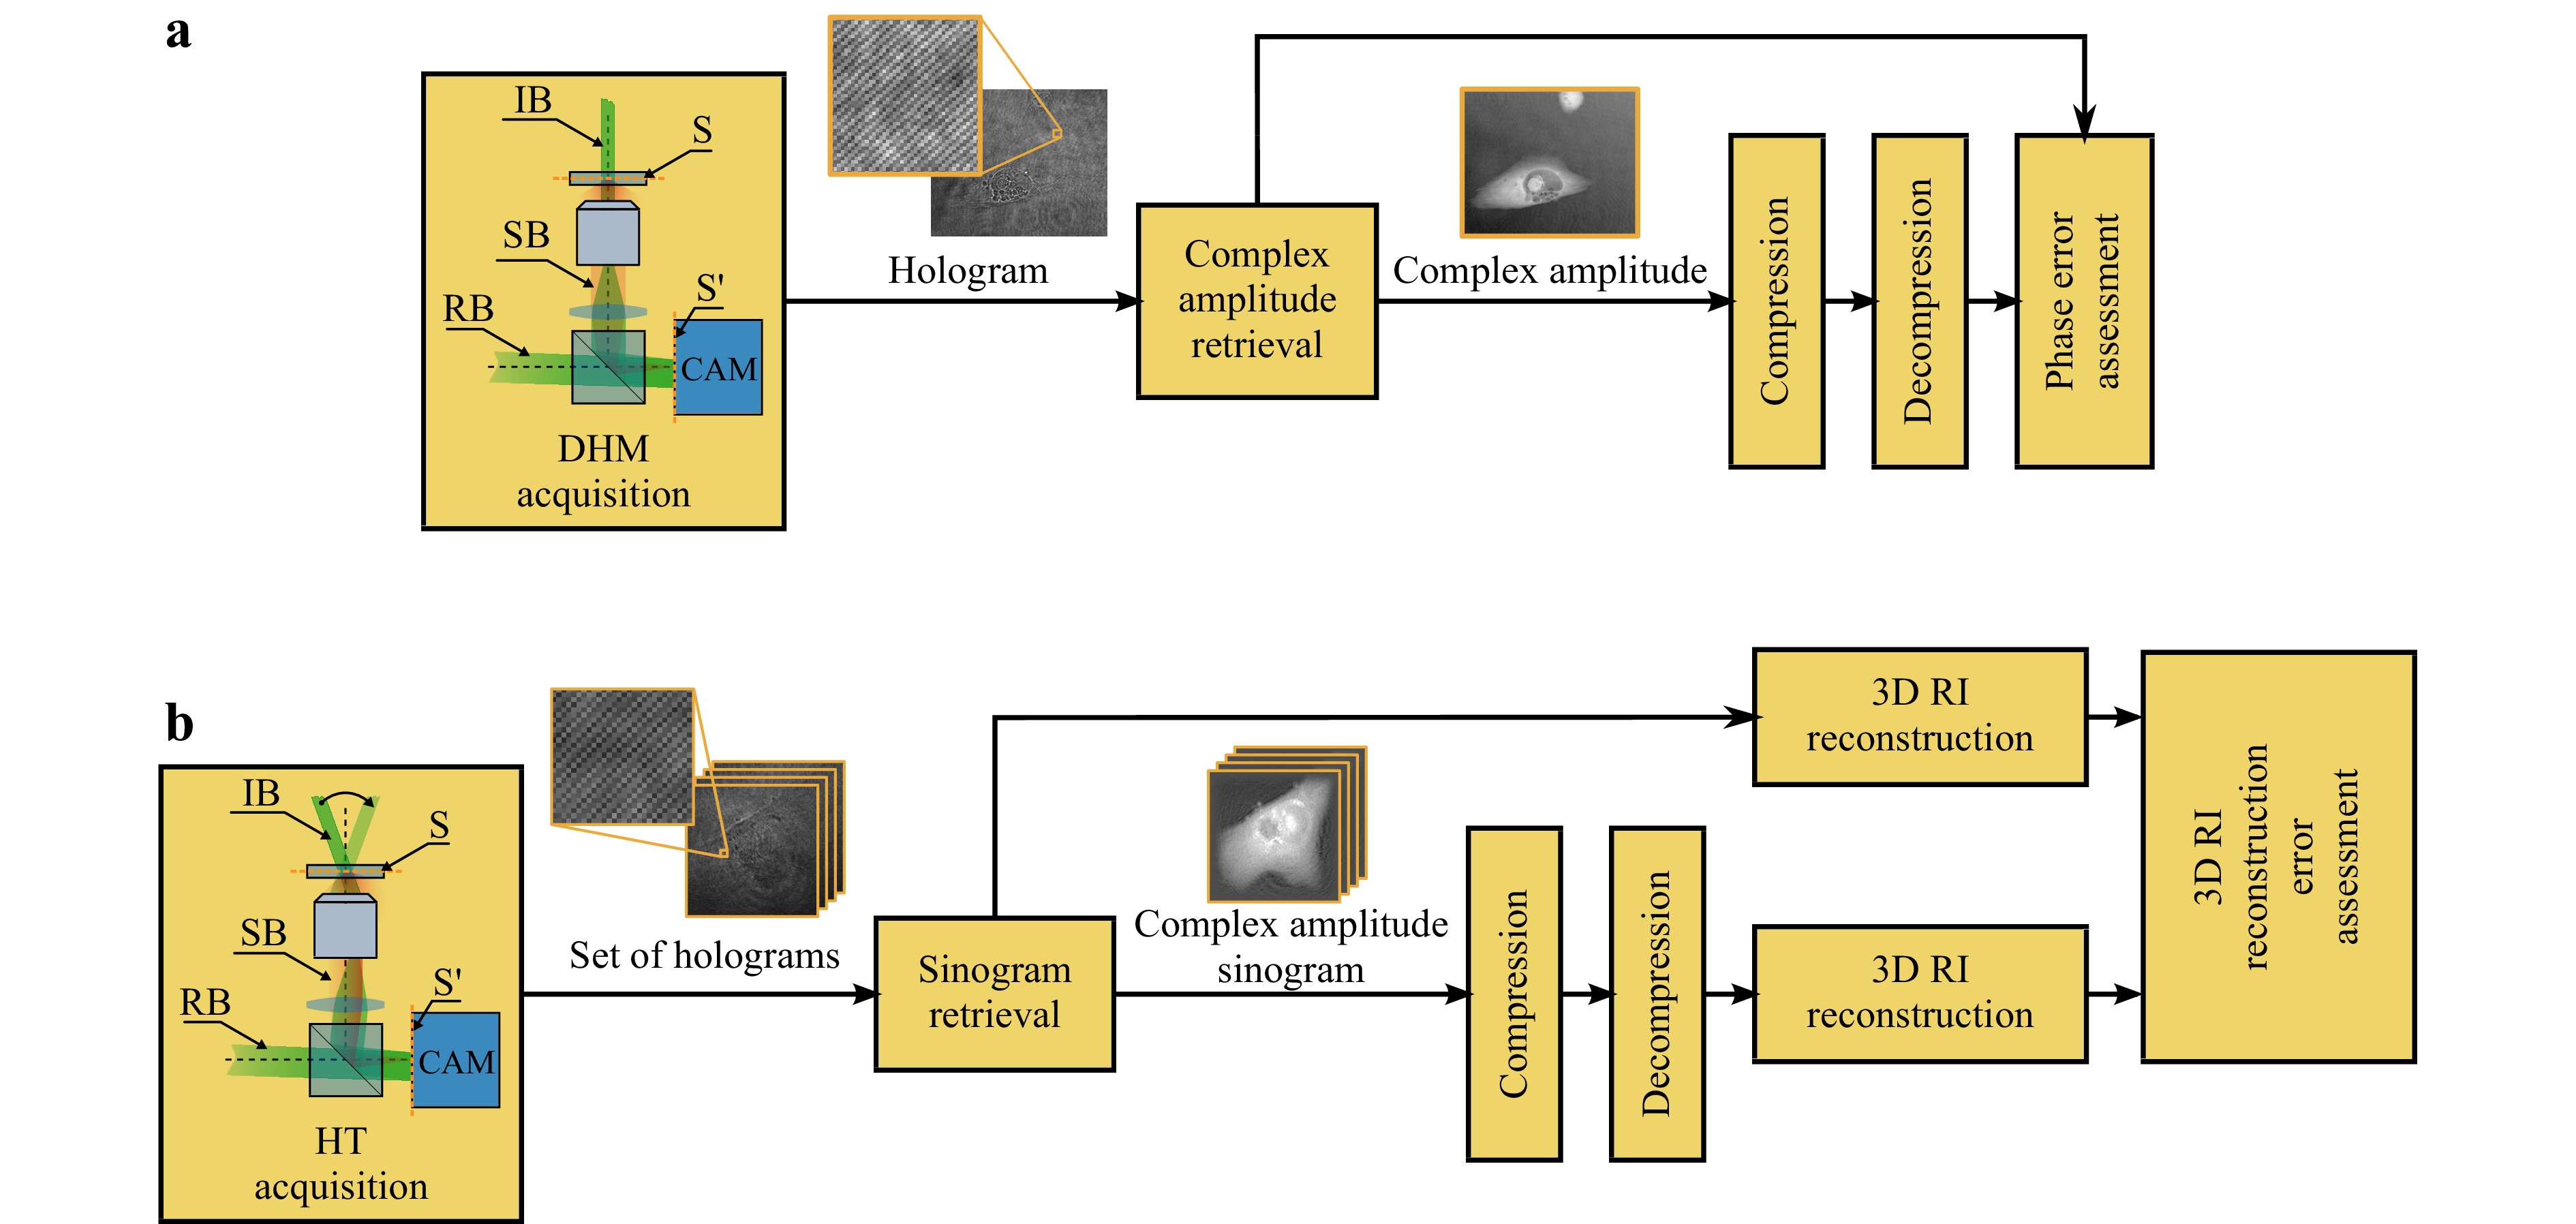
Fig. 5 Pipelines for the assessment of hologram compression in a DHM and b HT.
This requires that the assessment is done after the signal is finally processed after decompression. In DHM, phase unwrapping performed on the complex amplitude signal is a highly non-linear process. It was shown in31 that even small compression errors in the hologram can lead to large unwrapping errors. Some applications require even more robust phase unwrapping algorithms130 and the effects of compression should be evaluated in the appropriate framework to ensure relevant results. In the case of HT also, a plethora of reconstruction methods exists, depending on the type of approximation (Born/Rytov) and the regularization being performed. Procedures such as phase unwrapping and tomographic reconstruction algorithms are still being actively developed, posing an additional challenge, since each algorithm requires separate characterization. Therefore, for measuring archival quality, metrics like SNR calculated on the full complex amplitude information may be more relevant.
On the other hand, assessment based on other metrics, such as a performance drop in a specific classification problem, would be suitable for practitioners applying the methods for a particular use case. However, such an approach is not general enough to be considered in research focused only on compression due to vastness of applications of QPI methods and large variety of possible features to be extracted from the images.
-
In this section, we enumerate important challenges that the holographic community is experiencing when attempting to design efficient codecs that address both the coding performance as functionality requirements of the application domain.
-
Due to the fact that the holographic modality adheres to a wave-based light propagation model, both amplitude and phase information of the recorded wave front needs to be accounted for. This information can also be represented as real-imaginary (complex-valued) data, and other less popular representations exists. Though during capturing or rendering solely amplitude or phase information might be collected or send to the spatial light modulator (SLM), during processing and also compression of the hologram, the full amplitude-phase or real-imaginary representations will be utilized. Think for example about an amplitude hologram of a 3D scene. In case of non-shallow scenes and while using classical coding engines, it is often preferred to propagate the hologram to an object plane and to apply the compression here to increase coding performance, resulting in the need to compress both real and imaginary information.
A particular case is phase data to be compressed for a phase-modulation SLM. Here the codec should preferably be able to handle phase information. However, this is a particularly hard representation to handle since codecs typically deploy — as discussed earlier — transform- or prediction-based algorithms that attempt to reduce the entropy of the to be encoded information. Often these algorithms result in phase-wrapping issues that in combination with subsequent phase quantization procedures lead to erroneous reconstructed phase information during decoding44.
The real-imaginary representation is probably the most suitable and generic data representation to be used — at least for the internal representation — in a codec engine, but not always the most effective one since it results in two internal components to represent while the aforementioned phase-modulation case would only require one component. Hence, coding strategies for holograms will have to cope with the variety of representations imposed by the recording, generation, and rendering infrastructure present in the application chain. At this moment, an omnipotent representation that would serve all these use cases in an efficient way from a compression performance perspective is non-existing. Consequently, either compromises at the level of compression efficiency need to be made, either different coding engines have to be deployed, reducing the interoperability.
-
Colour information is processed very efficiently by classical codecs for natural imagery. Typically, the red, green and blue components are linearly transformed into 1 luminance and 2 chrominance components, the first representing intensity information per pixel and the latter specifying the colour information. For consumer grade applications the colour information is often subsampled by a factor 2 in each image dimension, since the human visual system possesses a significantly lower contrast sensitivity for chrominance information than colour information. This procedure already achieves a compression factor of 2.
Holographic data is quite more cumbersome with this respect since the holograms related to the different colour planes have interference patterns resulting from light interacting at different wavelengths each. Hence, the colour components of a hologram pixel cannot be simply linearly transformed and quantized thereafter without severely distorting the signal. So far no efficient solutions have been proposed to handle this problem.
In addition to this, different hologram components might be related to various polarizations or include also information on fluorescent responses in biomedical imaging. Similar issues might arise here as well with respect to decorrelating information residing in different components (or spectral bands).
-
Particularly pathology, tomography and high-end visualization applications result in huge hologram pixel counts. In Fig. 644 the required numbered of hologram pixels is calculated based on desired display size and viewing angle. Please note that a naive setup is assuming the existance of a patchwork of SLMs. It is clear that the count very quickly explodes to Gigapel and Terapel requirements for larger displays, representing a huge challenge to encode this data within reasonable computational bounds, but also putting huge requirements on storage capacity and transmission bandwidth.
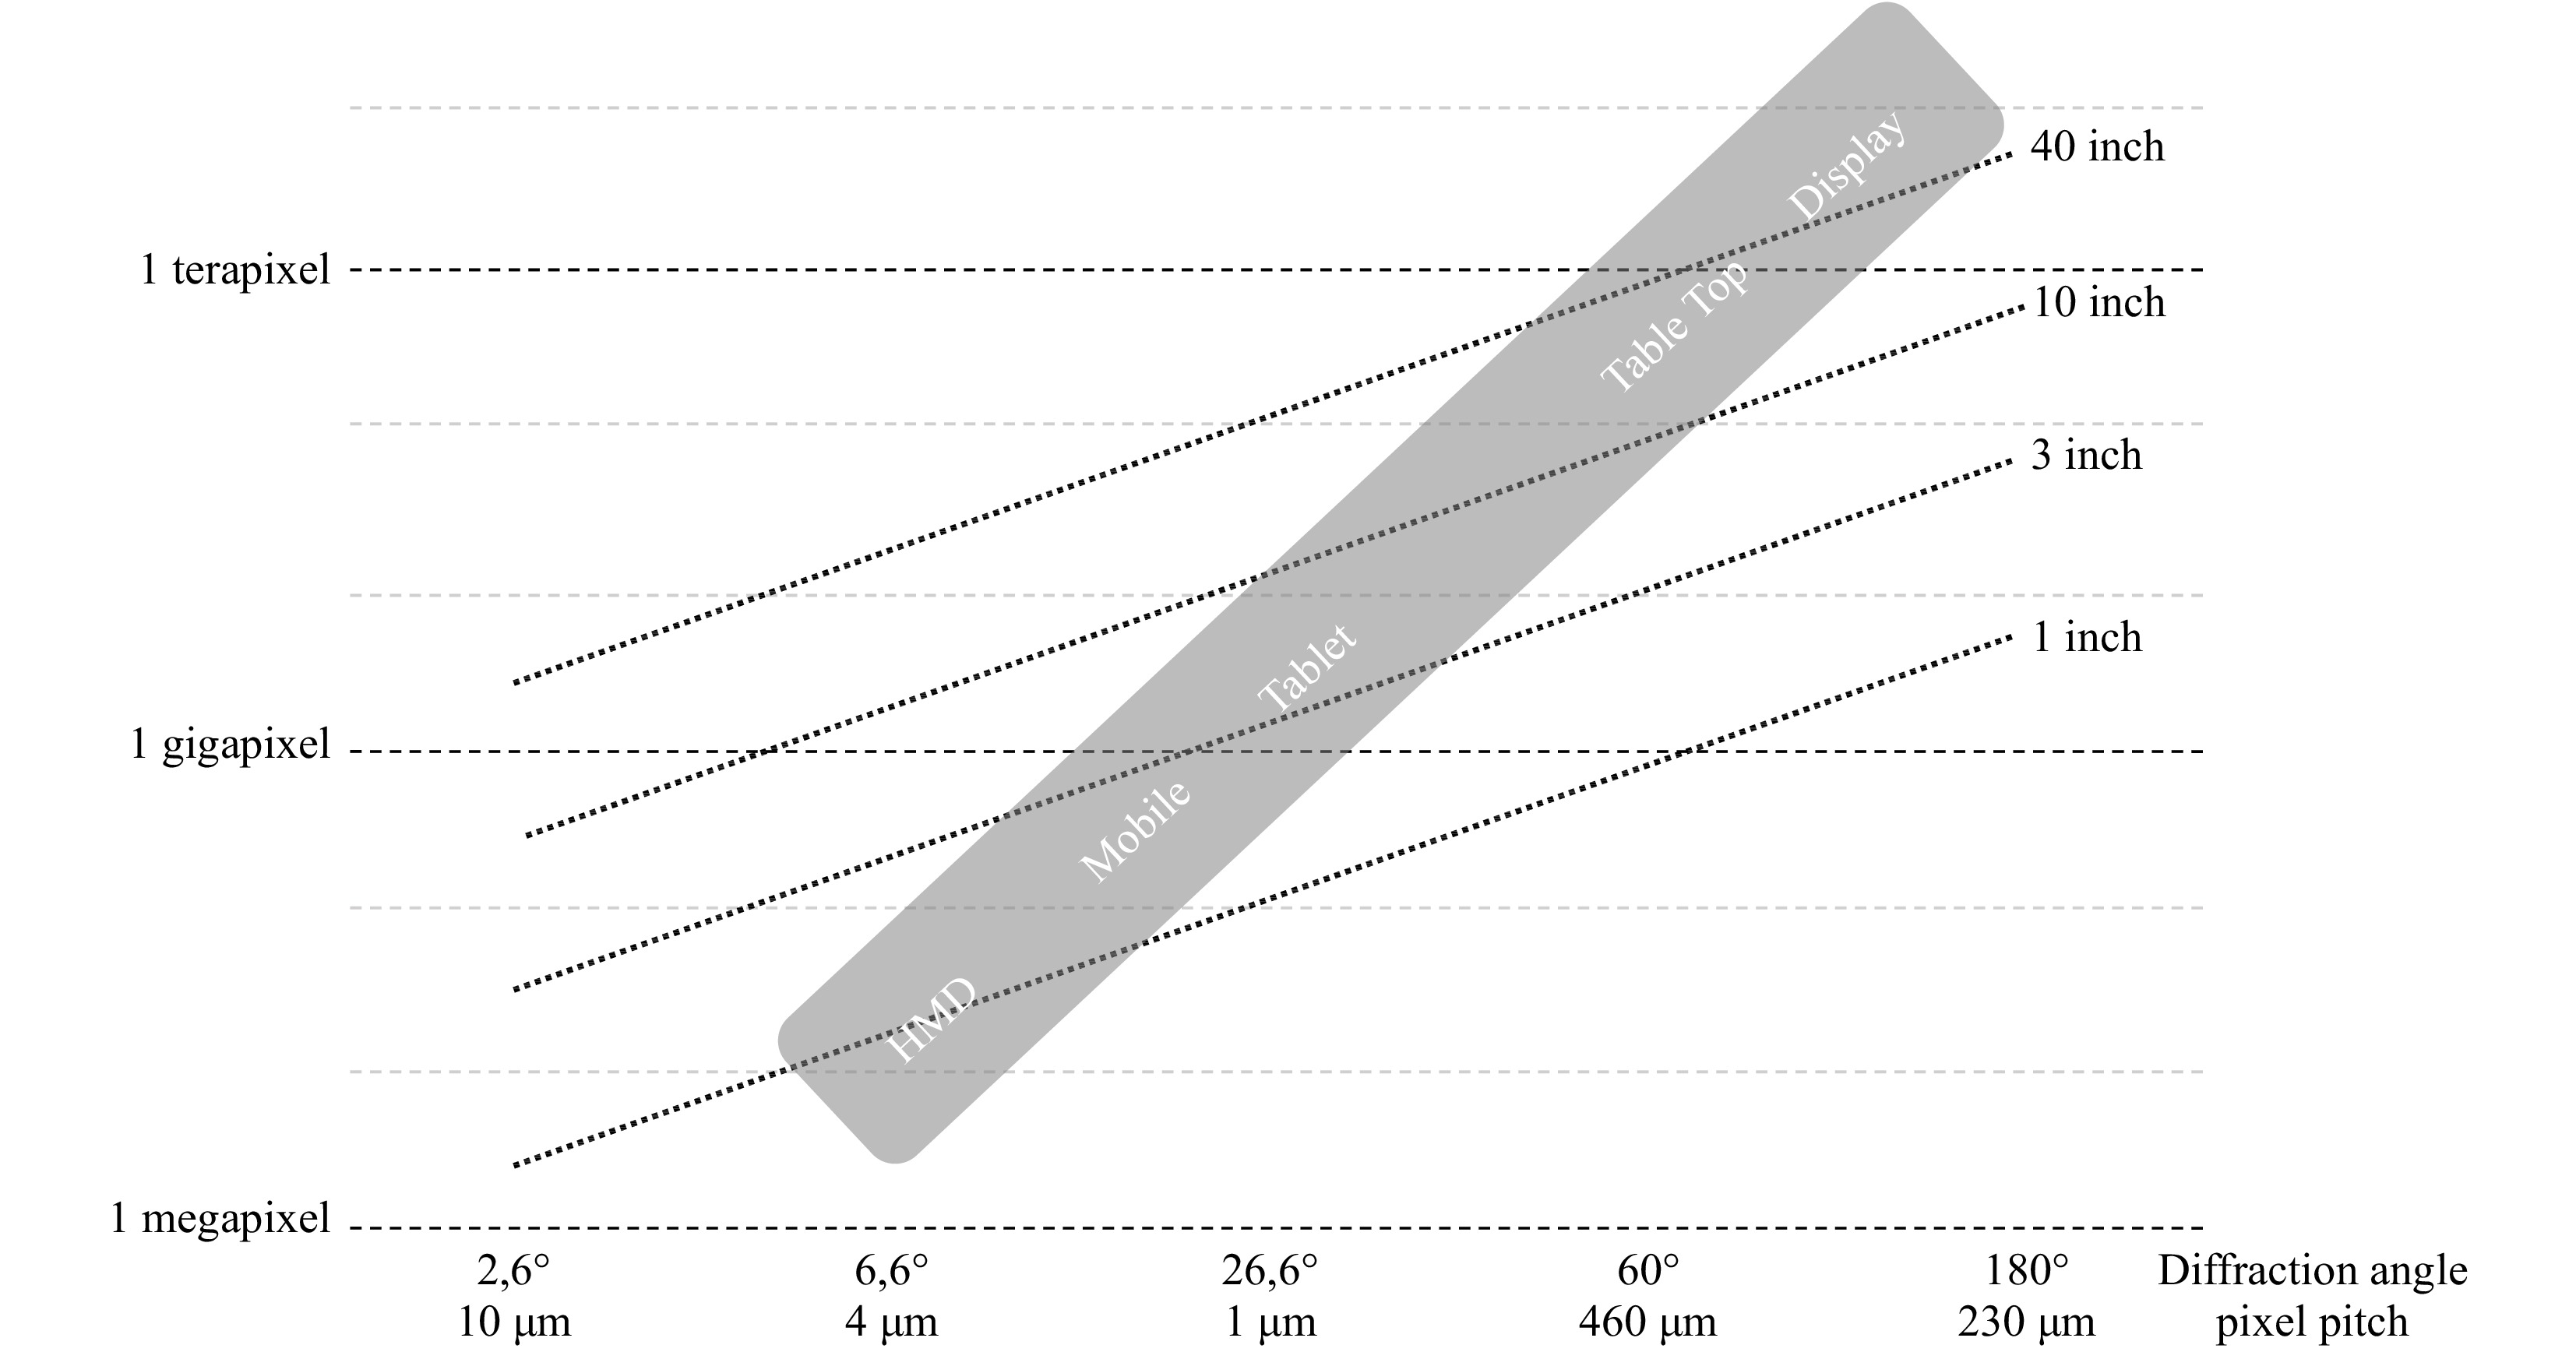
Fig. 6 Simulation of required number of hologram pixels depending on desired display dimensions and pixel pitch (or viewing angle) in case of a wavelength of
$ \lambda={460} $ (blue light) and a 16:9 screen ratio44. -
Random access functionality might in this context reduce the stress in terms of computational complexity, storage capacity and transmission bandwidth by supporting selective consultation of the encoded hologram. This requires the codestream to be compartmented in individually decodable chuncks such that only the required information can be retrieved.
Think for example at large holographic displays where only one or few persons are watching to the screen. In that case it makes a lot of sense to stream only that information to the screen that facilitates the necessary viewports and hence reducing significantly the required communication bandwidth. A logic segmentation to support this kind of functionality would be to deploy partitioning in space-frequency domain, where an immediate connection between the viewports and the segments in this domain exist.
-
Video codec deploy a motion estimation and compensation mechanism to remove the temporal redundancy from a video sequence. Since classical motion estimation and compensation models fail on holographic video because holographic pixels not solely relate to one spatial location in the 3D scene, but are the representing the result of interfering light waves originating from different 3D scene points. Notwithstanding the fact initial attempts have been undertaken to resolve the motion compensation process, more advanced models that allow for object-based motion compensation are not yet available.
Motion estimation is even a more cumbersome problem due to the interferometric nature of holographic content. Therefore current holographic video coding solutions retrieve motion information from the 3D content from which the holograms are generated using CGH techniques. Unfortunately, this is not feasible for content captured with holographic microscopy and tomography systems. Here, the main data cost for these applications arises from the sheer volume of frames being recorded using the camera sensor. As discussed in the use cases section, these frames are typically sequentially correlated as a) in time-lapse, the evolution of an object undergoing small temporal changes is recorded; b) in image stitching, a macroscopic smooth object being captured from overlapping measurements; c) in in tomography, an object being capturing from multiple illumination directions either by introducing small rotations in the object or in the illumination beam, where some applications can be even a combination of these individual modalities. Exploiting this data dependencies would certainly boost the coding performance.
-
Given the potentially large data volumes, codec algorithms should depict a relatively low complexity, while offering simultaneously high compression efficiency. Moreover, parallel computation and GPU processing should be intrinsically supported; a single-threaded CPU handling the data decoding for large display would never be able to process timely all data. Hence, multi-threaded, parallel processing and GPU-compliance are conditiones sine qua non for effective coding-decoding mechanisms; a non-evident requirement that conflicts with achieving maximum data decorrelation and effective entropy coding. Typically, the larger the data units the more effective the probability and context modelling and hence, the entropy encoding will perform.
-
Learning-based solutions, although having been around for a long time to optimize performance of individual codec modules, have recently been penetrating faster in the domain of compression technologies as well, particularly driven by the premise that these techniques potentially improve compression results by deploying ‘learned’ features to decorrelate a data set rather than more ‘rigid’ mathematically constructed transform and prediction techniques. In a deep learning context this then finally results in the compression of the produced latent representation.
A first problem is to produce representative training data sets that allow for training the deep neural network (DNN) such that it ‘behaves well’ for generic or application specific contexts. This is already a challenge for regular imagery, but particularly for holography when deploying it in a more generic context, due to the lack of representative data and its time-consuming production process.
Secondly — and often overlooked for holography — is that DNNs operate very well on classical imagery due to the high correlations typically existing between neighbouring data and the direct physical correlation with the represented 3D scene that can be adhered to the content of neighbouring pixels. Moreover, DNNs mimic surprisingly well part of the visual processing taking place in the human brain. However, this does not hold for holographic content, being interferometric in nature, where the values of the holographic pixels are the result of interference effects between waves originating from all points of the 3D scene represented in the hologram. Naive deployment of DNNs on holographic content will destroy quite some information embedded in the hologram, and the subsequently naive quantization and entropy coding of the latent representation will have effects that will be hard to relate back to the original data.
Hence, significantly more research will be needed in this domain to give rise to DNN-based coding technologies.
-
Subjective quality assessment procedures still suffer from the unavailability of qualitative holographic displays. Hence, alternative solutions such as numerically reconstructing holograms for rendering on 2D or autostereoscopic displays, are currently deployed and can be seen as reasonable alternatives due to their higher intrinsic resolution and image. Since they do not have inherent support for characteristic features of holography, the still remaining vergence-accommodation conflict and lacking depth refocusing functionality negatively influences the potential outcome of the test procedure. Moreover, they suffer from the more severe presence of speckle noise due to the numerical reconstruction, where, as in optical setups, coherence might be slightly reduced due to optical imperfections giving rise to less severe presence of speckle noise. In the absence of a reasonable holographic display, this alternative remains an acceptable choice though the rendering post-processing should be improved to handle e.g. the speckle noise, as well as the subjective testing procedures issued.
The performance of objective quality assessment techniques is still cumbersome as indicated earlier in this article. Few metrics deliver an ‘acceptable’ behaviour in the hologram domain and/or in the reconstruction domain (object plane). Nonetheless, plenty of space for improvement remains, seen the still poor correlation between perceived visual quality and measured objective quality. The few reasonably performing metrics fail to incorporate support for properties of the human visual system.
Finally, in the context of metrology, JPEG introduced a methodology that is worth further pursuing; measuring the functional quality of (de)compressed content, i.e. to what extend are (1) analysis algorithms — for example reconstructing phase information — affected by the compression task and are (2) the resulting errors still sufficiently bounded. Challenges here remain the dependencies between the nature of the tested content and the feature extractions/analysis algorithms deployed, resulting in more complex dependencies in the evaluations process, and not solely a dependency on the coding algorithm under test.
-
As should be clear now, the domain of holographic content coding and broader research on holography, needs more cooperation to resolve the above mentioned challenges related to data representation, handling of multiple components, large data volumes, random access functionality, computational complexity, learning-based coding, and data quality assessment. Most of the research actions are too fragmented, and research ecosystems need to be build to resolve the earlier mentioned bottlenecks.
A very fruitful initiative would be the construction of holographic databases shared within the community that are used as reference as well when reporting research results. This exercise should involve the creation of commonly accepted evaluation methodologies as quality assessment procedures.
In that sense, it is enlightening that the JPEG committee is working on a suite of standard specifications, called JPEG Pleno (ISO/IEC 21794) aiming to provide a standard framework for representing new imaging modalities, such as light field, point cloud, and holographic imaging. JPEG Pleno is not just a set of efficient coding tools addressing compression efficiency, it is targeted at creating interoperability in the application chain at the level of the data format. It is a representation framework that will be a fully integrated system for providing advanced functionality support for image manipulation, metadata, random access and interaction, and various file formats. In addition, it should offer privacy protection, ownership rights, and security. Currently, the JPEG Pleno standard defines already the file format for plenoptic modalities, as well as coding technology for light fields (including conformance testing and reference software). In 2021, a call for coding solutions for holographic content has also been issued5 and the standardization process is currently ongoing. JPEG Pleno Holography will be the first standard aspiring to a versatile solution for efficient compression of holograms for a wide range of applications such as holographic microscopy, tomography, interferometry, printing and display and their associated hologram types. Key functionalities desired include support for both lossy and lossless coding, scalability, and random access and integration within the JPEG Pleno system architecture, with the goal of supporting a royalty free baseline5.
However, this standard will solely focus on the data exchange format, but not normalization of, for example, the display interfaces. Standardization bodies such as IEC TC 110, specifying components and characteristics of electronic displays, IEC TC 100, focused on audio, video and multimedia systems and equipment, and ISO TC 130, producing specification in the field of printing and graphics technologies, could be instructional in these respects also.
-
Important steps have been taken to resolve the bottlenecks with respect to the representation and compression of holographic content. This is extremely important to handle efficiently the huge volumes of data produced and consumed by holographic equipment. However, quite a few challenges still need to be tackled more intensively, such as decorrelating the colour information in multi-component holograms, providing random access functionality to the compressed holograms to enable partial decompression supporting desired viewports, motion estimation and compensation models suitable for holography, reducing the computational complexity and increasing the parallelizability, appropriately supporting learning-based applications, and improving the performance of the data quality assessment measures and procedures.
In parallel, interoperability between devised solutions, products, and services should be improved to allow for the creation of application ecosystems handling holographic content. Without this, companies launching holographic products and services will experience additional bottlenecks achieving their market share. Therefore, international standardization activities are of utmost importance to achieve this goal. An initiative to be cherished in this context is the JPEG Pleno Holography standardization effort that aims to provide an exchange and compression framework for holographic content.
-
This work was funded in part by European Research Council (FP7/N.617779–INTERFERE), the French government through the National Research Agency (ANR) Investment referenced ANR-A0-AIRT-07, the Portuguese FCT-Fundação para a Ciência e Tecnologia under the project UIDB/EEA/50008/2020, PLive X-0017-LX-20, and co-financed by the European Regional Development Fund (ERDF) through the Programa Operacional Regional do Centro (Centro 2020) under the project Centro-01-0145-FEDER-000019 - C4 - Centro de Competências em Cloud Computing, the “Convenzione triennale tra la Fondazione di Sardegna e gli Atenei Sardi - Regione Sardegna L.R.7/2007 annualità 2019-DGR DGR 28/21 del 17.05.2015” with project “Formal Methods and Technologies for the Future of Energy Systems”, CUP F72F20000350007, call 2019, and by the project Cagliari 2020 (MIUR, PON04a2 00381), Science Foundation Ireland (under grant no. 13/CDA/2224), and co-financed by the European Union under the European Regional Development Fund within the program TEAM TECH/2016-1/4 of Foundation for Polish Science.
Compression strategies for digital holograms in biomedical and multimedia applications
-
Peter Schelkens1, 2, ,
 ,
, - Ayyoub Ahar1, 2,
- Antonin Gilles3,
- Raees Kizhakkumkara Muhamad1, 2,
- Thomas J. Naughton4,
- Cristian Perra5,
- Antonio Pinheiro6, 7,
- Piotr Stępień8,
- Malgorzata Kujawińska8
- Light: Advanced Manufacturing 3, Article number: 40 (2022)
- Received: 15 September 2021
- Revised: 30 June 2022
- Accepted: 01 July 2022 Published online: 20 July 2022
doi: https://doi.org/10.37188/lam.2022.040
Abstract: While 60 years of successful application of holography is celebrated in this special issue, efficient representation and compression of holographic data has received relatively little attention in research. Notwithstanding this observation, and particularly due to the digitization that is also penetrating the holographic domain, interest is growing on how to efficiently compress holographic data such that interactive exchange of content, as well as digital storage can be facilitated proficiently. This is a particular challenge, not only because of its interferometric nature and the various representation formats, but also the often extremely large data volumes involved in pathological, tomographic, or high-end visualization applications. In this paper, we provide an overview of the state of the art in compression techniques and corresponding quality metrics for various practical applications in digital holography. We also consider the future by analyzing the emerging trends for addressing the key challenges in this domain.
Research Summary
Efficient representation and compression of holographic data are essential in multiple emerging applications. Holograms can easily result in large volumes of data representing tens or even hundreds of Gbytes. Compression methods with efficient data representation models can facilitate cost-effective storage and simplify data sharing between systems to improve the adoption of microscopic, tomographic, or high-end visualization applications.
JPEG Standardization Committee has identified this need, and currently, the JPEG Pleno standardization initiative is defining an interoperable and efficient compression solution. This paper provides an overview of the state of the art in compression of digital holograms and the quality evaluation models needed for selecting suitable compression technology.


Rights and permissions
Open Access This article is licensed under a Creative Commons Attribution 4.0 International License, which permits use, sharing, adaptation, distribution and reproduction in any medium or format, as long as you give appropriate credit to the original author(s) and the source, provide a link to the Creative Commons license, and indicate if changes were made. The images or other third party material in this article are included in the article′s Creative Commons license, unless indicated otherwise in a credit line to the material. If material is not included in the article′s Creative Commons license and your intended use is not permitted by statutory regulation or exceeds the permitted use, you will need to obtain permission directly from the copyright holder. To view a copy of this license, visit http://creativecommons.org/licenses/by/4.0/.

 DownLoad: