-
Plasmonic metasurfaces are formed by artificially patterning subwavelength nanostructures in two-dimensional (2D) arrays1-4. Their plasmonic resonances are intentionally designed by altering the spatial distribution and orientation of unit cells to improve the interactions of the impinging light by enhancing the absorption and scattering cross sections, both in linear and nonlinear optical regimes5-10. Indeed, the nonlinear absorption of plasmonic metasurfaces has attracted increasing interest in recent years for state-of-the-art applications, including frequency conversion6,9, neuromorphic circuits11-13, and ultrashort laser pulse generation14,15. Pioneering studies employed plasmonic metasurfaces as saturable absorbers (SAs) in a fibre laser, leading to soliton mode locking15,16. Owing to their well-defined shapes, sizes, and orientations, the metasurface SA demonstrated the superiority of tunable modulation depths and strong bonding to the plasmonic nature, outperforming the colloidal nanoparticles intensively used in fibre lasers14,17,18. However, such metasurface SAs were realised solely in a free-space coupled fibre laser cavity, regardless of the practical integration requirements and more in-depth physical mechanisms of saturable absorption.
Plasmonic metasurfaces are routinely fabricated on planar wafers, thus maintaining a large compatibility with conventional semiconductor technologies. Advanced nonplanar substrates involving atomic force microscope tips, carbon nanotubes, and silver nanowires have been explored in recent years using state-of-the-art nanofabrication methods19,20, which are exclusively limited to scientific demonstrations. Optical fibre tips that combine fibre optics and planar technologies are emerging as one of the most promising light-coupling platforms for both scientific and industrial communities21,22. Integrating plasmonic metasurfaces on optical fibre tips to form metafibers expands the functionalities of an ordinary optical fibre to nanoscale manipulation of light, yielding a variety of advanced applications such as planar waveshaping21,23, super-resolution imaging24, and ultracompact sensing25-27. Several strategies are applied for fabricating metafibers using either standard planar technologies, for example, focused ion beam (FIB)21,25,28,29, electron-beam lithography (EBL)30-32, nanoprinting23,27, or unconventional in-situ approaches, that is, ice lithography20,26. However, to date, plasmonic metafibers have predominantly explored separate bare fibres, and little attention has been paid to their practical applications in nonlinear plasmonic regimes33. There are also certain challenges for the widespread uptake of metafibers as regular component devices for fibre optics: a) nanofabrication suffers from inevitable mechanical vibrations and thus a poor repeatability of nanostructures due to the large aspect ratio of bare fibres; b) the connections between the functionalised bare fibres and standard optical fibres introduce either potential contaminations and even damage to the plasmonic metasurfaces, for example, through fibre splicing or considerably high insertion losses within the fibre circuit, for example, using fibre optic ferrules. Thus, methods to fabricate metafibers with a reproducible metasurface geometry and standard adapting interfaces are clearly needed.
In this work, we propose methodologies that integrate well-defined metasurfaces directly on the endfaces of commercial single mode fibre jumpers (SMFJs), as shown in Fig. 1a, by using the standard planar technologies. Widely adopted in the fibre-optics community and industry, SMFJs stably hold bare fibres in their central positions with special glues and ceramic pins and reduce external influences, such as bending and vibrations, by using multiple strength jackets. More importantly, they also provide various connection interfaces with ordinary fibre networks, for example, physical contact, ultra-physical contact, and angled physical contact, better depressing the back reflection of the light and thus reducing the return loss. To demonstrate the low insertion loss and practical application in nonlinear plasmonics, metafibers using SMFJs are implemented into fibre laser cavities, serving as special SAs that filter out the quasi-continuous wave (cw) laser background while promoting ultrashort pulse emission within the laser cavity (Fig. 1a). By tuning the plasmonic resonances of the metafibers, we were able to achieve all-fibre sub-picosecond soliton mode-locking at different optical wavelength bands. Finally, insights into the physical mechanisms underlying the saturable absorption of plasmonic metasurfaces are provided.
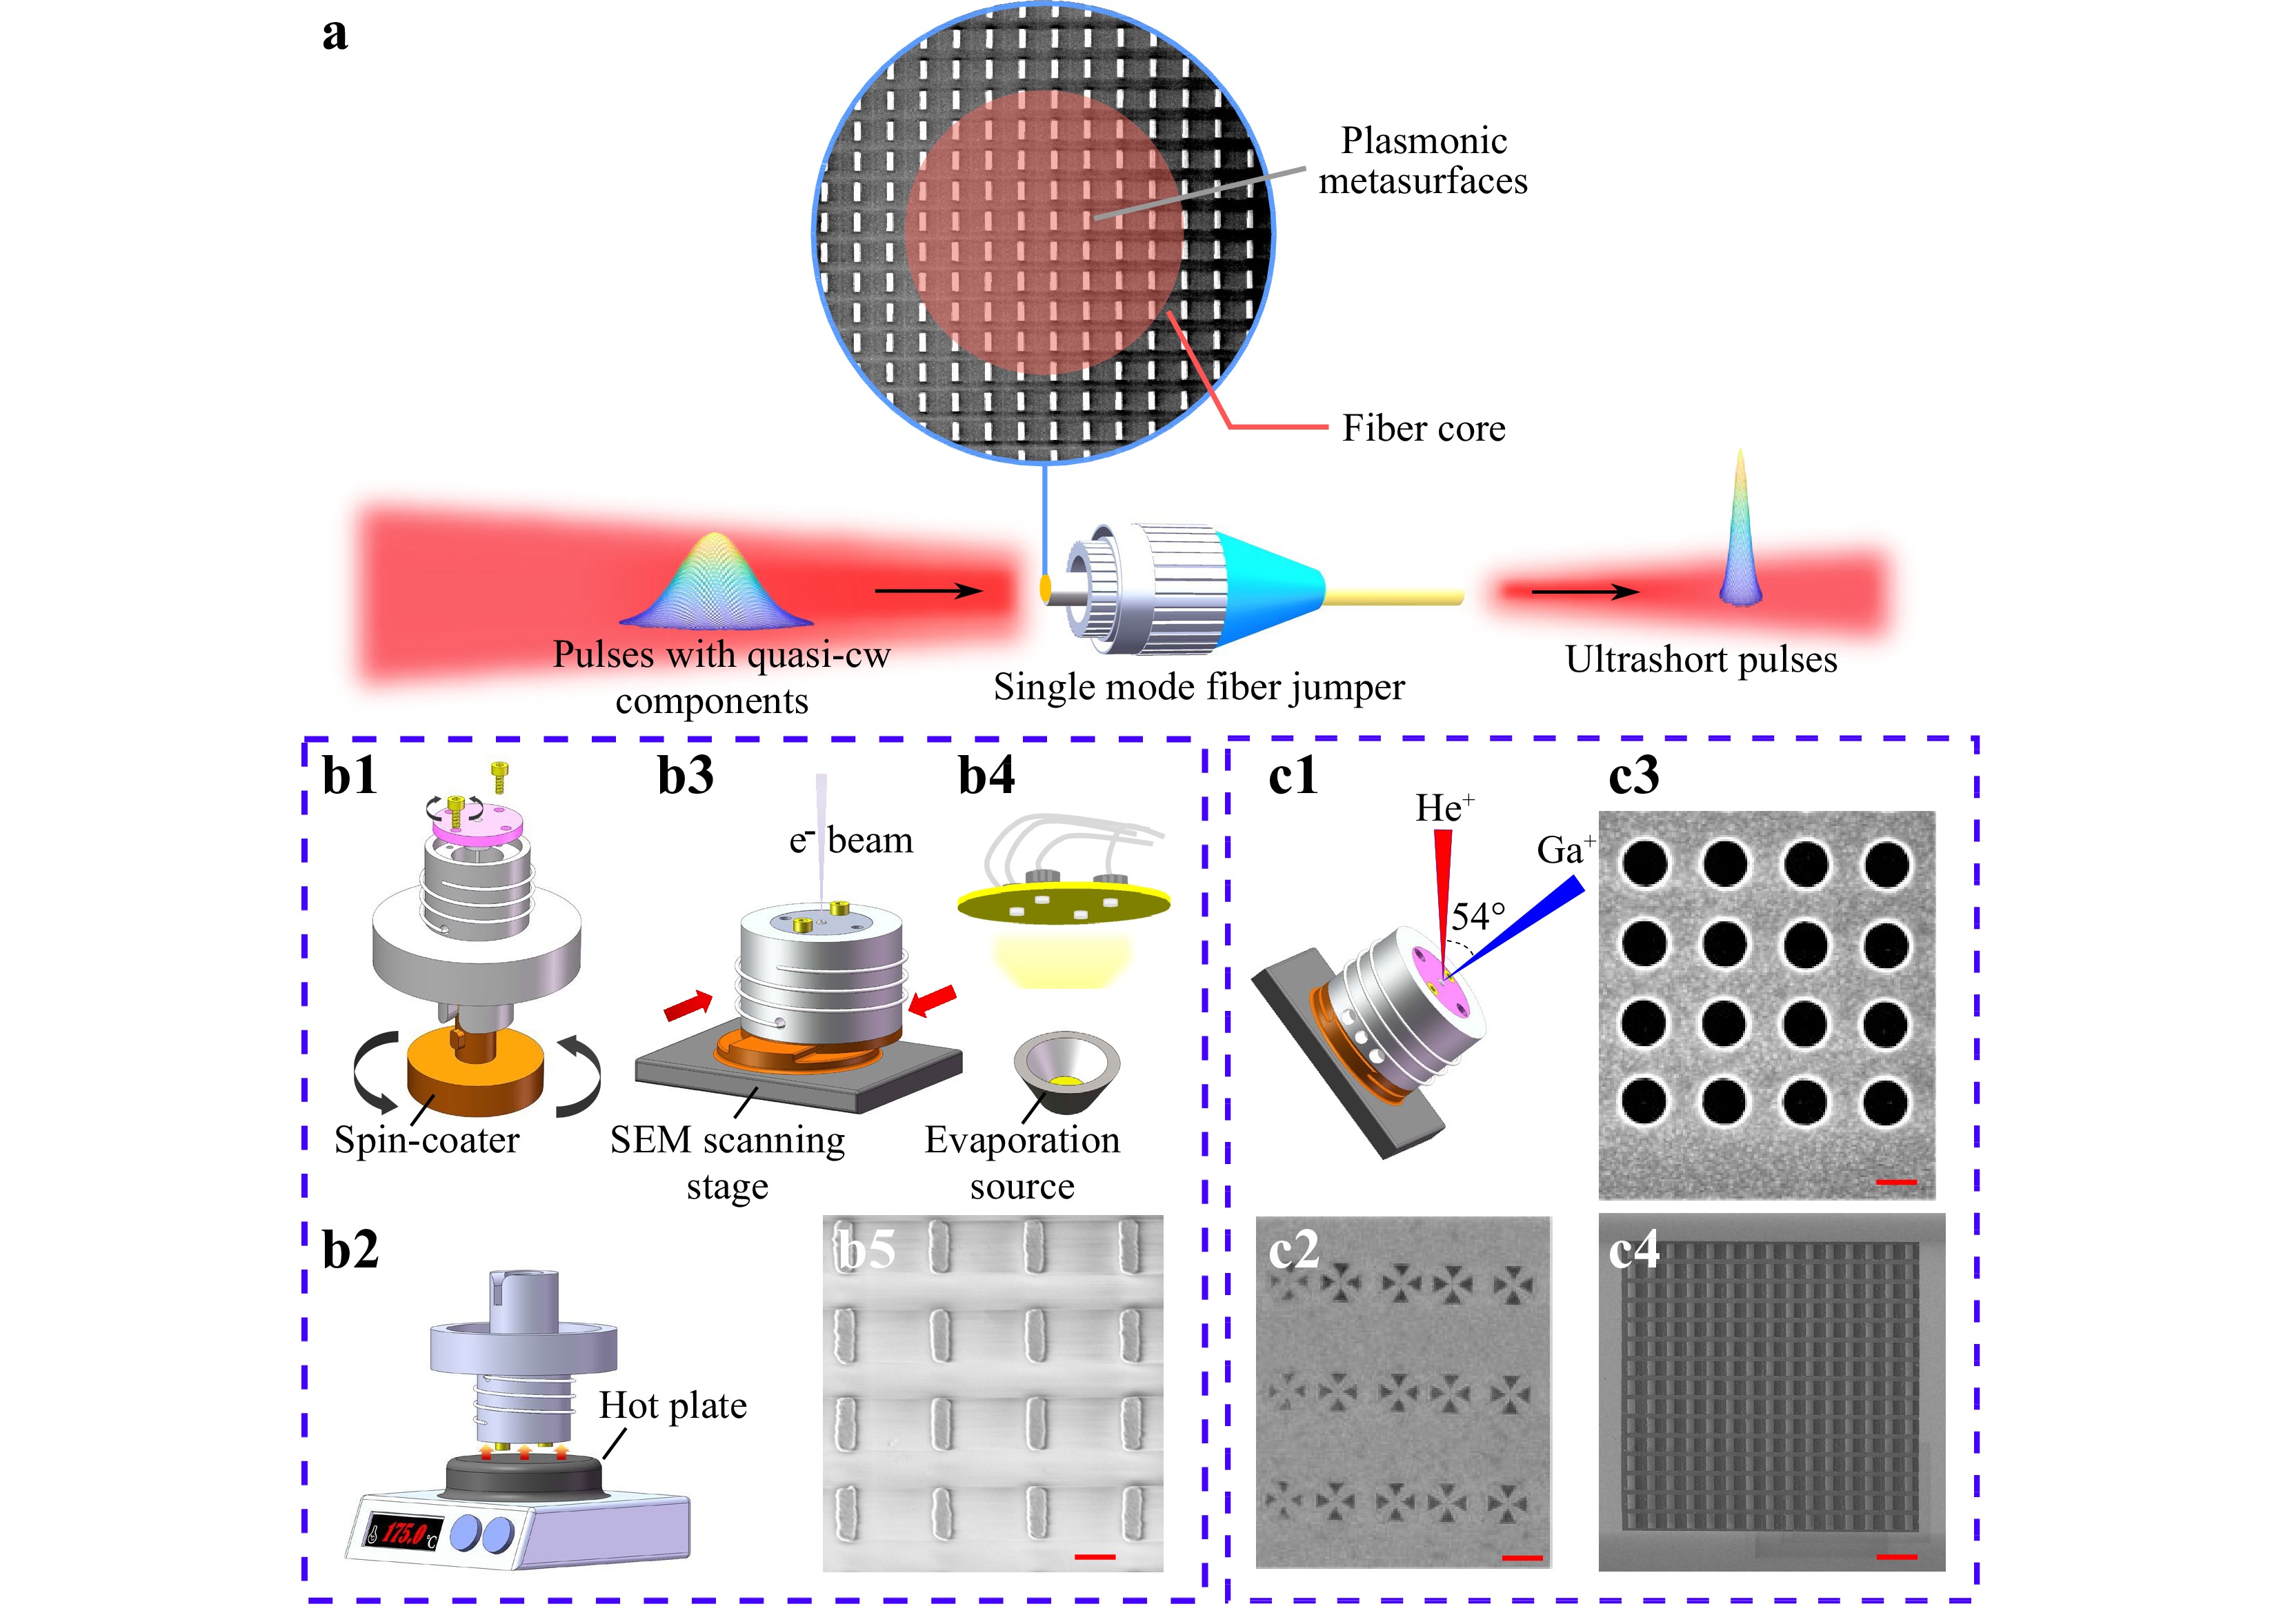
Fig. 1 Nanofabrication of plasmonic metafibers. a Schematic of plasmonic metasurfaces integrated on the endface of a standard single mode fibre jumper (SMFJ) used here as saturable absorber (SA) for laser mode locking. b1–b5 Nanofabrication of plasmonic metafibers using standard electron-beam lithography (EBL). b1 Home-built rotating chamber for the spin-coating of electron-beam resists. b2 Alternative use of the rotating chamber for the soft-baking. b3 Translating chamber for the electron-beam exposure. The bottom part is adapted to the scanning stage of a commercial scanning electron microscope (SEM). b4 SMFJ holder for the physical vapor deposition. b5 SEM image of an Au nanorod array fabricated on the endface of an SMFJ. The scale bar is 400 nm. The height of the nanostructures is 50 nm. The colour contrast in the substrate is caused by the charge accumulations during the SEM observation. c1–c4 Nanofabrication of plasmonic metafibers using standard focused ion beam (FIB). c1 Translating chamber for the ion-beam exposure, where He+ beam is used for imaging and the Ga+ beam is utilised for milling. The translating chamber is tilted at an angle of 54° in horizontal direction. c2–c4 SEM images of orthogonal Au bow-ties, Au nanoholes, and Au nanorod arrays fabricated on the endface of an SMFJ. The scale bars in c2—c4 represent 1 μm, 400 nm, and 2 μm, respectively. The height of the nanostructures is 60 nm. The horizontal lines connecting two rows of nanorods in c4 are caused by the charge accumulations during the SEM observations.
-
To pattern plasmonic metasurfaces on the endfaces of commercial SMFJs, the first planar technology we employ is the standard EBL associated with various customised mechanical parts, as shown in Figs. 1b1–b5. An SMFJ (working at 980–1650 nm, FC/PC, Ø900 μm jacket, 1 m long) was cut into two parts from the middle, one of which was stably mounted on a fibre adapter. As illustrated in Fig. 1b1, the fibre adapter could be connected to a rotating chamber designed to fit a commercial spin coater (SUSS MicroTec). After spin-coating the electron-sensitive resist, the rotating chamber was flipped top-down and placed on a hot plate for soft-baking, as shown in Fig. 1b2. The spacing (2.5 mm) between the SMFJ endface and the top surface of the hot plate was guaranteed by the heads of the four screws used to mount the fibre adapter onto the chamber. The fibre adapter was then placed in a commercial scanning electron microscope (SEM, Zeiss Crossbeam 550) for electron beam exposure, owing to a home-built translating chamber mounted on the scanning stage of the SEM, as shown in Fig. 1b3. After exposure and development, the patterned SMFJ was transferred to an evaporator via a home-built evaporation adaptor to deposit the target materials, as illustrated in Fig. 1b4. The final lift-off reveals the metasurface on the fibre endface, concluding the metafiber fabrication process flow. Fig. 1b5 shows a typical metasurface made of a nanorod array fabricated on an SMFJ endface using this technique (see ‘Nanofabrication of the metafiber using EBL’ in Supplementary Information for details). The advantages of such methods include low cost and high immunity to complicated plasmonic systems, such as heterodimers9,34,35.
Alternatively, we also demonstrate the possibility to fabricate plasmonic meta-surfaces on the SMFJ endface using the standard FIB milling, as illustrated in Figs. 1c1–c4. The evaporation adaptor shown in Fig. 1b4 was first used to deposit the target metal, for example, Au. The SMFJ was then transferred to a custom-built translating chamber mounted on the scanning stage of a commercial FIB instrument (Carl Zeiss, ORION NanoFab, Germany) for milling, as shown in Fig. 1c1. Figs. 1c2–c4 shows SEM images of three types of plasmonic metasurfaces on the endfaces of standard SMFJs after milling: orthogonal bowties, nanoholes, and nanorods, respectively (see ‘Nanofabrication of the metafiber using FIB’ in Supplementary Information for details). Compared to EBL, FIB requires fewer preparation procedures and provides a relatively better resolution for nanopatterning. In addition, because resist spin-coating is not needed, the FIB process flow is compatible with nonplanar fibre interfaces, for example, angled physical contacts, thus offering a fast and convenient way to functionalise most of the commercially available optical fibres.
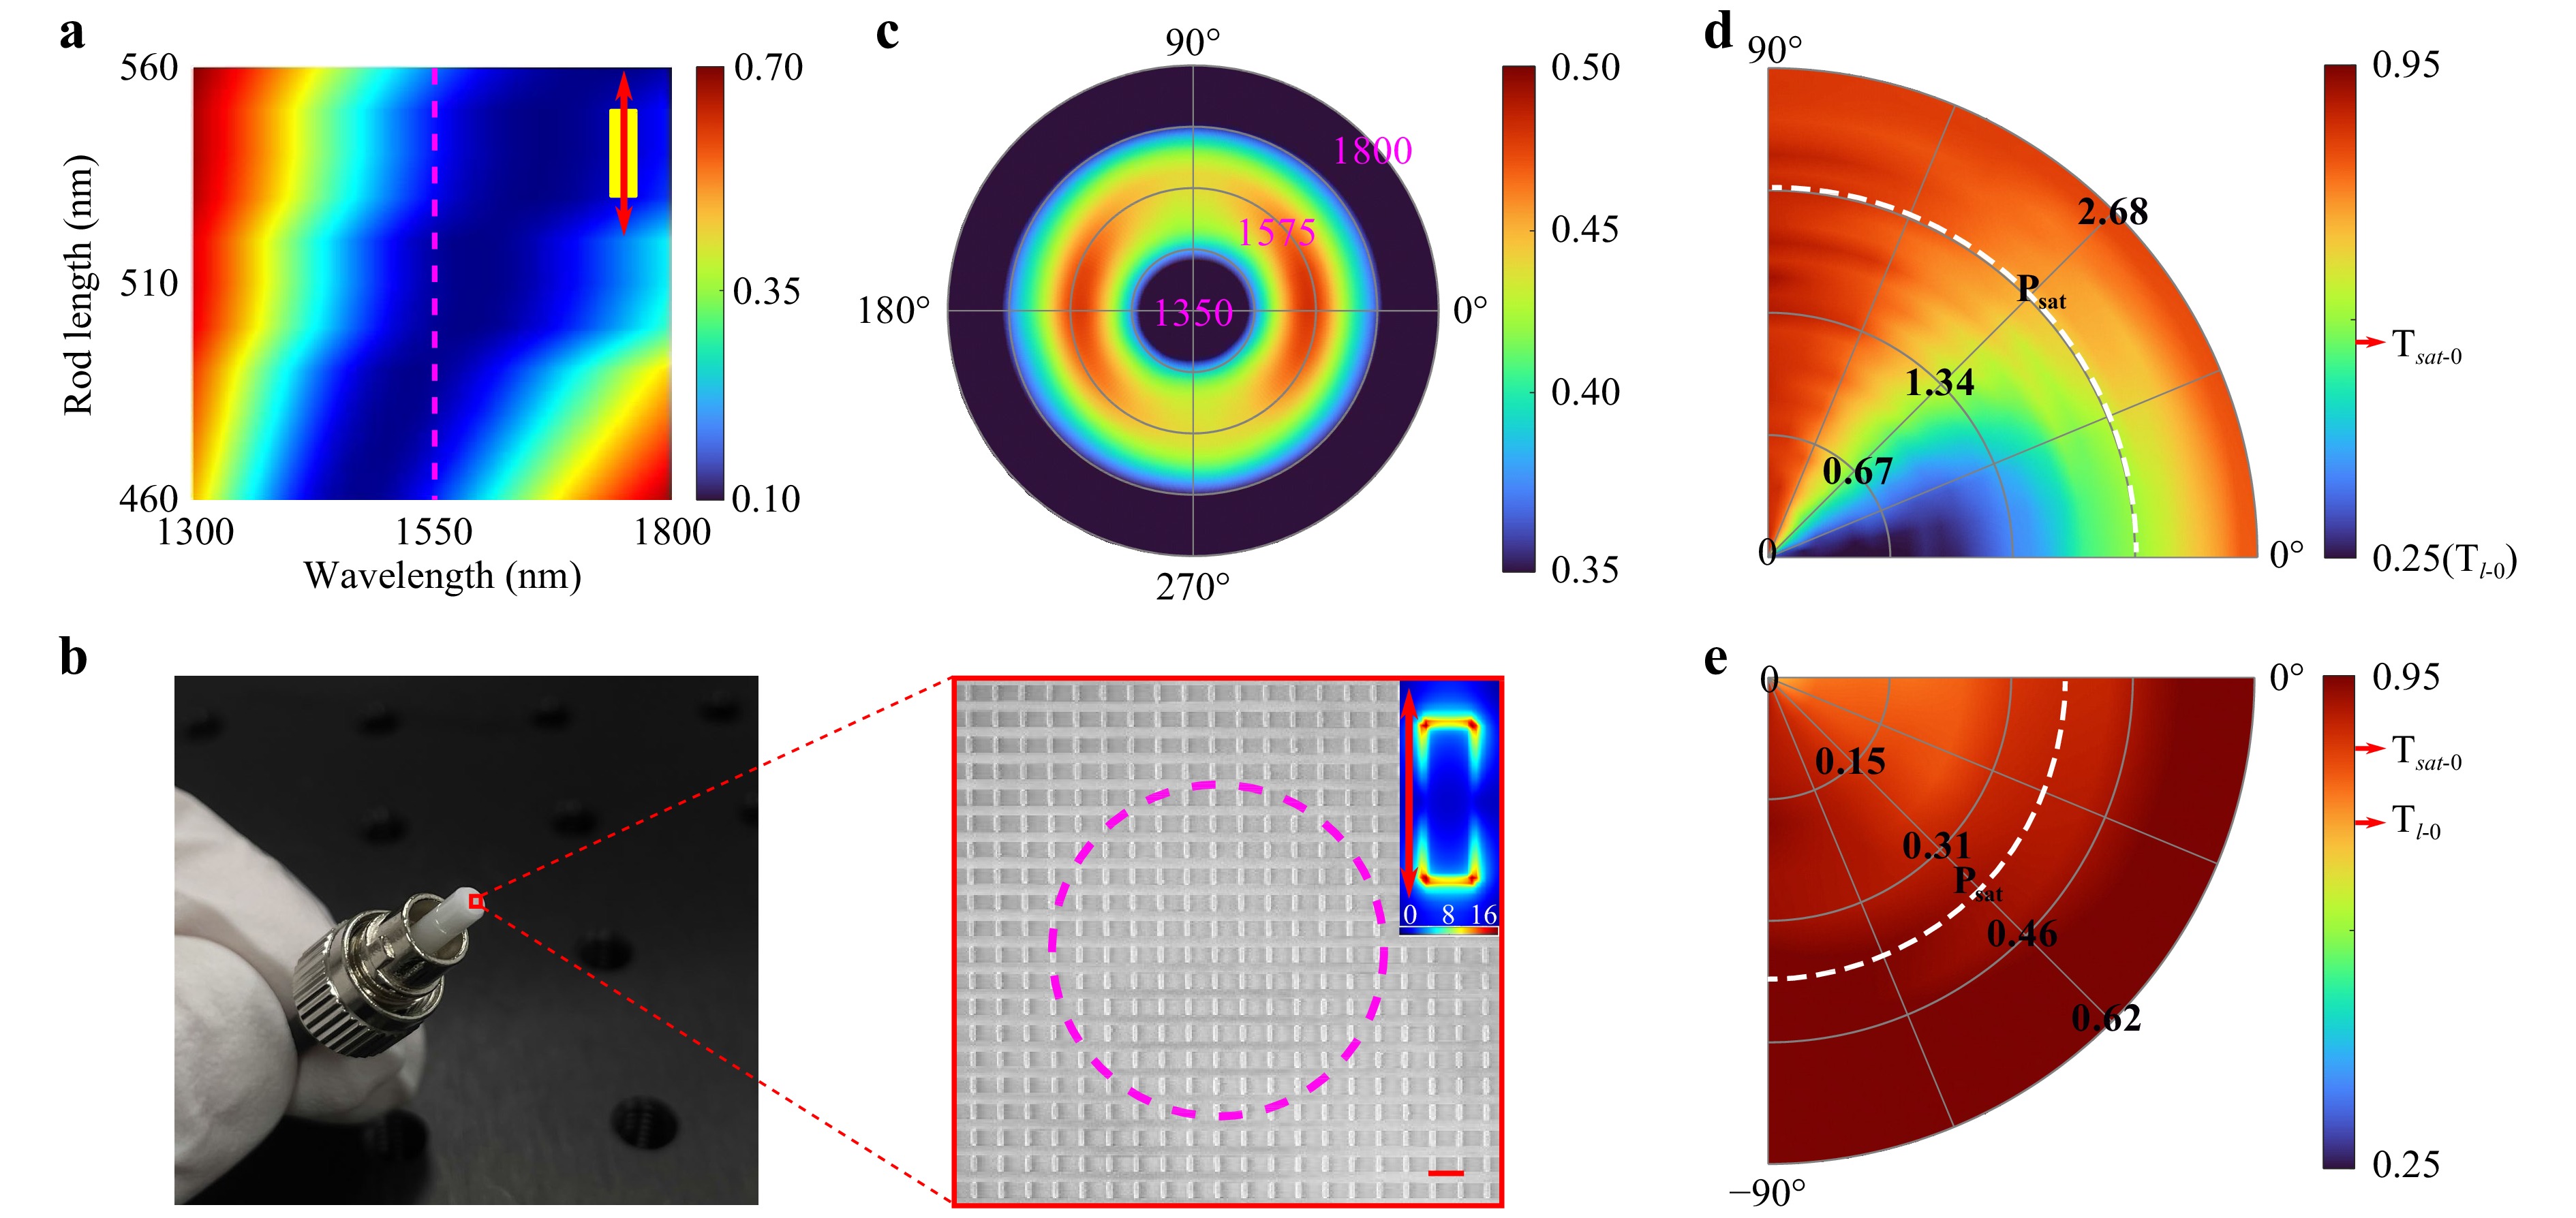
Fig. 2 Nanocharacterisation of the plasmonic metafibers. a Calculated transmission spectra of the Au nanorod arrays with varying rod lengths. The rod width is 160 nm and the height is 50 nm. The longitudinal and transverse periods remain constant at 750 nm. The excitation polarisation is parallel to the long axis of the nanorods. The pink dashed line indicates the spectral wavelength of 1550 nm. b Photograph of the fabricated metafiber by using EBL and the corresponding SEM image in the fibre core region. The scale bar represents 800 nm. The dashed pink circle indicates the boundary of the fibre core. The inset shows the fundamental electrical field distribution of the nanorod array (taking the periodic conditions into account). The red arrow represents the incident polarisation. The horizontal lines between two rows of nanorods presented in the SEM figure were caused by the charge accumulations during the SEM observations. c Experimental polarimetric extinction spectra of the plasmonic metafiber. The polar coordinates (
$ \lambda, \theta $ ) represent the spectral wavelength and the polarisation angle of the incident light. The colour contrast represents the extinction level of the metafiber. d, e Power- and polarisation-dependent nonlinear transmission of a nanorod array in on-resonance (using 1550 nm fs laser) and off-resonance (using 1950 nm fs laser) excitation conditions. The polar coordinates (P,$ \theta $ ) represent the averaged power in the focus and the polarisation angle of the incident light. The colour contrast represents the transmission level of the nanorod array. The white dashed curves represent averaged saturation powers.$ T_{l{\text -}0} $ and$ T_{sat{\text -}0} $ denote the transmission levels at$ \theta $ = 0° in the linear absorption regime and once absorption is saturated, respectively.Thanks to our versatile nanomanufacturing setups, the metasurfaces with specific plasmonic properties can be easily transferred from planar substrates to the fibre endfaces. Thus, we have employed these techniques to fabricate saturable metafibers and then demonstrated their use for laser mode-locking. First, to achieve saturation of optical absorption from a metasurface, we need to tune the plasmonic resonance to the target wavelength, for example, the C+L telecommunication optical wavebands at 1.5 μm which can be entirely covered simultaneously owing to the broad resonance of the same plasmonic metasurface15. Nanorods are one of the most common nanostructures used to achieve designed plasmonic functionalities15,36. Indeed, their resonances can be easily tuned from the visible to near-infrared regimes by altering the dimensions of the nanostructures (size and aspect ratios)15,36. Fig. 2a shows the theoretical transmission spectra of a 50 nm thin metasurface made of Au nanorods arranged in a square array with a 750 nm period, a constant rod width of 160 nm and varying lengths (see ‘Linear optical response calculations’ in Supplementary Information for details). The excitation polarisation was parallel to the long axis of nanorods. As shown in Fig. 2a, the metasurface resonated at 1550 nm, which is the central wavelength of the telecommunication band, for a rod length of 470 nm. Such resonance originates directly from the longitudinal dipolar plasmonic mode of the individual nanorods. Based on these numerical calculations, we fabricated the corresponding plasmonic metasurfaces on the endface of a standard SMFJ using EBL, as depicted in Fig. 2b. The measured lengths and widths of the nanorods are 485 nm and 155 nm respectively, with a tolerance of 10 nm. The inset shows the fundamental electric field distribution of a nanorod array with the actual dimensions excited by a plane wave of 1550 nm. The incident polarisation was linear and parallel to the long axis of the nanorods. Strongly confined hotspots can be clearly observed in the near field of the nanorods, as shown in the inset of Fig. 2b, emphasising the excitation of the longitudinal dipolar modes.
To characterise the optical responses, i.e., the resonant absorptions, of the metafibers, a home-built extinction microscope was first employed (see ‘Optical setups for measuring the extinction spectra’ in Supplementary Information for details). A supercontinuum light source (SLS, NKT photonics) emitting in the 1–1.8 μm spectral range was used to excite the plasmonic metasurfaces. The measured extinction spectra with polarisation dependence are exhibited in Fig. 2c. The polar coordinates (
$ \lambda, \theta $ ) represent the spectral wavelength and incident polarisation angles, respectively.$ \theta $ = 0° corresponds to incident polarisation parallel to the long axis of the nanorods. The colour contrast represents the extinction level of the metafiber. The extinction spectrum, which denotes the fingerprint of plasmonic resonance, is defined as Ext ($ \lambda $ ) =$ [T_{ref}(\lambda) -T_{nr}(\lambda)]/T_{ref}(\lambda) $ , where$ T_{ref}(\lambda) $ is the transmission of the reference fibre,$ T_{nr}(\lambda) $ is the transmission of the metafiber, and$ \lambda $ is the wavelength. The reference fibre is identical to the metafiber except that there are no plasmonic nanostructures on the endface. The dipole radiation-like map demonstrates the dominant role of the longitudinal dipolar mode of the metasurfaces. The plasmonic resonances are generally located at 1550 nm and have an average full width at half maximum (FWHM) of 200 nm. Depending on the excitation polarisation, the extinction fluctuates in an approximate sine/cosine function.Following the linear optical characterisation, nanorod metasurfaces with the same patterns are fabricated on a glass substrate with the same refraction index as the SMF core by using standard EBL, in order to further investigate their power- and polarisation-dependent nonlinear optical responses. The nonlinear transmittance was measured using a home-built optical setup with an ultrashort pulsed pumping laser (see ‘Optical setups for measuring nonlinear optical transmissions’ in Supplementary Information for details). The repetition rate of the laser was 10.32 KHz and the output wavelength was tuned from 600 nm to 2400 nm via an optical parametric amplifier. The pulse duration varied slightly with the output wavelength, for example, it changed from 179 fs to 166 fs as the wavelength was tuned from 1550 nm to 1950 nm. The incident polarisation was linear and thus the polarisation axis with respect to the nanorod orientation was tuned with a half-waveplate. Using this laser, we recorded the transmission of the nanorod array under study and used the transmission of a nearby blank glass slide as a reference.
We first used the excitation laser at the central wavelength of 1550 nm, where the plasmonic resonance of the nanorod array locates. The result is plotted in the polar pseudocolour diagram shown in Fig. 2d, in which the polar coordinates (P,
$ \theta $ ) represent the average power in the focus and the input polarisation angle, and the colour map represents the transmission level of the array.$ \theta $ ranges from 0° to 90° with respect to the long axis of the nanorods. With this representation, saturable absorption with power and polarisation dependencies appears clearly. At lower power, the transmission of the nanorod array remains constant,$ T_l $ , for a given polarisation. In this linear regime, the transmission strongly depends on the incident polarisation because$ T_l $ is inversely proportional to the absorption cross section of the nanorod. Above a critical power, the overall transmission increases nonlinearly until it reaches a saturated value$ T_{sat} $ , indicating saturation of the metasurface absorption. For all the input polarisation orientations, the power-dependent transmission coefficient shows a ‘S’-shape profile, from which the modulation depth, saturation intensity$ P_{sat} $ , and the parameters of$ T_l $ and$ T_{sat} $ could be obtained by fitting the data (see ‘Laser intensity dependent optical transmission model’ in Supplementary Information for details). The modulation depth shows a strong dependence on the incident polarisation, ranging from 5% to 57% when the polarisation is tuned from the short axis to the long axis of nanorods. Such high modulation depths exceed the best performance of 2D-SAs37. When the same nanorod metasurface was excited with a 1950 nm pulsed laser, a clear decrease in the polarisation dependency was observed, as shown in Fig. 2e. This lowering of the polarisation dependency also results in global growth of the transmission at a minimum of 70% and a drop in the modulation depth at a maximum of 26%. The mismatch between the plasmonic resonance and fundamental excitation significantly reduces the linear and nonlinear absorptions of the nanorod array, resulting in an unremarkable saturable absorption. The results in Fig. 2d, e can probably explain why considerably low modulation depths were reported previously on colloidal Au nanorods, as the dispersed sizes and orientations averaged the saturable absorption and the critical contribution of plasmonic resonances14,17,18.The saturable absorption can be helpful for achieving the formation of ultrashort pulses in laser architectures, ultimately reaching self-starting passively mode-locked regimes15. To further test the fabricated samples and provide a practical demonstration of the saturable metasurfaces application in nonlinear optics, metafibers were integrated into the fibre laser cavities to promote mode locking. The fibre cavity shown in Fig. 3 was constructed, which included a 980 nm pump diode (LD, maximum pump power of 88 mW), a 980/1550 nm wavelength multiplexer (WDM), 35 cm of erbium-doped fibre (EDF, Nufern, SM-ESF-7/125), a polarisation-insensitive isolator (ISO), a polarisation controller (PC), and an output fibre coupler (OFC). The PC is used to alter the laser polarisation in the cavity, targeting a proper SA efficiency by virtue of the polarimetric properties of the metafibers shown in Fig. 2c, d. The coupler extracts 10% of the laser energy for pulse characterisation. The overall length of the cavity is 8.8 m with anomalous net chromatic dispersion, and all the fibre connections are made with a standard telecom fibre SMF-28e.
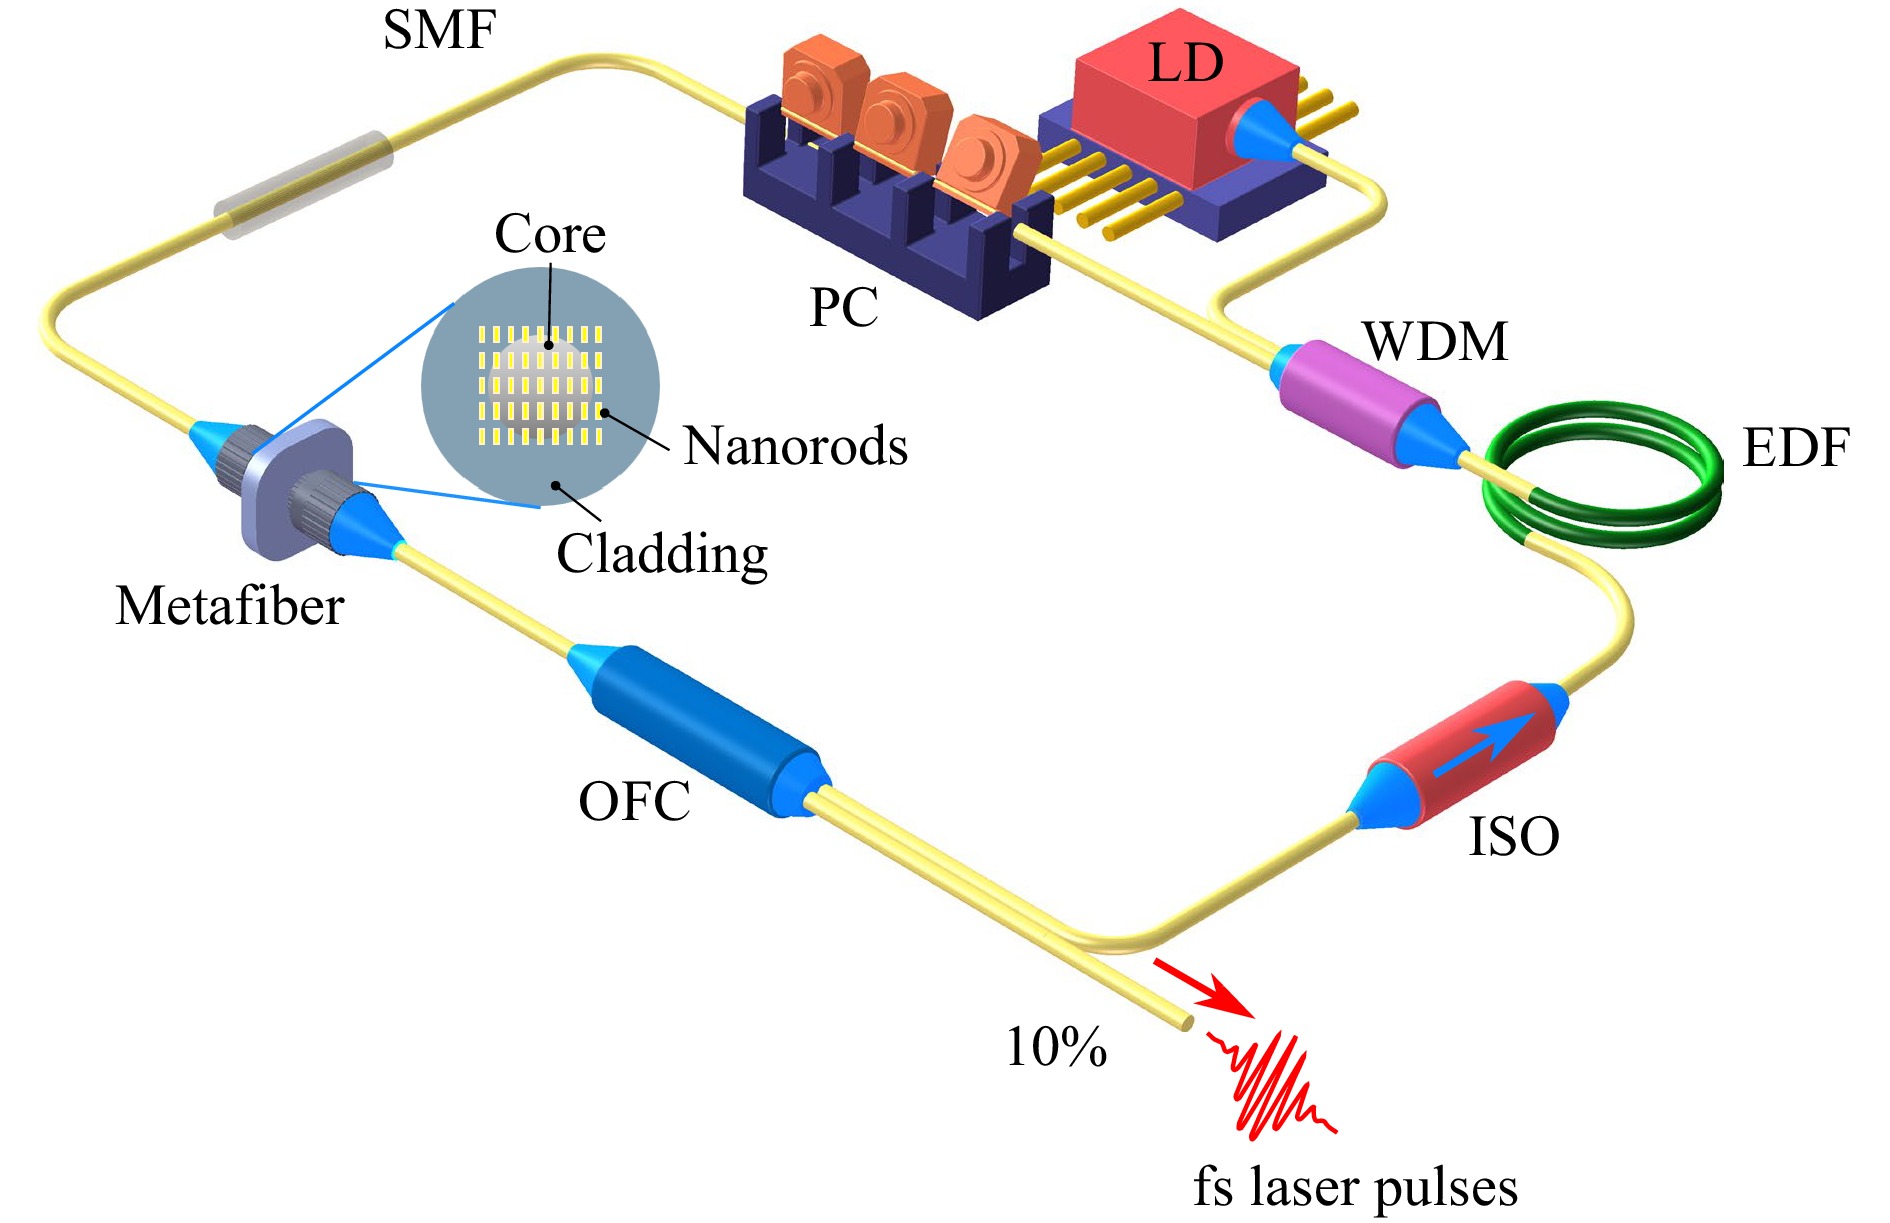
Fig. 3 Home-built ultrafast fibre laser integrating a plasmonic metafiber, where LD represents the pump laser diode, WDM is the wavelength-division multiplexer, EDF is the erbium-doped fibre, ISO is the optical isolator, OFC is the output fibre coupler, SMF stands for standard single-mode telecom fibre, and PC is the polarisation controller.
In such an overall anomalous dispersion regime, the chromatic dispersion and the self-phase modulation accumulated during a cavity roundtrip can balance on average, preventing a significant pulse broadening and leading to a so-called optical soliton regime38. The output pulse train and radio frequency (RF) spectra were monitored using an oscilloscope (Tektronix, 1 GS/s, 100 MHz) and RF spectrum analyser (Keysight, N9000B), respectively. The pulse spectra, output power, and autocorrelation trace were monitored using an optical spectrum analyser (Yokogawa, AQ6375), a power meter (Thorlabs, S148C), and an autocorrelator (FR-103XL), respectively. Fig. 4a shows the average laser output power featuring a CW laser conversion efficiency of 5.5% without the metafiber SA, noting that the conversion efficiency is limited by the moderate 10% output coupling. The laser threshold was approximately 13 mW, demonstrating the relatively low loss of the entire cavity. After the implementation of the metafiber SA into the laser cavity, the power threshold of the CW laser increased to 23 mW owing to the insertion loss. We note the low mode-locking threshold at a pump power of 38 mW, and the conversion efficiency of the mode-locked laser is reduced to 1.8%, resulting from an efficient laser regime discrimination performed by the metafiber SA. Fig. 4b shows the optical spectrum of the laser mode-locked with the metafiber SA for a pump power of 49 mW. The spectrum has a smooth broadband central part with a 3-dB bandwidth of 6 nm, centred at 1560 nm. Two sets of Gordon–Kelly sidebands appear on both sides of the spectrum, which is a typical feature of fibre lasers mode-locked in the vector soliton regime39-41. Fig. 4c shows the optical autocorrelation trace at a pump power of 58 mW. A pulse duration of 513 fs was inferred from the measurement, and the time-bandwidth product (TBP) was estimated to be 0.379, indicating that the output pulses were slightly chirped, as compared with the expected TBP of 0.315 for an unchirped exact hyperbolic-secant-shaped pulse38. The time interval between subsequent output pulses was measured to be 44 ns, which corresponds to the fundamental frequency of 22.7 MHz in Fig. 4d. Fig. 4d presents the RF spectra of the soliton mode-locked pulse at a pump power of 58 mW. The signal-to-noise ratio of the fundamental frequency of the laser can reach 75 dB at a resolution of 300 Hz, and the signal-to-noise ratio of the RF spectrum in the range of 0–1 GHz is greater than 60 dB at a resolution of 10 KHz, indicating remarkably high stability of the laser pulses.
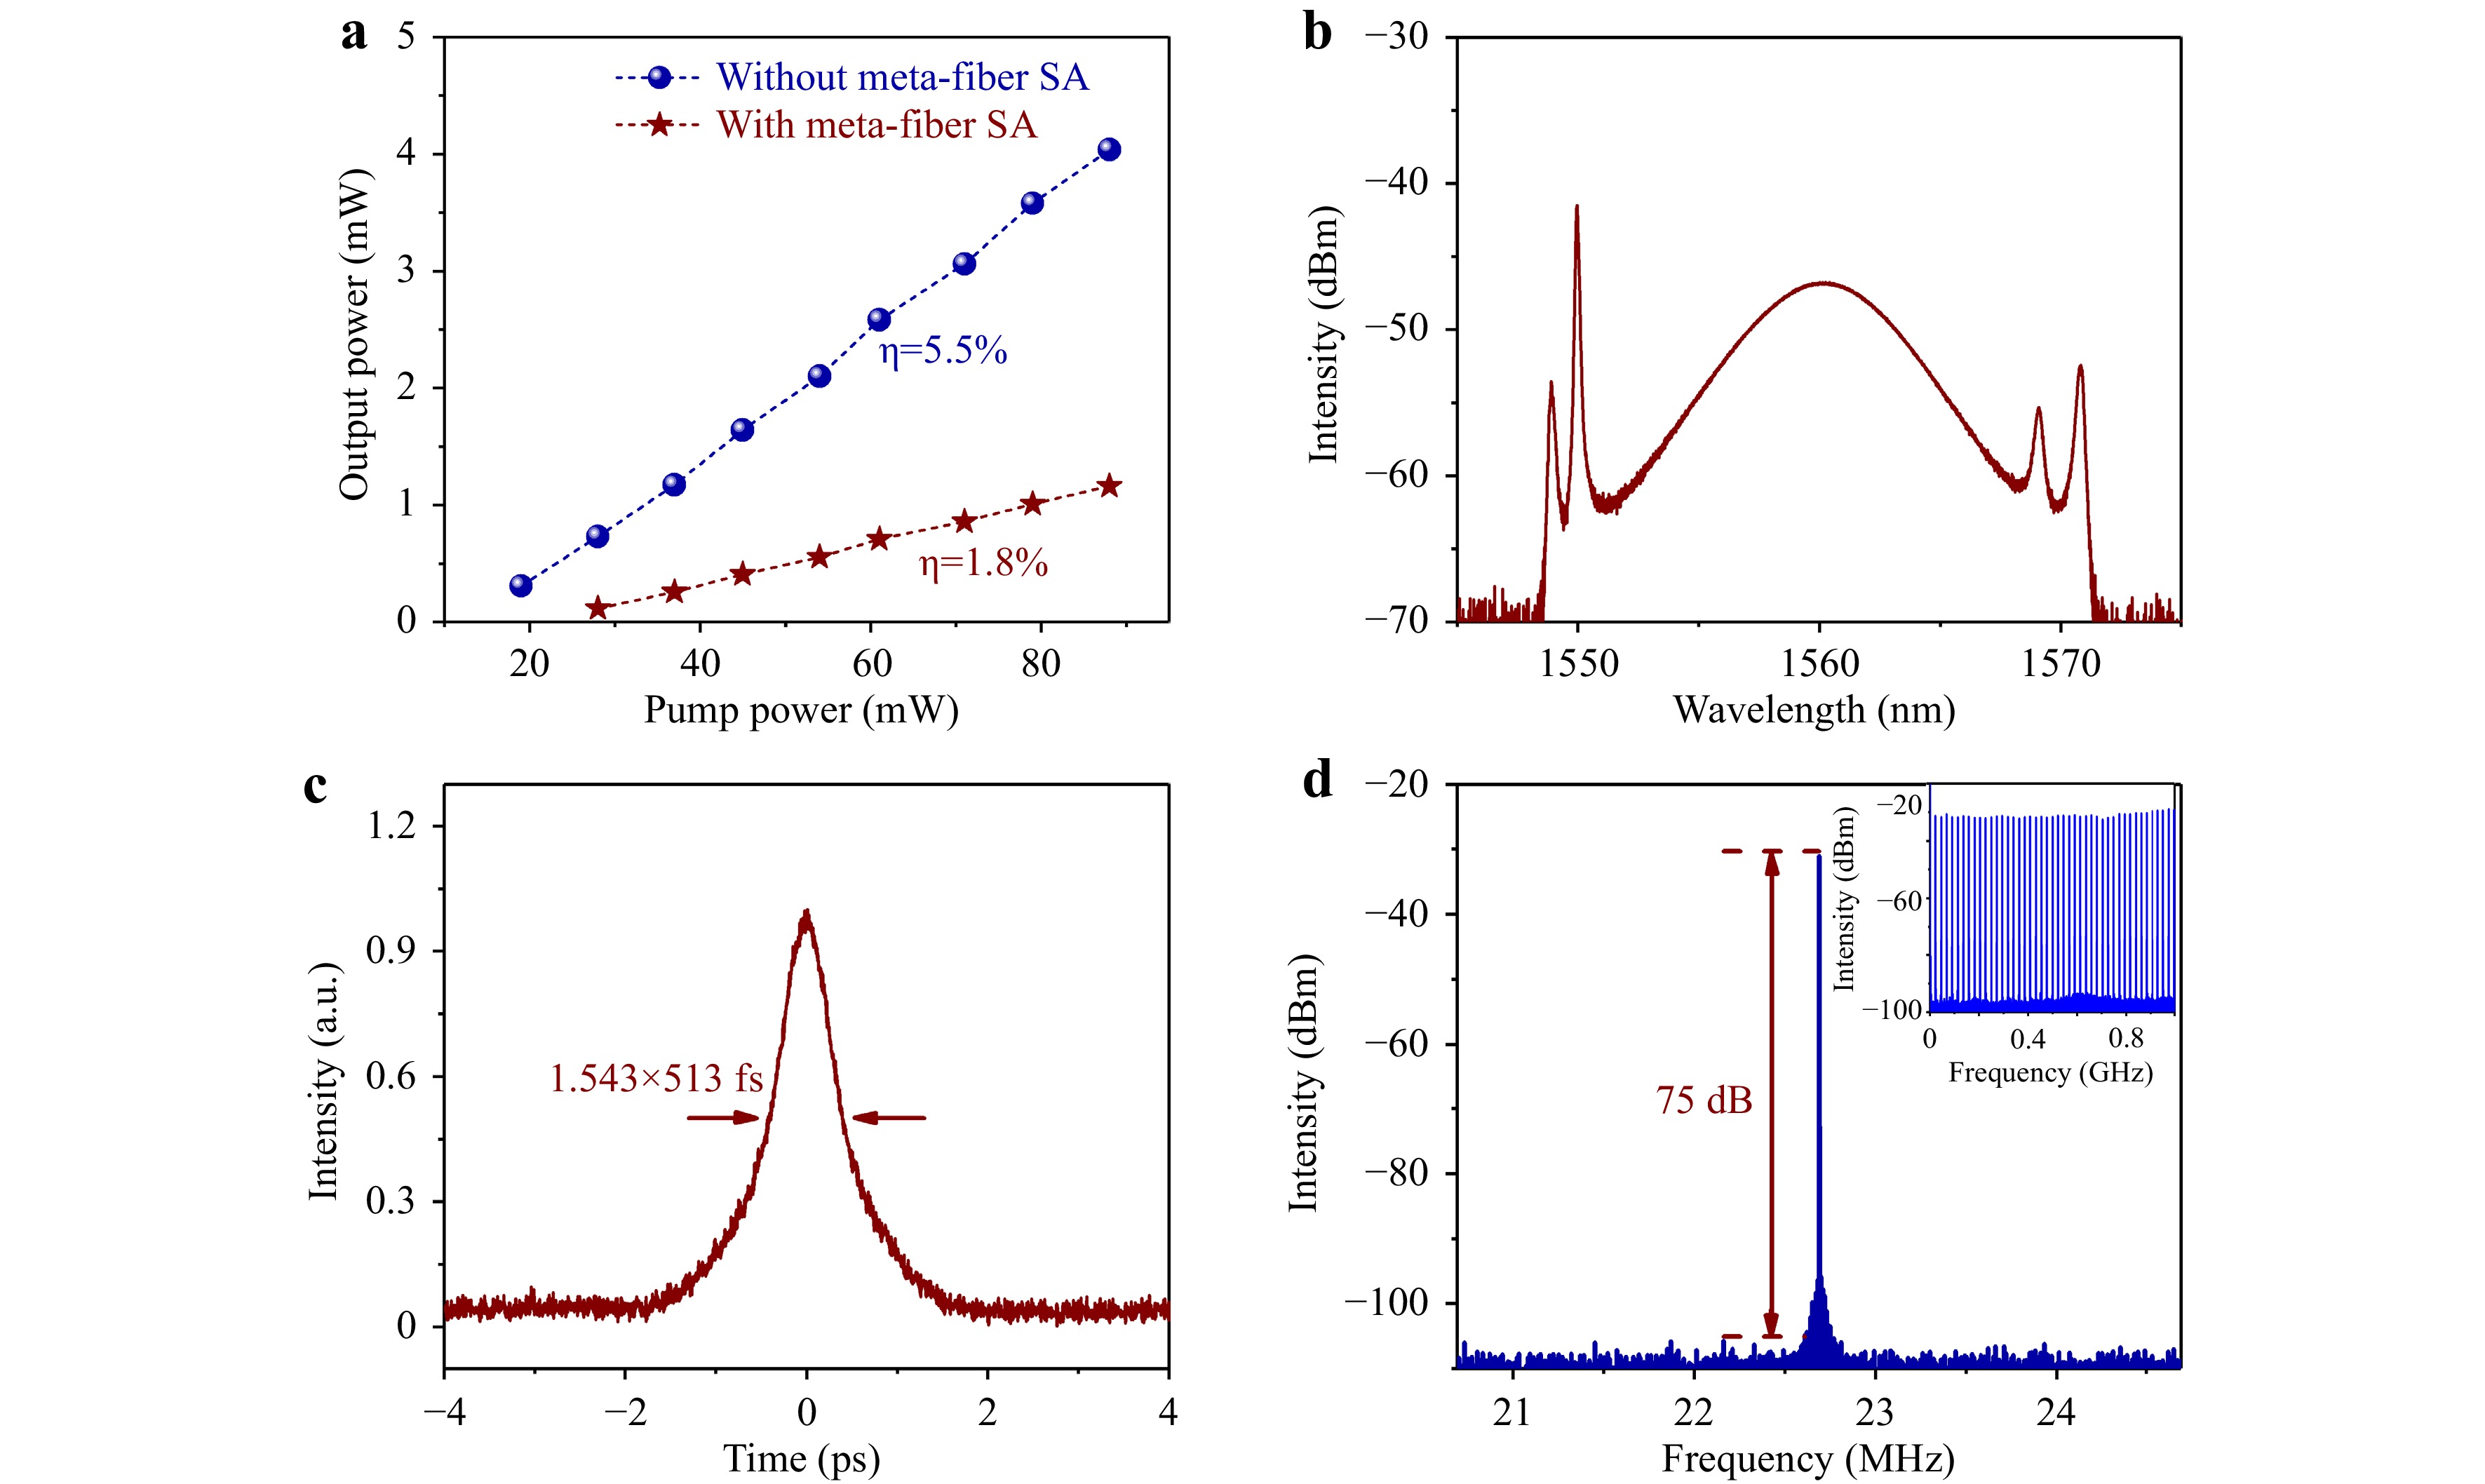
Fig. 4 Soliton mode-locking at 1.5 μm optical waveband incorporated with a plasmonic metafiber. a Averaged output power of a mode-locked fibre laser with the metafiber SA (red stars) and a cw laser without the metafiber SA (blue dots) as functions of the pump power. b Soliton pulse spectrum at pump power of 49 mW. c Autocorrelation trace of a single soliton at pump power of 58 mW. d RF spectrum of the soliton pulses with a scanning range of 5 MHz and a resolution of 300 Hz. The inset shows the RF spectrum of the soliton pulses with a scanning range of 1 GHz and a resolution of 10 KHz.
The soliton pulses can be tuned to other optical wavelength bands, e.g., 2 μm in a thulium fibre laser, by adapting the plasmonic resonance of a metafiber to the gain spectrum of the laser cavity. To achieve resonant absorption at 2 μm for example, we use similar nanorod metasurfaces but with different landscapes. As shown in Fig. 5a, the transmission spectra of nanorod arrays with constant width (340 nm) and spacings (longitudinal and transverse periods: 1 μm) but different lengths were calculated. The rod length can be evaluated as 680 nm, where the longitudinal dipolar mode of the plasmonic metasurfaces is located at 2 μm. Guided by the numerical predictions, we fabricated corresponding plasmonic metasurfaces on an SMFJ endface using FIB, as shown in the SEM image in Fig. 5b. The longitudinal and transverse periods remained the same at 1 μm. The length and width of the nanorods were measured as 690 nm and 345 nm with a tolerance of 10 nm, respectively. The inset shows the fundamental electric field distribution of a nanorod array with actual dimensions excited by a linearly polarised plane wave at 2 μm. The nonlinear transmission spectra with incident power and polarisation-dependencies are measured in both the on-resonance and off-resonance cases, similar to Fig. 2c, d. In the on-resonance case, fs-pulsed laser with a central wavelength of 1950 nm was used as the light excitation source (Fig. 5c), whereas in the off-resonance case, the wavelength of the excitation laser was switched to 1550 nm (Fig. 5d). Similarly, strong polarimetric linear and nonlinear absorption can be clearly observed from the former, while the polarisation dependency almost disappears for the latter. The maximum modulation depth in the former case was 37%, whereas it decreased to 18% for the latter. The metafiber was then placed into a laser cavity operating in the 2 μm region, which resulted in stable soliton mode-locking (see ‘Soliton mode-locking at 2 μm’ in Supplementary Information for details). The time-averaged pulse spectrum is shown in Fig. 5e at the pump power of 310 mW, featuring multiple pairs of symmetric sidebands. The central wavelength was 1921.1 nm, and the FWHM of the spectrum was 3.2 nm. Fig. 5f exhibits the pulse autocorrelation trace and pulse trains at a pump power of 310 mW. The pulse duration of 1.42 ps is measured.
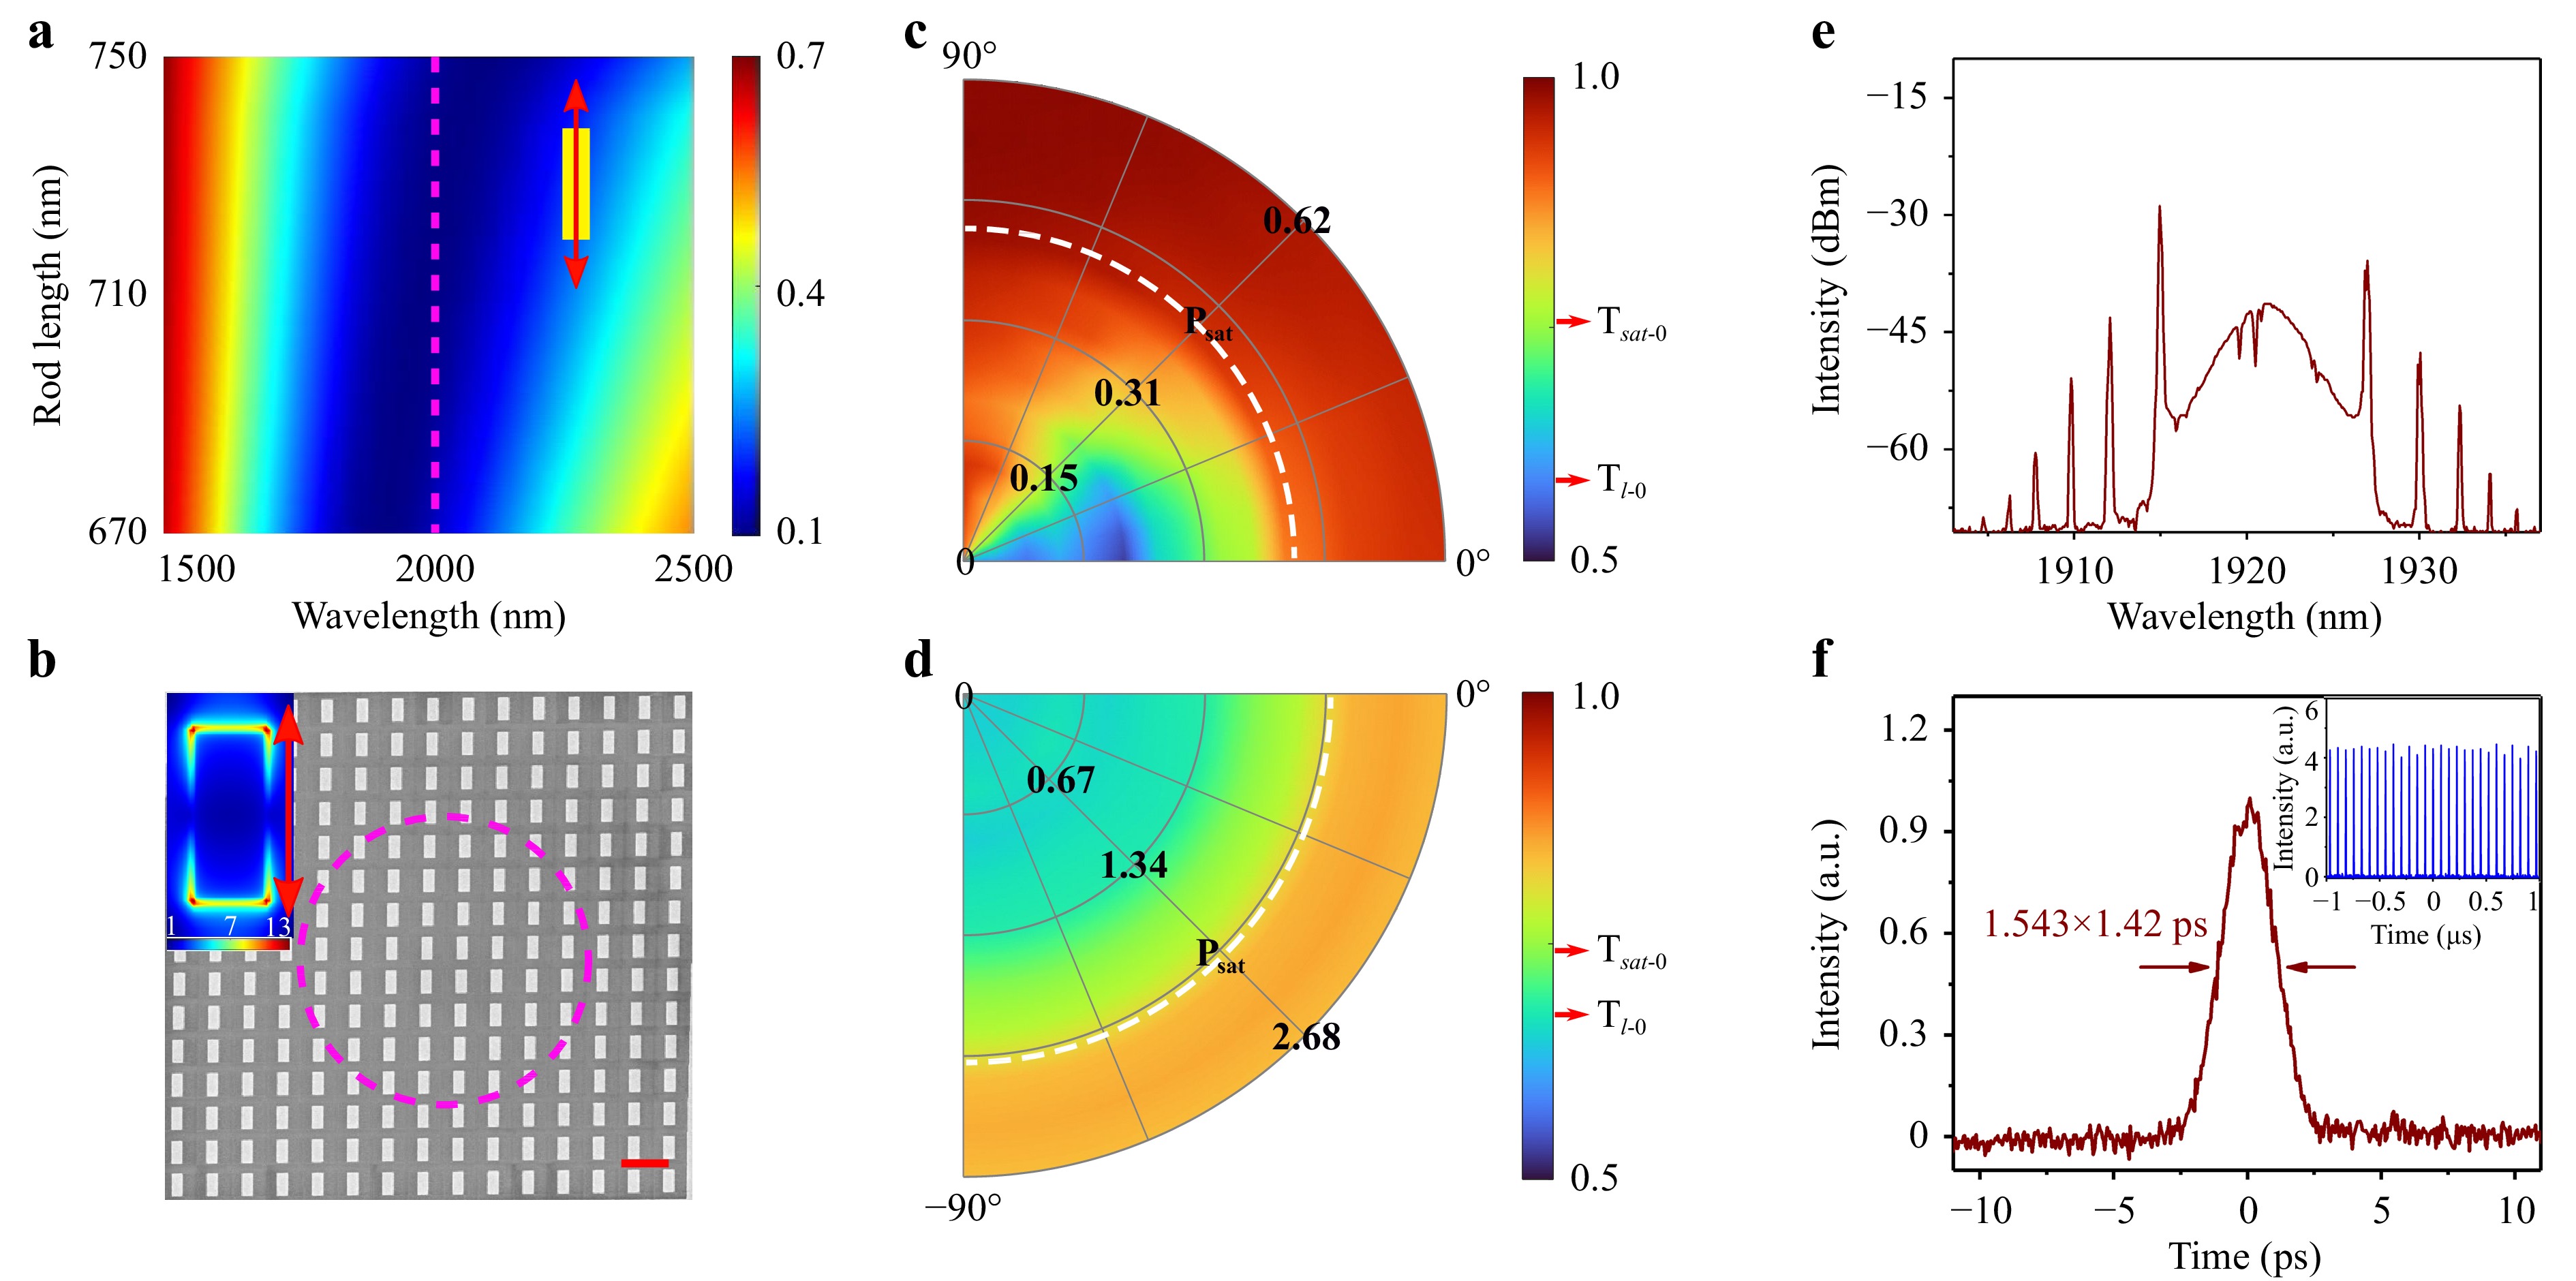
Fig. 5 Plasmonic metafiber for the soliton mode-locking at the approximately 2 μm optical waveband. a Calculated transmission spectra of the Au nanorod metasurfaces with varying rod lengths. The rod width is 340 nm. The longitudinal and transverse periods are maintained constant as 1 μm. The excitation polarisation is parallel to the long axis of the nanorods. The height of the nanostructures is set to 60 nm. The pink dashed line indicates the spectral wavelength of 2 μm. b SEM image of an Au nanorod metasurface fabricated on the endface of a standard SMFJ by using FIB. The length and width of the nanorods are 690 nm and 345 nm with a tolerance of 10 nm, respectively. The longitudinal and transverse periods are the same: 1 μm. The height of the nanostructures is 60 nm. The scale bar represents 1 μm. The dashed pink circle indicates the boundary of the fibre core. The inset shows the fundamental electrical field distribution of the nanorod array (taking periodic conditions into account). The red arrow in the inset indicates the input polarisation. c, d Power- and polarisation-dependent nonlinear transmission of a nanorod array in on-resonance (using 1950 nm fs laser) and off-resonance (using 1550 nm fs laser) excitation conditions. The polar coordinates (P,
$ \theta $ ) represent the averaged power in the focus and input polarisation, respectively. The colour contrast represents the transmission level of the nanorod array. The white dashed curves represent averaged saturation powers.$ T_{l{\text -}0} $ and$ T_{sat{\text -}0} $ denote the transmission levels at the initial states of linear absorption and saturable absorption when$ \theta $ = 0°, respectively. e Soliton pulse spectrum generated by a thulium-doped fibre laser incorporating a metafiber SA, at the pump power of 310 mW. f Autocorrelation trace of a single soliton at the pump power of 310 mW. The inset shows the pulse trains over a longer time range (2 μs). The time interval is 72 ns.It is notable here that we have not managed to reach any mode-locked regime in the off-resonance cases (as shown in Fig. 2f and Fig. 5d), demonstrating the unambiguous roles of plasmonic resonances in the saturation absorption and promotion of laser mode-locking. We also observed no visible thermal damage from such metafiber SAs following their usage in ultrafast pulse generation (for both the 1.5 μm and 2 μm cases), even at the maximum pump powers, indicating the good thermal conductivity and stability of the plasmonic metasurfaces against optical damage (see ‘Thermal damage threshold estimation’ in Supplementary Information for details).
The low mode locking threshold is a clear signature of the high efficiency of our designed plasmonic metasurfaces as SAs offering high contrast and limited insertion losses. However, we note a possible contribution of virtual saturable absorption owing to the nonlinear polarisation evolution in optical fibres, which is known to favour mode locking in fibre laser cavities in the presence of polarisation-dependent losses42. Such a possible interplay will be the subject of subsequent investigation.
-
For the first time, we achieved highly stable soliton mode-locking at different optical wavebands, promoted by plasmonic metasurfaces directly patterned on the fibre facets. Considering the previous work on solid-state SAs, such as semiconductor saturable absorber mirrors43, our metafiber SAs allow for more cost-effective, timesaving, broadband, and tunable nonlinear absorption compatible with all-fibre operation for ultrashort pulse generation and reshaping15,44. In addition, because of the short hot-carrier relaxation dynamics arising from a plasmonic system, the pulse duration from a metafiber laser can easily reach a typical sub-picosecond time scale, in contrast to the situation with common semiconductors having relaxation times of several picoseconds8,45,46. Compared with widely investigated low-dimensional materials, including graphene37, graphene oxide47, carbon nanotubes48, black phosphorus49, transition metal dichalcogenides50-53, topological insulators54,55, and colloidal nanoparticles14,17,18, in addition to fully competitive or superior performance on saturable absorption and laser mode-locking (Fig. 6a), the remarkable properties reported here mainly originate from the plasmonic nature of the metasurfaces themselves. Indeed, the plasmonic modes of metasurfaces, which are highly size-, shape-, and orientation-dependent, are fully guaranteed by highly resolved nanofabrication techniques originating from planar technologies. Therefore, the resonance wavelength and polarimetric properties of metasurfaces can be quantitatively tuned through design. This will allow the metasurfaces to reach an extraordinarily high modulation depth that is still compatible with a relatively low pump threshold for promoting mode-locked regimes. The merits of plasmonic metasurfaces compared to other 2D materials with dispersed sizes and random orientations are illustrated in Fig. 6a. A large modulation depth leads to reliable self-starting owing to the strong pulse shaping performed by SAs56. A low mode-locking threshold is also particularly beneficial to achieve in the second step, harmonic mode-locking, which multiplies the laser output repetition rate52. Considering the pioneering works using plasmonic metasurfaces as SAs in a free-space coupled laser cavity15, our metafiber will allow a straightforward implementation within standard fibre networks, targeting an ultracompact fibre laser and optical pulse reshaper, as well as other ‘all-in-fibre’ optical systems.
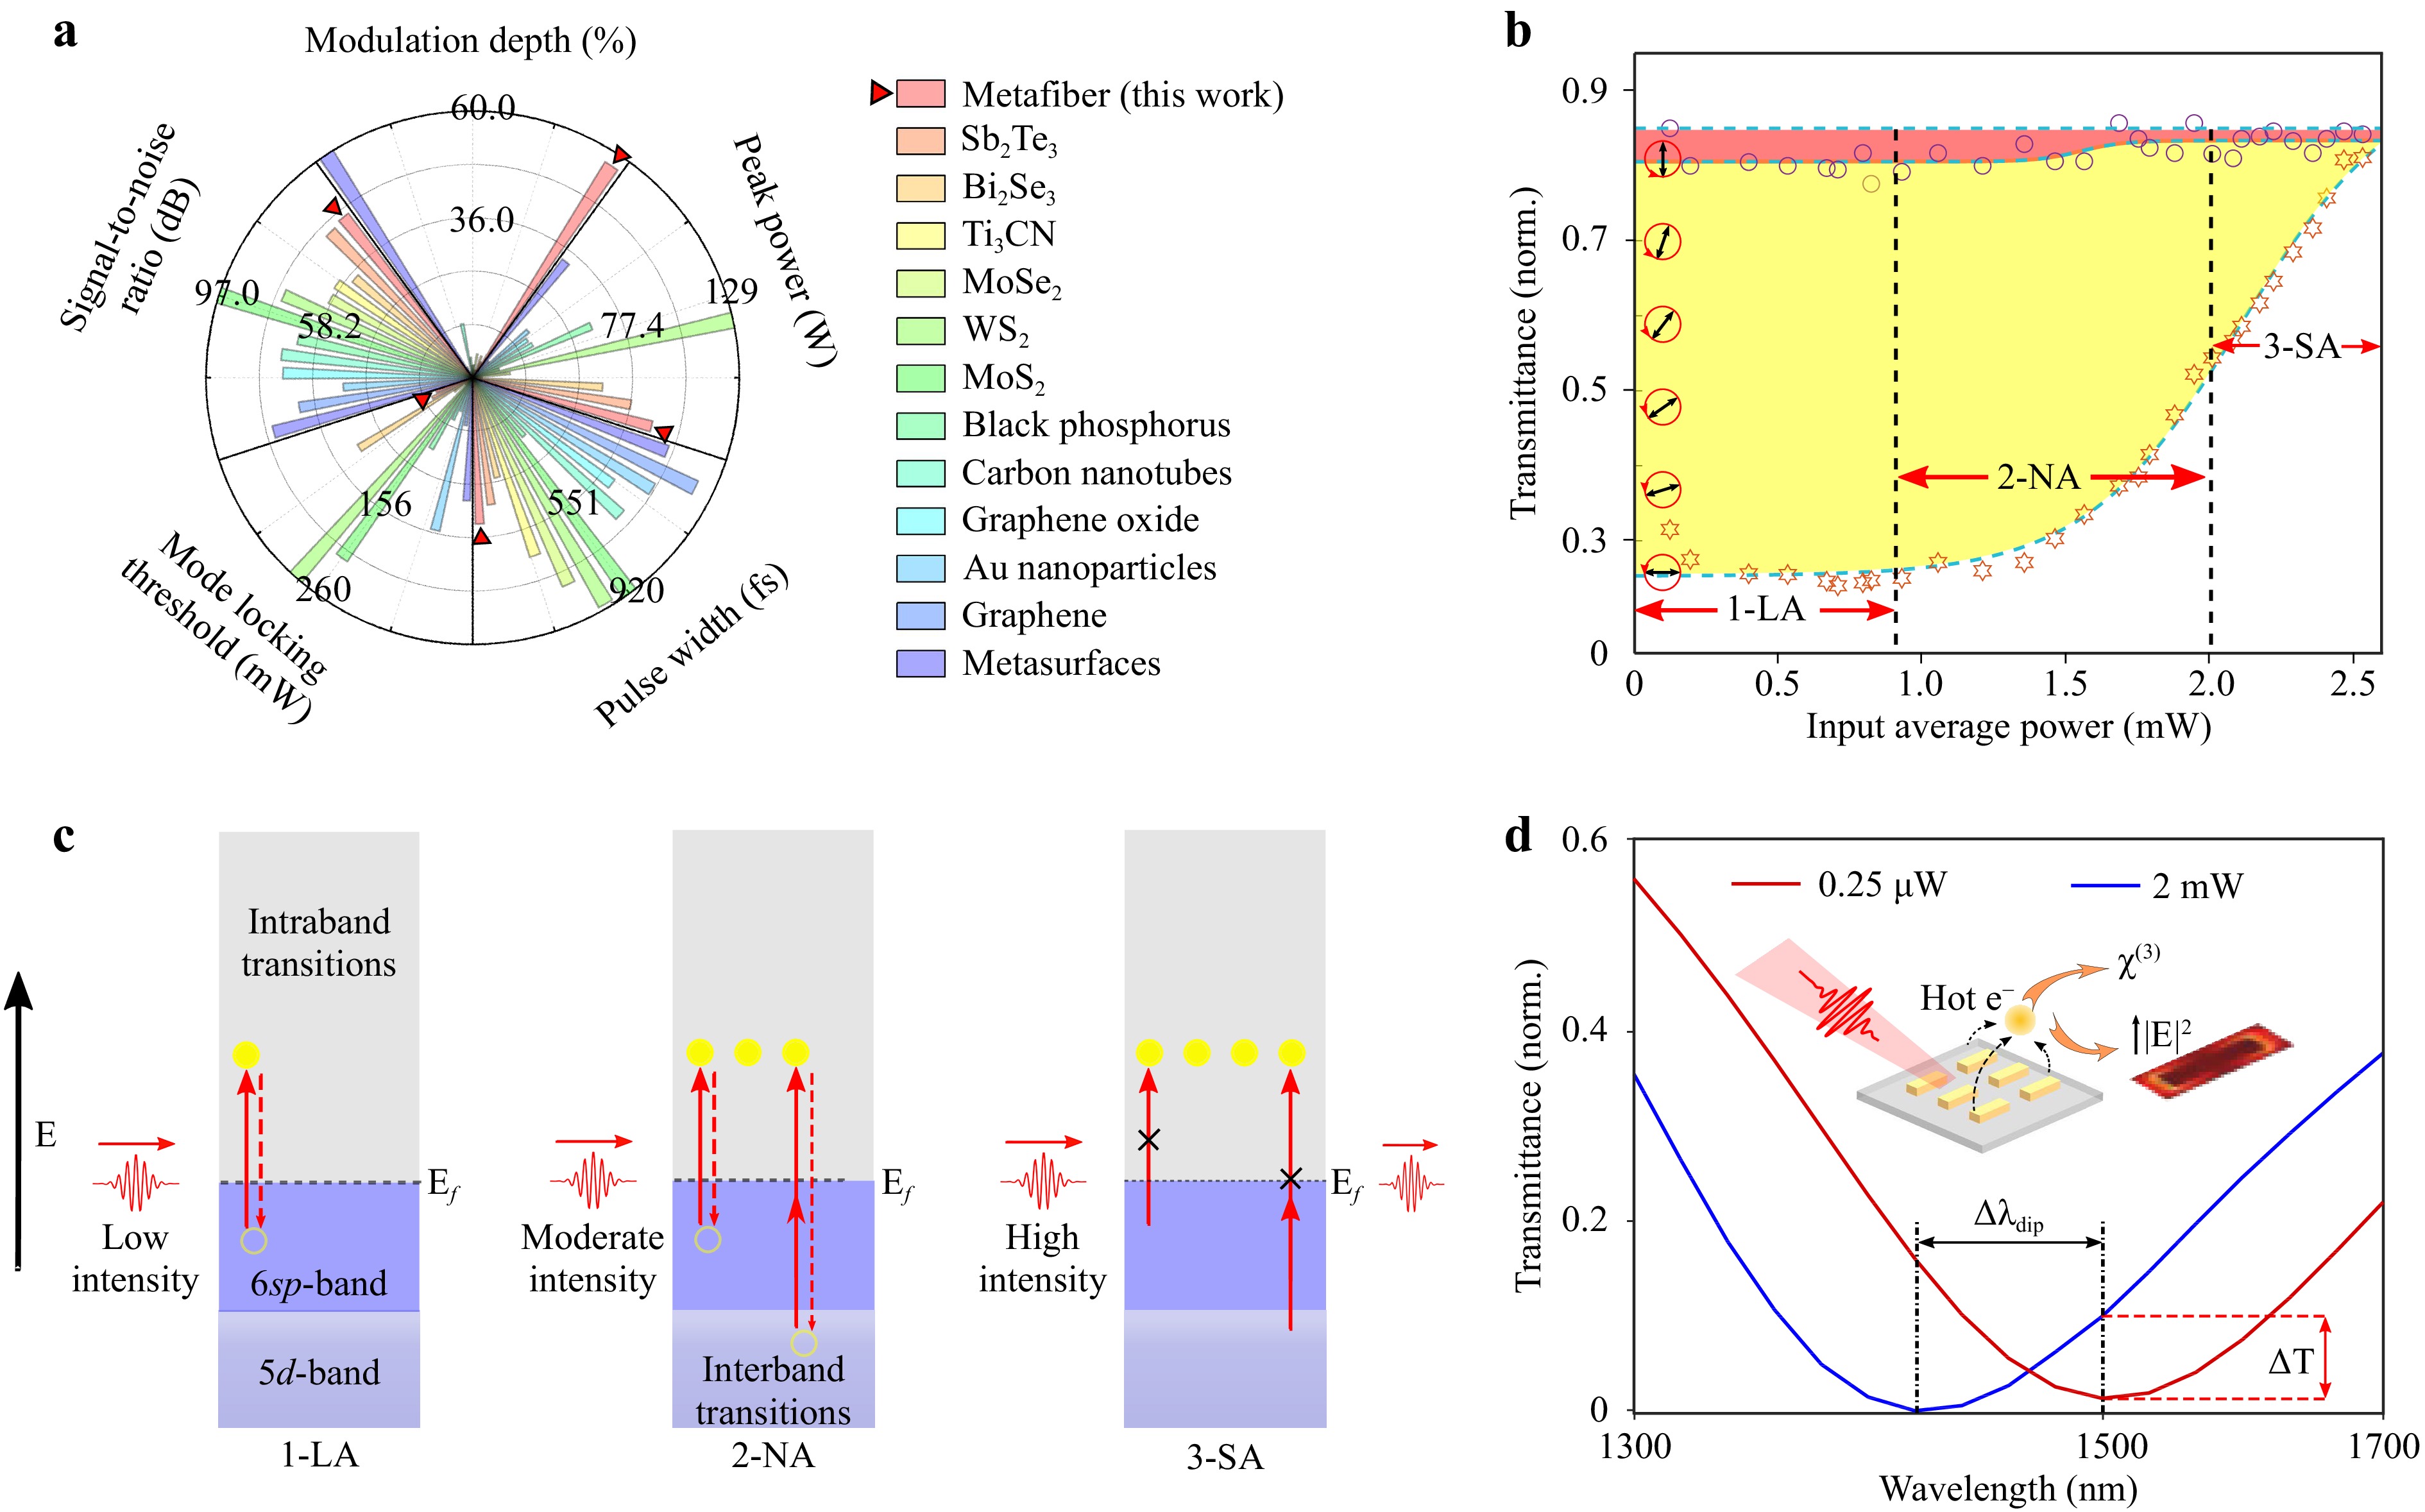
Fig. 6 Laser performance comparisons and saturable absorption mechanisms for the metafiber SAs. a Performance comparisons of soliton mode-locking lasers at 1.5 μm optical waveband using different material SAs. The metafiber SA is highlighted with red triangles. b Power- and polarisation-dependent saturation process of plasmonic metasurfaces. Three stages leading to the saturation absorptions are distinguished in accordance with the pumping laser power: linear absorption (LA), nonlinear absorption (NA), and saturation absorption (SA). Two contributors are involved depending on the excitation polarisation for each stage: bulk material effect (filled with red) and surface plasmon effect (filled with yellow). The opened stars and circles are the raw transmission data from Fig. 2e for the polarisation angles 0° and 90° with respect to the long axis of nanorods, respectively. The dashed cyan lines are the corresponding fitted data. The black arrows indicate the excitation polarisations. c Saturation absorption mechanism from the aspect of the bulk material effect. Carrier transitions occur at given high density-of-states symmetry points of energy bands as the input power increases. The closed yellow circles stand for the electrons and the opened circles are the holes left. The solid and dashed arrows represent the excitation and relaxation processes, respectively. d Saturation absorption mechanism from the aspect of surface plasmon effect. Surface plasmon induced nonlinearity shifts the absorption resonance (
$ \Delta \lambda_{dip} $ ) and modifies the transmission level ($ \Delta T $ ) of a plasmonic SA. The red and blue lines represent the transmission spectra of a nanorod metasurface excited with an averaged input power of 0.25 μW and 2 mW in a fs laser focus, respectively.As material-based SAs have become one of the key elements for a fibre laser architecture to achieve stable passive mode locking, it is worth clarifying the physical mechanisms related to the saturable absorption of plasmonic metasurfaces. Below, we propose several principles from both macroscopic and microscopic points of view to better interpret the physical nature, as the classical absorption and transmission models used in SAs basically treat bulk semiconductor materials. First, it is essential to note the intrinsic differences between the bulk and nanoscale materials. As the size decreases to the nanoscale, the properties of atoms present on the outer boundary of the particles become dominant57. The optical properties change significantly in comparison with those of the bulk owing to their size-dependent interactions with light. This works for in particular plasmonic metasurfaces, which rely on the surface plasmon resonances contributed by collective conduction electron oscillations8. Following this principle, the saturable absorption of plasmonic metasurfaces can generally be divided into two contributors: the bulk material effect and the surface plasmon effect. As illustrated in Fig. 6b, the former (filled with red colour) can be extracted from a special ‘off-resonance excitation’ test, in which the excitation polarisation is perpendicular to the long axis of the nanorods. In such circumstances, the longitudinal dipolar plasmon mode of the metasurfaces, which plays a dominant role in the unusual polarimetric linear and nonlinear optics performance, is almost entirely depressed. As can be observed from Fig. 6b, the transmission remains at a global high level (>80%) and is almost immune to increasing input power. The saturation process induced by bulk metal materials can still be described by the classical energy band theory. The reason stems from the physical fact that there are forbidden bands at some high density-of-states symmetry points for noble metals, e.g., X or L points in the first Brillouin zone of gold58,59, where most of the carrier transitions take place in a light excitation8,60. As shown in Fig. 6b, c, the entire absorption process with increasing pumping power can generally be divided into three stages: linear absorption, nonlinear absorption, and saturable absorption. We note here that the launch of the next step does not simultaneously quit the previous steps. In the linear absorption stage, as depicted in Fig. 6c, the sp electrons below the Fermi level
$ E_f $ are excited to states above$ E_f $ through intraband transitions. The excited electrons relax to the sp bands and recombine with the holes left at a sub-picosecond timescale61,62. In the ultrafast pumping regime, that is, when the pulse duration of the pumping laser is shorter than the relaxation time of hot electrons, the electrons from the d bands can also be excited to the state above$ E_f $ through interband transitions, inducing multiphoton absorption8,59,60, for example, two-photon absorption, as depicted in Fig. 6c. This nonlinear absorption gradually dominates as the pumping intensity increases. When the pumping intensity becomes sufficiently high, the photogenerated carrier population increases significantly and occupies all the states in the conduction bands, which blocks further absorption owing to the Pauli exclusion principle, leading to saturated absorption of plasmonic metasurfaces45,63.Next, we thoroughly discuss the surface plasmon effect, which contributes to the majority of saturable absorption for the plasmonic metasurfaces, as shown in the yellow region in Fig. 6b. Surface plasmons can be interpreted as playing a two-fold role in accordance with the light–matter interaction formula: P(
$ \omega $ ) =$ \varepsilon_0\chi^{(1)}E(\omega) $ +$ \varepsilon_0 (\chi^{(2)} E(\omega)^2+ \chi^{(3)}E(\omega)^3+...) $ , where$ \varepsilon_0 $ is the permittivity of free space, and$ \chi^{(1)} $ ,$ \chi^{(2)} $ , and$ \chi^{(3)} $ are the first three terms of susceptibilities64. As illustrated in the inset of Fig. 6d, the surface plasmons provide a dramatic local field enhancement for the electric field E, especially when their resonances match the fundamental or high-order harmonic excitation frequencies9,65,66. Furthermore, the surface components of nonlinear susceptibilities, for example,$ \chi^{(3)}_{sur f} $ in the process of two-photon absorption, will be significantly altered owing to the hot carrier redistributions during strong light–matter interactions35,45,46,67. Given the above two contributions, an extra hot carrier (mainly from electrons)-induced nonlinearity is produced and shifts the absorption resonances67. As shown in Fig. 6d, considering an increase in input power from 0.25 μW to 2 mW, the plasmonic resonance initially designed at 1550 nm was shifted to 1457 nm and the transmission level showed an increase of 8.5% (see ‘Optical nonlinearity induced plasmonic resonance shift’ in Supplementary Information for details). Thus, the strong dependencies on the pumping laser power and polarisation for the transient transmission of plasmonic metasurfaces are another key origin of the saturated absorption.In conclusion, we report on a nanomanufacturing method to integrate plasmonic metasurfaces directly on the fibre endfaces of commercial SMFs and a first demonstration of their applications in nonlinear plasmonics regime. In contrast to the metasurfaces solely on bare fibres that most of the current studies consider, our approach treats SMFs or more general multi-mode fibres with universal adapting interfaces, yielding advantages of compatibility with fibre networks and robustness against external influences such as bending and mechanical vibrations. In addition, because only standard nanofabrication techniques are involved, the process flow can be accessed by worldwide cleanrooms. By featuring various plug-and-play connections, low insertion loss, and cost-effective nanofabrication, metafibers with functionalised plasmonic properties could potentially become a new regular fibre component in the fibre optics community. To demonstrate a practical application, the metafibers were implemented in multiple fibre laser cavities, acting as special SAs to assist lasers in mode lock. The results show that the metafiber SAs have unique features, including broad absorption spectra, tunable plasmonic resonances, high modulation depth, and ultrafast recovery time, which are competitive with the best performance of state-of-the-art 2D materials. All-fibre sub-picosecond mode-locked laser pulses were generated in 1.5 μm and 2 μm regions. The application of such SAs can be immediately extended to other optical wavebands by tuning the plasmonic resonances of metafibers. As such, saturable plasmonic metafibers provide ultrathin SAs for applications where tunable nonlinear transfer functions are needed, such as in ultrafast lasers, pulse shaping, and regeneration, and have become key enablers for compact and efficient optical frequency combs or neuromorphic circuits. The work enriches the ‘lab-on-fibre’ paradigm and offers an avenue to realise the ‘all-in-fibre’ optical systems.
-
Method All of the details about the nanofabrication, extinction simulations, linear and nonlinear optical characterisations, saturation absorption model, soliton mode locking at 2 μm, damage threshold test on the plasmonic metafibers, and optical nonlinearity induced plasmonic resonance shift are provided in Supplementary Information.
-
The authors gratefully acknowledge funds from the National Natural Science Foundation of China (61927820, 51806199, 61905200), the National Key Research and Development Program of China (2017YFA0205700) and Natural Science Fundation of Zhejiang Province (LR21E020005). J. Wang thanks Dr. Ziyang Zhang from the School of Engineering, Westlake University, for the technical support with the fibre setups. J. Wang, L. Zhang, B. Chen, and Q. Jia thank the Westlake Center for Micro/Nano Fabrication for facility support and technical assistance.
‘Plug-and-play’ plasmonic metafibers for ultrafast fibre lasers
- Light: Advanced Manufacturing 3, Article number: (2022)
- Received: 25 March 2022
- Revised: 11 May 2022
- Accepted: 23 May 2022 Published online: 02 September 2022
doi: https://doi.org/10.37188/lam.2022.045
Abstract: Metafibers expand the functionalities of conventional optical fibres to unprecedented nanoscale light manipulations by integrating metasurfaces on the fibre tips, becoming an emerging light-coupling platform for both the nanoscience and fibre optics communities. Current metafibers remain proof-of-concept demonstrations that mostly explore isolated bare fibres owing to the lack of standard interfaces with universal fibre networks. Here, we develop methodologies for fabricating well-defined plasmonic metasurfaces directly on the end facets of commercial single -mode fibre jumpers using standard planar technologies and provide the first demonstration of their practical applications in the nonlinear plasmonic regime. Featuring plug-and-play connections with fibre circuitry and arbitrary metasurface landscapes, the metafibers with tunable plasmonic resonances are implemented into fibre laser cavities, yielding all-fibre sub-picosecond (minimum 513 fs) soliton mode locked lasers at optical wavelengths of 1.5 μm and 2 μm, demonstrating their unusual polarimetric nonlinear transfer functions and superior saturation absorption responses. The nanofabrication process flow is compatible with existing cleanroom technologies, offering metafibers an avenue to become a regular member of functionalised fibre components. This work paves the way toward the next generation of ultrafast lasers, optical frequency combs, and ultracompact ‘all-in-fibre’ optical systems.
Research Summary
Metafiber lasers: functionalise the fibre tips with nonlinear plasmonics properties
Metafibers integrating metasurfaces on the fibre tips largely expand the functionalities of conventional optical fibres to unprecedented nanoscale light manipulations. Current studies on the metafibers remain almost at the linear optics regime and only the investigations on the bare fibres are demonstrated. The researchers from Westlake University and their colleagues now report the methodologies to integrate well-defined plasmonic metasurfaces directly on the endfaces of commercially available single-mode fiber jumpers. By demonstrating their extreme low insertion losses, they implemented the functionalised metafibers into the fiber laser cavities and finally achieved femtosecond soliton pulses operating in the nonlinear plasmonic regime.
Rights and permissions
Open Access This article is licensed under a Creative Commons Attribution 4.0 International License, which permits use, sharing, adaptation, distribution and reproduction in any medium or format, as long as you give appropriate credit to the original author(s) and the source, provide a link to the Creative Commons license, and indicate if changes were made. The images or other third party material in this article are included in the article′s Creative Commons license, unless indicated otherwise in a credit line to the material. If material is not included in the article′s Creative Commons license and your intended use is not permitted by statutory regulation or exceeds the permitted use, you will need to obtain permission directly from the copyright holder. To view a copy of this license, visit http://creativecommons.org/licenses/by/4.0/.





 DownLoad: