


-
Multiple myeloma (MM) is a haematological malignancy during abnormal plasma cell proliferation in the bone marrow. The average prevalence of MM among all cancer types is approximately 1.8%1. In 2020, an estimated 176,404 people were affected by MM, with an estimated 117,077 people dying from it worldwide2. Since 2000, there has been an increasing trend in the number of patients with multiple myeloma (MM) surviving five years or more after diagnosis3. This trend is facilitated by developing new treatment protocols and methods that depend on early detection. Five-year survival rates for localised myeloma (stage I MM) is approximately 80%, compared with 58% in patients with the latest stage of MM1. Therefore, the development of accurate and rapid diagnostic techniques for MM significantly impacts patient survival, potentially extending patient life expectancy by several months to two to three years3.
Given the variety of clinical manifestations of MM, there are several diagnostic criteria requiring a set of diagnostic procedures. These diagnostics include blood and urine tests measuring the amount of protein and cell content, biopsy of bone marrow, and radiography of the skeleton bones4. However, these methods are time-consuming. Some new, efficient, and rapid methods of accurately diagnosing and monitoring MM are a coveted medical task, as timely detection and prompt treatment could increase overall survival.
New optical diagnostic methods are promising tools for rapid and accurate label-free analyses. Raman spectroscopy is one key method based on the interaction of photons and the molecular components of the studied sample5,6. The Raman spectrum of a biological sample is a superposition of inelastic signals scattered by the vibrational modes of specific chemical groups after the interaction with excitation photons. Therefore, the Raman spectrum contains a set of peaks whose intensities and localisations depend on the chemical composition. However, in practice, biological samples are complex multicomponent media, and a small scattering cross-section of an individual component leads to a weak Raman signal, limiting its molecular detection. Surface-enhanced Raman spectroscopy (SERS), which is based on amplifying the scattering signal by frequency modulation of the excitation laser radiation and the localised surface plasmon resonance of a metallic nanomaterial, can solve the problem of weak signals. The SERS approach enhances the Raman signal of analytes thousands of times, increasing the sensitivity of the Raman method. Therefore, SERS is a powerful method for detecting biochemical changes during abnormal processes in biological samples because of its speed, non-destructiveness, and high sensitivity to low amounts of analytes7−9.
The SERS technique is widely used for different biomedical tasks, particularly for diagnosing diseases from cancers10−12 to neurogenerative disorders10,13−18 by analysing biological samples such as blood serum, plasma, urine, saliva, etc. By combining the SERS approach with the machine and deep learning methods, successful results were achieved, helping interpret complex spectral data for biological sample analysis and disease detection19−21. Machine learning and artificial intelligence can be used to build statistical models between Raman data matrices and the composition profiles of biological samples and extract informative spectral features. Statistical models were trained and tested to identify and classify biological samples based on their Raman spectra. Yang et al.22 recently demonstrated that the SERS technology combined with a deep learning algorithm has greater developmental prospects for analysing blood samples during early identification and screening of immune diseases and chronic kidney disease, with accuracy rates of 94.7% and 92.0%, respectively. Gao et al.23 have achieved good diagnostic results with an overall screening accuracy of over 93% for cervical and breast cancer through urine SERS analysis with a multivariate statistical algorithm. Al-Sammarraie et al.24 have demonstrated that the SERS technique has a significant potential for clinical detection of cardiovascular diseases with 99% accuracy utilising plasma SERS features. The combination of Raman-based techniques, particularly SERS, with the machine and deep learning methods has demonstrated the potential to improve the accuracy of spectral data analysis for medical diagnostics. According to the statistics from the World Health Organization, as of 2021, approximately 4.5 billion people were not fully covered by essential health services. Approximately two billion people face financial hardships, including one billion with catastrophically high out-of-pocket health care costs. Therefore, developing low-cost analysis and diagnostic tools that provide sufficient diagnostic accuracy is urgently required.
Given these advantages, developing new SERS-based approaches for MM detection is highly attractive. Although there have been some preliminary studies on using SERS combined with machine and deep learning methods for diagnosing MM25,26, it is necessary to continue research with a larger number of experimental groups to confirm the potential of this liquid biopsy technique and obtain reliable results. MM is a rare condition, with an average age of patients being over 60 years. Therefore, obtaining a representative sample of a large volume is difficult. For example, Russo et al.27 describe the SERS stratification of multiple myeloma based on exosome profiling, including 18 samples with MM. Another research group, Chen et al., presented a SERS study of blood plasma based on a sample of 16 patients with MM25. The study of Liang et al. included a serum SERS study with immunoglobulin class discrimination based on 35 patients with MM28. Most previously published studies on SERS research on MM were conducted on limited samples. Therefore, some new insights confirming or refuting the capabilities of SERS analysis for the diagnostic task under consideration are valuable. In this study, the target sample with MM (31 patients) and the control sample (102 patients) were balanced by age.
In this study, we demonstrated the application of an affordable SERS technique for diagnosing MM via label-free analysis of human serum samples. The schematic of the proposed approach is illustrated in Fig. 1.
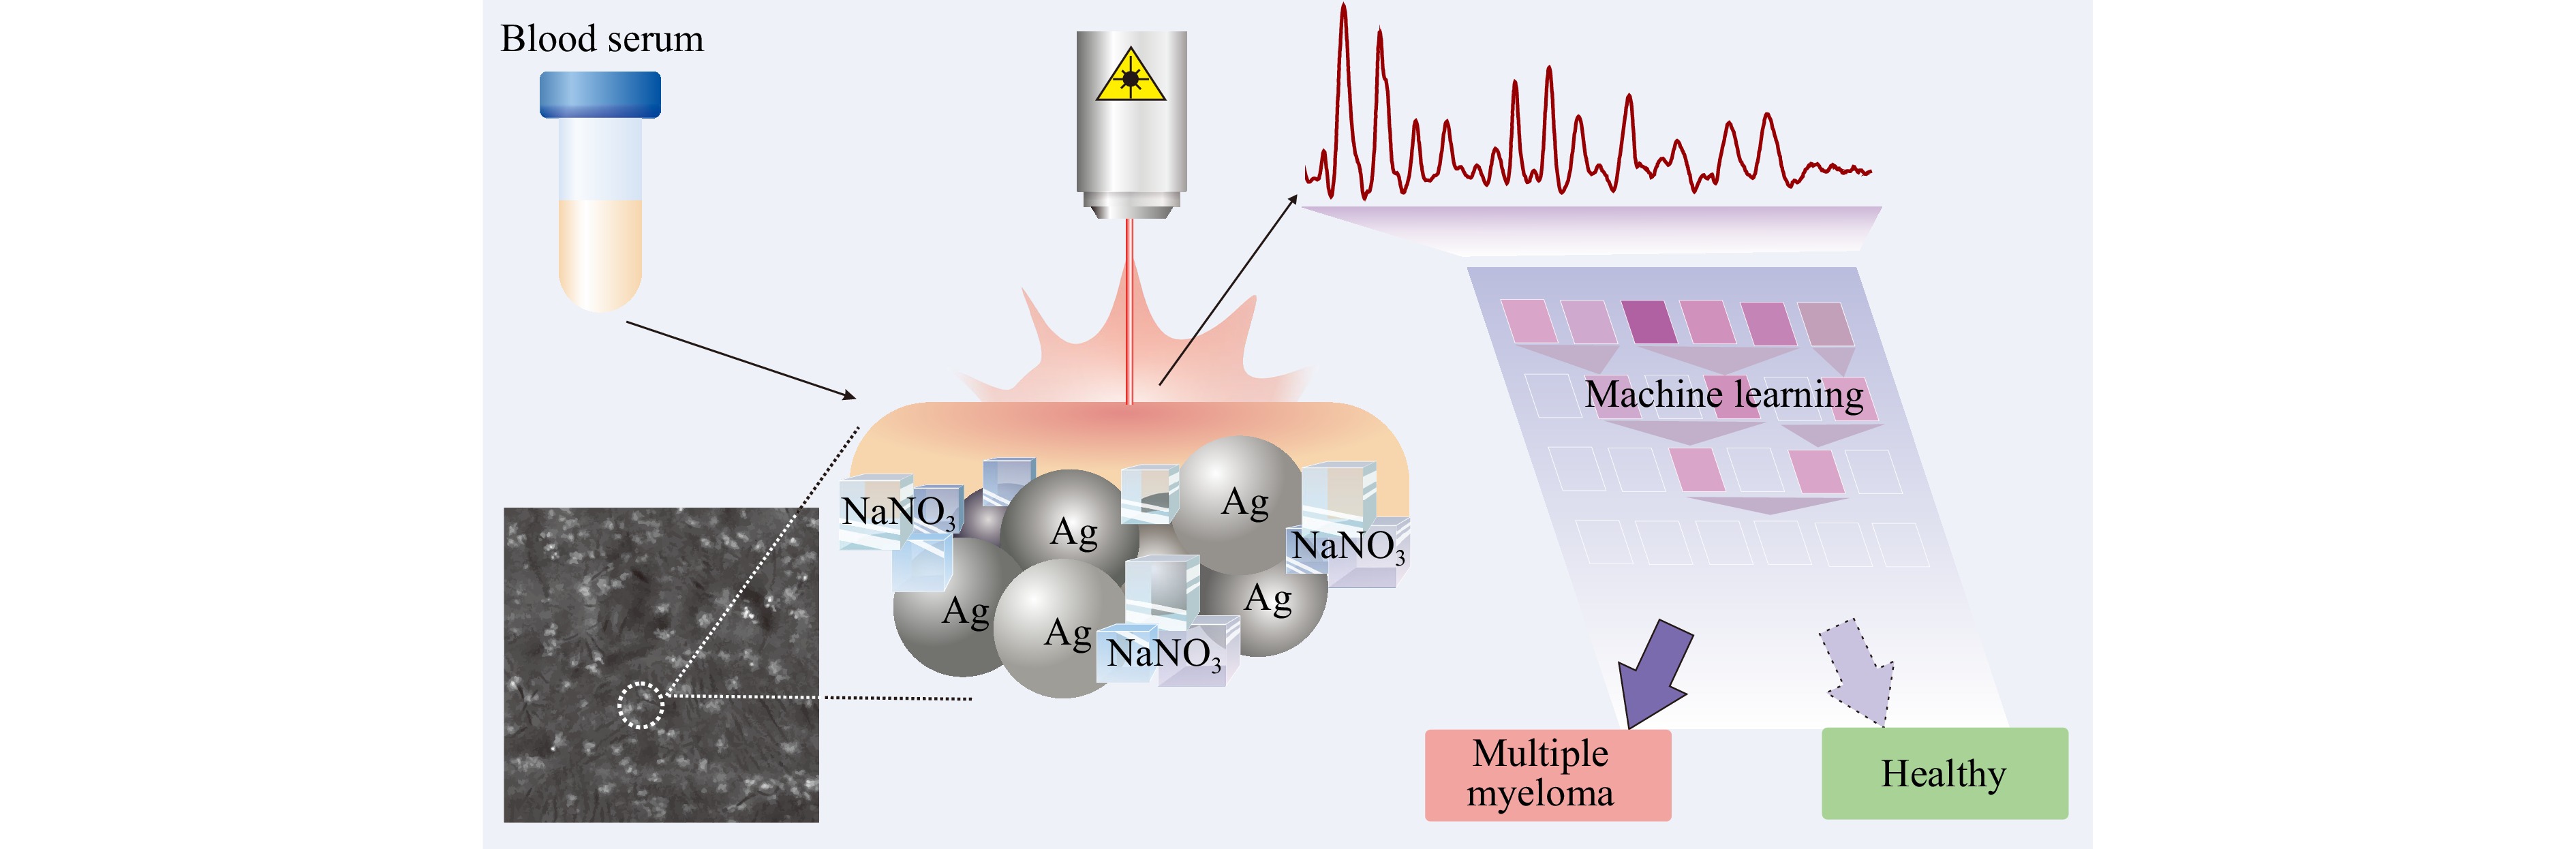
Fig. 1 Concept of SERS-based technique for MM diagnosis in blood serum analysis.
The proposed approach is based on a combination of SERS and an advanced statistical analysis, partial least-squares discriminant analysis (PLS-DA), to detect patients affected by MM among a control group of subjects of a comparable age without MM. We analysed a diverse control group to assess the application of SERS as a diagnostic and monitoring tool. Finally, the proposed algorithm could predict the clinical status of patients using their SERS spectral profiles.
-
For surface enhancement of the Raman signal of serum, a silver substrate based on a dried silver colloid was used because of the low reactivity of silver and ease of substrate preparation. An absorption maximum characterised the resulting absorption spectrum of the solution at 410 nm with a full width at half maximum of 40 nm. Based on experimental studies on the relationship between the absorption spectrum and geometric characteristics of silver nanoparticles29–31, the prepared silver colloidal solution was characterised by spherical nanoparticles with a 30-40 nm diameter. After drying the colloidal solution, a substrate of agglomerates of spherical silver particles with a size of approximately 200 nm and a capillary effect in sodium nitrate crystals with a volume concentration of 0.02% was formed. The substrate was characterised by its stability and a serum Raman signal amplification factor of 4 × 10⁵ 32.
The spectral characteristics were obtained for the group of patients with MM, in contrast to the control group. The mean spectra of the study groups with standard deviations are shown in Fig. 2. Fig. 2 also shows a partial overlap of the spectral characteristics of the MM patient and control groups, with the largest differences in the intensity of the 723 cm−1 band (C-H bending in hypoxanthine33,34), 949 cm−1 band, and 1052 cm−1 band. Notably, the difference in the positions of the maximum peaks corresponding to phenylalanine35-38: for the control group, it is 1024 cm−1, while for the target group, it is 998 cm−1.

Fig. 2 Average spectra with the standard deviation for the MM group (red) and control group (green) and the difference between the average spectra of the analysed groups (blue line).
The spectral database was subjected to multivariate analysis to identify statistically significant spectral differences in the sera of patients with MM and to analyse group discrimination under conditions of multicollinearity. Much attention has been paid to model overtraining control because of the different sizes of the studied patient samples. To this end, 25 iterations (five iterations of forming equal-volume samples × five iterations of dividing them into training and test sets) of dividing the spectral base into training and test subsamples were performed with the subsequent construction of a PLS-DA model. Fig. 3 shows the choice of the model parameters using an example of one of the 25 iterations. The sample size of patients with MM limited the maximum number of load vectors to four. Moreover, as shown in Fig. 3a, b, the main explained variance was provided by the first three load vectors, whereas the local minimum of the mean-square error of the model during cross-validation was achieved on the 4th load vector. Therefore, four load vectors whose shapes are presented in Fig. 3c were selected to build a PLS-DA model by repeating the partitioning of the analysed spectral base. Fig. 3d, e shows the discrimination performance of the MM patients and control patients for the training set (d) and testing set (e).
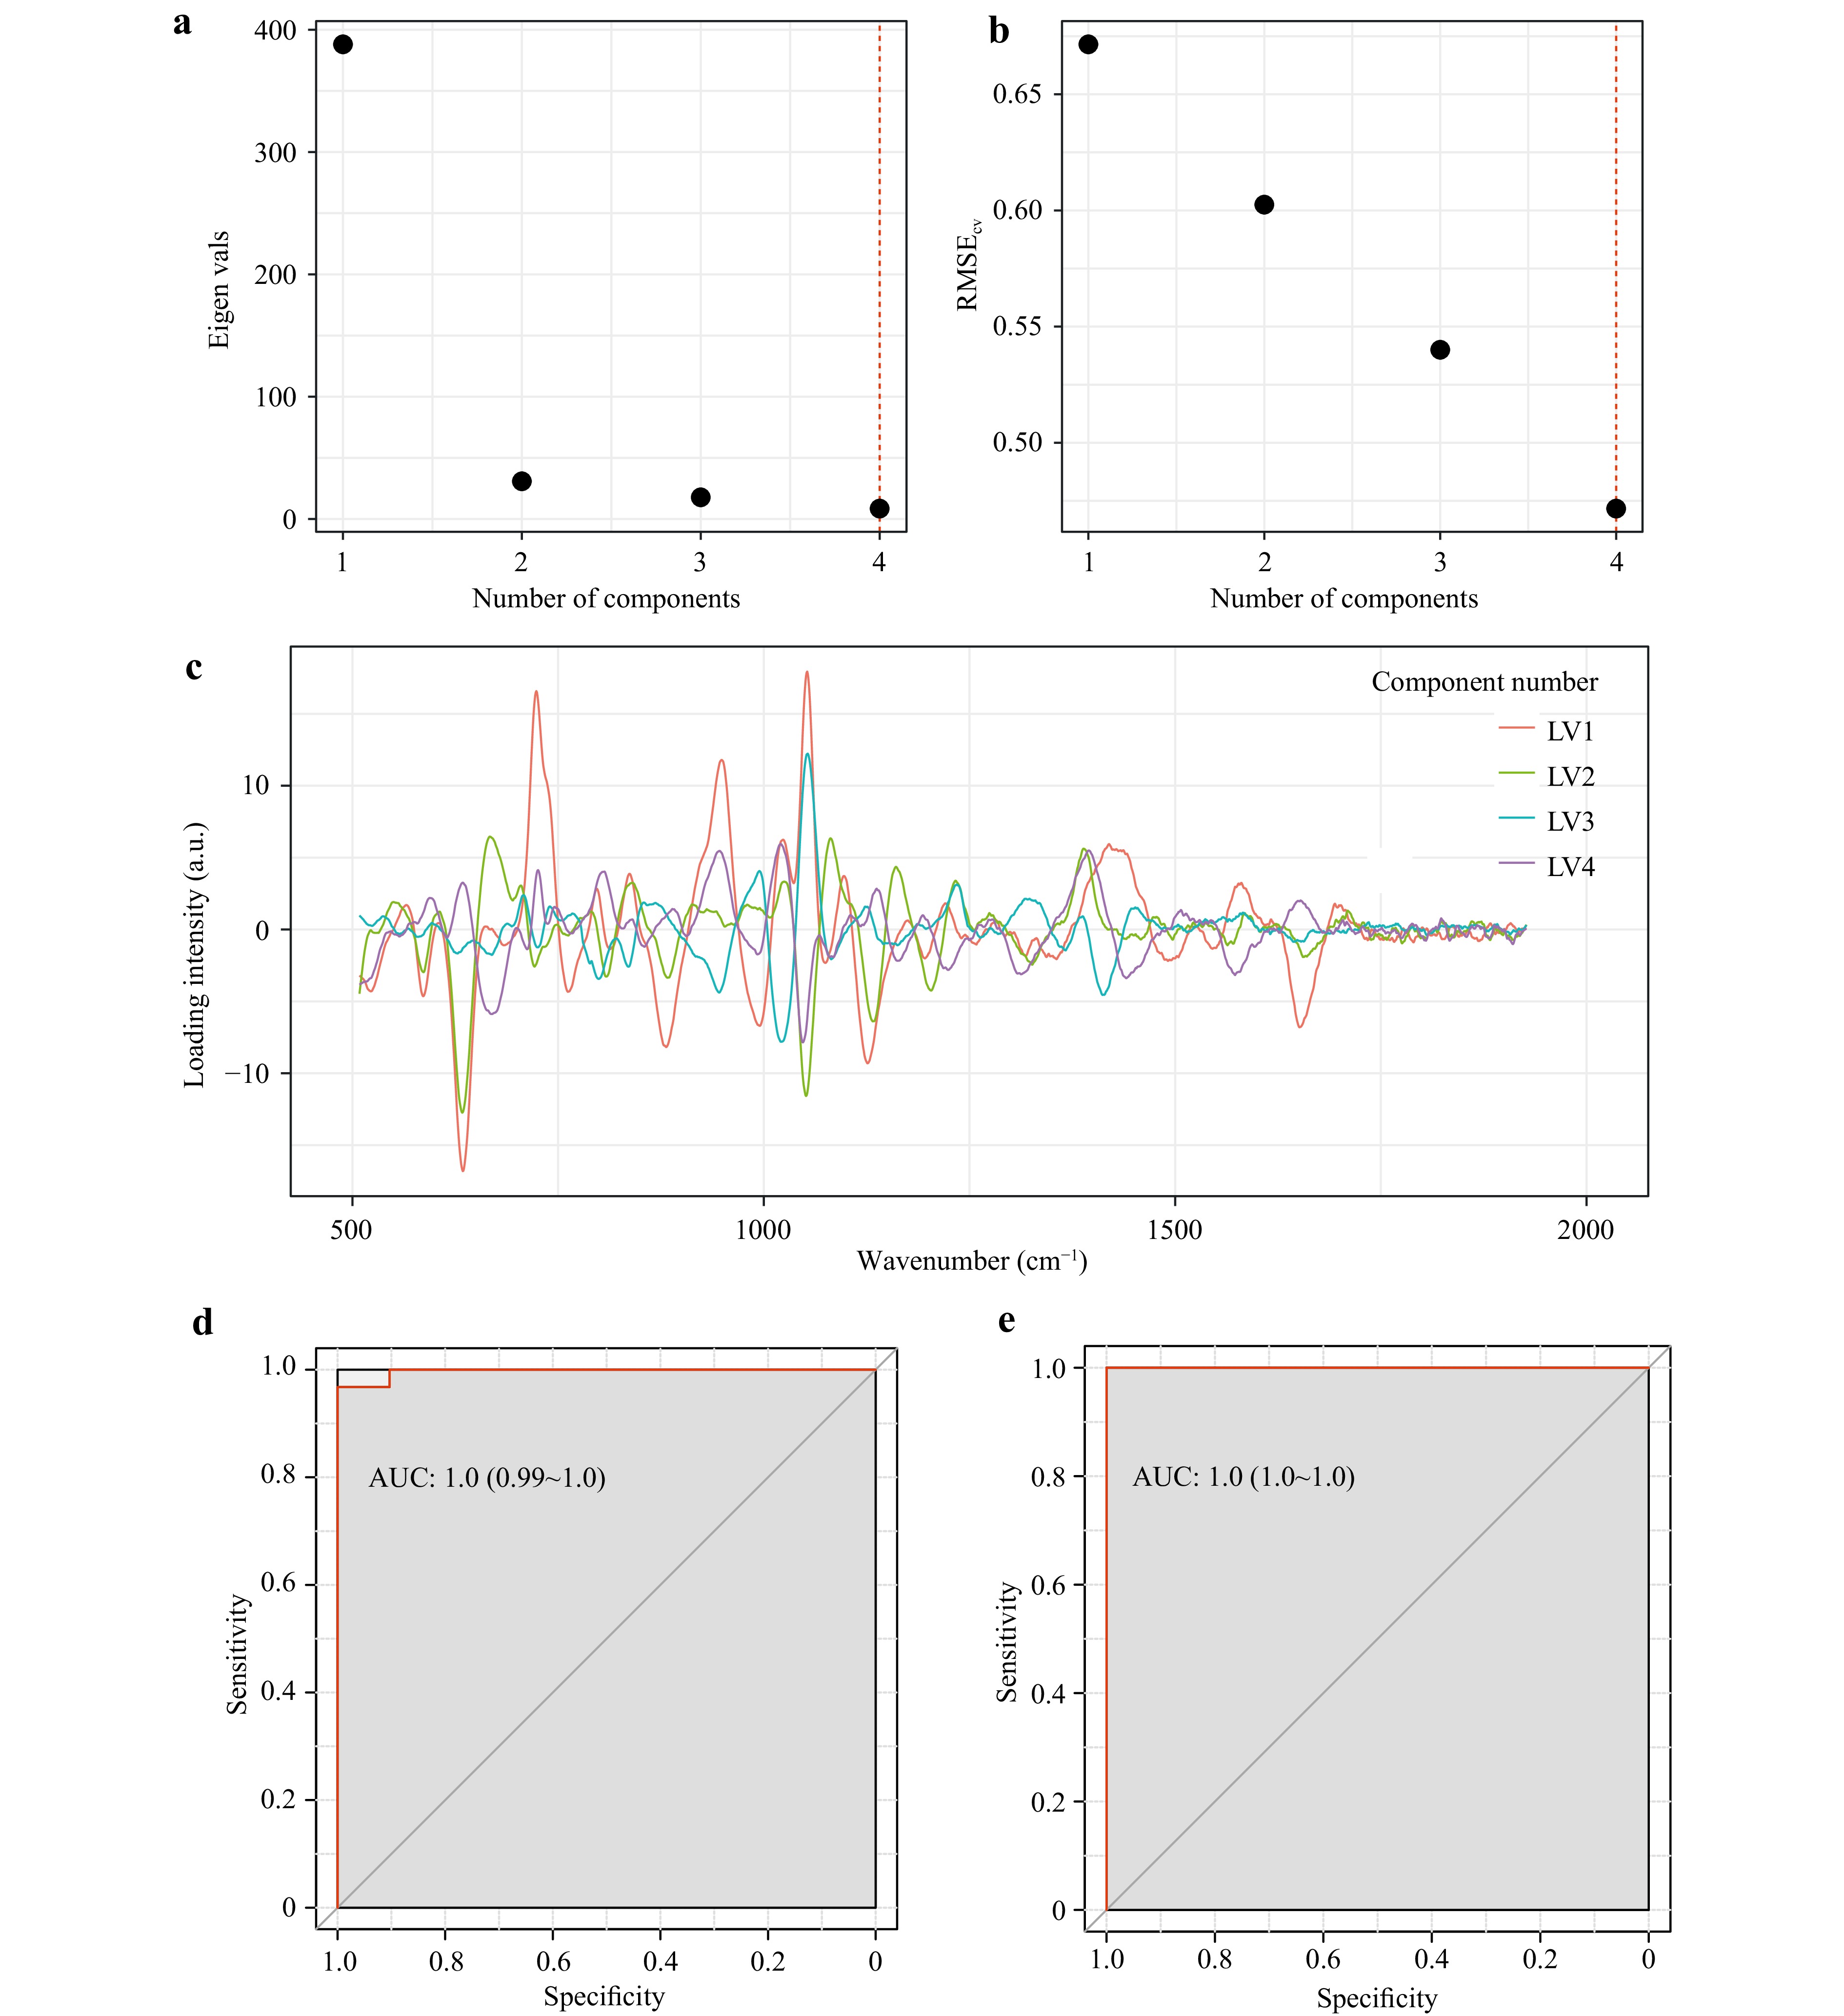
Fig. 3 Parameters and characteristics of the discrimination model for the patients with MM and patients in the control group using one iteration of dividing the base into the training and the test sets. a eigenvalues of loading vectors; b relationship between the root mean square error of the model during cross-validation and the number of loading vectors; с loading vectors selected for constructing the model; d characteristics of the constructed discrimination for the training set; e discrimination characteristics for the test set.
Fig. 3 shows the constructed model can distinguish the groups with ROC AUC at a level of 0.99 without overfitting. 25 iterations of the training and test PLSDA models were performed. Table 1 presents the average discrimination characteristics of the patients with MM and those in the control group for 25 iterations.
Subsample Specificity, mean (min–max) Sensitivity, mean (min–max) Accuracy, mean (min–max) Training set 1.0 (1.0 – 1.0) 0.98 (0.92 – 1.0) 0.99 (0.96 – 1.0) Test set 0.97 (0.83 – 1.0) 0.95 (0.83 – 1.0) 0.96 (0.83 – 1.0) Table 1. Characteristics of PLS-DA discrimination of MM patients and control patients across 25 iterations.
The results demonstrate that combining the SERS technique with multivariate analysis for serum testing provides a “good” classification of the MM patients and the controls, with an average accuracy of over 96%. Even though the test set included six control patients versus six MM patients, multivariate analysis of serum spectral data demonstrated a high average sensitivity of 95%. Therefore, this comprehensive approach provides robust identification of true-positive MM patients. The PLS-DA discrimination performance of the spectral data from the serum of aged MM patients and aged heart patients in the present study was comparable to the results of Chen et al.26 The authors demonstrated a 78.4% accuracy in identifying patients with MM using a similar technique for recording the spectral characteristics of serum. An important feature of the work presented by Chen et al. was the MM patients with MM and healthy controls. However, it should be noted that in the work presented by Chen et al.26, there was no information on the age characteristics of the analysed samples or the consistency of the average age of the healthy group and the group of patients with MM. Therefore, the present work demonstrates the repeatability of the combination of serum SERS analysis with a multivariate approach for possible MM diagnosis and the possibility of its detection in older patients with heart disease.
The proposed tool ensures the successful detection of MM patients and makes it possible to analyse pathologically associated metabolic changes in conditions of multicollinearity and polycomponent entities. Fig. 4 presents the distribution of the importance of the spectral bands (FI) for identifying patients with MM when examining blood serum using the proposed tool. For convenience, Fig. 4 shows a representative spectrum of serum from a patient with MM with a superimposed FI band importance distribution. The distribution of the importance of variables is represented by a gradient fill, where the purple colour corresponds to the minimum information content and the yellow colour corresponds to the maximum information content (the scale is shown in the figure).
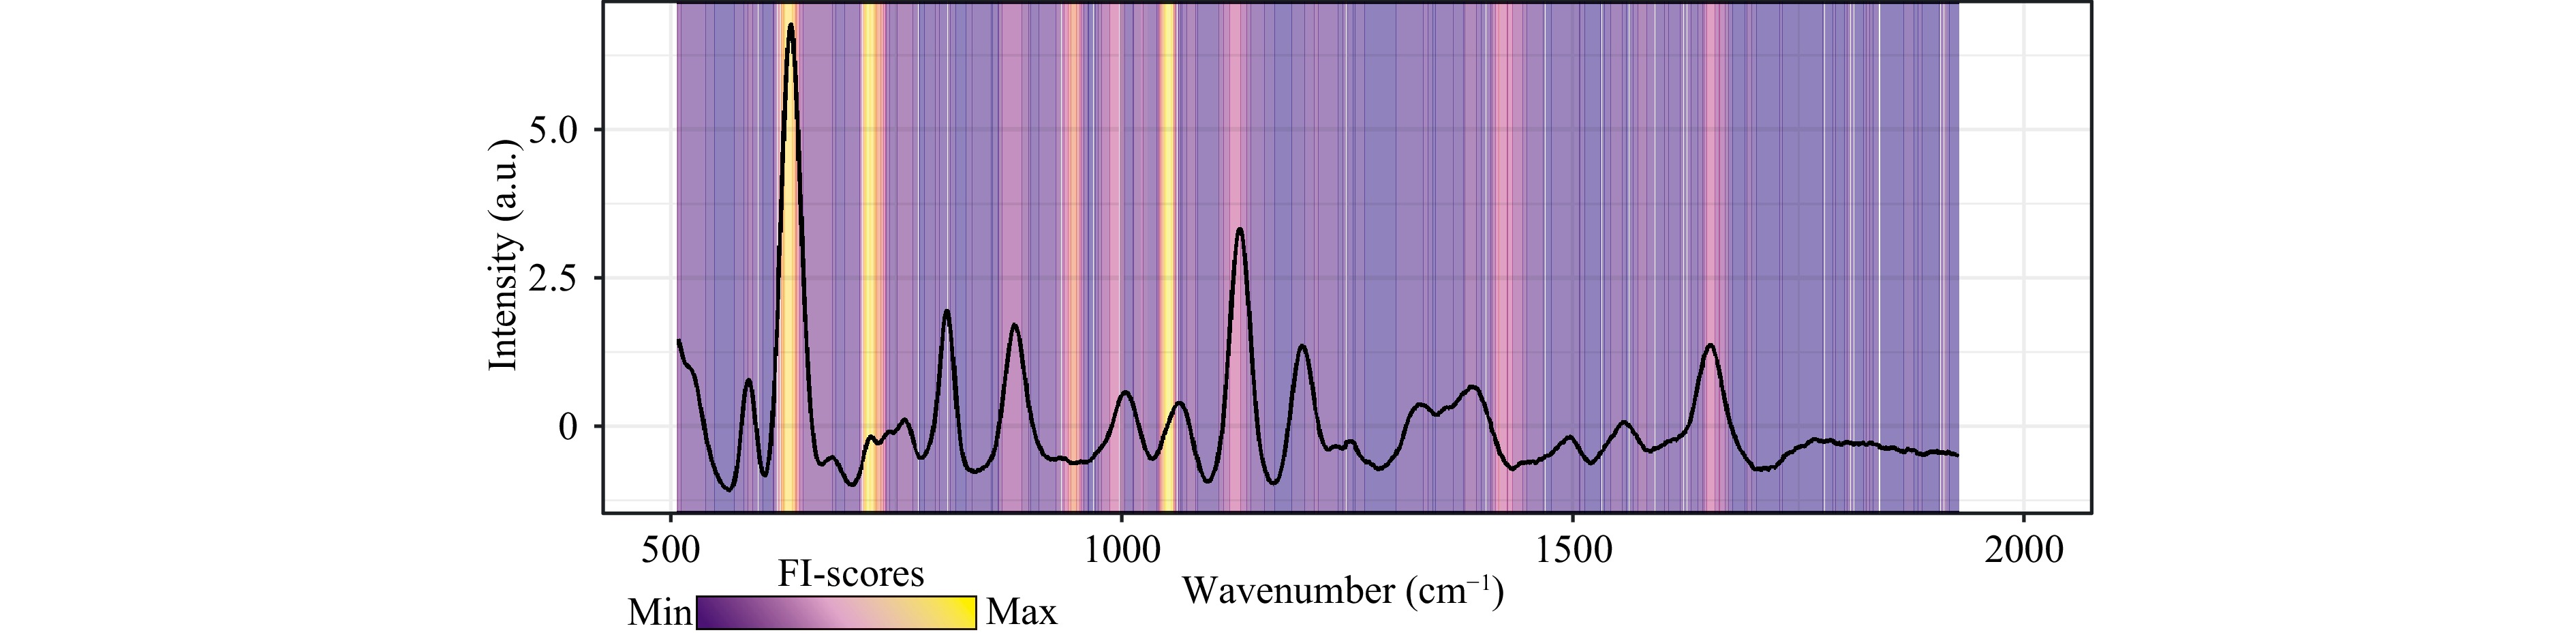
Fig. 4 Distribution of importance of serum spectral bands for identifying MM patients when testing serum using the proposed tool.
Fig. 4 demonstrates that the most statistically significant spectral bands for identifying patients with MM are 635 cm−1, 723 cm−1, and 1052 cm−1. Notably, the assignment of spectral bands in the serum spectrum to specific substances is relatively complex due to a possible spectral contribution of several substances to one particular band. The spectral contribution to a particular band may be due to, but not limited to, a particular substance. The band at 638 cm−1 was assigned to uric acid based on the SERS signals of the corresponding metabolite, according to previous publications33,35,39. Another intensive peak at 724 cm−1 could be assigned to hypoxanthine33–35,39. The peak at approximately 1070 cm−1 can also be tentatively assigned with uric acid because this band occurs in the SERS spectrum of pure uric acid33. Buhas et al.40 provide results on the correlation (R2 = 0.8) between the uric acid peaks at 640 cm−1 and 1070 cm−1 in the serum SERS signal, which can also indicate a partial contribution of uric acid to the peak at 1070 cm−1. The peak at 1052 cm−1 was not assigned due to a lack of experimental evidence supporting the attribution of the 1052 cm−1 SERS band observed in the Raman spectra of pure biological metabolites40.
MM progression in the human body causes a change in protein composition due to impaired haematopoietic function and increased creatinine and urea content due to decreased kidney clearance. Comparison of the obtained results with the results of earlier work by our research team41 and the work of other authors42,43 investigating spectral characteristics of serum from patients with impaired kidney function demonstrated coincidence of the most informative identified bands with a maximum at 635 cm–1 and 723 cm–1. Simultaneously, the previously constructed regression of the spectral characteristics of serum and the levels of creatinine and urea41 demonstrates a significant correlation between these two main markers of decreased kidney clearance in the bands at 635 cm–1 and 723 cm–1. MM is one of the worst cancers in terms of delayed diagnosis, causing severe morbidity and early mortality. The absence of obvious clinical symptoms until damage to the end organs becomes severe makes MM diagnosis difficult, which leads to the delayed detection of MM44,45. The symptom profile of MM at an early stage has very low specificity, and in primary care, MM is quite rare. However, initiating the journey to diagnosis requires consideration of MM and sending blood for testing for monoclonal immunoglobulins. Laboratory tests reliably detect monoclonal immunoglobulins present in 99% of MM cases46. Thus, the next stage of the study will involve an analysis of the sensitivity of the proposed tool to determine the concentration of monoclonal immunoglobulins by performing a comprehensive study of metabolic changes in serum associated with MM41,47.
A simple implementation characterises the proposed tool compared with a large variety of other configurations of SERS technology for analysing multicomponent biological media. For example, several studies have proposed using hybrid particles, such as those based on gold and carbon48, Au-Ag alloy on silica49, using a combination of copper and gold50. Additionally, the shape of the particles used varies from nanowires51 to stars52 and pyramids53. Notably, there is a gap between the assessment of SERS substrate characteristics in the model environment and real practical applications in clinical problems because of the large number of influencing factors and the complex composition of biological media. Due to the complexity of multicomponent media analysis, SERS technology is often combined with extraction methods to isolate target analytes and their compounds for subsequent analysis54. Alternatively, SERS can be preceded by the preliminary removal of components whose spectral contributions may overlap with the spectral bands of the target substance. For example, Wang et al.55 describe the pre-precipitation and removal of proteins in serum for the subsequent SERS monitoring of drugs in serum. Such preliminary sample preparation can increase the information content of the SERS instrument depending on the task to solve, but at the same time, it complicates analysis. Thus, the empirical selection of the SERS configuration, depending on the conditions of excitation and recording spectral characteristics, the characteristics of the analysed medium, and the problem being solved, should ensure a balance between the acceptable complexity of the implementation and the necessary accuracy of the analysis.
Thus, the proposed tool and technique have demonstrated their potential for diagnosing MM with high accuracy, followed by analysing serum biochemical changes. The proposed approach can be widely applied in medical physics, materials science, the creation of intelligent sensors for recording Raman scattering, and analytical instruments based on them. In addition, owing to the ease of sample preparation and low cost, the proposed SERS-based tool can be easily integrated into clinical practice, expanding its diagnostic capabilities when expensive equipment is unavailable.
Thus, we introduced a SERS-based serum-testing tool to diagnose multiple myeloma in this study. The proposed technique is based on excitation at a wavelength of 785 nm and recording spectral characteristics of serum previously dehydrogenated on the surface of a substrate of agglomerates of spherical silver particles measuring approximately 200 nm with sodium nitrate at a 0.02% volume concentration. Combining the SERS technique with multivariate analysis for serum testing has provided a “good” classification of the MM and control patients with an average accuracy of over 96%. Analysis of the biochemical interpretation of the classification of the recorded spectra identified the bands 635 cm–1, 723 cm–1 and 1052 cm–1 as the most informative bands in the spectral characteristics of serum recorded using the proposed tool. Overall, the proposed low-cost tool demonstrates the potential for diagnosing MM with high accuracy and can become the basis for affordable diagnosis and screening.
-
A silver colloid was prepared for silver structures by reducing silver nitrate (AgNO3) from an aqueous solution with sodium citrate (Na3C6H5O7) at 95 °C. The absorption spectrum of the Ag colloidal solution was obtained using a spectrophotometer (UNICO 1201, UNITED PRODUCTS & INSTRUMENTS, USA). The sizes of the spherical Ag particles in the colloidal solution were determined from the absorption spectra. As the size and shape of silver structures increase, the effects associated with a “red shift” of laser surface plasmon resonance are observed. Therefore, to build more complex and larger structures, the resulting colloidal solution (20 ml) was poured onto the aluminium foil with an area of 75 mm × 25 mm and dried at room temperature until completely dry. The size of the Ag agglomerates in the obtained substrate was assessed using an electron microscope (Vega SB scanning electron microscope; Tescan, Czech Republic).
-
To record spectral characteristics, each 2 μl serum sample was applied to the structured silver surface and dried at room temperature for 30 minutes. The SERS spectra were recorded with a Raman spectrometric system (EnSpectr R785, Spektr-M, Chernogolovka, Russia) through a microscope (ADF U300, ADF, China) with the 50× LMPlan Objective. The absence of external cooling characterised the spectrometric system. The dried serum samples were excited using 785 nm laser radiation with a laser power of 10 mW. The laser spot diameter at the focus of the sample was 5 µm. The spectra were recorded within the 517−1913 cm−1 range with the mean spectral resolution of 1 cm-1. The raw spectrum for each sample was an automatic sequential recording of four spectra, followed by averaging to compensate for shot noise. The spectra were recorded using the EnSpectr program (Spektr-M, Chernogolovka, Russia). A preliminary recording of the surrounding background signal was performed immediately before recording the spectral characteristics of the serum samples. After this, the background component was automatically subtracted from the subsequent recorded serum spectra using the algorithm built into the EnSpectr program. Fig. 5 shows the experimental stand for excitation and recording serum spectral characteristics. It should be noted that the Raman spectrum of the silver-structured surface on the foil was characterised by the absence of clearly defined Raman peaks. Therefore, it is unnecessary to consider the plate's spectral contribution to the serum SERS characteristics in the subsequent multivariate analysis.
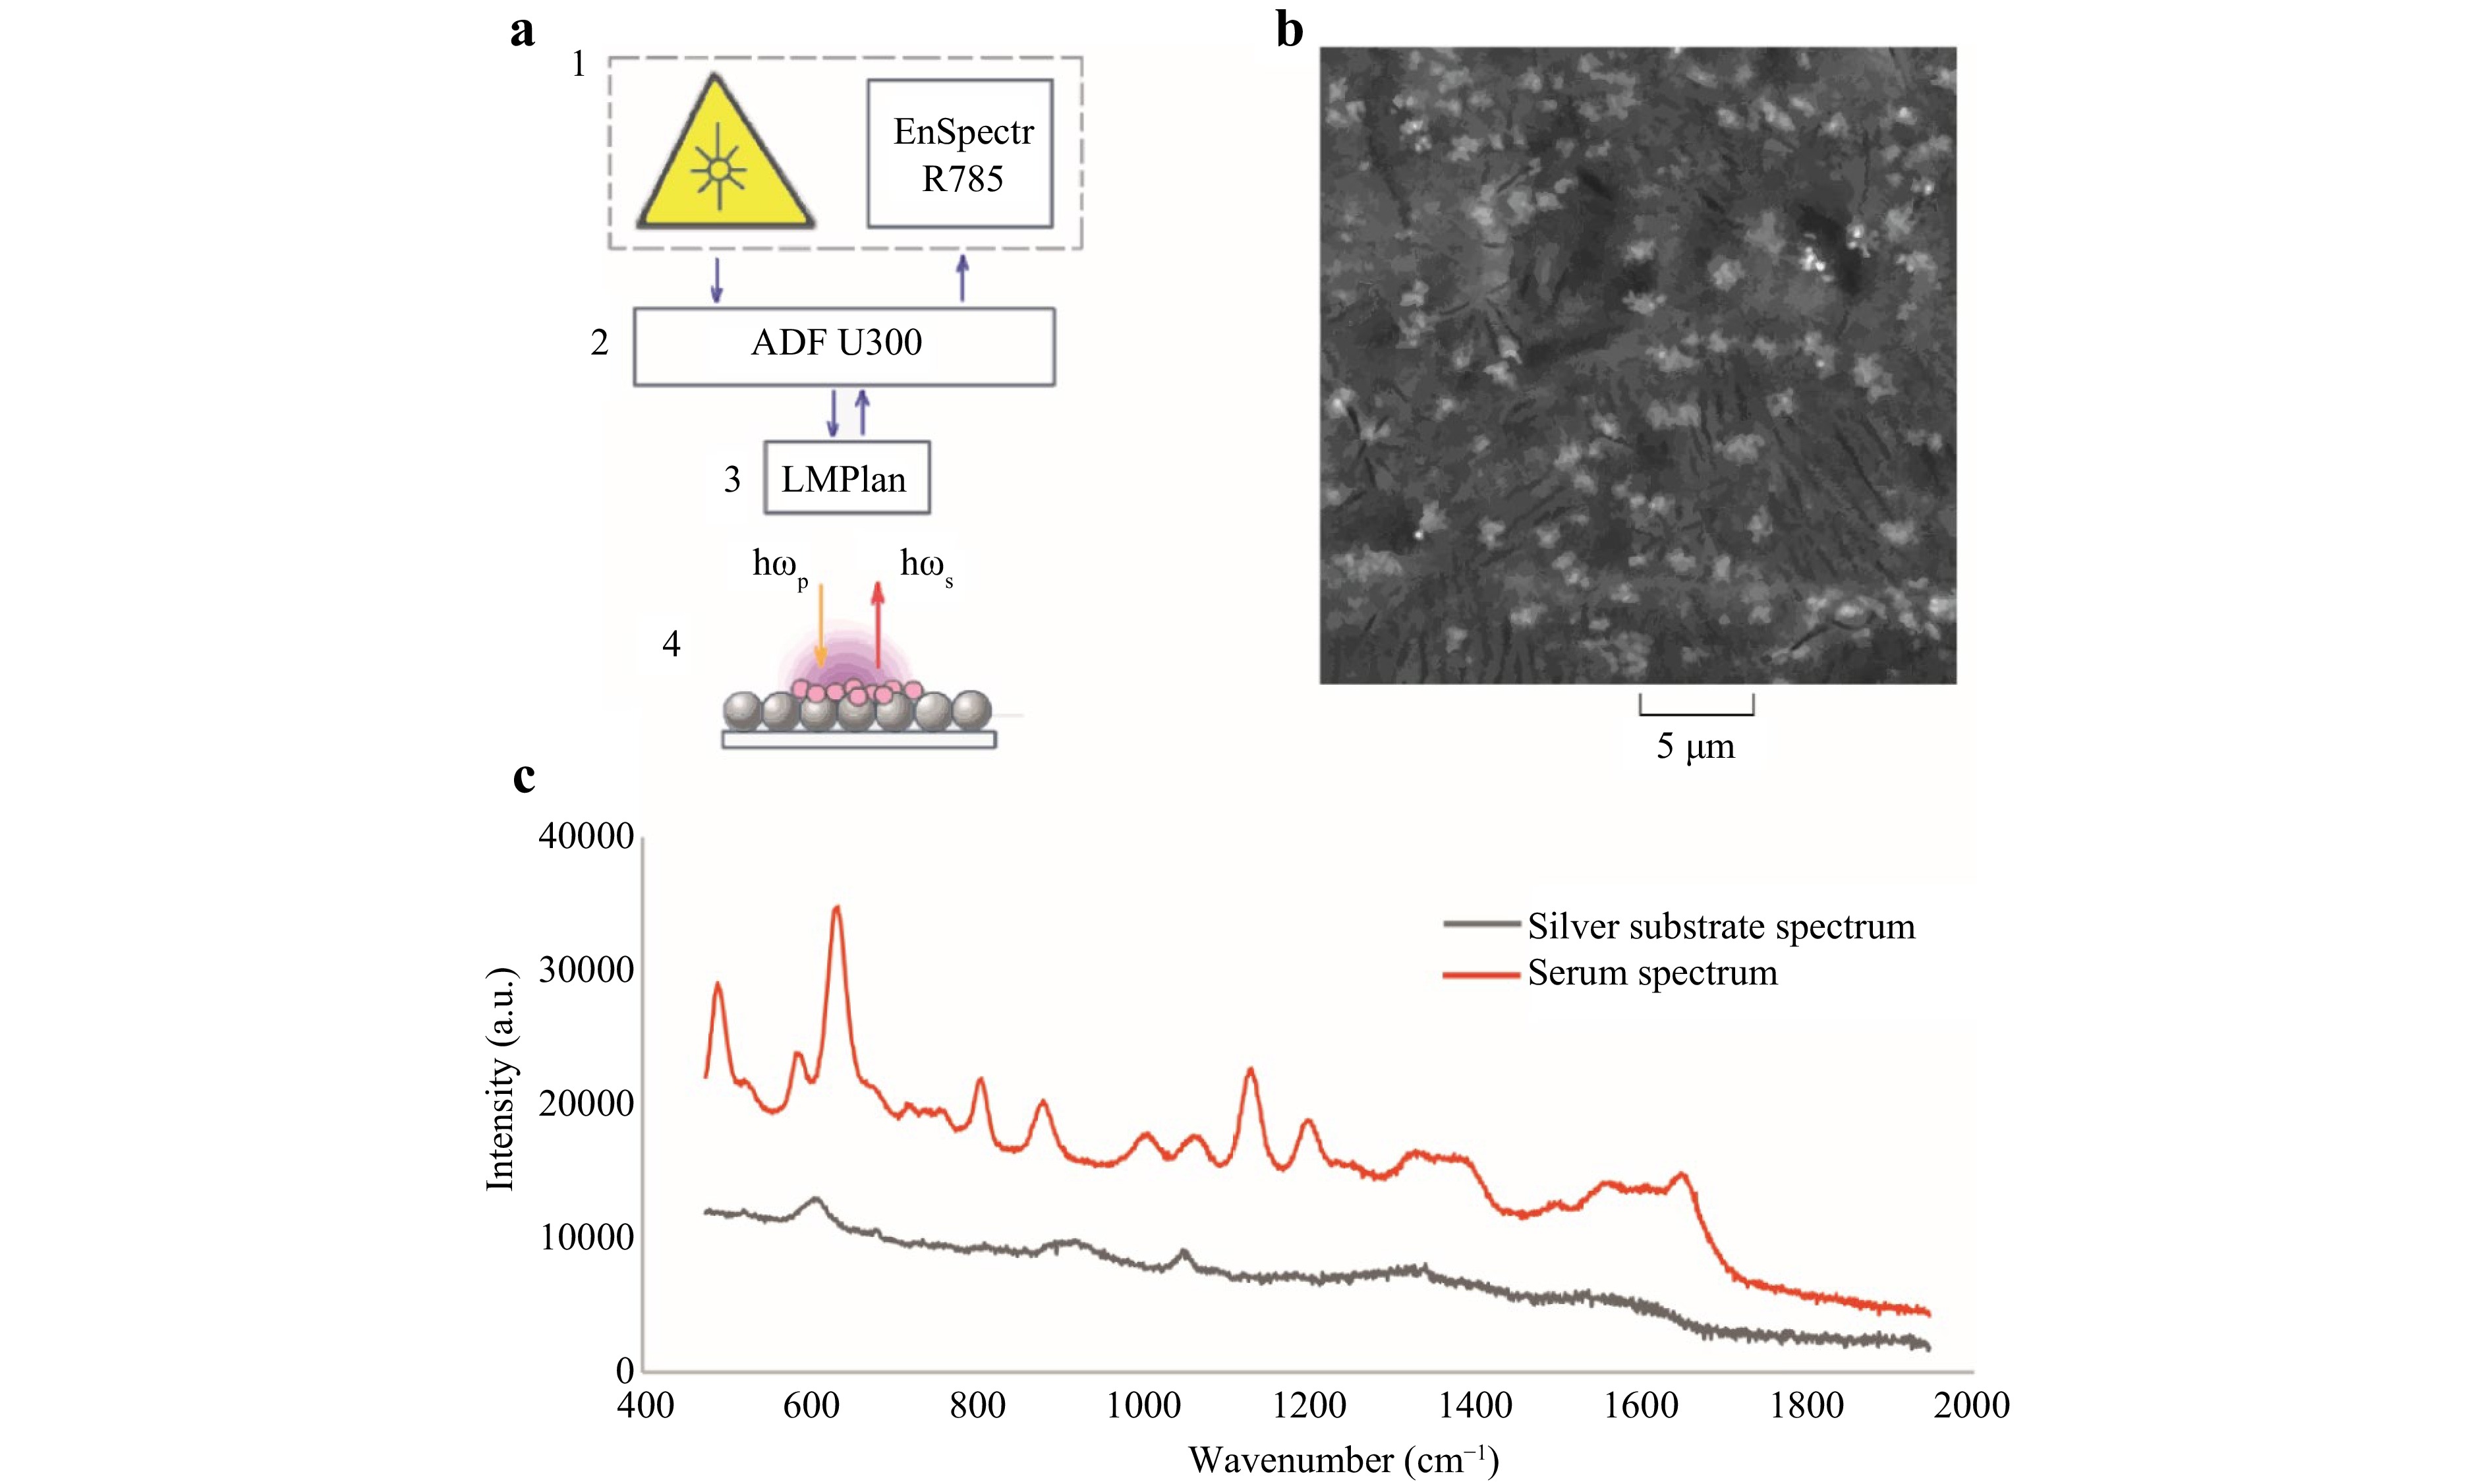
Fig. 5 SERS technology for excitation and recording of serum characteristics. a experimental stand for recording spectral characteristics (1 is Spektr-M spectrometric system with the laser module with a central wavelength of 785 nm; 2 is the ADF microscope; 3 is LMPlan lens with 50x magnification; 4 is dehydrated serum sample on the plate with silver substrate); b electron microscopic image of the silver substrate on the aluminium foil at a 7000x magnification; c spectral characteristics of the silver substrate (grey line) and a serum sample dehydrogenated on a silver substrate (red line).
-
Human serum samples were collected from 31 subjects affected by MM and requesting medical assistance at Clinical Samara Regional Hospital, named after V.D. Seredavin, and 102 subjects of comparable age in the control group without MM (Table 2). Because MM occurs predominantly in people over 60 years of age, it is necessary to provide an age-matched control group. To ensure the uniformity of the control group according to the factors of diseases that are most common in the elderly, the control group included patients with chronic coronary heart disease. MM was diagnosed according to the criteria of the International Myeloma Working Group (evaluation of monoclonal immunoglobulin level)56. Approximately 3-5 spectra were recorded for each sample at different surface points. Only suitable spectra were obtained for further analysis. The analysed spectral set consisted of 151 spectra of the MM cases and 306 spectra of the control cases. Serum samples were collected from the patients in the morning in a fasting state, and each sample was placed in a labelled sterile tube. Each tube was immediately frozen at −16 °C and then transported in the freezer to the laboratory for SERS analysis. The study protocols were approved by the Ethical Committee of Samara State Medical University (Protocol No. 268, 11 September 2023). All the patients provided informed consent to participate in this study.
Group Number of patients Age
min–max (mean)Number of spectra Multiple Myeloma (MM) 31 46−83 (58) 151 Control 102 43−74 (56) 306 Table 2. Summary of analysed groups
-
The recorded serum spectra were processed using the MDAtools package in the R studio software. The chemometrics method pre-processed and analysed the 517−1913 cm−1 spectral area. The pre-processing steps included: (1) smoothing using the Savitsky-Golay filter (filter window width = 15, 1 order of polynomial used for smoothing, and 0 order of derivative), (2) baseline correction (15th polynomial degree), and (3) normalisation using the Standard Normal Variate (SNV) algorithm. The SNV algorithm first implements the centring of each spectrum and then scales it by dividing it by its standard deviation. The scatter of the experimental data was levelled using the SNV method. Spectral data preprocessing was implemented separately for the training and test datasets to prevent data leakage into the model during normalisation.
Based on the doctor's opinion, each serum sample had a priori information about belonging to a particular group. Therefore, the data were analysed using supervised learning. A projection on latent structures with a discriminant analysis (PLS-DA) algorithm was used to distinguish the serum spectra between the MM and control groups. The PLS-DA method provides high model performance under multicollinearity and is widely used in SERS data classification problems39,47,57. Additionally, the PLS-DA model is based on a well-defined variable importance distribution (VIP) algorithm58,59. The model explanation helps avoid the black-box problem and identify cases in which a model exhibits high performance but is incorrectly associated with noise. A diagram of the proposed analytical procedure is shown in Fig. 6.
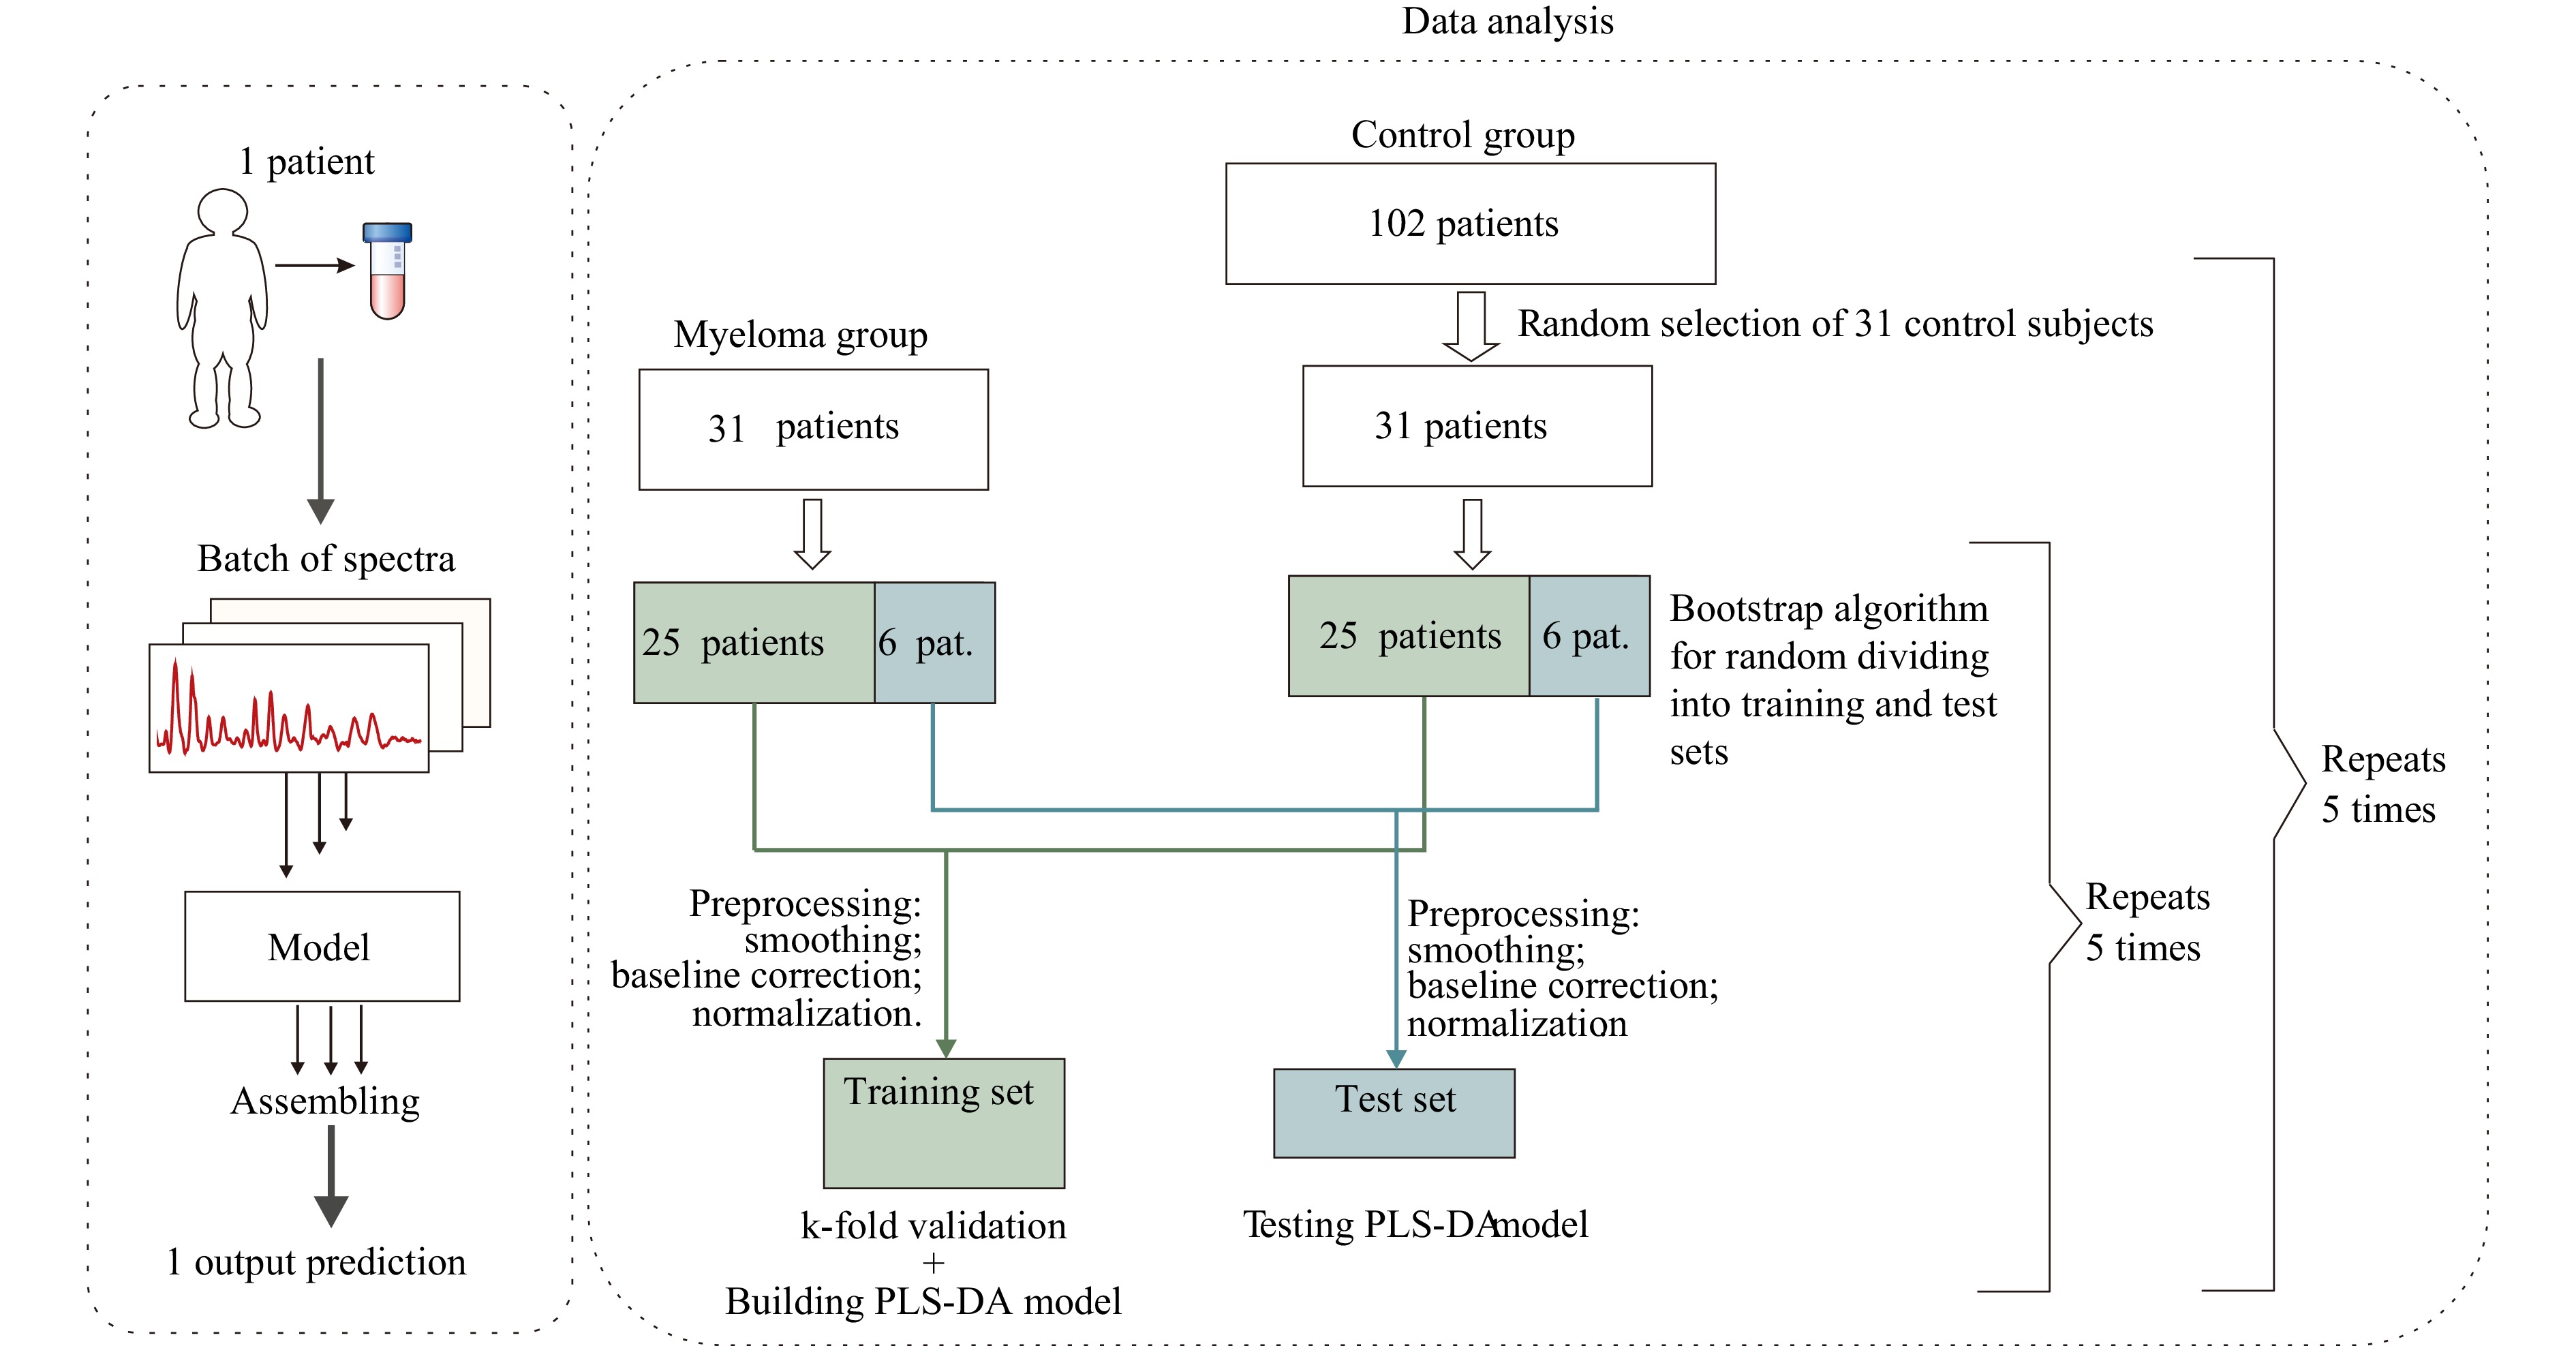
Fig. 6 Diagram of the model construction procedure.
The PLSDA algorithm was repeated 25 times to generate 25 models. In this study, several serum spectra were obtained for each patient. To improve the model's reliability, the spectra corresponding to one subject were combined into a batch, as presented in studies led by Popp57,60. In this case, the model prediction for a specific patient is obtained by assembling the predictions for the corresponding batch. Thus, 31 batches of serum spectra from patients with MM and 102 serum spectra from control subjects were analysed in the current study. Therefore, solving an unbalanced classification task was necessary in this study. When classifying under conditions of class imbalance, two approaches can be used: class balancing (undersampling and oversampling) and model optimisation (e.g. choosing a discriminatory threshold when determining a class and class weighting). The method for randomly discarding instances from the majority class was selected to combat unbalanced data in the current study. The undersampling method allows for improved generalisation, which is advantageous when analysing samples of limited size. Repeating the class balancing several times allowed us to level out the possible loss of information when reducing the size of the majority sample. Five iterations of a random selection of 31 patients from the control group were performed to obtain equal-volume samples. Thus, further analyses were performed on samples of equal volumes (31 patients with MM vs. 31 control patients). Subsequently, for balanced samples, five iterations of splitting into a training set (based on which the cross-validation and selection of the optimal number of load vectors with subsequent model construction were implemented) and a test set were performed. A bootstrap algorithm randomly divided the spectral batches in each group into training and testing sets. At each iteration, the spectral batches of 25 patients from the MM group and 25 subjects from the control group were randomly selected as a training set using the following cross-validation (CV) algorithm. The k-fold (k = 10) cross-validation was used as a validation strategy by the following algorithm: the entire training set was split into k folds repeated k times, during which inner training on the (k-1) folds and inner testing on the 1-fold was performed. The CV algorithm allowed us to test the model’s inner ability and select the correct number of principal components (CVs) by the first local minimum in the root mean square error (RMSE) plot calculated for different numbers of PCs and CV predictions. The model performance was then estimated on a test set consisting of the spectral batches of six patients from the MM group and the spectral batches of six subjects from the control group. The spectral set was divided into training and test sets such that the spectra from the same subject fell into either the training or test set. This division made it possible to test the PLS-DA model on new data that were not analysed during the training procedure.
The most important spectral regions for determining the sample type were identified using VIP analysis derived from the PLS-DA model. The VIP scores with maximum contributions to the model are highlighted in yellow in the VIP distribution (Fig. 4). Quality performance metrics, such as sensitivity, specificity, accuracy, and ROC AUCs, were calculated for each of the 25 iterations.
-
This study was supported by a grant from the Russian Science Foundation (No. 21-75-10097; https://rscf. ru/project/21-75-10097/).
SERS-based technique for accessible and rapid diagnosis of multiple myeloma in blood serum analysis
- Light: Advanced Manufacturing , Article number: (2025)
- Received: 05 October 2024
- Revised: 16 April 2025
- Accepted: 18 April 2025 Published online: 13 May 2025
doi: https://doi.org/10.37188/lam.2025.035
Abstract: Surface-enhanced Raman spectroscopy (SERS) is a promising analytical method for studying the structure and composition of multi-component media in clinical practice. However, the practical application of SERS imposes several conditions and restrictions depending on the required analytical accuracy and implementation complexity. This paper proposes a simple serum SERS technique for diagnosing multiple myeloma (MM). The process utilises a substrate composed of agglomerated spherical silver particles (~200 nm) with a capillary effect on sodium nitrate crystals (0.02% volume concentration), excited at a wavelength of 785 nm. Spectral characteristics were recorded using a detector without external cooling, ensuring a cost-effective approach. The proposed low-cost approach was tested on 31 samples from MM and 102 serum samples from an age-matched control group. Combining the SERS technique with the multivariate analysis for serum testing provided high discrimination rates for MM patients compared to the control patients, with an average accuracy of over 96%. Biochemical interpretation of the recorded spectra identified the informative bands at 635 cm-1, 723 cm-1, and 1052 cm-1. Overall, the proposed SERS-based tool can become the basis for screening for MM and can be easily integrated into clinical practice, expanding diagnostic capabilities where expensive laboratory techniques are not affordable.
Research Summary
Surface-Enhanced Raman Spectroscopy: Low-Cost Diagnostic Tool for Multiple Myeloma
A novel serum testing technique based on surface-enhanced Raman spectroscopy (SERS) demonstrates promise for accurately diagnosing multiple myeloma (MM) in clinical settings. Developed by Lyudmila Bratchenko and colleagues, this method employs a substrate of agglomerated silver particles to enhance the useful spectral signal of serum analytes, requiring minimal sample preparation and no external cooling for the detector. The technique allows for achieving over 96% accuracy in distinguishing MM patients from controls through multivariate analysis of the recorded spectral characteristics of human serum. This cost-effective approach could significantly broaden diagnostic capabilities, particularly in environments where expensive laboratory equipment is unavailable. By simplifying the process and maintaining high accuracy, this SERS-based tool is positioned as a viable option for MM screening and monitoring, with potential applications in various medical fields.
Rights and permissions
Open Access This article is licensed under a Creative Commons Attribution 4.0 International License, which permits use, sharing, adaptation, distribution and reproduction in any medium or format, as long as you give appropriate credit to the original author(s) and the source, provide a link to the Creative Commons license, and indicate if changes were made. The images or other third party material in this article are included in the article′s Creative Commons license, unless indicated otherwise in a credit line to the material. If material is not included in the article′s Creative Commons license and your intended use is not permitted by statutory regulation or exceeds the permitted use, you will need to obtain permission directly from the copyright holder. To view a copy of this license, visit http://creativecommons.org/licenses/by/4.0/.

 DownLoad: