


-
Fluorescence is a rapid emission process in which fluorophores absorb light at a specific wavelength, become excited, and emit light at a longer wavelength within nanoseconds1. The remarkable sensitivity, noninvasive nature, low toxicity, high spatial and temporal resolution2, deep penetration, high signal-to-noise ratio, cost-effectiveness and versatility of fluorescence-based microscopy makes it an essential tool in a variety of domains, including biology, chemistry, and material science, for scientific research and medical diagnostics3,4. The principles of fluorescence are summarized in the Jablonski diagram, which provides a visual representation of the phenomenon, illustrating the transitions between electronic states and vibrational levels, as shown in Fig. 15. The diagram represents different electronic states of a molecule, including the ground state (S0), the first excited singlet state (S1), the second excited singlet state (S2), and the first excited triplet state (T1). When a photon (hvabs) is absorbed, the molecule undergoes excitation (orange arrow), promoting an electron from the ground state to a higher vibrational level of S1 or S2. Following excitation, the molecule rapidly loses excess vibrational energy through vibrational relaxation (VR, purple dotted line), a non-radiative process that brings it to the lowest vibrational level of the excited state. From this state, the molecule can return to the ground state through multiple pathways. Fluorescence (blue arrow, hvflu) occurs as a radiative transition from S1 to S0, typically within a nanosecond timescale (10−9 to 10−6 s). Alternatively, internal conversion (IC, dark purple dotted line) allows for a non-radiative transition between electronic states of the same spin multiplicity, such as from S2 to S1 or S1 to S0. Another key pathway is intersystem crossing (ISC, red dashed line), a non-radiative transition from S1 to the triplet state T1, which is often facilitated by heavy atoms or molecular rigidity. Once in the triplet state, the molecule may return to the ground state via phosphorescence (green arrow, hvpho), a radiative process that occurs on a much longer timescale, ranging from microseconds to seconds. Additionally, quenching (cyan dashed line) can occur due to external factors, such as molecular interactions or environmental influences, leading to the non-radiative dissipation of energy and suppression of fluorescence or phosphorescence. This diagram provides a comprehensive understanding of fundamental photophysical events essential for fluorescence lifetime imaging, energy transfer studies, and other spectroscopic applications5,6. Additionally, it highlights phenomena such as quenching and Foster Resonance Energy Transfer (FRET), which significantly impact fluorescence dynamics7. Upon excitation by a photon, a fluorophore undergoes rapid internal conversion to the lowest vibrational level of the first excited electronic state8. The molecule then relaxes to its ground state by emitting fluorescence, with a characteristic fluorescence lifetime, defined as the average time the molecule spends in the excited state before emission9. Fluorescence imaging techniques have evolved significantly to enable high-resolution visualization of cellular structures, molecular interactions, and dynamic biological processes10,11. Among advanced fluorescence techniques, fluorescence lifetime imaging microscopy (FLIM) has emerged as a transformative approach. Unlike intensity-based imaging, FLIM measures the fluorescence lifetime, which is independent of fluorophore concentration and offers unique advantages in providing quantitative, environmentally sensitive data about factors such as pH, ion concentration, and molecular binding states12. FLIM has been widely used in cancer research to measure cellular metabolic states via the autofluorescence of metabolic coenzymes such as nicotinamide adenine dinucleotide (NADH) and flavin adenine dinucleotide (FAD)13−15. In particular, the ratio of free to protein-bound NADH provides important information on glycolytic activity, a characteristic of the metabolism of cancer cells. The incorporation of deep learning (DL) and machine learning (ML) techniques into FLIM analysis has resulted in groundbreaking improvements in cancer research16,17. Convolutional neural networks (CNNs) are exceptionally proficient at processing multidimensional, complicated data18. These models can automatically recognize characteristics, categorize tissues, and find subtle patterns connected to cancer growth, metastasis, and response to therapy when applied to FLIM datasets19. With remarkable accuracy and scalability, this integration greatly expands the diagnostic and prognostic capabilities of FLIM. DL-enhanced FLIM has been studied for a variety of applications, ranging from assessing the tumor margin in real time during surgery to assessing the effectiveness of drugs in preclinical models20. Furthermore, extensive screening of cellular heterogeneity has been made possible by the combination of FLIM and DL, providing insight into cancer stem cell types and their function in therapeutic resistance21. New perspectives on cancer biology at the systems level are made possible by the capacity to correlate fluorescence lifetimes with temporal and geographical changes in tumor microenvironments. Moreover, DL also plays a pivotal role in automating fluorescence microscopy workflows, reducing human intervention, and making these advanced techniques more accessible22.
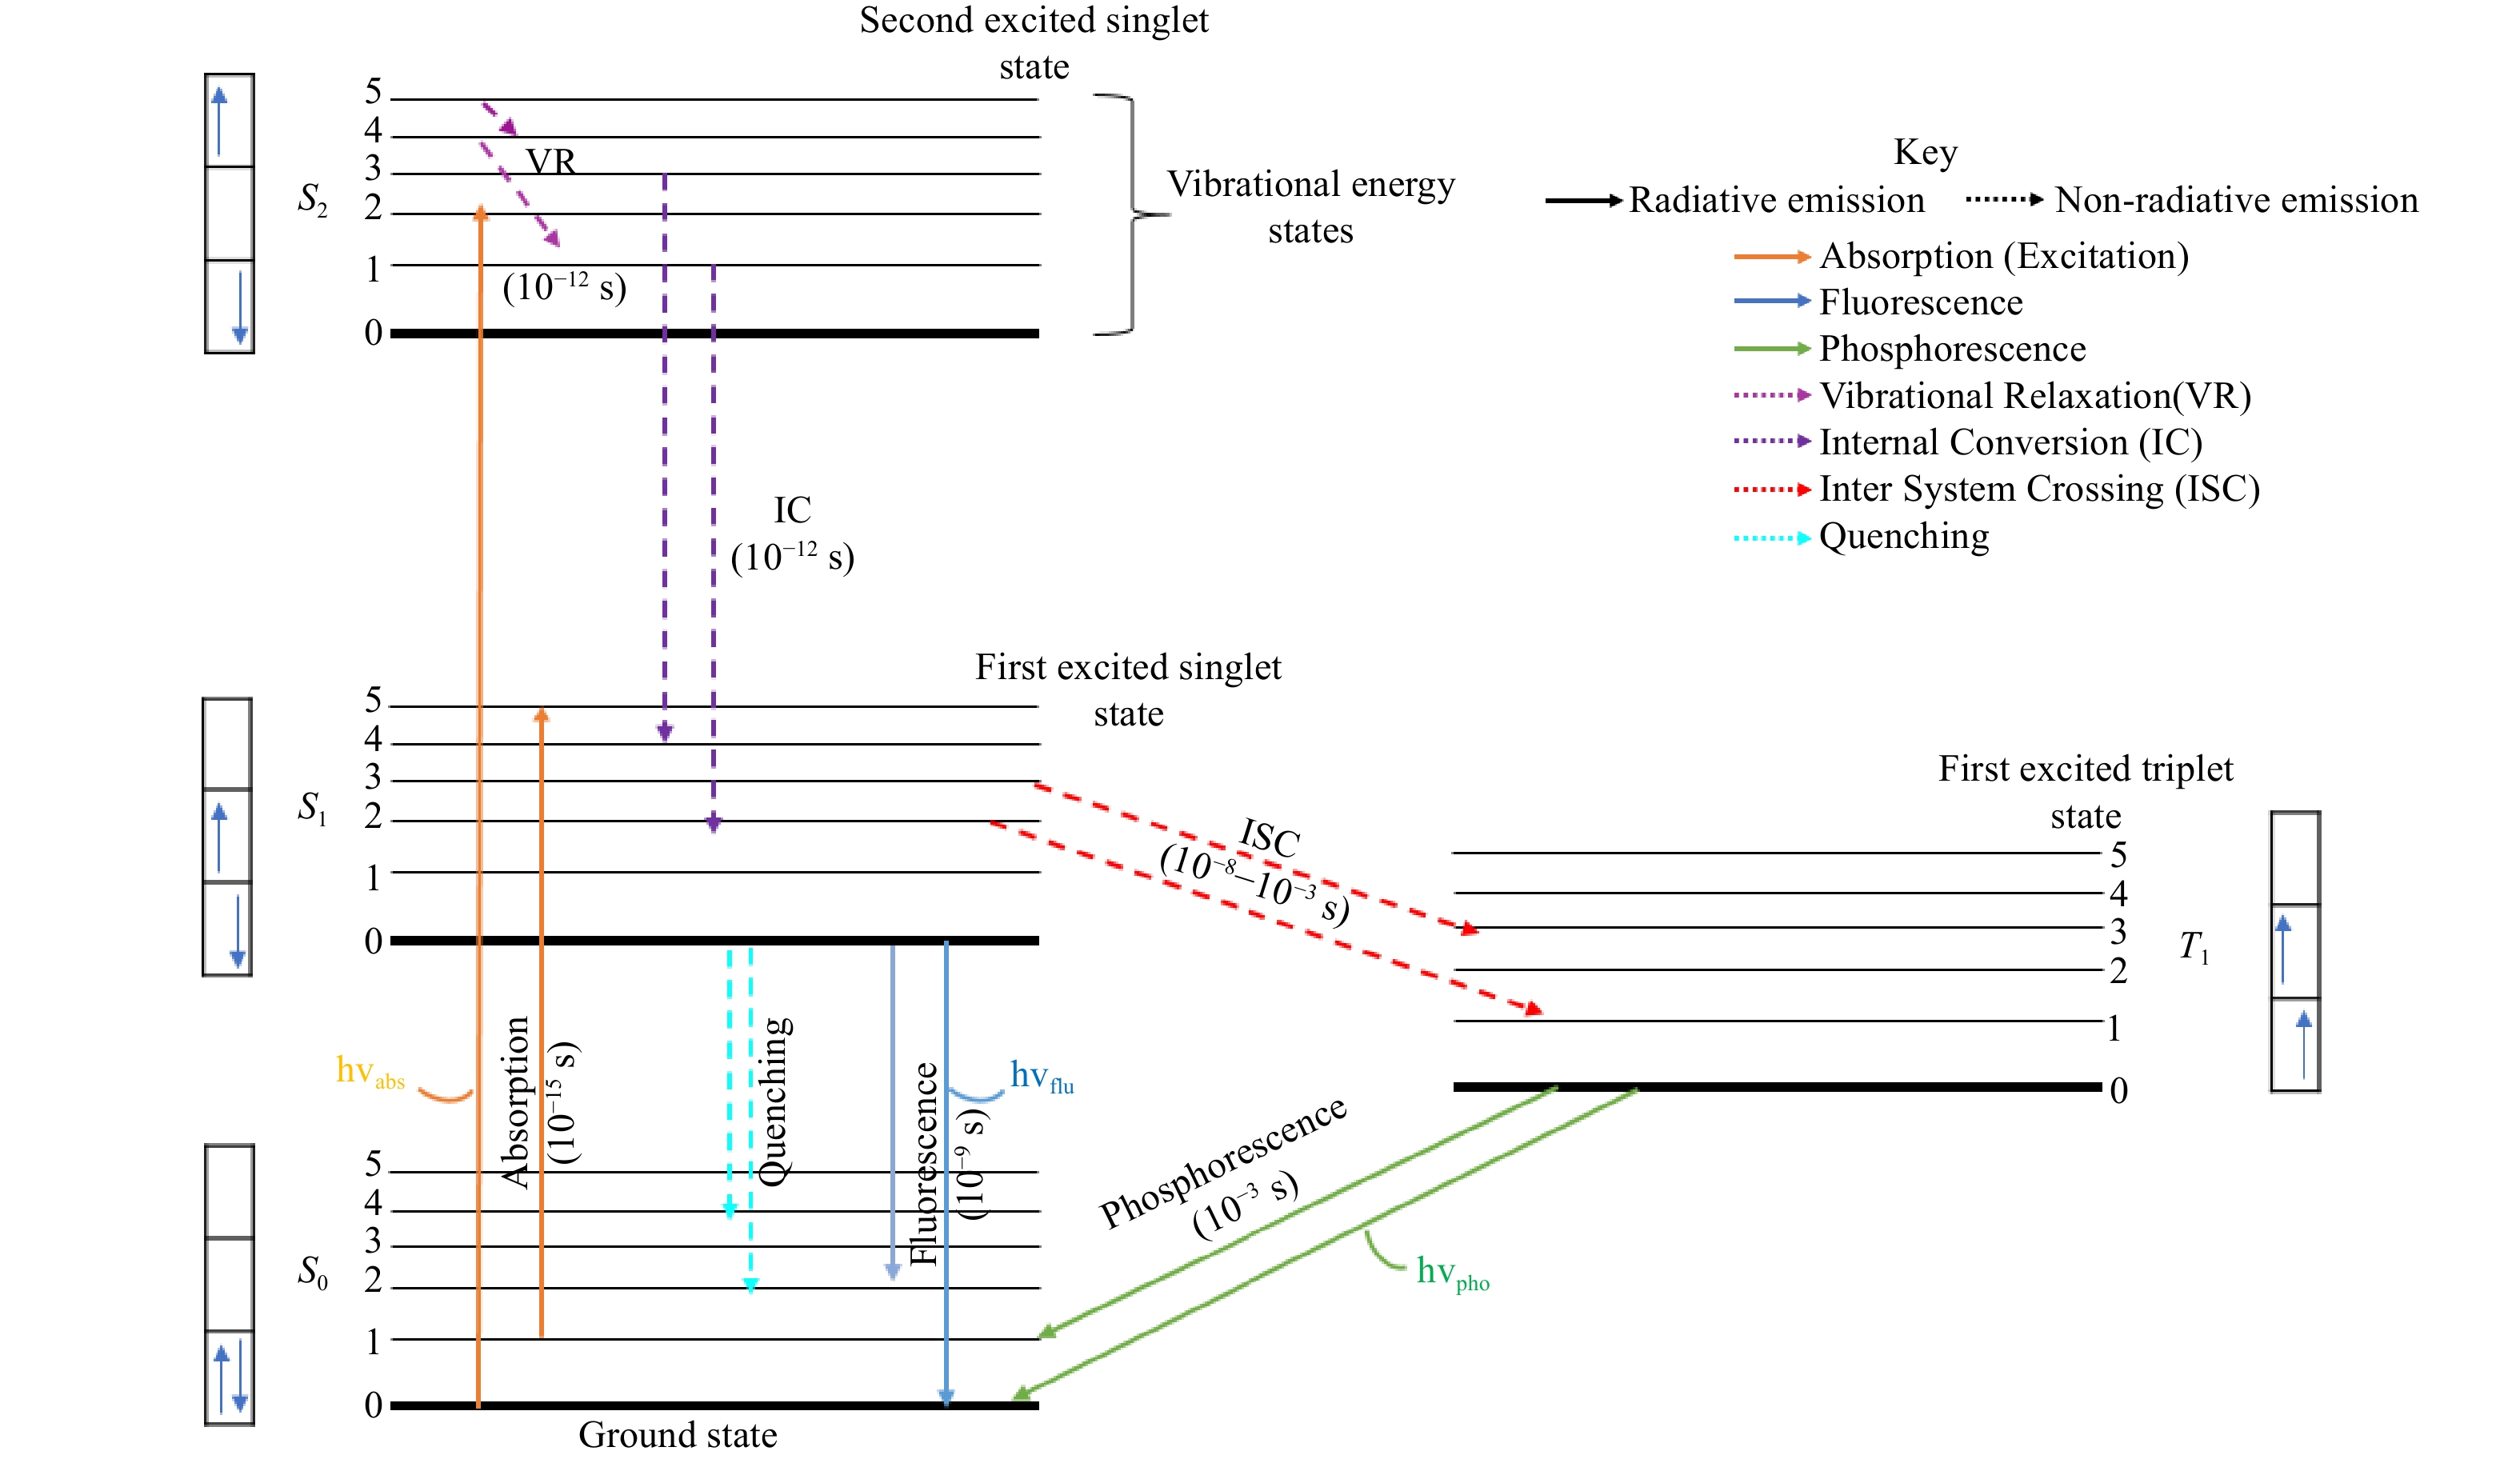
Fig. 1 Schematic representation of the Jablonski diagram showing excitation, relaxation, and emission pathways, including fluorescence, phosphorescence, and non-radiative decay5.
FLIM is a key component of contemporary biomedical imaging since it offers numerous benefits over conventional intensity-based fluorescence microscopy techniques. The fact that FLIM is not affected by changes in intensity is one of its greatest advantages23.The fluorescence lifespan, in contrast to intensity measurements, is an inherent characteristic of a fluorophore and is not impacted by variations in detector sensitivity, excitation intensity, or fluorophore concentration24. FLIM’s self-referenced nature ensures reproducibility across various setups while eliminating lengthy calibrations, enhancing data comparability. It is highly sensitive to pH, temperature, and viscosity changes in the fluorophore environment25. Because of their sensitivity, scientists may examine dynamic processes, including molecular interactions, protein folding, and cellular metabolism, in detail. For example, FLIM can resolve the bound and unbound states of NAD(P)H, a crucial metabolic cofactor, which is indistinguishable via intensity-based methods26. Additionally, FLIM enables the discrimination of spectrally overlapping fluorophores on the basis of their distinct fluorescence lifetimes, making it invaluable for complex biological systems with multiple fluorophore species. One of the main advantages of FLIM is its ability to withstand inner filter effects caused by scattering and absorption, which frequently influence intensity-based results27. Imaging deep tissues and biological specimens that scatter widely is made easier with this capacity. With the help of computational methods that simulate IRF to reduce scattering patterns, FLIM measurements continue to be accurate at deeper tissue depths. FLIM is a powerful technique for in situ and in vivo imaging because of these characteristics28. Additionally, FLIM is flexible enough to identify several fluorophore states in a single pixel. This ability is essential for researching biological heterogeneity, such as the coexistence of molecules in both bound and unbound states or distinct protein conformations. This multistate detection adds another layer of detail to FLIM data, enabling researchers to uncover insights into molecular behavior that would be inaccessible with intensity-based methods. In addition to its technical advantages, FLIM uses intrinsic fluorophores such as FAD and NAD(P)H to enable label-free imaging29. Autofluorescence FLIM is especially useful for researching stem cells, cancer, immune cells, and brain physiology since it offers a noninvasive method for tracking cellular metabolism and protein-enzyme interactions. This method has been effectively used on a variety of sample types, such as human tissues, microfluidic systems, three-dimensional organoids, and in vivo models30. The functionality of FLIM with cutting-edge imaging modalities, such as multiphoton microscopy, which permits 3D optical sectioning and deep tissue imaging, is another significant benefit31. FLIM is appropriate for both clinical and biological research because of this integration, which enhances imaging depth and spatial resolution. Furthermore, advancements in computational algorithms for FLIM analysis are expanding their utility32. These algorithms improve image segmentation, enable multidimensional heterogeneity quantification, and support multiparametric analysis, revealing molecular and spatial features that are not apparent through qualitative image observation alone. FLIM stands out as a powerful and versatile imaging technique that offers unique advantages over traditional fluorescence microscopy. Its ability to detect subtle molecular changes, resist intensity-related artifacts, and provide robust, reproducible measurements makes it a critical tool in biomedical research33. FLIM has evolved into a highly sophisticated imaging technique, with recent advancements in its integration with DL significantly enhancing data analysis, thereby broadening its applications in biomedical research and clinical diagnostics.
This review provides a comprehensive overview of FLIM and its integration with DL in cancer research. It delves into the fundamental principles and technological developments of fluorescence and FLIM, explores the challenges associated with fluorescence lifetime analysis, and highlights the role of DL in improving data quality and interpretation. By discussing recent advancements and addressing existing limitations, this review underscores the transformative potential of this innovative approach in cancer diagnostics and treatment.
-
Time-domain lifetime measurement involves exciting a sample with a short light pulse, typically much shorter than the fluorescence lifetime of the sample. The fluorescence emission is then recorded as a function of time, allowing the decay characteristics to be analyzed34. This technique produces fluorescence decay curves that follow an exponential form, as described in Eq. 1, as shown in Fig. 2. Time-correlated single-photon counting (TCSPC), which monitors the arrival time of the first photon following each pulse at extremely high temporal precision, may be used in practice to perform time-domain measurements36,37. The Instrument Response Function (IRF) is crucial in fluorescence lifetime measurements, as its width affects temporal resolution. In TCSPC, IRF is influenced by the pulse width of the excitation laser, photon counting electronics jitter, and detector transit time spread. These factors must be considered to ensure accurate lifetime determination38,39. This technique records the arrival time of emitted photons with high temporal resolution relative to the excitation pulse, enabling precise fluorescence lifetime determination.
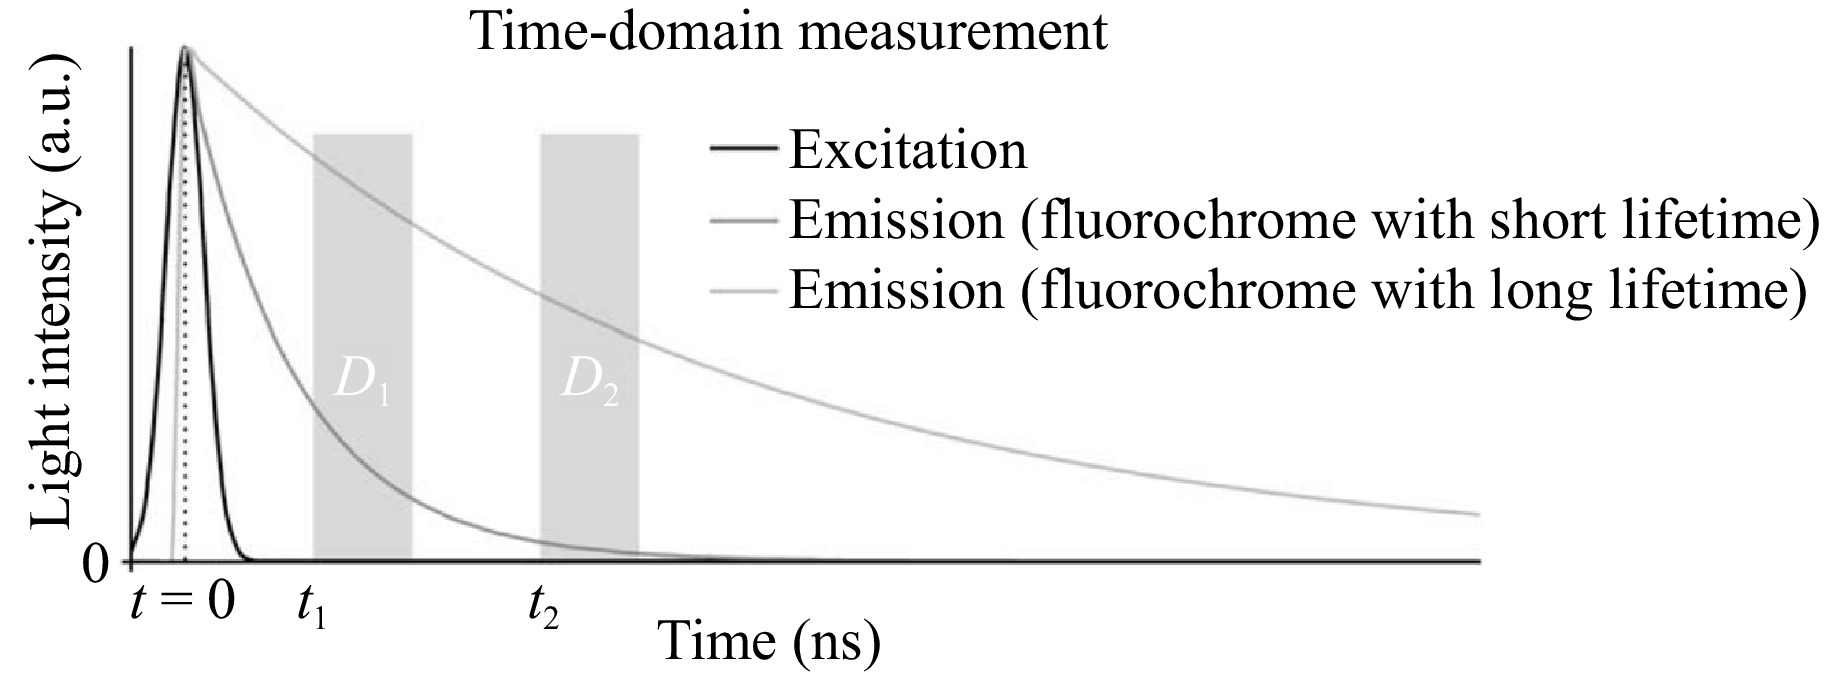
Fig. 2 Time-domain fluorescence measurement showing the excitation and emission lifetimes. Fluorescence is detected at discrete intervals (D1, D2) after a light pulse excites the fluorochrome35.
The time-dependent fluorescence intensity following a single excitation pulse, denoted as Ipulse(t), is given by:
$$ {I}_{pulse}\left(t\right)=\frac{1}{\tau}\times \mathrm{exp}\left(-\frac{t}{\tau }\right) $$ (1) where: Ipulse(t) represents the fluorescence intensity at time t after the excitation pulse. t is the elapsed time after excitation, and τ is the fluorescence lifetime. The coefficient $ {1}/{\tau } $ ensures that the decay function properly represents the fraction of photons emitted over time, aligning with experimental fluorescence decay data.
The decay curve can be represented by recording the arrival timings of many photons. The probability of detecting a photon following a pulse must be minimal for this method to be effective. The distribution will be skewed toward shorter lifespans if this is not the case. According to estimates, TCSPC needs a detection effectiveness of 1% or less to function for lifetime measurements34. As a result, TCSPC is consistently comparatively sluggish. The benefit is that a direct measurement of the degradation curve is possible. The collection of photons via gated detection with a predetermined number (usually 2-8 ns) of discrete time intervals is another time-domain approach. Given the pulse time t, which refers to the time elapsed after the excitation pulse—the arrival time of each detected photon can be used to reconstruct the fluorescence decay profile. In other words, it is not the time at which the pulse occurs but rather the measurement of fluorescence intensity decay at a given time after excitation. While Eq. 1 represents the normalized fluorescence decay function, where the intensity is expressed in terms of relative probability rather than absolute intensity, the fluorescence intensity in absolute terms, where I0 is the initial fluorescence intensity at t = 0 is expressed by Eq. 2. The emitted fluorescence intensity for straightforward monoexponentially decay may be expressed as:
$$ I\left(t\right)=I_0\times \mathrm{exp}\left(-\frac{t}{\tau }\right) $$ (2) where I(t) is the fluorescence intensity as a function of time, I0 is the fluorescence intensity immediately following the pulse, t is the time after the light pulse, and τ is the duration of the excited state40. The fluorescence decay function Ipulse (t) represents photon emission probability over time. TCSPC records photon arrival times to construct decay curves, requiring low detection probability (<1%) to avoid bias. Gated detection measure fluorescence at two-time intervals (t1, t2) to determine lifetime. In heterogeneous population, decay follows a multi-exponential model, requiring deconvolution techniques for accurate analysis41. Here, it can be demonstrated that measuring the integrated intensity at two-time intervals is sufficient to calculate τ, utilizing
$$ \tau =\frac{\left({t}_{1}-{t}_{2}\right)}{\mathrm{ln}\left({D}_{1}-{D}_{2}\right)} $$ (3) with D1 and D2 representing the summed intensities in intervals 1 and 2, as defined by Eq. 3, and t1 and t2 denoting the time delays between the excitation pulse and the beginning of detection intervals 1 and 2, respectively (see Fig. 2), it is important to account for the light pulse shape in fluorescence decay measurements. Since the observed fluorescence decay is the convolution of the decay and the light pulse shape, corrections are necessary when the light pulse shape is not negligible compared with the fluorescence lifetime42. Unless the rise and fall periods are much shorter than the fluorescence lifetime detection, this may also be necessary for the detector’s temporal response properties. To apply time-domain detection to FLIM, a pulsed light source, such as a pulsed laser, must be inserted into the microscope. For detection in scanning microscopy modalities, a photomultiplier tube (PMT) and either specific TCSPC circuits or a gated detection system are used. Since TCSPC requires tracking both the arrival time and the spatial origin of each photon within the sample, it is especially difficult to use in wide-field microscopy. For this purpose, a quadrant detector is one tool43. However, the device must wait for enough photons to obtain a trustworthy representation of the decay curve for each place before building an image, which results in incredibly long acquisition periods. Therefore, for time-domain wide-field microscopy, the significantly quicker gated image intensifier technique, which utilizes an image intensifier synchronized with the excitation pulse is typically utilized in place of TCSPC35. The intensifier rapidly switches between open and closed states (gated operation), capturing fluorescence images at different delay times after excitation. By collecting multiple images at varying time delays, a fluorescence decay profile can be reconstructed pixel by pixel. This method is advantageous for high-speed imaging applications where rapid data acquisition is necessary.
-
Frequency-domain FLIM is a technique used to measure fluorescence lifetimes by analyzing phase shifts and modulation depths of fluorescence emission in response to sinusoidal excitation light44. This method is valuable for studying molecular interactions, the cellular environment, and energy transfer processes in biomedical research. The fluorescence emission of a fluorophore, when excited by modulated light, shows a phase shift and attenuation during modulation due to non-instantaneous decay. Fig. 3 illustrates the principle of frequency-domain lifetime measurement, showing the phase shift and modulation of the emitted fluorescence relative to sinusoidally modulated excitation light. This highlights differences in fluorescence lifetime based on the phase and amplitude between fluorochromes with short and long lifetimes. The fluorescence intensity can be described as the convolution of the excitation signal and the fluorophore’s fluorescence decay19,26,35. In the frequency domain, the fluorescence decay is represented as shown in Eq. 4:
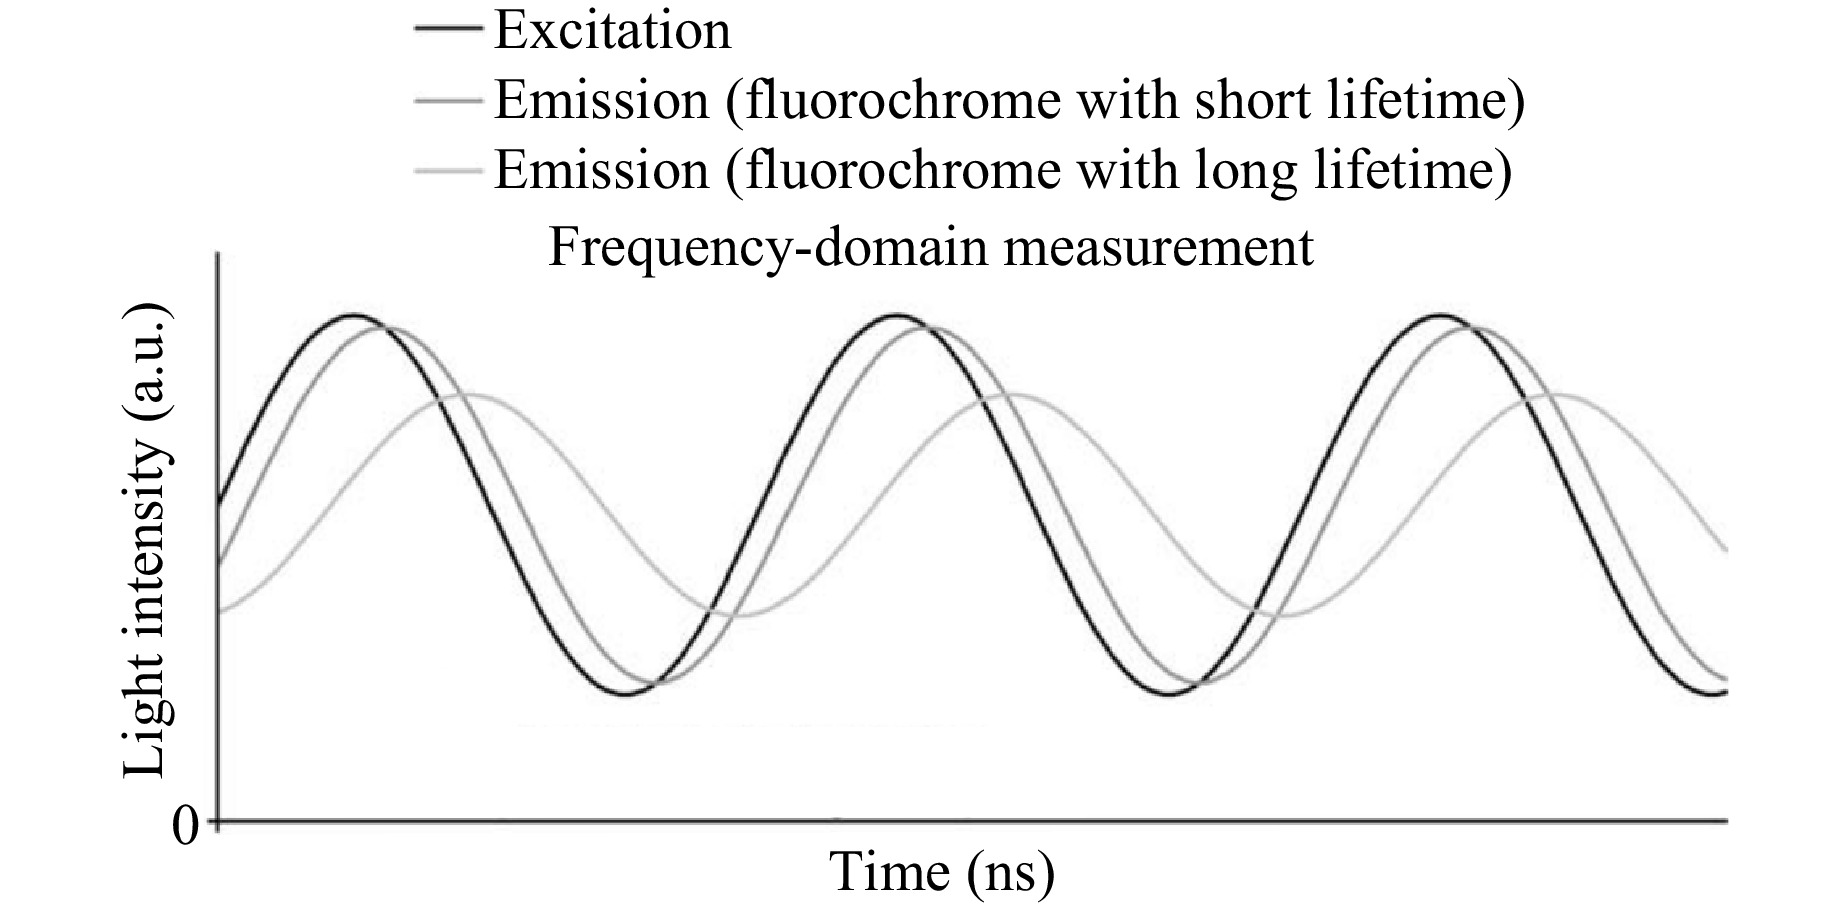
Fig. 3 Frequency-domain measurement of the fluorescence lifetime. The phase shift and modulation of emission signals relative to sinusoidal excitation reveal fluorochrome lifetimes35.
$$ {\left(1+i\omega \tau \right)}^{-1} $$ (4) where i is the imaginary unit, ω is the angular frequency of the modulation, and τ is the fluorescence lifetime of a fluorophore. This leads to phase shifts ($ \varphi $) and modulation depth changes (M), as expressed in Eqs. 5, 6 respectively:
$$ \varphi ={\mathrm{tan}}^{-1}\left(\omega \tau \right) $$ (5) $$ M ={(1+{\omega }^{2}{\tau }^{2})}^{-\frac{1}{2}} $$ (6) where ω is the angular frequency of the modulation and τ is the fluorescence lifetime of a fluorophore45,46. These measurements provide insights into the fluorophore environment and interactions. The modulation depth is a key parameter in frequency-domain fluorescence lifetime measurements. It quantifies how much the fluorescence signal varies in intensity relative to its average value. A higher modulation depth indicates a stronger modulation of the fluorescence signal, which typically corresponds to shorter fluorescence lifetimes.
In frequency-domain FLIM, the phase shift and modulation depth are determined via Fourier analysis of the recorded fluorescence intensity at varying phase shifts47. Given that the phase difference is evenly spaced throughout the 360-degree range, Fsin, Fcos and FDC are computed using19:
$$ {F}_{sin,n}={\sum }_{k=0}^{k}\mathrm{sin}\left(\frac{2\pi nk}{K}\right){I}_{k} $$ (7) $$ {F}_{cos,n}={\sum }_{k=0}^{k}\mathrm{sin}\left(\frac{2\pi nk}{K}\right){I}_{k} $$ (8) $$ {F}_{DC}={\sum }_{k=0}^{k}{I}_{k} $$ (9) where k represents the number of recorded images, Ik the intensity in the kth image and n the harmonic of interest as shown in Eqs. 7-9.
The phase and modulation are calculated via Eqs. 10, 11 respectively:
$$ \varphi = {\mathrm{tan}}^{-1}\left(\frac{Fsin,n}{Fcos,n}\right) $$ (10) $$ M = 2\frac{\sqrt{{F}_{sin,n}^{2}+{F}_{cos,n}^{2}}}{{F}_{DC}} $$ (11) where Fsin,n is the sine component of the fluorescent signal at the nth harmonic, Fcos,n is the cosine component of the fluorescent signal at the nth harmonic, and FDC is the direct current intensity of the fluorescence signal19,35.
The fluorescence lifetimes can then be calculated from the phase shift between excitation and emission and modulation depth48 via Eqs. 12, 13:
$$ {\tau }_{\varphi }= \frac{\mathrm{tan}\left({\varphi }_{em}- {\varphi }_{ex}\right)}{\omega } $$ (12) $$ {\tau }_{M} =\frac{1}{\omega }\sqrt{\frac{1}{{\left(\dfrac{{M}_{em}}{{M}_{ex}}\right)}^{2}-1}} $$ (13) where τ$ {}_{\varphi } $ is the fluorescence lifetime calculated from the phase shift, ($ \varphi_{\rm{em}} $−$ \varphi_{\rm{ex}} $) is the phase difference between the emitted and excited light, τM is the fluorescence lifetime calculated from the modulation depth, ω is the angular frequency of the modulation, Mem is the modulation depth of the emitted fluorescence, and Mex is the modulation depth of the excitation light49.
-
In one-photon excitation (OPE), a molecule or fluorophore in its ground state (S0) absorbs a single photon of light, which provides the energy needed to elevate it to an excited state (S1)50. To efficiently excite the fluorophore, the excitation photon should have a wavelength (λ1p) (where λ1p is wavelength in one photon excitation) that corresponds to an energy that matches the energy of the excited state of the fluorophore (ES1), as given in Eq. 1451. This process is commonly observed with ultraviolet or visible light, which has sufficient energy to excite most fluorophores. Once in the excited state (S1), the molecule relaxes back to the ground state (S0), releasing the energy absorbed (ES0), as fluorescence52. This fluorescence emission is a key feature in conventional microscopy and imaging techniques. However, OPE can result in photodamage and background fluorescence in biological samples because high-energy light interacts with the entire illuminated region53.
$$ {E}_{S1}-{E}_{S0} = \frac{hc}{{\lambda }_{1p}} $$ (14) Two-photon excitation (TPE) involves the simultaneous absorption of two photons of lower energy to excite a fluorophore54. This type of autofluorescence of endogenous molecules such as aromatic amino acids and coenzymes has been widely used to study cellular metabolism for decades55. Unlike OPE, the photons used are from the infrared range, which has a longer wavelength and lower energy. This method requires a high density of photons at the focal point, achieved through ultrashort laser pulses and tight focusing56. Since photon energy and wavelength are inversely proportional, photons in TPE should have wavelengths ($ \lambda $2p) that are roughly twice as large as those needed to produce an identical transition under OPE, as stated in Eq. 1551. For example, as shown in Fig. 4, a fluorophore that efficiently absorbs light at 300 nm under typical OPE may be activated by two simultaneous photons at approximately 600 nm. Therefore, infrared light may be used to trigger fluorescence instead of UV‒visible illumination57. The singlet state excited during traditional OPE is the same state from which fluorescence emission occurs. Thus, the fluorescence emission after TPE is the same as that generated in normal OPE58. Excitation occurs only when the photon density is high, providing intrinsic three-dimensional resolution and minimizing damage to surrounding tissues. The fluorescence emission is identical to that observed in OPE, but TPE offers advantages such as reduced phototoxicity, deeper tissue penetration, and less interference from autofluorescence59,60. These features make it especially valuable for imaging thick biological samples and live tissues61.
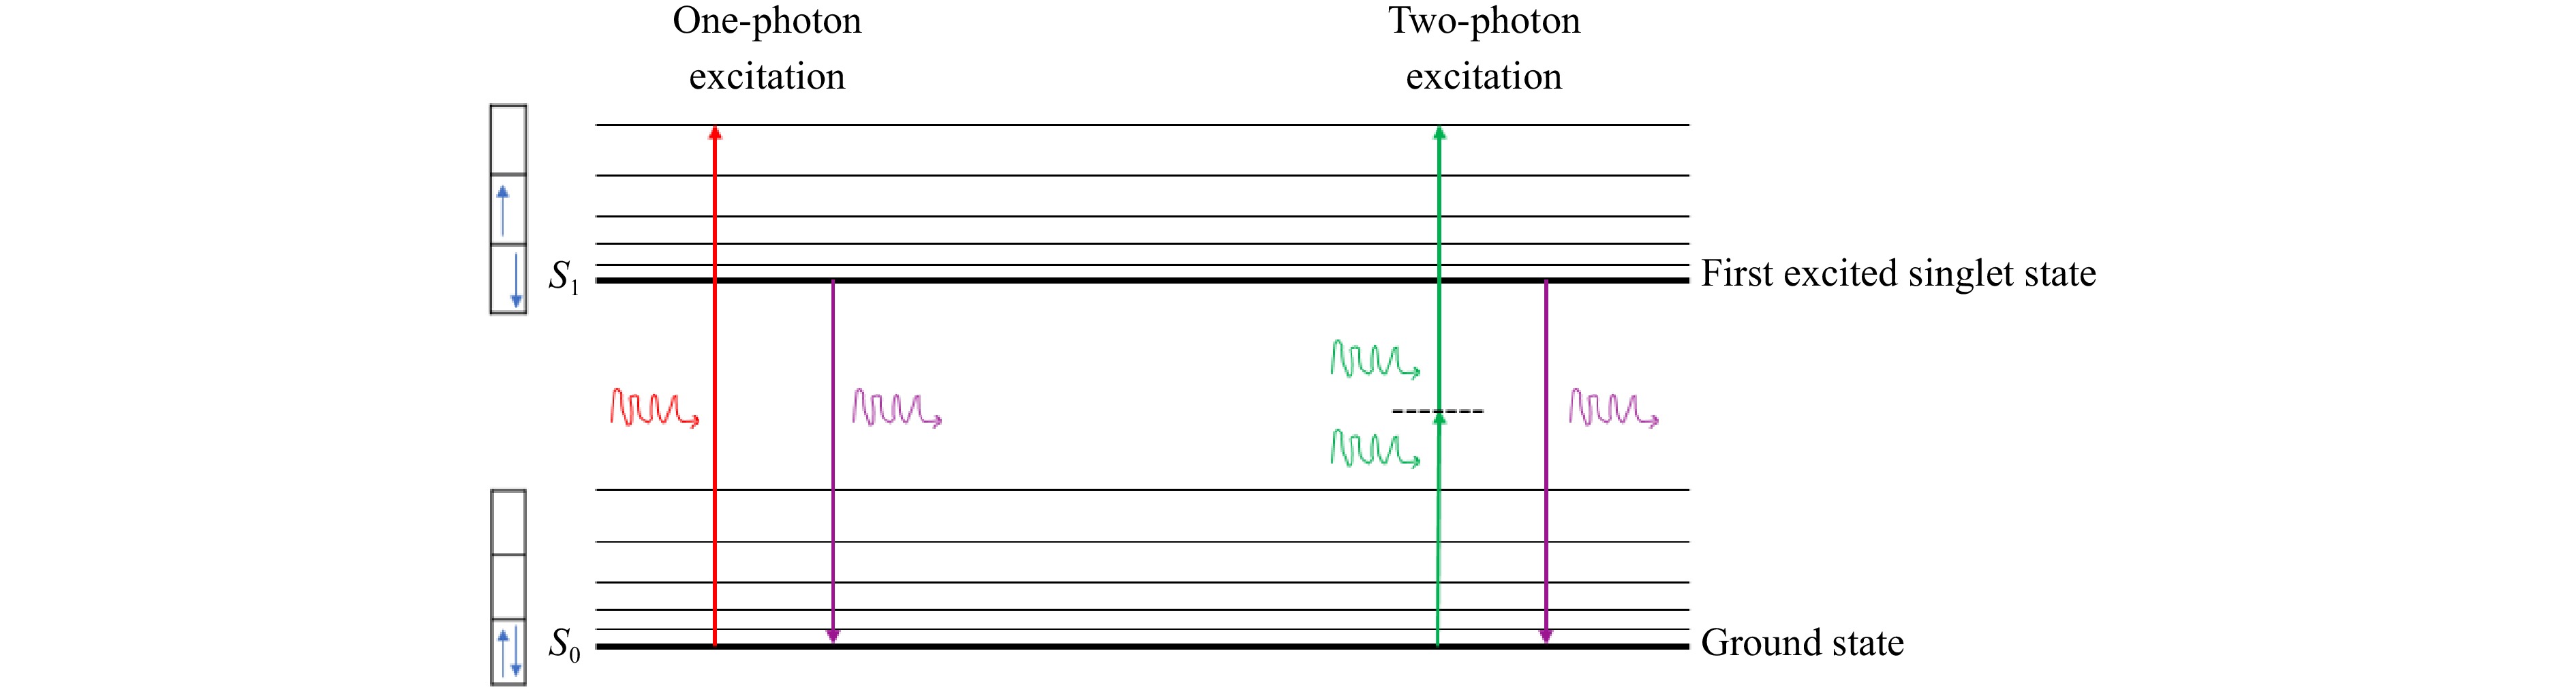
Fig. 4 Jablonski diagram illustrating one-photon and two-photon excitation pathways leading to identical fluorescence emission despite distinct excitation mechanisms51.
$$ {E}_{S1}-{E}_{S0}\approx 2\frac{hc}{{\lambda }_{2p}} $$ (15) -
Anisotropy FLIM is a technique that combines fluorescence lifetime with fluorescence anisotropy measurements to analyze molecular rotational dynamics and interactions at the cellular level62. It provides spatially resolved information on fluorescence anisotropy decay, allowing the detection of multiple decay components within a region of interest (ROI). By integrating steady-state intensity and polarization images with modulated lifetime measurements, anisotropy FLIM enables the characterization of molecular heterogeneity, diffusional dynamics, and environmental influences on fluorophores63. This technique is valuable for studying protein dynamics, membrane fluidity, and molecular interactions in live-cell imaging and biomedical research.
A recent study demonstrated the advantages of polarization-resolved stimulated spontaneous loss (SSL) pump-probe microscopy over conventional fluorescence polarization imaging, highlighting its superior spatial resolution, polarization distinction, and temporal resolution. The multiphoton process in SSL enhances optical sectioning, penetration depth, and polarization resolving, leading to significantly improved image contrast. Additionally, the study reported faster lifetime measurements due to simpler triggering electronics, achieving a temporal resolution of 30 ps64. Subsequent study presents a picosecond time-gated FLIM system extended for time-resolved fluorescence anisotropy imaging (TR-FAIM) to measure rotational mobility and fluorescence lifetime in a single acquisition. TR-FAIM was applied to rhodamine 6G solutions, generating wide-field viscosity maps based on rotational correlation time. The technique demonstrates potential for imaging local viscosity and fluorescence lifetime distributions in fluorophore-tagged proteins within cells65.
-
FLIM uses both time-domain and frequency-domain experimental setups, as shown in Fig. 5. In time-domain setups, fluorophores are excited by a pulsed laser, such as a femtosecond or picosecond laser32. PMTs or avalanche photodiodes are used to detect the released photons, and TCSPC is used to record the arrival timings of the photons66. With this configuration, fluorescence decay curves may be measured precisely and evaluated to calculate lifetimes. High spatial resolution is guaranteed via a confocal or multiphoton microscope, and the fluorescence signals are separated by emission filters67. Alternatively, in the frequency-domain configuration, the fluorophore is excited by a modulated continuous-wave light source, such as a laser diode68. The modulation depth and phase shift of the released fluorescence with respect to the excitation light are measured by detectors. The excitation light is sinusoidally modulated at high frequencies, typically in the megahertz range, using an acousto-optic or electro-optic modulator. Fluorophores absorb and re-emit this modulated light with a time delay (phase shift) and reduced modulation depth due to their fluorescence lifetime. To measure these parameters, the system uses sensitive detectors such as PMT or avalanche photodiodes, which detect modulated fluorescence emission. A high-frequency signal generator synchronizes the excitation and detection processes, ensuring that both signals are referenced to the same modulation frequency69. The phase shift is determined by analyzing the time difference between the excitation and emission signals using phase-sensitive detection techniques like cross-correlation or lock-in amplification. Additionally, the modulation depth, defined as the ratio of AC to DC components of the emission signal, provides complementary lifetime data. By varying the excitation frequency and analyzing the resulting phase shifts and modulation depths, precise lifetime measurements can be obtained for fluorescence-based imaging and analysis. The fluorescence lifetimes are computed by processing the resulting data, which include phase shifts and modulation amplitudes. Compared with the time-domain technique, this method offers somewhat poorer temporal resolution but quicker imaging31. Both configurations make use of high-resolution microscopes and accurate detection systems; the frequency domain performs best in real-time imaging applications, whereas the time domain provides in-depth decay analysis32,70. Table 1 summarizes the key differences between the time domain and frequency domain FLIM.
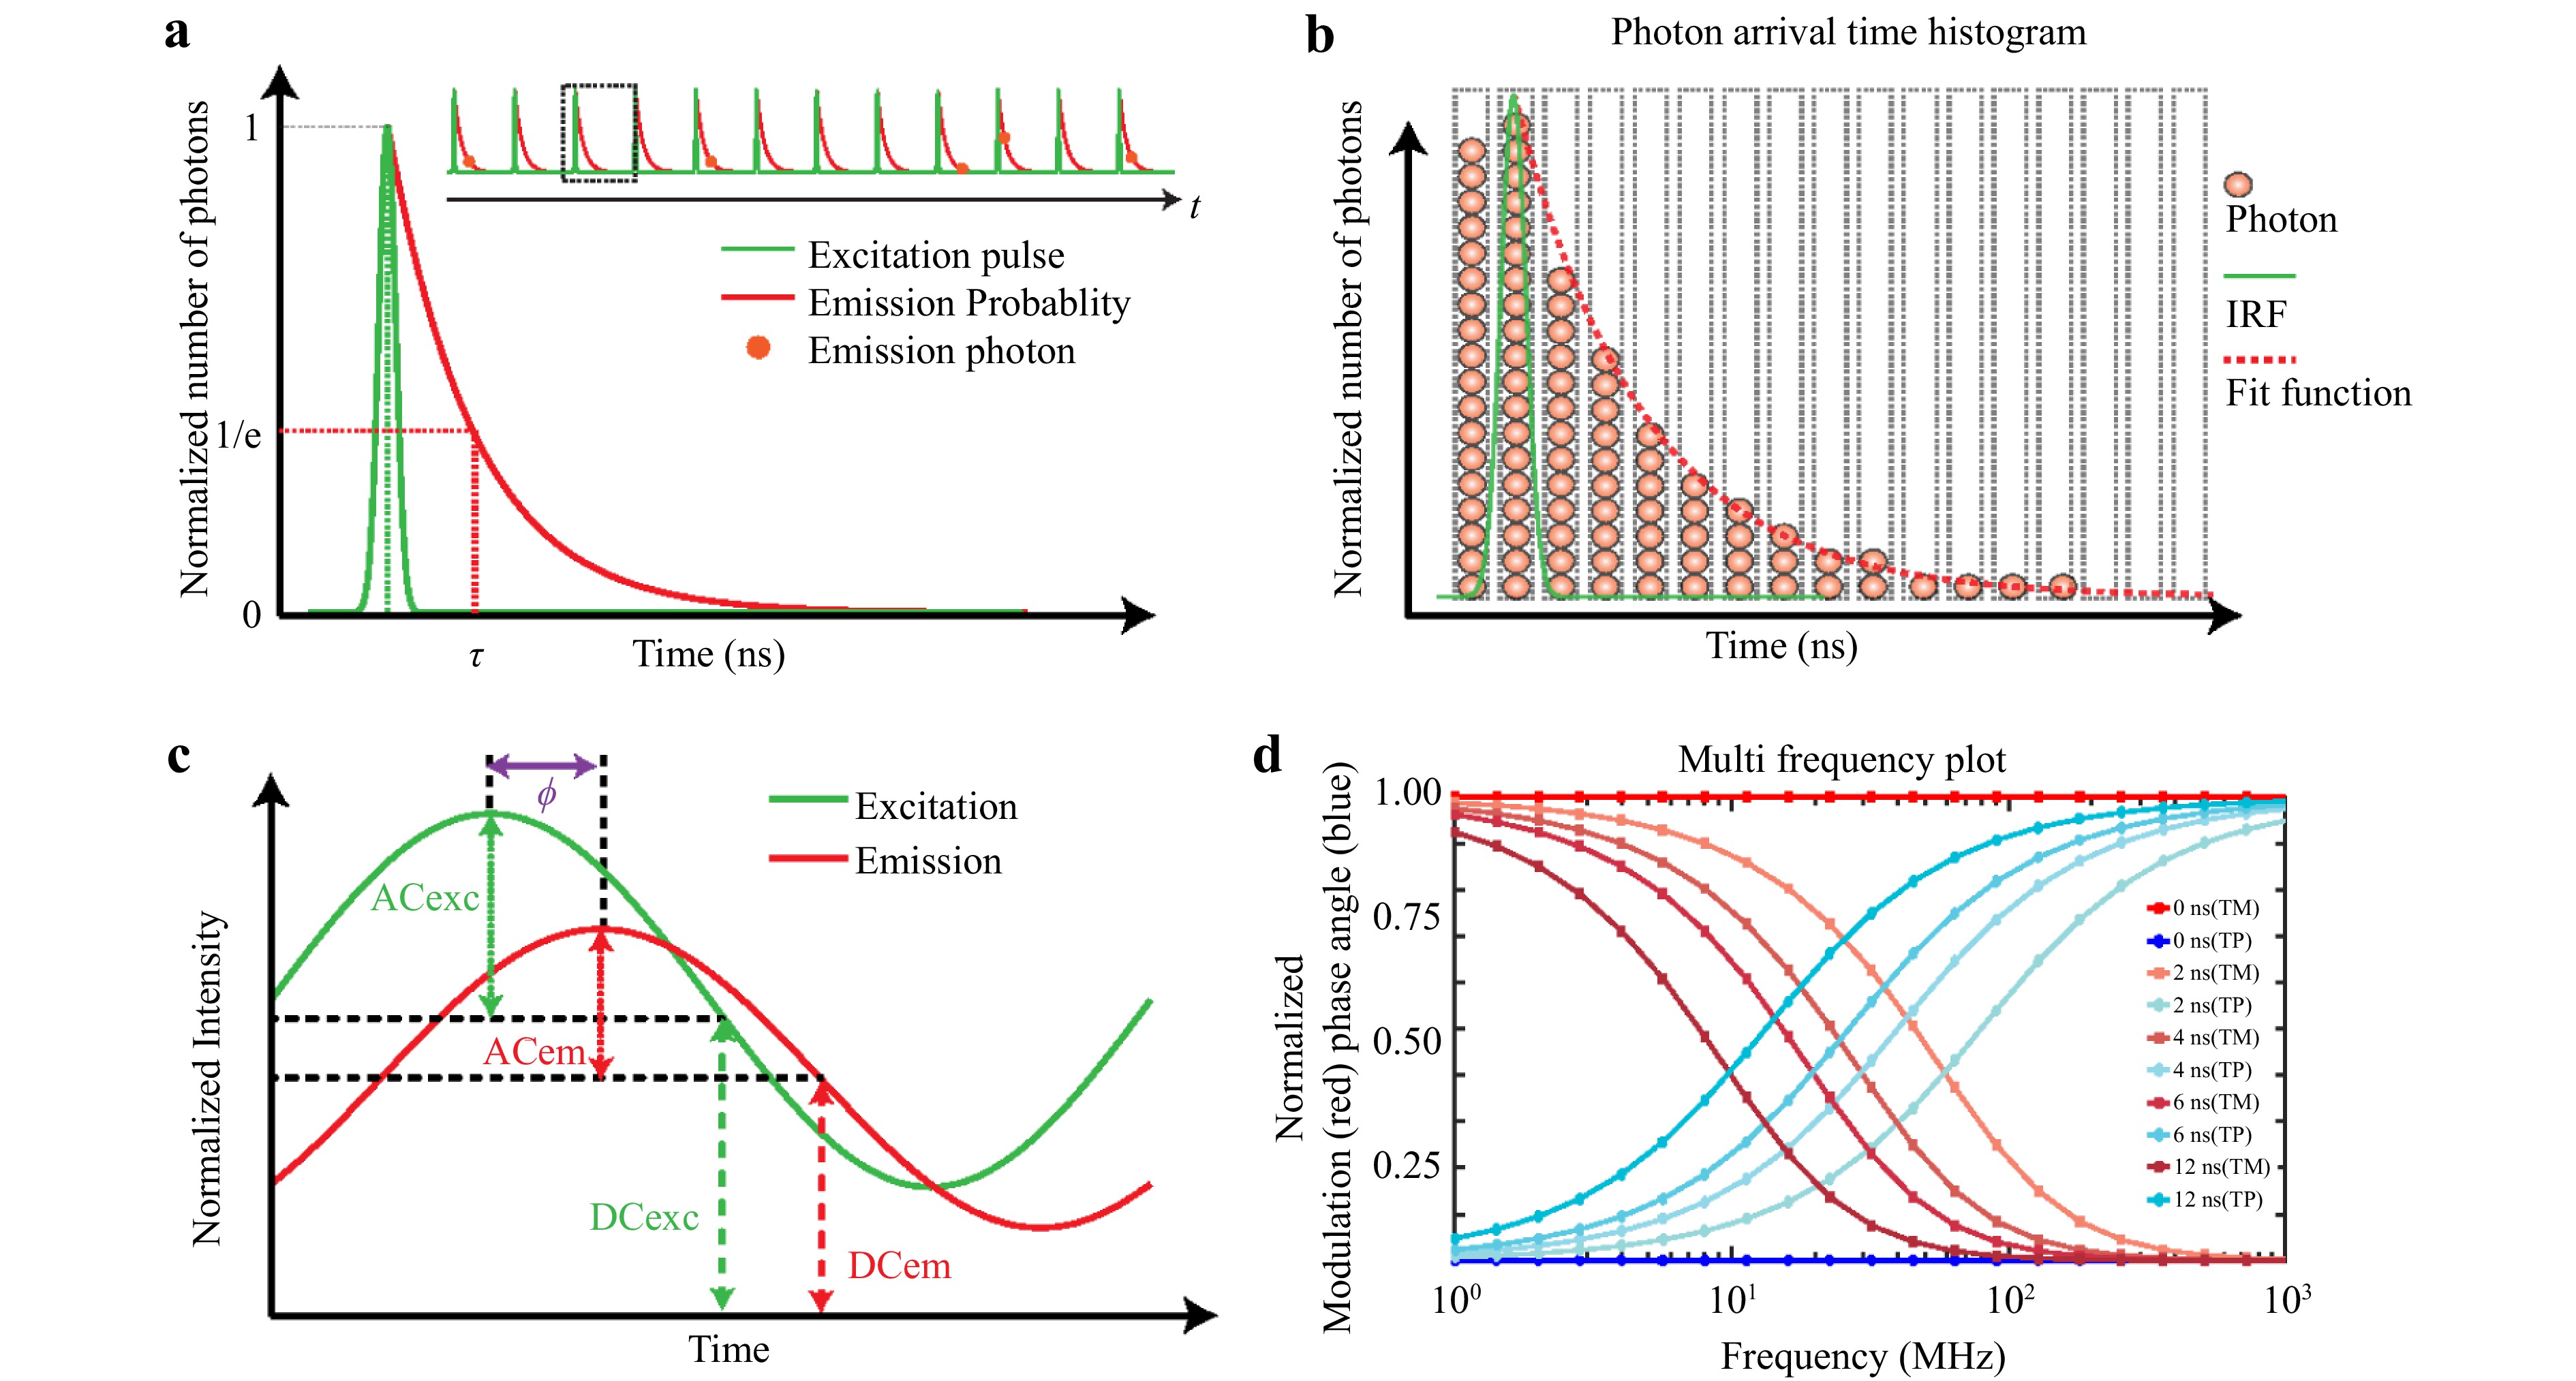
Fig. 5 Schematic diagram of time-domain and frequency-domain FLIM: a TCSPC measures fluorescence decay with lifetime (τ) defined at the 1/e value. b Photon time-of-arrival histogram with the IRF (green) and fitted function (red). c Frequency-domain FLIM uses modulated excitation and phase-shifted emission. d Modulation and phase shift versus frequency for different lifetimes (TM, TP)26.
Feature Time-Domain FLIM Frequency-Domain FLIM Measurement Technique Time-Correlated Single Photon Counting (TCSPC)71 Sinusoidal modulation of excitation light44 Excitation Short pulses of light (picosecond or femtosecond)35,71 Continuous sinusoidal modulation of excitation light35 Detection Time-resolved detection of fluorescence emission after excitation pulse72 Detection of phase shift and modulation of the fluorescence signal73 Fluorescence Signal Fluorescence decay curves over time, typically single exponential decay26,74 Fluorescence signal modulated in amplitude and phase by sinusoidal excitation75
Lifetime MeasurementLifetime (τ) determined by fitting the fluorescence decay curve26,76 Modulation and phase shift used to extract lifetime information35,77 Primary Output Fluorescence decay curve and lifetime (τ)72,78 Modulation depth and phase shift, from which lifetime is derived45 Data Acquisition Single photon detection events are recorded to construct the decay curve79 Phase and modulation depth are measured over various frequencies49,80 Temporal Resolution High temporal resolution (femtoseconds to nanoseconds)81 Moderate temporal resolution, depending on modulation frequency76,82 Sensitivity Sensitive to low photon counts due to TCSPC technique71 Sensitive to high photon counts with lower resolution compared to TCSPC83 Signal Processing Requires convolution or fitting of decay curves84 Requires measurement of phase shift and modulation depth32 Depth Sensitivity Depth sensitivity can be influenced by scattering; may require advanced fitting models for complex samples26 Depth sensitivity is influenced by modulation frequency and optical properties76 System Complexity Requires high-speed detectors, fast electronics, and a time-correlated photon counting system85 Requires modulation sources and phase-sensitive detectors86 Limitations Sensitive to low light levels; can be affected by photobleaching74,87 Requires high photon counts; can be affected by complex sample geometries71,88 Advantages High temporal resolution, direct measurement of fluorescence decay32,89 Faster data acquisition, reduced complexity in system setup44,90 Disadvantages Slow Acquisition Speed
Less suitable for dynamic processes
Limited to 2D imaging, requires high sensitivity detectors, affected by environmental parameters like pH, ion concentration, oxygen concentration, etc91,92Requires high photon flux, limited dynamic range, less sensitive to weak signals, affected by environmental parameters like pH, ion concentration, oxygen concentration, etc93,94 Applications High-resolution studies of fluorescence decay kinetics, single molecule dynamics78 Imaging in dynamic processes with less stringent timing requirements, faster acquisition of phase and modulation data90,95 Table 1. Comparative overview of Time-Domain and Frequency-Domain FLIM techniques
-
FLIM has become an essential tool for analyzing tumor metabolism and the tumor microenvironment, providing critical insights into cancer progression, metabolic adaptations, and therapeutic responses96. Tumor cells undergo significant metabolic reprogramming, often characterized by enhanced glycolysis, known as the Warburg effect. This shift results in altered levels and binding states of intrinsic fluorophores such as NADH and FAD, which can be quantified via FLIM97. By measuring fluorescence lifetimes and calculating redox ratios, FLIM enables the distinction between tumor cells and normal tissues. In 1992, Schneckenburger and Koenig carried out the first investigation into cellular metabolism using a yeast model to measure the fluorescence lifetimes of intrinsic NADPH and flavins98. Since then, much more research has been conducted, particularly in the context of cancer metabolism. Cong et al. compared the behavior of the 4T1 breast cancer cell line in a 3D model that mimics in vivo conditions to that of 2D cell culture via FLIM. By blocking monocarboxylate transporters or targeting mitochondria and interfering with oxidative phosphorylation, scientists have investigated the reactions of two new therapeutic candidates that target metabolism99. According to their research, the effects of chemicals on cell culture conditions vary significantly. In a collagenous matrix, three-dimensional cells develop spherical acini and anastomose multicellular networks, but in a two-dimensional cell culture, the chemicals cause the formation of epithelial plaques. Furthermore, since there are more enzyme-bound NAD(P)H molecules in the 3D matrix, the fluorescence lifetimes of cellular NAD(P)H are longer99. Other studies have demonstrated shorter fluorescence lifetimes in basal cell carcinoma (BCC) and squamous cell carcinoma (SCC) tissues than in surrounding healthy tissues, reflecting their altered metabolic profiles100. The tumor microenvironment is crucial to cancer progression and involves extracellular acidification, matrix breakdown, and changes in intercellular spacing and cellular shape, all of which drive tumor invasion and metastasis. The fluorescence lifetimes of NAD(P)H and FAD, which are sensitive to factors such as pH, temperature, conformational state, and proximity to quenchers, can be effectively monitored via FLIM to detect microenvironmental changes, such as shifts in the extracellular pH induced by glycolysis28,101. In engineered tumor models, FLIM has been used to measure pH quantitatively, revealing how acidic microenvironments reshape the extracellular matrix and promote metastasis102. Moreover, FLIM-based imaging of the mitochondrial membrane potential has revealed hyperpolarization in cancer cells compared with normal cells, further elucidating metabolic differences103. FLIM also facilitates the study of dynamic molecular interactions within tumor cells and their microenvironment. Techniques such as FLIM-FRET (Förster resonance energy transfer) have been employed to explore protein-protein interactions critical to tumor behavior104. For example, the interaction between podoplanin and CD44 has been linked to increased tumor cell migration, whereas the activity of RhoA, a driver of cell motility in metastasis, has been tracked in invasive carcinomas105. Additionally, FLIM-FRET has enabled visualization of caspase-3 activity during apoptosis, shedding light on drug-induced cell death mechanisms106. Exogenous fluorophores, such as protoporphyrin IX induced by 5-aminoLaevulinic acid, have enhanced FLIM’s ability to detect malignancies such as glioblastomas, allowing for the differentiation of malignant and healthy tissues107. This feature highlights FLIM’s potential as a minimally invasive diagnostic tool in clinical oncology. FLIM provides unmatched information about the microenvironmental dynamics and metabolic heterogeneity of malignancies. It is a flexible tool for improving cancer diagnosis, tracking treatment outcomes, and directing the creation of tailored medicines because of its capacity to assess both intrinsic and extrinsic indicators26. As a minimally invasive and highly informative technique, FLIM holds significant promise in both research and clinical oncology. Fig. 6 illustrates the application of FLIM for analyzing tumor metabolism and the tumor microenvironment. FLIM can be used to assess metabolic heterogeneity in solid tumors by measuring fluorescence decay characteristics, which correlate with the metabolic states of cells. Cancer cell cultures with altered metabolism are visualized via FLIM, and fluorescence decay parameters are analyzed to identify subpopulations with distinct metabolic profiles. AI-based segmentation enhances cell identification, allowing precise clustering of fluorescence lifetime parameters, which helps in differentiating metabolic states within the tumor microenvironment. This approach provides valuable insights into tumor heterogeneity and the metabolic behavior of cancer cells108. Another study highlighted the use of optical metabolic imaging to analyze tumor metabolism and microenvironment heterogeneity. Autofluorescence imaging of NAD(P)H and FAD, combined with single-cell analysis, revealed metabolic shifts and cellular heterogeneity induced by the cetuximab and cisplatin treatments in vivo. Quantitative tools such as heterogeneity indices and dimensionality reduction techniques offer insights into tumor microenvironment dynamics, aiding in targeted therapy optimization109. An in vivo study by Skala et al investigated the use of multiphoton FLIM to study changes in cellular metabolism linked to cancer development. This method involves perturbing cell cultures with specific metabolic inhibitors to quantify the lifetime and abundance of NADH. The results showed that FLIM can differentiate normal and precancerous tissues on the basis of the lifetime of protein-bound NADH, with decreased abundance in low-grade precancers. This study highlighted FLIM’s potential for noninvasive metabolic imaging and cancer detection110.
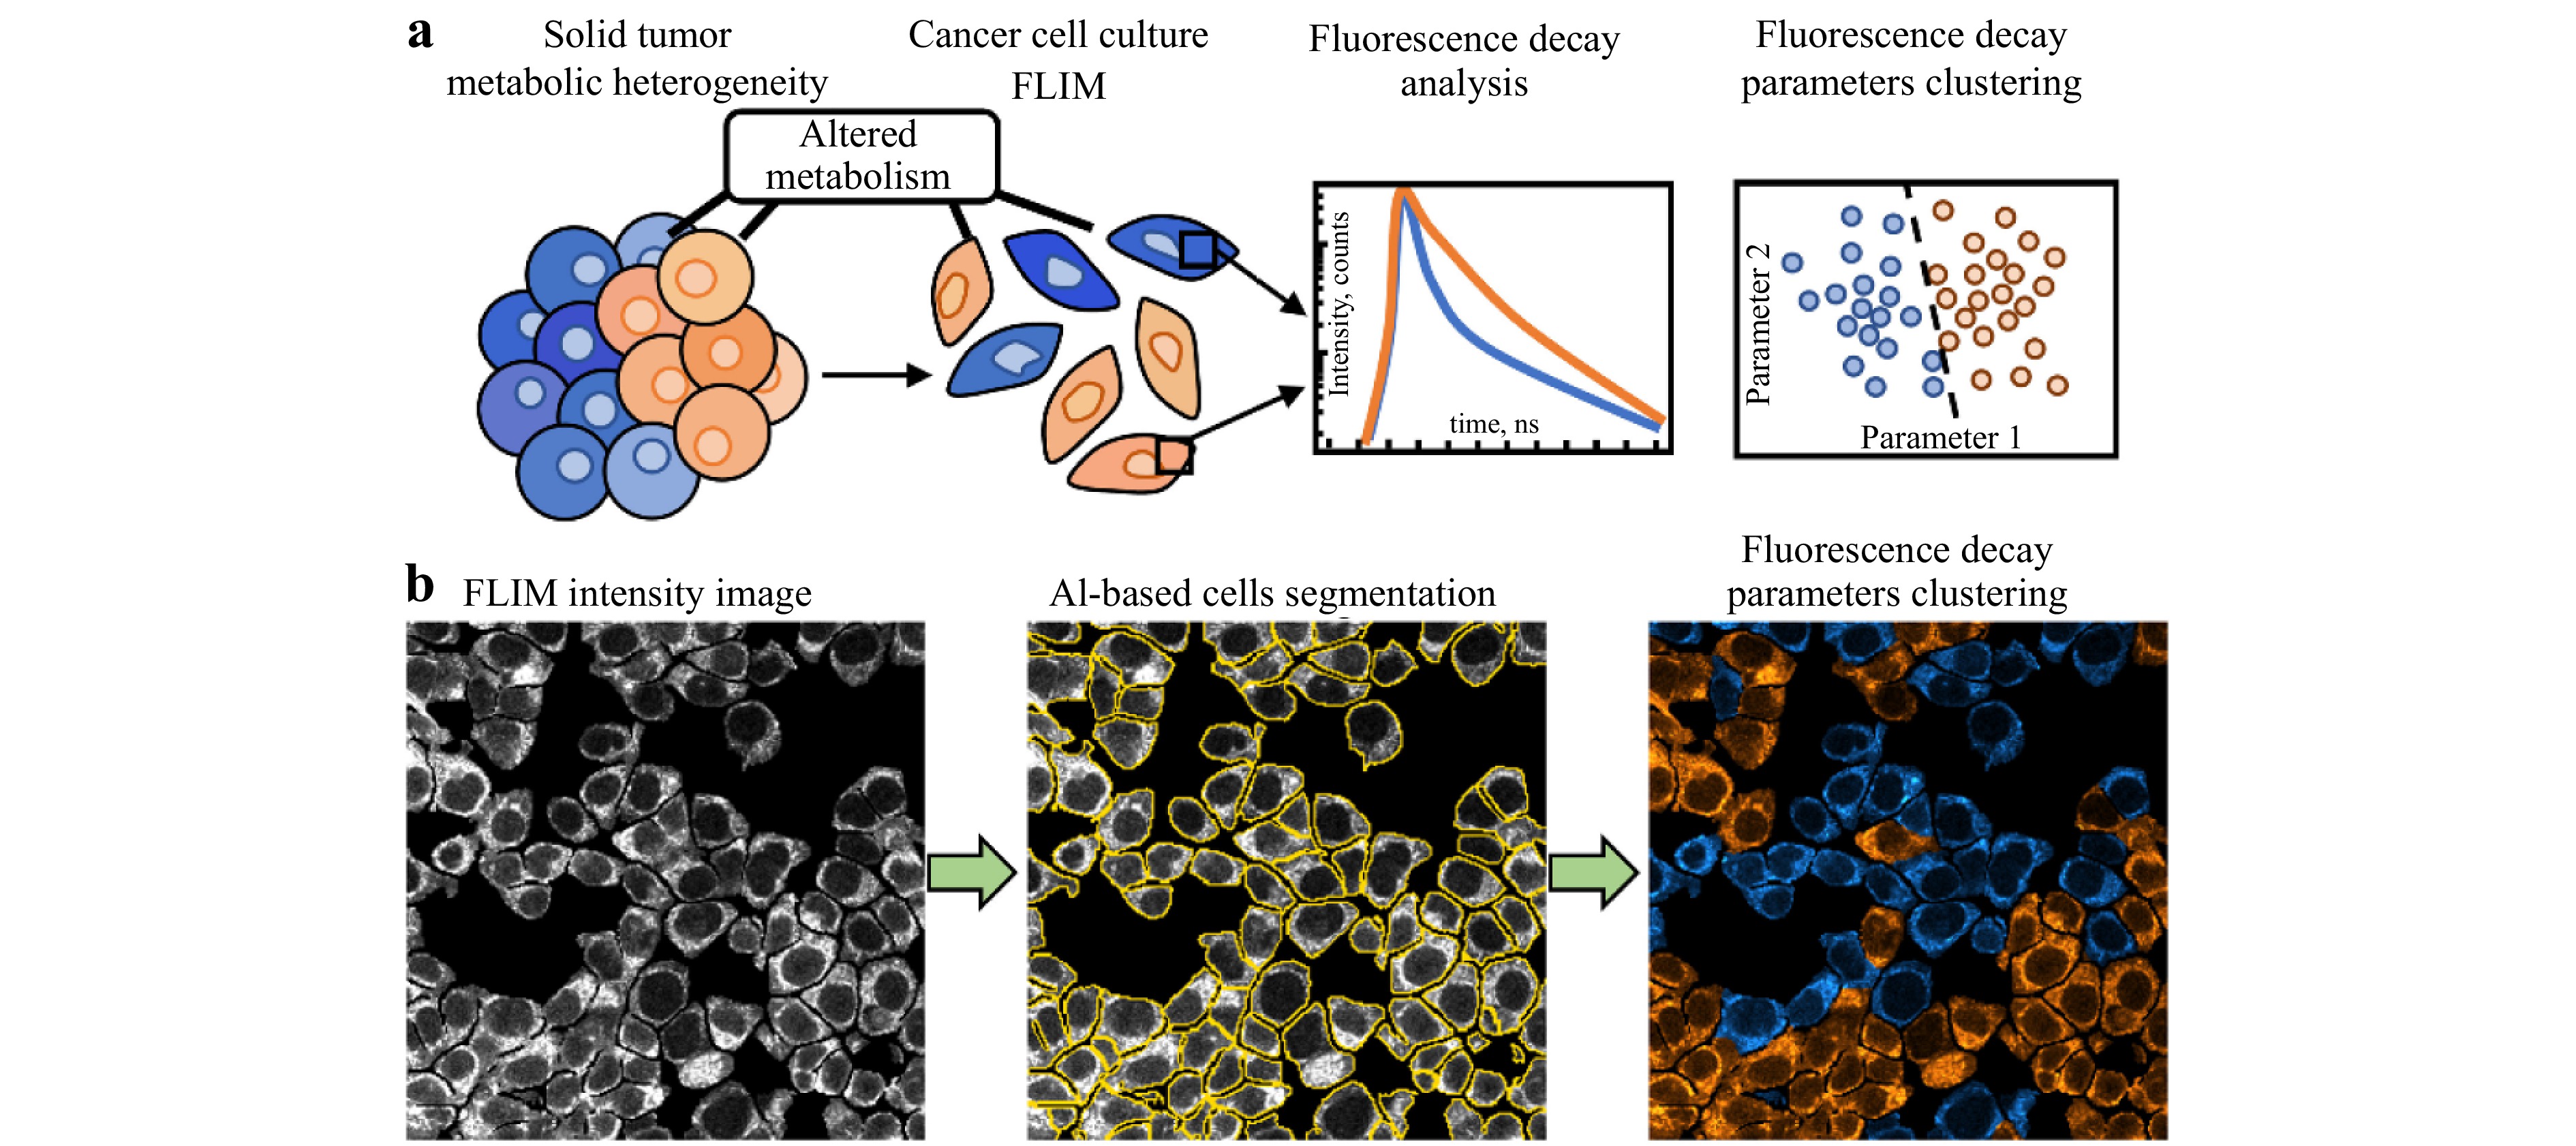
Fig. 6 Illustration of tumor metabolic heterogeneity evaluation via FLIM. a Schematic representation of the use of FLIM to analyze tumor metabolic heterogeneity, highlighting the process from altered metabolism detection to clustering of fluorescence decay parameters. b Workflow of FLIM data processing: (left) FLIM intensity image, (middle) AI-based cell segmentation, (right) clustering of fluorescence decay parameters108.
-
FLIM has emerged as a powerful tool in cancer research, particularly for metabolic profiling of key cofactors such as NADH and FAD101. Instead of the conventional intensity-based FAD/NAD(P)H ratio, the study introduced FLIM-based redox measurements (FLIRR), calculated as (NADH-a2% / FAD-a1%), where a2% represents the fractional contribution of enzyme-bound NADH and a1% represents the fractional contribution of enzyme-bound FAD. Since enzyme-bound NADH increases and enzyme-bound FAD decreases during oxidative phosphorylation, FLIRR provides a dynamic measure of metabolic shifts. Cells were imaged under different metabolic conditions, including starvation, glucose addition, and drug treatments, to assess redox dynamics (Fig. 7)111. These auto-fluorescent molecules are central to cellular metabolism and exist in distinct states that reflect specific metabolic pathways. Fig. 8 provides a visual representation of how NADH and FAD participate in glycolysis, oxidative phosphorylation, and the Krebs cycle, revealing their role in cancer metabolism112. By measuring the fluorescence lifetimes of free and protein-bound NADH as well as oxidized and reduced FAD, FLIM offers real-time insights into cellular metabolic dynamics113. Unlike traditional imaging techniques, FLIM provides spatial and temporal resolution without being affected by fluorophore concentration or photobleaching, making it a robust method for live-cell studies. Cancer cells often exhibit metabolic reprogramming, notably the Warburg effect, which is characterized by increased reliance on glycolysis despite the presence of oxygen114. FLIM distinguishes between the metabolic states of cancer cells and normal cells by detecting shifts in the fluorescence lifetimes of NADH and FAD. Bound NADH, with longer fluorescence lifetimes (~3-5 ns), indicates oxidative phosphorylation, whereas free NADH, with shorter lifetimes (~0.3-0.5 ns)115, is correlated with glycolytic activity. Similarly, shorter fluorescence lifetimes of the FAD (~0.1-0.4 ns) signal an increase in metabolic activity and oxidative stress29. These measurements provide unique metabolic fingerprints for cancer cells, enabling the identification of tumor heterogeneity, monitoring of cancer progression, and evaluating therapeutic responses. The application of FLIM extends beyond diagnostics. It has been utilized in high-throughput drug screening, allowing researchers to monitor metabolic changes induced by candidate therapies in real time. Furthermore, FLIM-derived data are being explored as potential biomarkers for distinguishing malignant from benign tissues and for identifying cancer subtypes116. Recent studies have highlighted its use in assessing glycolytic activity, evaluating mitochondrial function, and calculating redox states in live cells117. Despite its advantages, including high-resolution imaging and concentration-independent measurements, FLIM faces challenges such as high costs, technical complexity, and slower imaging speeds than conventional confocal microscopy27. Nevertheless, ongoing advancements aim to address these limitations, making FLIM increasingly accessible and versatile. Its growing adoption underscores its potential to advance both fundamental research and clinical diagnostics, positioning it as a cornerstone in the exploration of cancer metabolism. The first study focused on the use of FLIM to analyze cellular metabolism by assessing the fluorescence lifetimes of NAD(P)H, FAD, and Flavin Mononucleotide (FMN). The introduction of the fluorescence lifetime-induced redox ratio (FLIRR) 1 index, which compares protein-bound NAD(P)H to FAD, effectively distinguished metabolic differences between HaCaT keratinocytes and SCC4 tumor cells, with FMN further refining these assessments owing to its higher fluorescence quantum yield. These results highlight FLIM’s potential for differentiating normal and tumor cells, providing a robust tool for cancer diagnostics and metabolic profiling13. Another similar study used FLIRR (NADH-a2%/FAD-a1%), a FLIM-based redox metric validated against intensity ratios, to assess metabolic shifts during oxidative phosphorylation. Segmented analysis and ROI assays distinguish glycolysis from oxidative phosphorylation in both cancer cells and xenografts. This method highlights metabolic heterogeneity and enhances the understanding of cellular responses to therapeutic interventions111. Drozdowicz-Tomsia used FLIM to measure NAD(P)H and FAD lifetimes in precancerous MCF10A cells after treatment with metabolic inhibitors. It showed that FLIM-based NAD(P)H and FAD lifetime and ratio analysis sensitively detects metabolic changes, outperforming traditional lactate-based assays118. Similarly, Zhang et al. (2004) reported an increased FAD/(NADH+FAD) redox ratio in rat glioma cells after photodynamic therapy (PDT), suggesting the occurrence of mitochondrial oxidative stress119. In vivo, FLIM has been used to differentiate tumor types, with shorter NADH lifetimes noted in melanoma cells than in basalioma cells, aiding in diagnosis. Furthermore, intraoperative FLIM imaging has enabled the delineation of brain tumor resection margins by distinguishing glycolytic tumor tissue from normal cells. Ex vivo studies on biopsy samples have corroborated these findings, as Shah and Skala reported shorter NADH and FAD lifetimes in head and neck cancer tissues120, and Natal et al. reported similar results in breast tumors with desmoplastic reactions, highlighting aggressive metabolic activity121. Early diagnostic potential was further demonstrated by Fatakdawala et al., who reported lower NADH lifetimes in oral tumors than in normal tissues122. Additionally, altered mean FAD lifetimes in glioblastoma cells underscore the metabolic heterogeneity within tumors, providing diagnostic and prognostic insights. Subsequent studies have advanced FLIM for analyzing cellular redox states via the use of endogenous fluorophores such as NAD(P)H, FAD/FMN, and tryptophan. A novel redox metric, NAD(P)H-a2%, simplifies imaging while providing accurate insights into mitochondrial and cytosolic dynamics. The heterogeneity of cancer cells highlights metabolic differences in oxidative phosphorylation and glycolysis and predicts drug responses, as shown in HeLa and prostate cancer models123. Another study demonstrated that NADH lifetime measurements effectively distinguished normal from precancerous tissues. The lifetime and contribution of protein-bound NADH significantly decreased in precancers, which was correlated with increased glycolysis. The intracellular variability in NADH lifetimes and redox ratios increased in precancerous cells, indicating mitochondrial heterogeneity. Lifetime imaging has been shown to be less sensitive to absorption, offering noninvasive metabolic mapping for early cancer detection124,125. Overall, these studies exemplify FLIM’s ability to assess cancer metabolism, enhance diagnosis, and evaluate therapeutic efficacy.
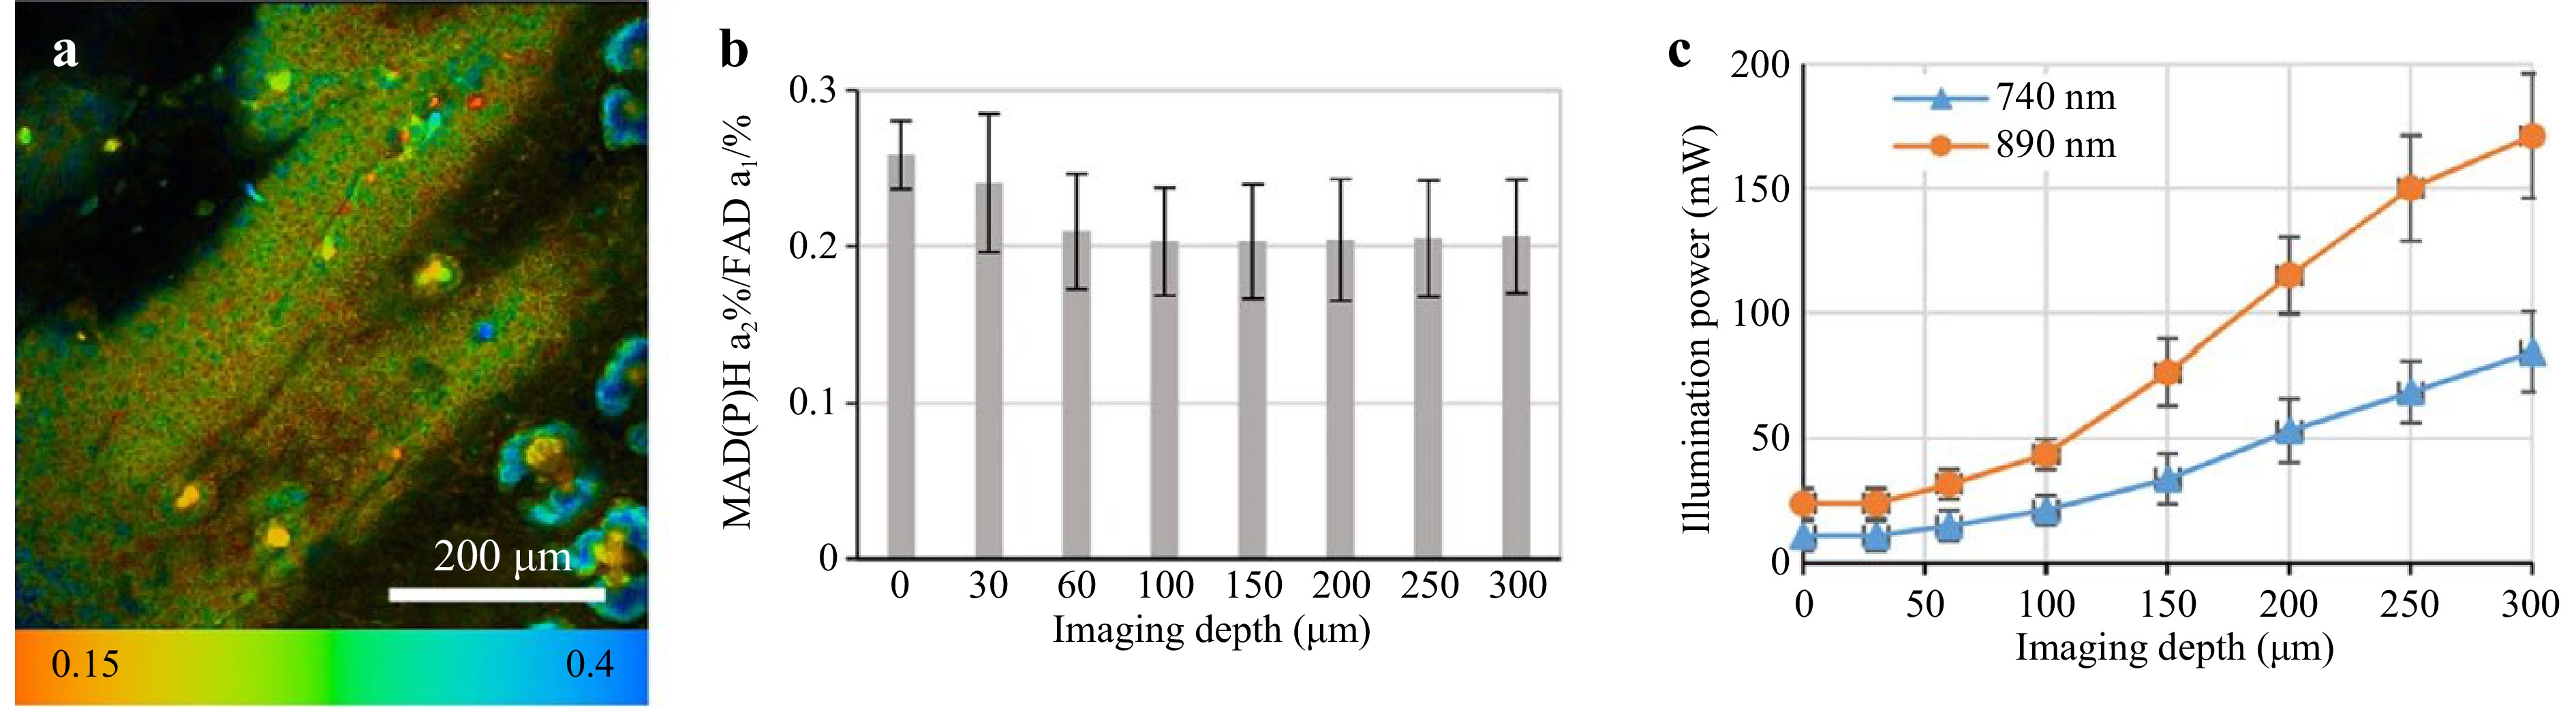
Fig. 7 a FLIRR imaging of a tumor xenograft mouse model was performed at 60 µm depth using a 25 × 0.8NA immersion lens to capture NAD(P)H-a2%/FAD-a1% fluorescence. b Mean FLIRR values were analyzed at different depths using ROI assay, avoiding bright structures like sebaceous glands. At 0 and 30 µm, FLIRR reflected epidermal fluorescence rather than tumor metabolism. c Excitation power was increased with imaging depth to counteract light scattering and absorption while maintaining fluorescence intensity near 105 photons/s to prevent FLIM detector saturation111.
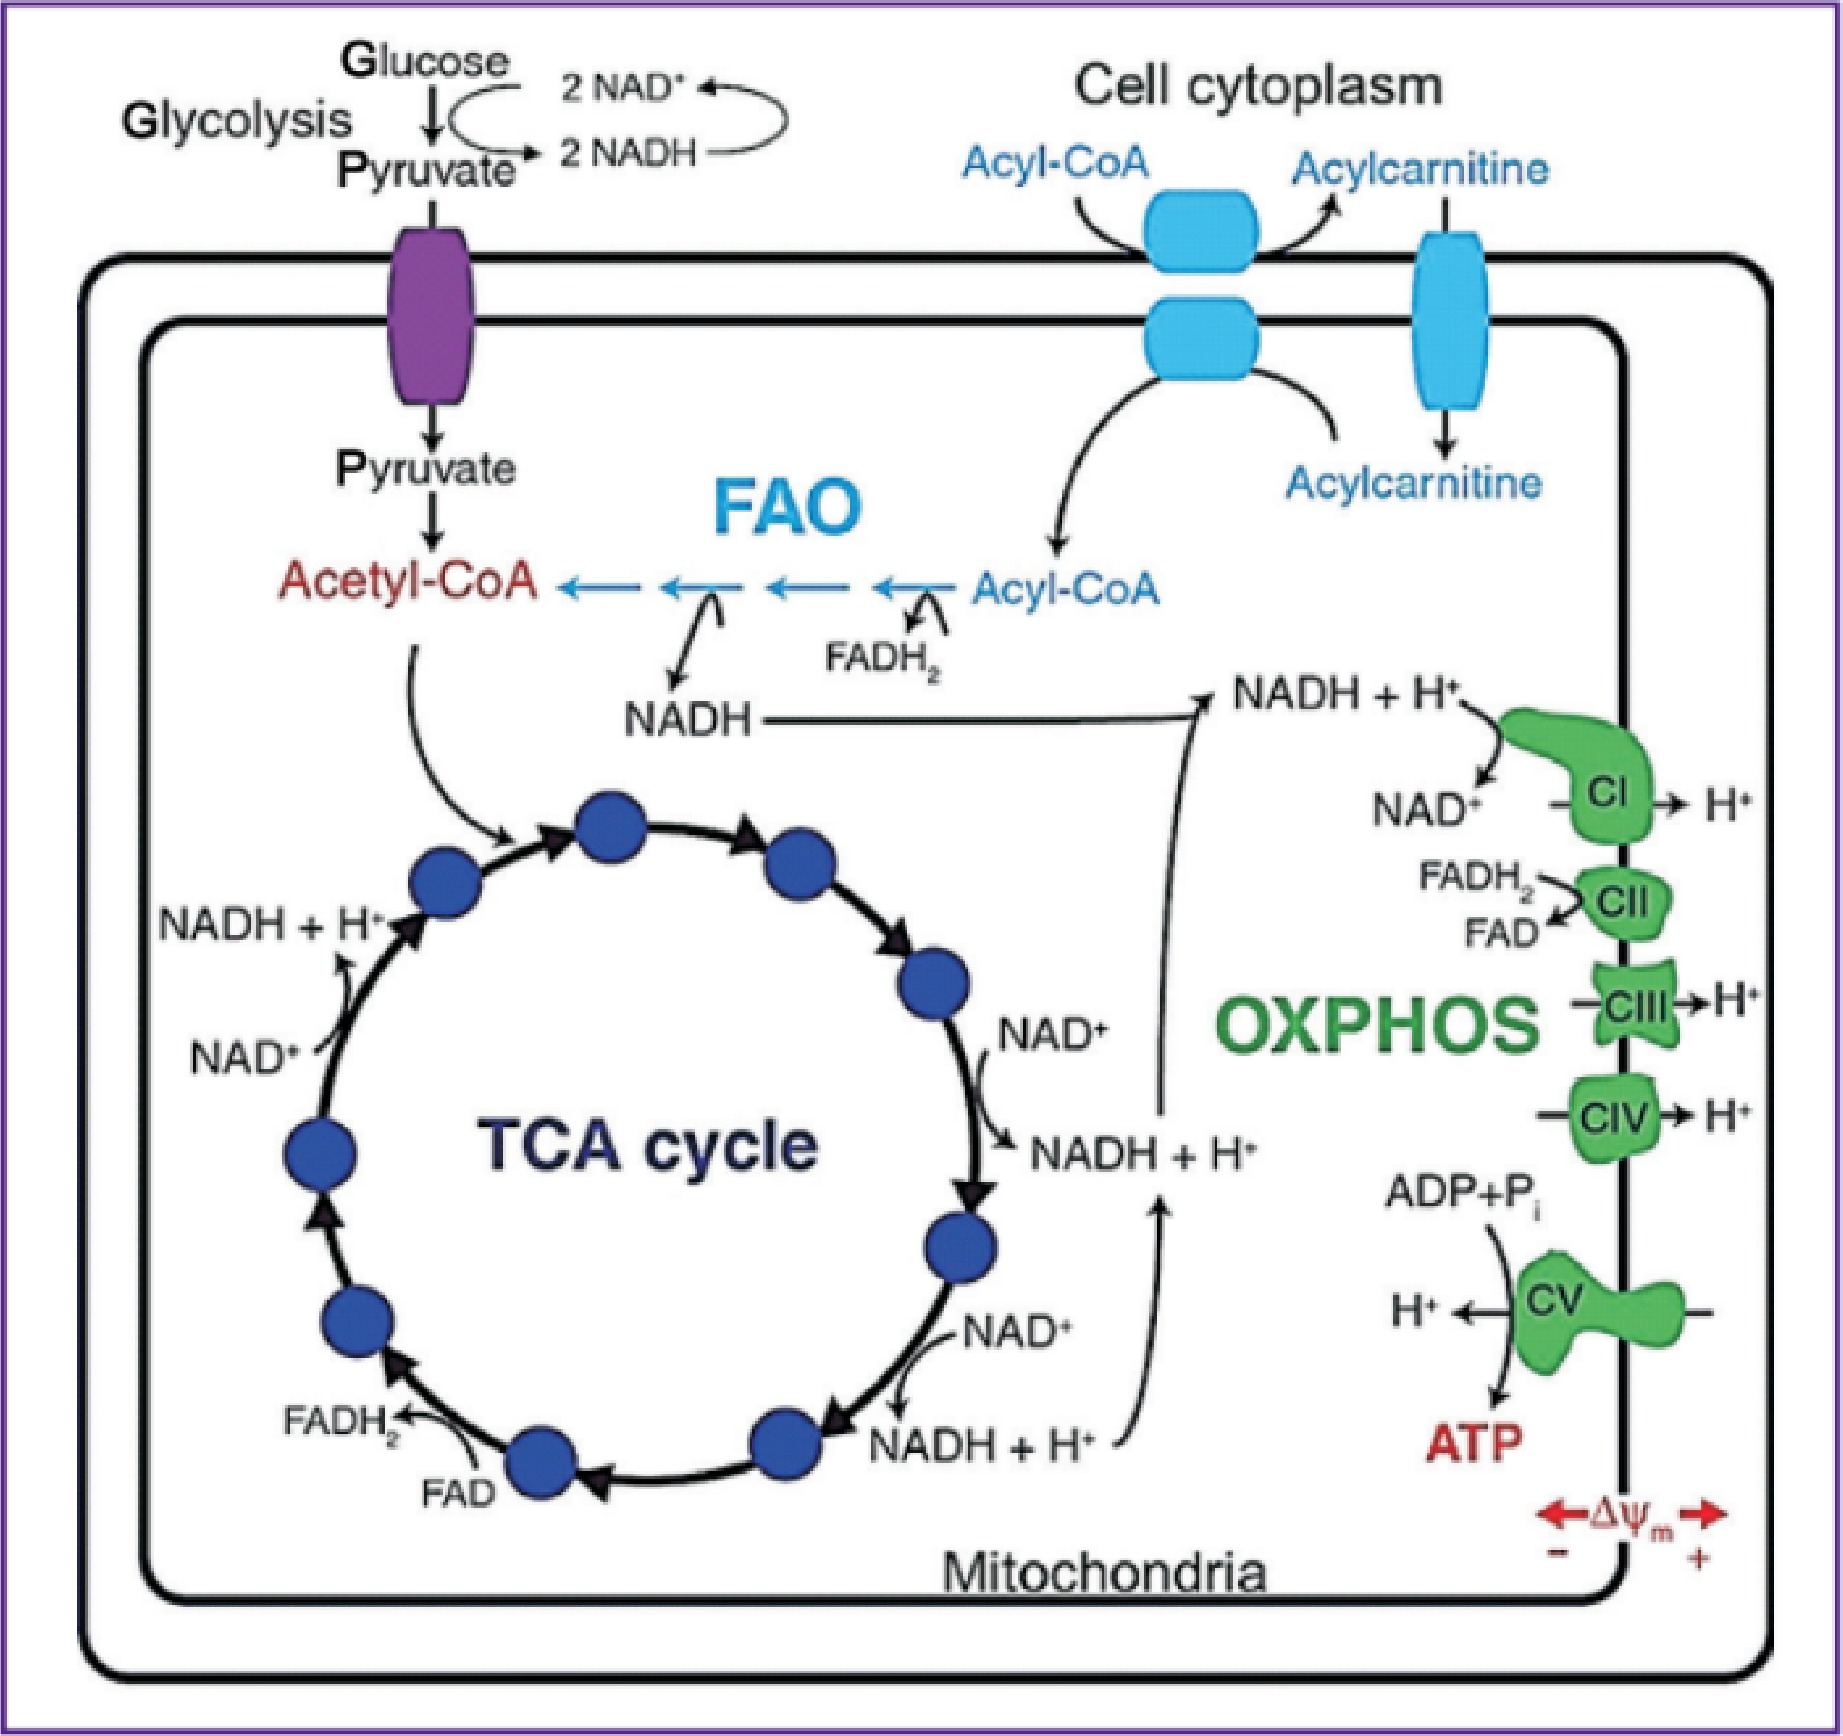
Fig. 8 Schematic representation of NADH and FAD involvement in cellular energy metabolism, illustrating their key roles in glycolysis, fatty acid oxidation (FAO), the tricarboxylic acid (TCA) cycle, and oxidative phosphorylation. Glycolysis in the cytoplasm converts glucose into pyruvate, producing NADH. Pyruvate enters mitochondria and fuels the TCA cycle, where NADH and FADH2 are generated from metabolic intermediates. Fatty acids undergo β-oxidation (FAO), producing acetyl-CoA, which also feeds into the TCA cycle, generating additional NADH and FADH2. These electron carriers donate electrons to the electron transport chain (ETC) during oxidative phosphorylation, driving ATP production through ATP synthase (Complex V). FLIM enables differentiation between free and protein-bound NADH/FAD, offering insights into redox balance, mitochondrial function, and metabolic shifts112.
-
FLIM has emerged as a vital tool in cancer therapy, enabling precise monitoring of drug delivery and efficacy. By utilizing fluorescence lifetime differences, FLIM provides a more sensitive method to analyze drug delivery pathways126,127. For example, FLIM revealed that exosomes (EXOs) deliver drugs via endocytosis, whereas microvesicles (MVs) utilize both endocytosis and membrane fusion128. Liposomal drug delivery systems, such as Doxoves®, have also been studied via FLIM to evaluate the impact of biomolecular corona formation, which alters synthetic liposome identities, leading to drug leakage and reduced efficacy. FLIM imaging has further elucidated the mechanisms of low nuclear internalization efficiency in liposomal doxorubicin, as shown in Fig. 9, facilitating improvements in its clinical utility14,129. Additionally, FLIM has been employed in novel nanomedicine systems. For example, gold-doxorubicin nanocomplexes (Au-Dox) demonstrated selective nuclear entry in melanoma cells while sparing normal cells, reducing cardiotoxicity130. FLIM has also revealed enhanced anticancer efficacy in graphene oxide-doxorubicin systems through intracellular drug release mechanisms131. Advanced systems such as PAH-Cit-Dox and pH-sensitive AuNPs@gelatin-hyd-Dox have been optimized by FLIM to map drug distribution within cells132. The first study utilized FLIM-FRET to monitor Src kinase activity in pancreatic ductal adenocarcinoma cells treated with the Src inhibitor dasatinib. Following treatment, fluorescence lifetime distribution shifts were observed, enabling the classification of cells as “active” or “inactive” based on a 2.35-nanosecond cutoff. This approach allows single-cell resolution analysis of Src activity, overcoming the limitations of population averages. Additionally, FLIM-FRET generated a rapid pharmacodynamic dose-response curve for dasatinib, highlighting its potential as a dynamic, single-cell biomarker for evaluating drug efficacy in cancer therapy133. A subsequent study used FLIM to measure the fluorescence lifetime of the nucleus in human erythroleukemic cells treated with anticancer drugs. Doxorubicin (Dox) and epirubicin (EPI) caused a decrease in fluorescence lifetime, with EPI showing a faster decrease, whereas cyclophosphamide (CPA) had no effect. This study highlights FLIM’s ability to detect early apoptotic changes and evaluate the efficacy of different anticancer drugs, offering a valuable tool for assessing drug response in cancer therapy134. In another study, the toxicity of DOX and Au-Dox on B16 melanoma cells and cardiomyocytes was examined. The decreased toxicity in healthy tissue was explained by FLIM, which revealed that Au-Dox remained endosomal in cardiomyocytes but accumulated in melanoma cell nuclei. These results point to the potential of Au-Dox for more focused cancer treatment with fewer side effects130. A different study used FLIM to examine the kinetics and cellular absorption of extracellular vesicles (EVs) loaded with paclitaxel. It was discovered that MVs employ both endocytosis and membrane fusion to deliver the medication, whereas EXOs primarily use endocytosis. FLIM improves the use of EVs as tailored medication delivery devices by providing real-time analytics128. Fluorescent Nanocarbon/Graphene oxide nanohybrid as a drug nanocarrier for imatinib mesylate, a first-generation tyrosine kinase inhibitor, in K562 human erythroleukemic cells Further study demonstrated the application of FLIM in monitoring the use of the. FLIM effectively tracks the therapeutic efficacy and drug delivery of nanohybrids135. Overall, FLIM provides a powerful tool for real-time monitoring of drug delivery, enabling detailed analysis of drug uptake, release mechanisms, and intracellular dynamics, which enhances the understanding of drug efficacy and optimization in targeted therapies.
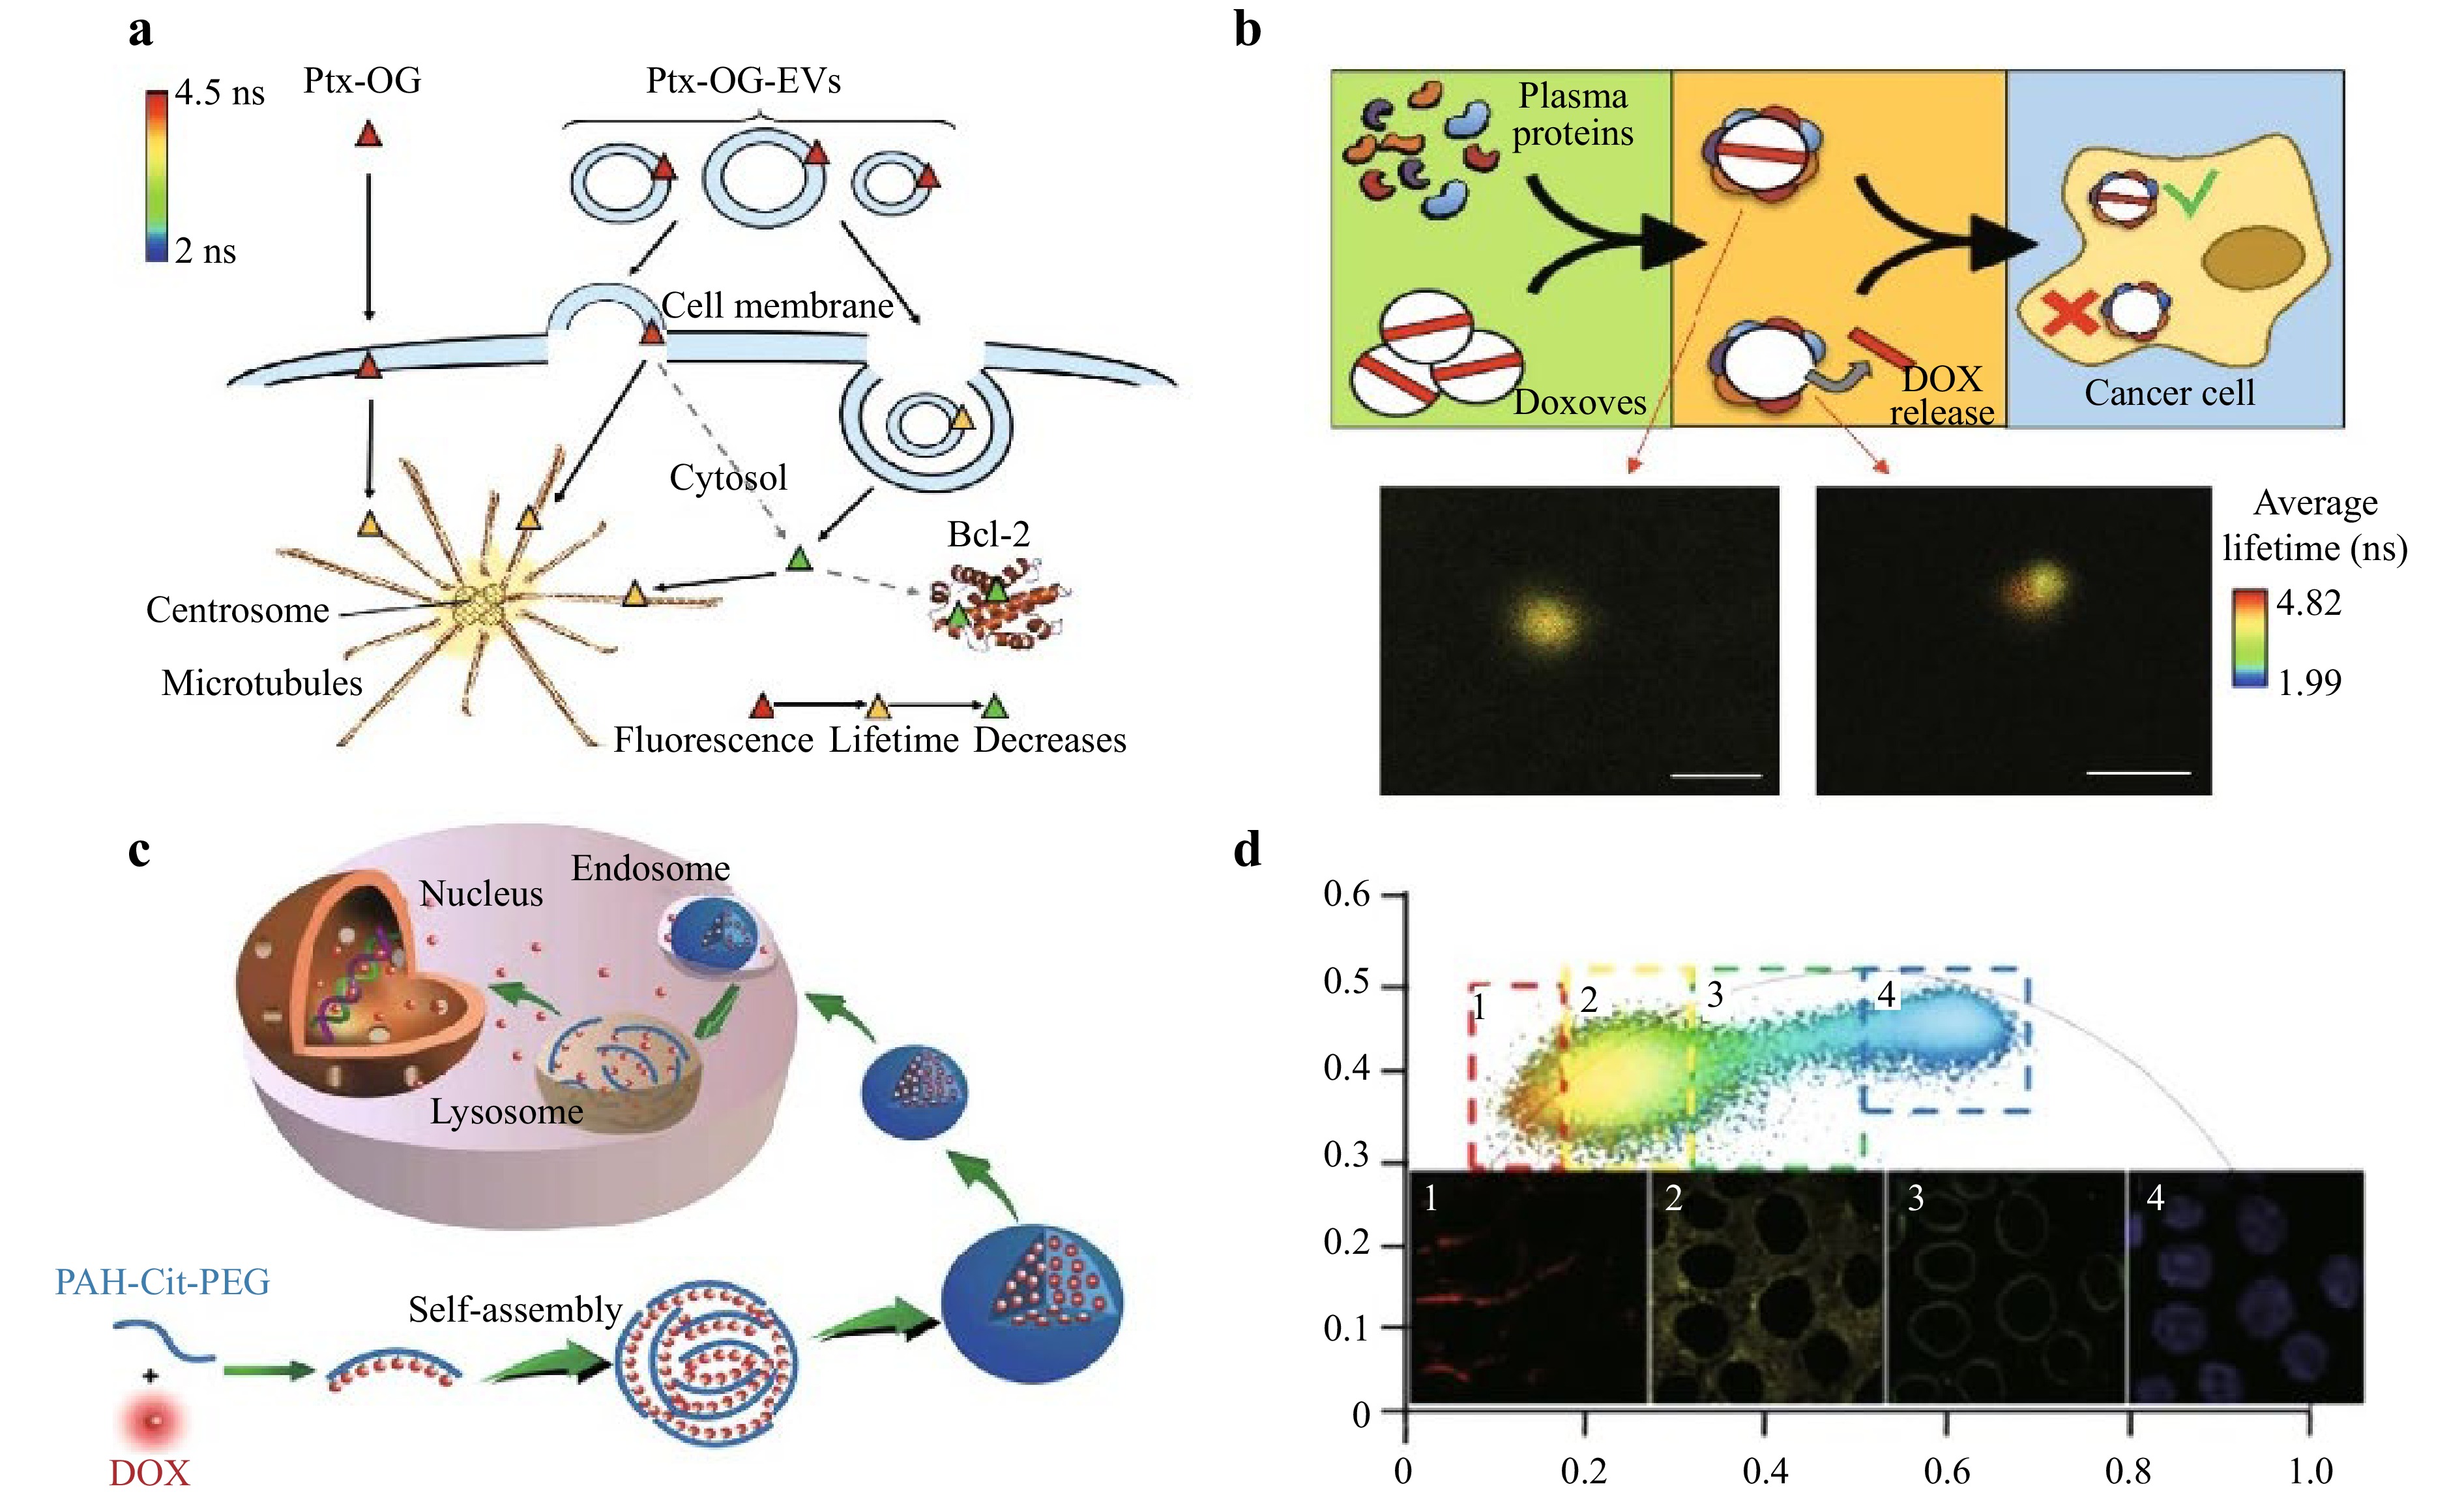
Fig. 9 Application of FLIM in drug delivery. Panel a shows the interaction of paclitaxel (Ptx-OG), and its fluorescence lifetime changes as it moves across the cell membrane into the cytosol. Panel b shows the release of the chemotherapy drug doxorubicin (DOX) from doxorubicin-loaded vesicles (Doxoves) within cancer cells, as monitored via FLIM. Panel c describes the intracellular trafficking and drug release mechanisms of drug-loaded nanoparticles, and panel d shows FLIM images of drug-loaded nanoparticles within cells14.
-
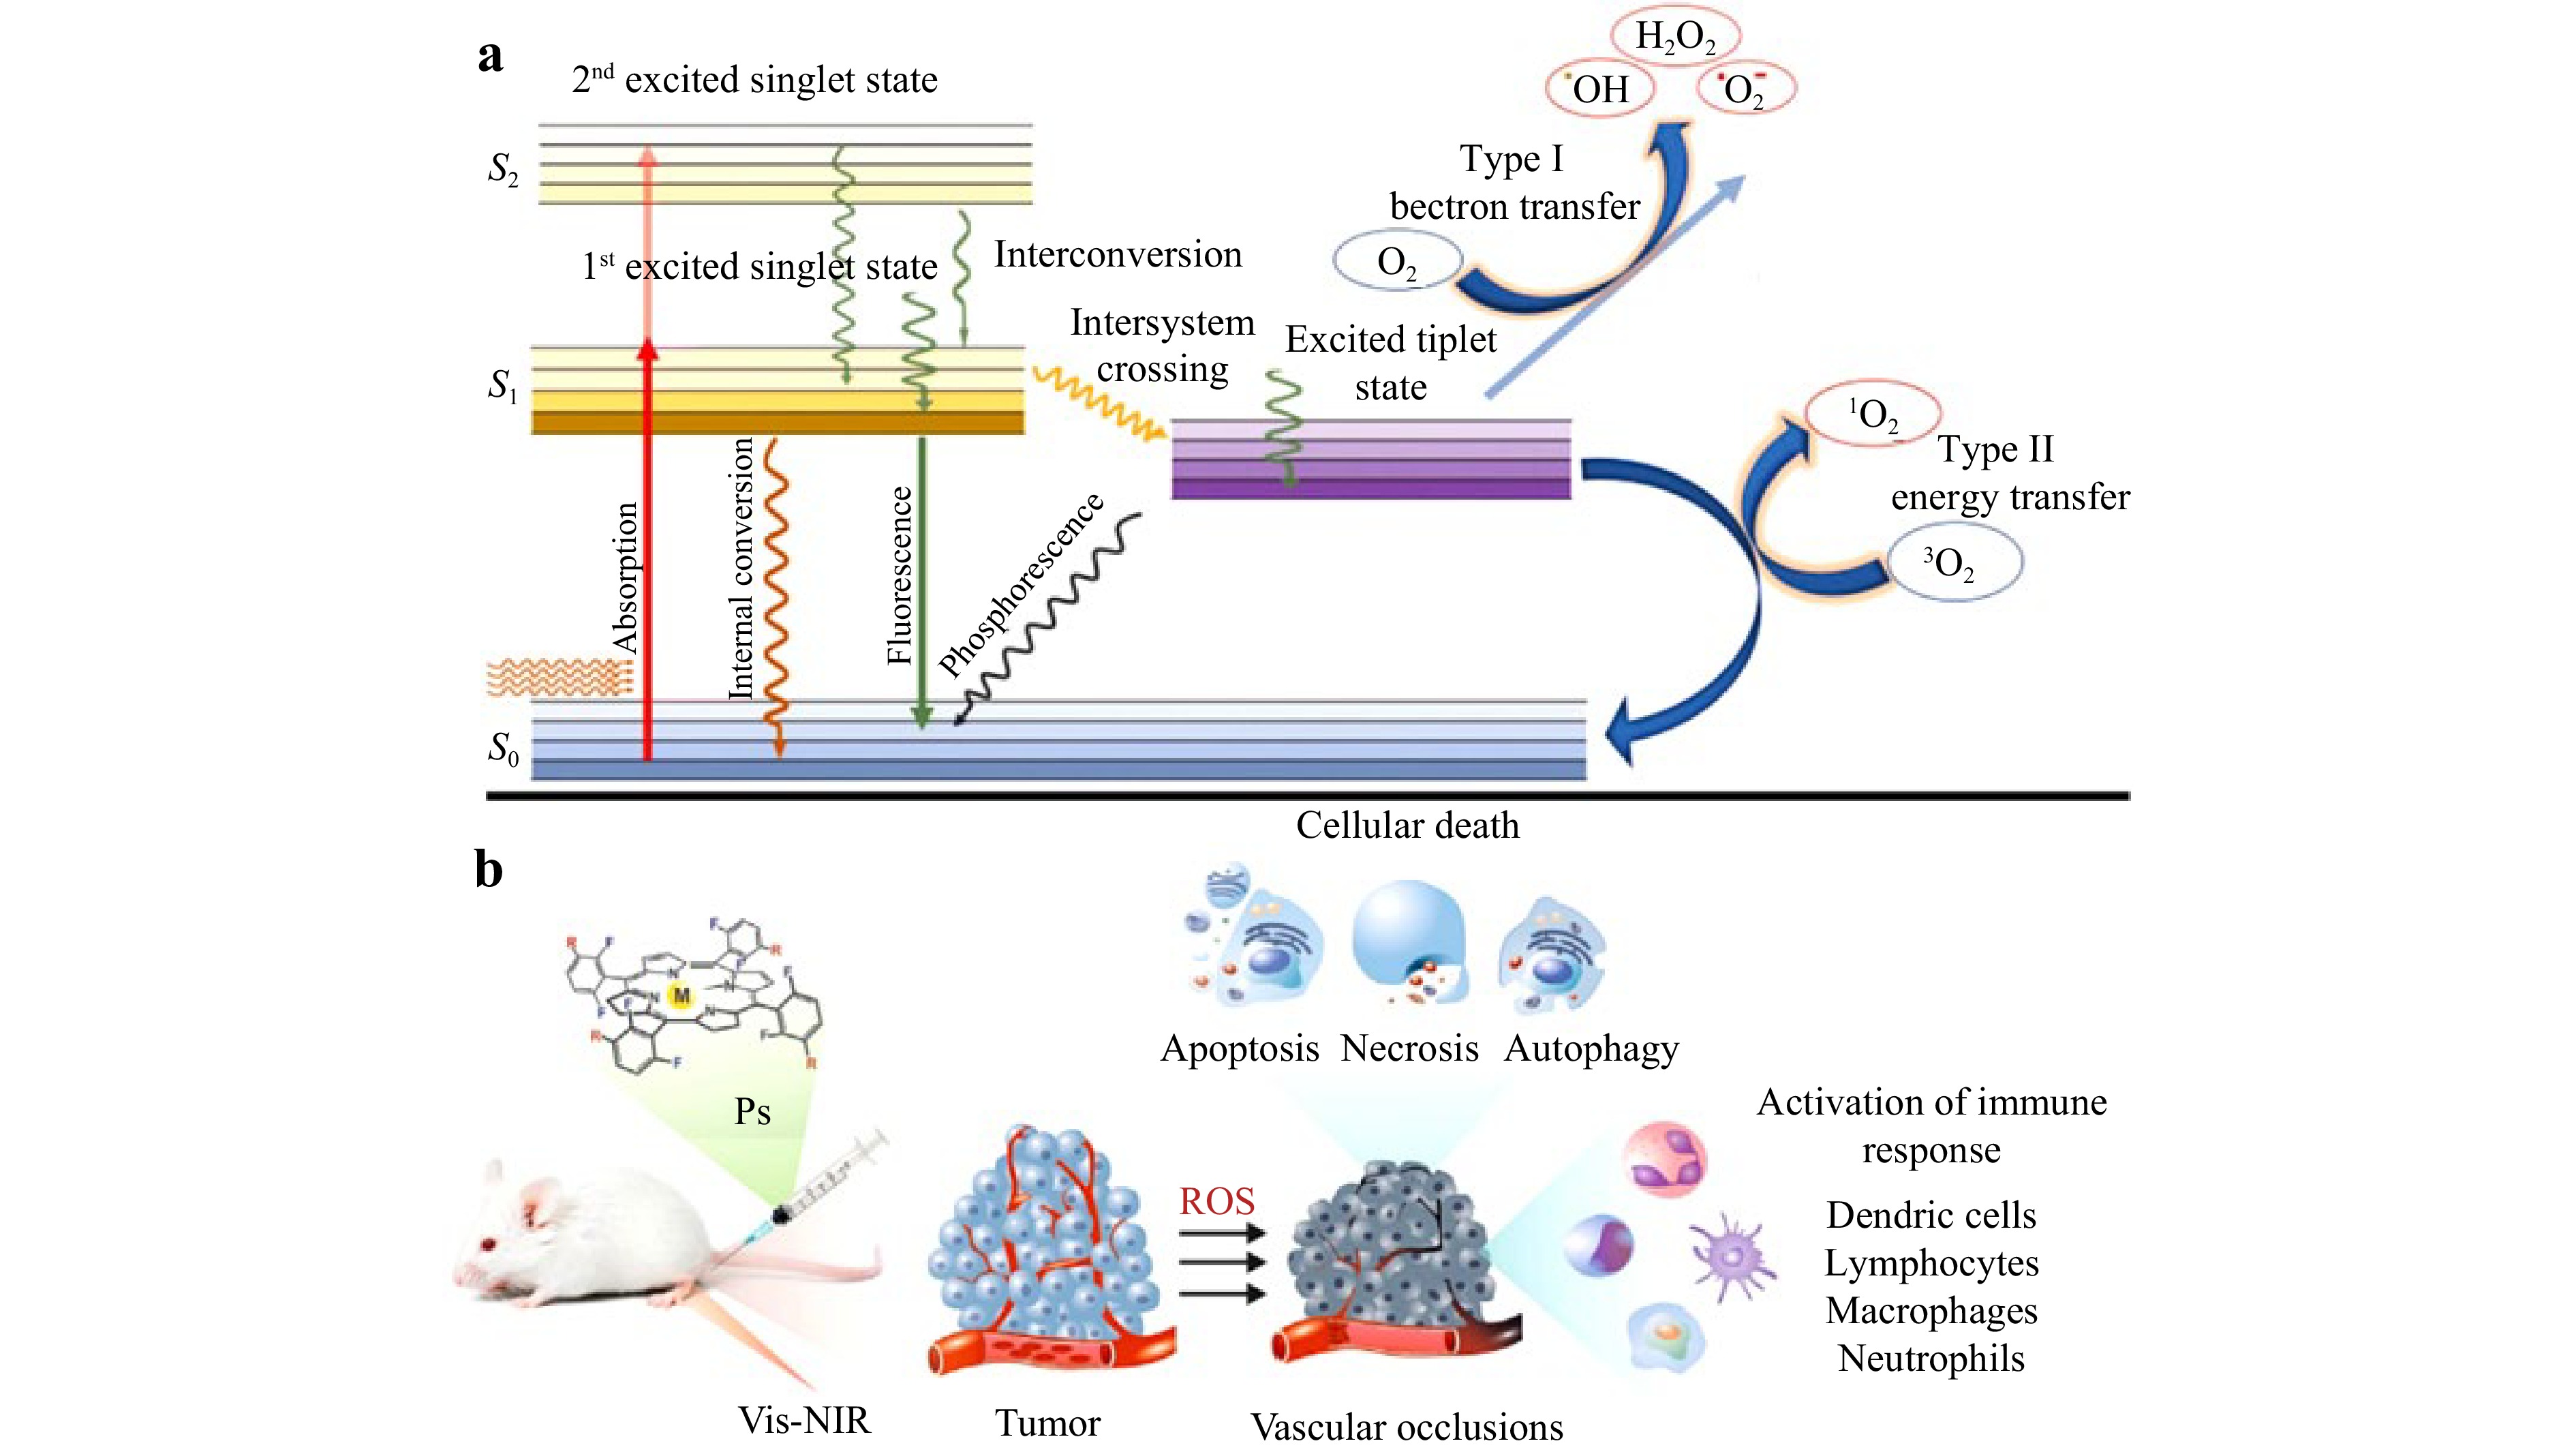
PDT is a medical treatment that utilizes a light-sensitive drug called a photosensitizer combined with a specific wavelength of light and molecular oxygen to produce reactive oxygen species (ROS)101, which selectively destroy abnormal or cancerous cells while sparing healthy cells136. The mechanism involves the selective uptake of a photosensitizer by target cells, followed by irradiation with light that activates the photosensitizer. This activation generates ROS, primarily singlet oxygen, through energy transfer from the excited photosensitizer to molecular oxygen. ROS cause oxidative damage to cellular components, such as lipids, proteins, and DNA, leading to cell death via apoptosis, necrosis, or autophagy, as represented schematically in Fig. 10a137. Additionally, PDT can disrupt the tumor vasculature and stimulate an immune response, increasing its therapeutic efficacy, as shown in Fig. 10b138. FLIM has proven to be a powerful tool in PDT, offering unique advantages for selective and precise molecular studies139. FLIM is particularly effective in distinguishing photosensitizing compounds such as protoporphyrin IX (PPIX), uroporphyrin, and coproporphyrin, even with overlapping emission spectra, making it indispensable for tracking photosensitizer localization and activity in tumor cells140. By visualizing lifetime variations in 5-Aminolevulinic acid (ALA) metabolites during cell differentiation and growth, FLIM provides critical insights into the ALA metabolic pathway, which is controlled by various enzymes that are active to different degrees141. This metabolic mapping allows optimization of PDT for targeting specific tumor cell populations. Furthermore, FLIM supports noninvasive tumor localization, as it can identify PPIX localized in mitochondria, which is known for inducing high phototoxicity, and differentiates it from uroporphyrin and coproporphyrin, which are found primarily in the cytoplasm. The ability of this technique to visualize fluorescence decay curves via TCSPC enhances the selectivity of fluorescence-guided diagnosis142. Although traditional photon counting is slow, advancements in streak camera technology promise faster detection with high temporal resolution, further enabling real-time monitoring143. FLIM also facilitates the use of cost-effective excitation sources, such as laser diodes and simple titanium: sapphire lasers, which reduce the system’s overall cost without compromising efficiency144. A study by Santos et al. investigated the use of bromine indirubin derivatives as oxygen sensors for PDT. Their effects on cellular metabolism were studied via FLIM and NADH-FLIM, which revealed a transition from oxidative phosphorylation to glycolysis in hypoxic environments. These substances may be used to predict the effectiveness of PDT, which might lead to therapy optimization on the basis of oxygen saturation levels145. Another study introduced Ir-OH, a novel iridium (III) complex with excellent PDT efficiency and aggregation-induced emission characteristics. Ir-OH is appropriate for real-time apoptosis monitoring via FLIM, as it targets mitochondria, triggers apoptosis, and has viscosity-responsive fluorescence lifetimes. It exhibited outstanding antitumor action in vivo, underscoring its promise for FLIM-guided therapy and mitochondrion-targeted PDT146. By addressing the challenges of spectral differentiation and enabling sophisticated lifetime imaging, FLIM has become integral for molecular studies in PDT147. Its potential for broader clinical application lies in the development of user-friendly and affordable detection systems, paving the way for its integration into routine clinical practice.
-
Artificial intelligence (AI), inspired by human cognitive abilities, employs computational models and algorithms to perform complex tasks such as image analysis and predictive decision-making. Rooted in the pioneering work of Alan Turing and John McCarthy, AI has evolved into a transformative force across various domains, including medical imaging148. In FLIM, AI—particularly ML and DL—has significantly enhanced the analysis of complex fluorescence data149. Fig. 11 illustrates the FLIM setup, where a Ti-Sapphire laser excites the sample, and fluorescence is detected via a PMT and analyzed using TCSPC150. Preprocessed lifetime images undergo feature extraction (PCA) and classification using ML models, while Convolution Neural Network (CNN) extracts spatial and temporal features for improved biomedical imaging accuracy. This integration enables precise characterization of cellular environments and molecular interaction151. AI automates processes such as feature extraction, pattern recognition, and biomarker identification, enabling more precise assessment of tumor microenvironments and therapeutic responses. DL, which uses multilayered artificial neural networks (ANNs), has further advanced FLIM by detecting subtle cancer-specific changes, thus aiding personalized cancer therapy152. This integration underscores AI’s pivotal role in improving FLIM capabilities and revolutionizing cancer diagnostics and treatment planning153. Early studies by Butte et al. (2011) on DL significantly enhanced the ability of FLIM in cancer diagnostics and therapy. By leveraging neural networks, DL automates feature extraction and classification from FLIM complex datasets, identifying subtle fluorescence lifetime changes linked to cancer. It excels in distinguishing cancerous from noncancerous tissues, particularly in applications involving the skin, head, neck, and brain154. In vivo studies show greater accuracy than ex vivo analyses do, demonstrating the potential of DL in real-time diagnostics17. Research by Wu et al. 2023 demonstrated the use of an ANN for lifetime estimation from TCSPC data. Their ANN model significantly reduced processing times, creating lifetime images of 256 × 256 pixels in just 0.9 seconds. However, its performance was limited under low photon count conditions, highlighting the need for more robust algorithms155. Later, Smith et al. (2019) introduced FLI-Net, a CNN designed for lifetime estimation from 3D TCSPC datasets. FLI-Net uses Conv3D layers for spatial feature extraction and residual blocks to enhance feature learning, achieving 30 times faster processing than traditional methods while addressing biexponential decay156. Guo et al. (2021) expanded this work by employing random forest (RF) models for lifetime and abundance estimation, which demonstrated superior generalizability and the ability to analyze multicomponent decays without retraining157. Furthermore, Yao et al. (2019) presented Net-FLICS, a CNN model designed for compressive macroscopic FLIM. By combining 1D and 2D convolutional layers, Net-FLICS reconstructs lifetime images with higher resolution than do conventional methods such as TVRecon. This approach significantly improved the accuracy and speed of lifetime imaging in complex biological samples158. Subsequently, Xiao et al. (2023) approached low photon count challenges through few photons lifetime imaging (FPFLI), a DL model trained on synthetic datasets, outperforms traditional methods in sparse photon conditions159. Ochoa et al. (2023) introduced NetFLICS-CR, which enhances lifetime imaging accuracy by incorporating a compressed ratio (CR) block to reduce input dimensionality and facilitate faster reconstruction160. Furthermore, Wang et al. (2024) utilized the pix2pix generative adversarial network (GAN) framework to generate virtual H&E-stained images from label-free FLIM data. This innovative approach reconstructs highly accurate cellular-level histological images, distinguishing fluorescence lifetime signatures in various cancer tissues, including lung, colorectal, and endometrial cancers161. The integration of DL in histological imaging was extended by Rivenson et al. (2019) and Borhani et al. (2019), who demonstrated the effectiveness of supervised GAN models in converting autofluorescence intensity images into histological stains. These models enhance tissue diagnostics by integrating FLIM lifetime data with multimodal spectral intensity inputs162,163. Li et al. (2021) further utilized transfer learning with a pix2pix GAN to generate multiple virtual stains, emphasizing FLIM’s potential even in low data scenarios164. In addition, Cao et al. (2023) explored CycleGAN-based unsupervised learning for converting photoacoustic microscopy data into H&E stains, highlighting the versatility of DL in histological applications165. A recent study on endometrial cancer demonstrated a novel diagnostic framework using viscosity-sensitive fluorescent probes such as DCVJ combined with FLIM imaging. This approach leverages differential intracellular viscosity as a biomarker for malignancy. The study utilized a DL model (ResNeSt-50) with confidence learning to classify FLIM images from minimally invasive cytology specimens, achieving a sensitivity of 84.6% and specificity of 75.0%166. This methodology overcomes traditional histopathological limitations by incorporating microenvironmental data, such as viscosity, alongside cellular morphology, ensuring improved diagnostic precision. Furthermore, confidence learning enhances model reliability by addressing label noise, a common challenge in heterogeneous datasets such as cytology samples. These findings underscore the potential of integrating FLIM with advanced computational methods to refine cancer diagnostics and pave the way for broader applications in cancer therapy. Despite progress, several challenges remain in applying DL to FLIM32. The limited availability of large, diverse datasets continues to hinder the training of robust models, necessitating approaches such as data augmentation and transfer learning167. The lack of standardized evaluation metrics poses difficulties in benchmarking and comparing models across studies. Additionally, building models that can reliably perform under varying experimental conditions and handle complex biological scenarios is still a significant challenge. Addressing these issues is critical to realizing the full potential of DL in FLIM168. The future of FLIM integrated with DL is promising, with ongoing research focused on addressing low photon count data and distinguishing overlapping fluorescence lifetimes. Developing advanced models capable of generalizing across diverse imaging scenarios and integrating FLIM with multimodal imaging techniques are key objectives. Innovations such as generative adversarial networks and unsupervised learning frameworks are expected to further enhance FLIM’s diagnostic and therapeutic potential169. These advancements aim to make FLIM more accessible for noninvasive, label-free tissue characterization and personalized cancer therapies. The integration of DL into FLIM has revolutionized cancer diagnostics by increasing the speed, precision, and resilience of fluorescence lifetime data analysis170. This synergy has enabled label-free, biomarker-independent imaging for tissue characterization and opened new avenues in personalized cancer therapy171. While challenges persist, advancements in data handling, model development, and imaging techniques hold immense promise for broadening FLIM applications. With continued research and innovation, DL-FLIM integration is poised to play a transformative role in noninvasive diagnostics and therapeutic monitoring.
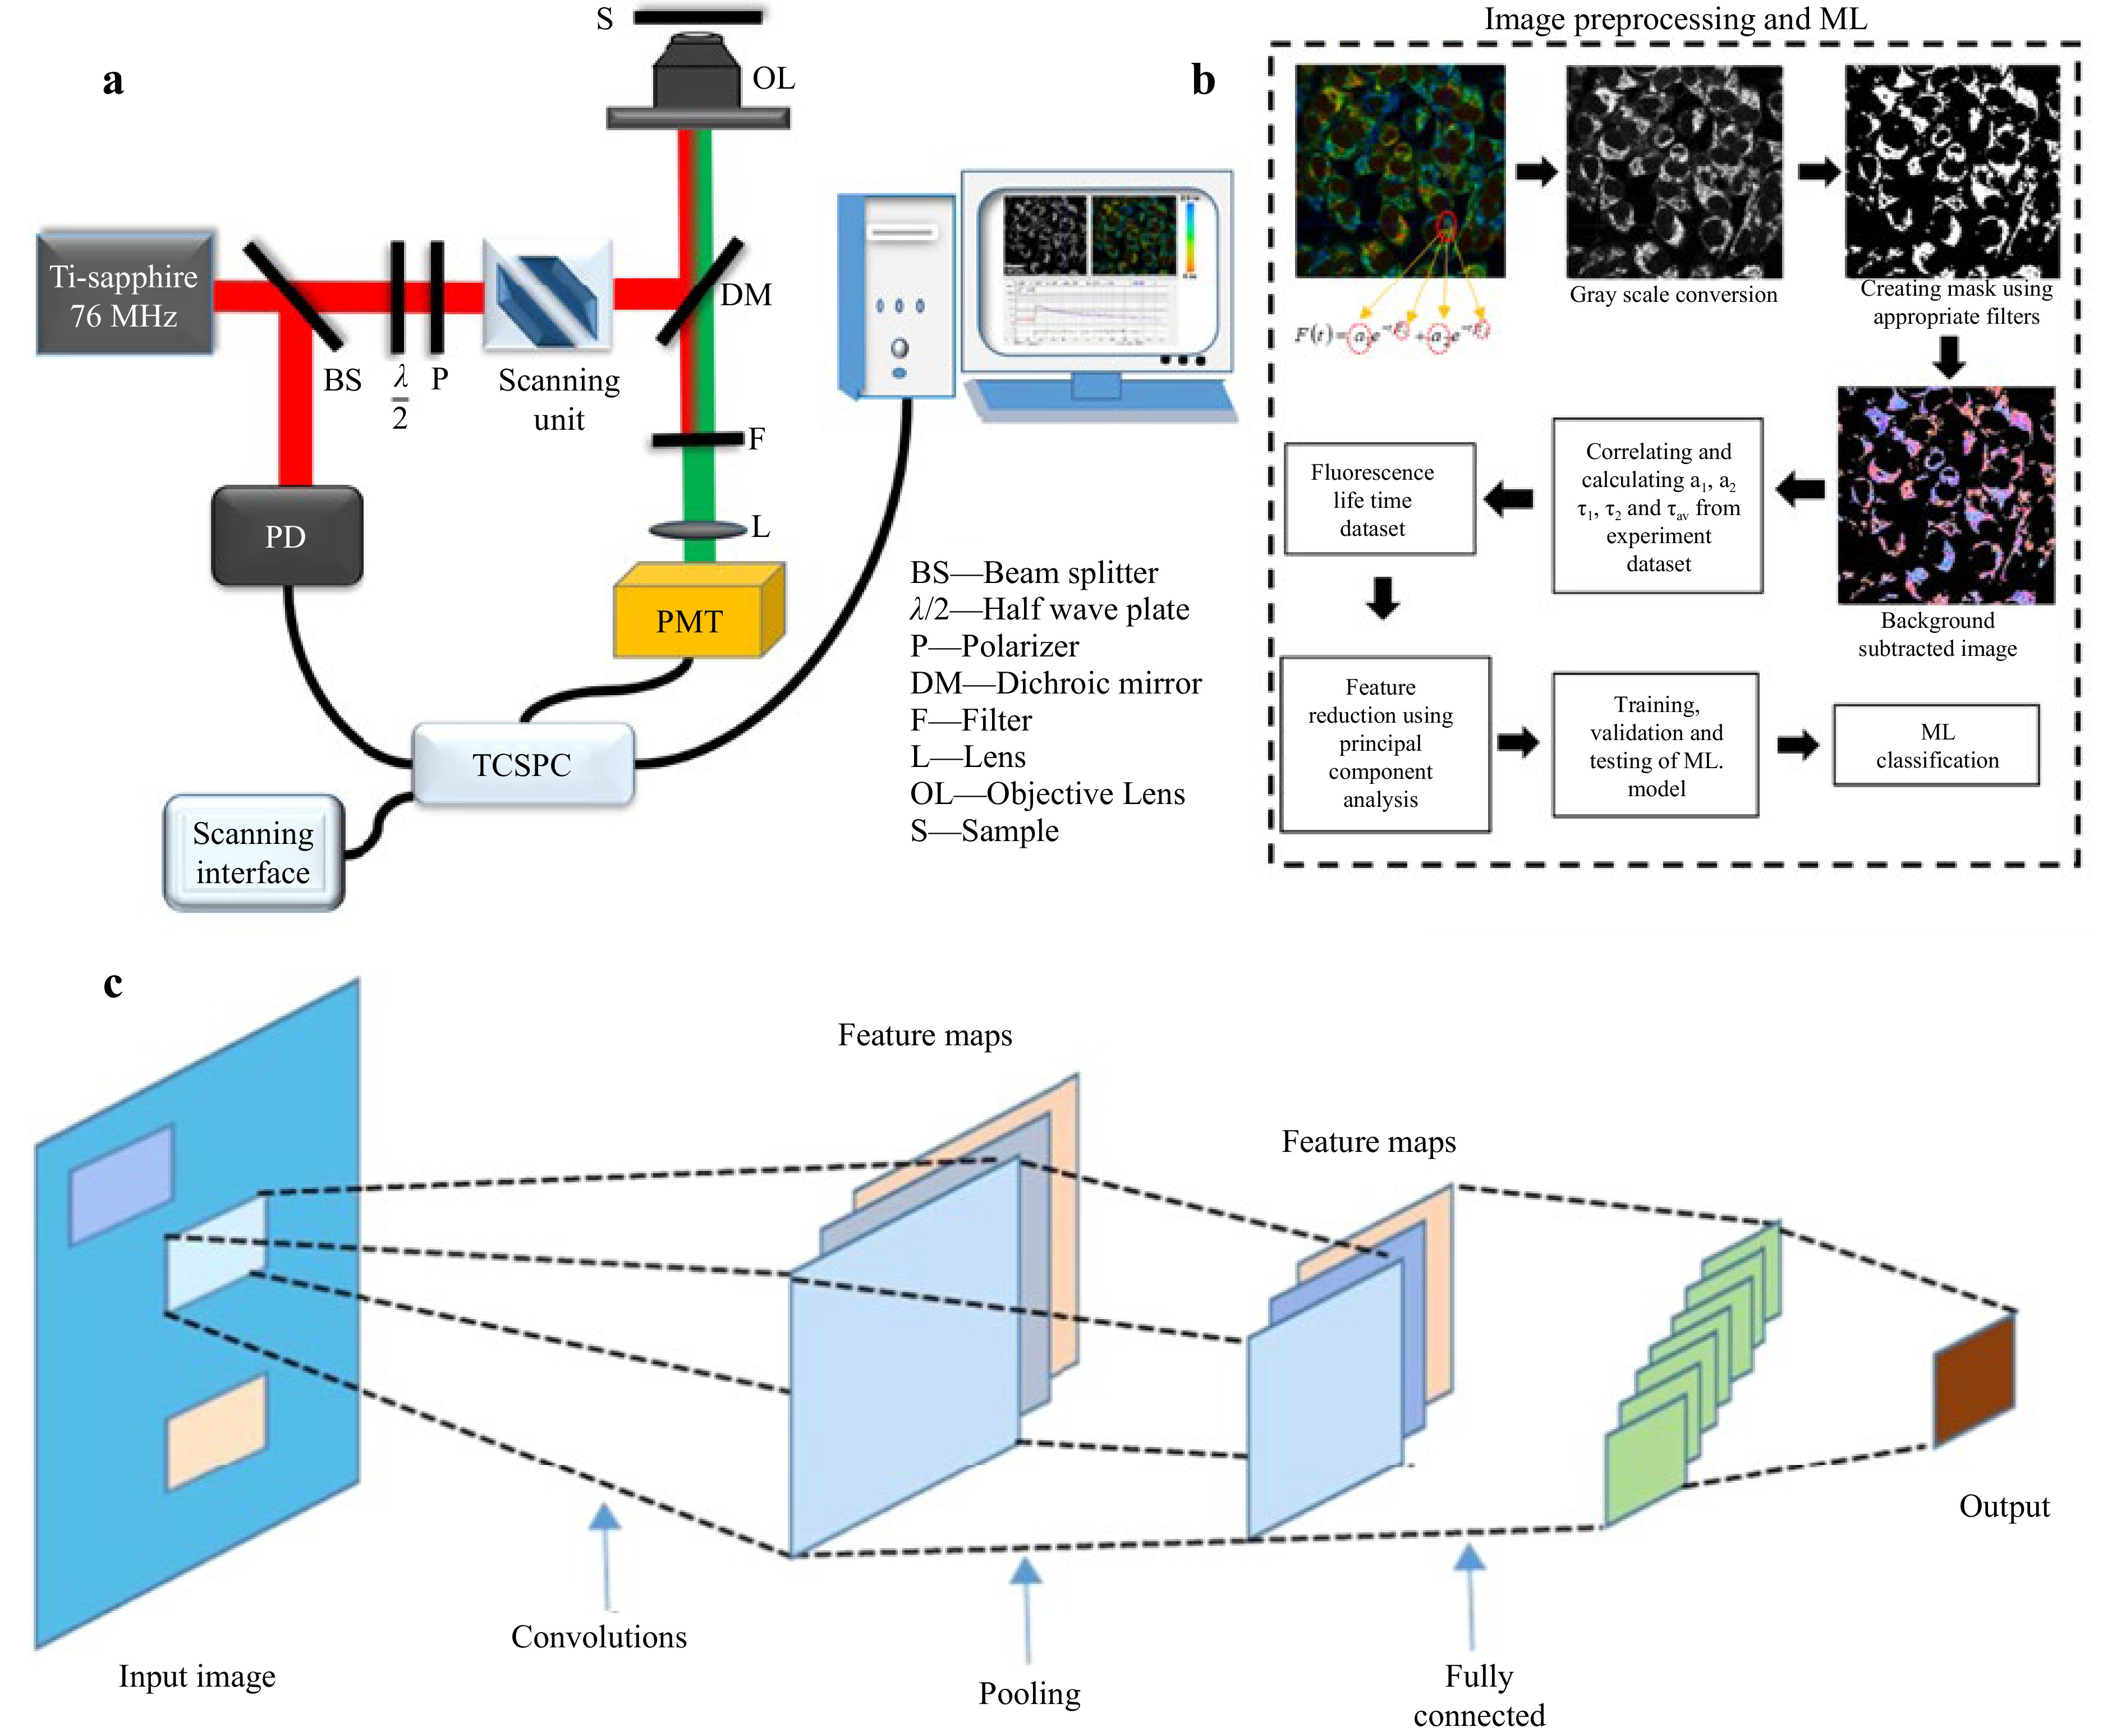
Fig. 11 Schematic of FLIM integrated with DL a FLIM setup with a Ti-Sapphire laser, scanning unit, dichroic mirror (DM), photomultiplier tube (PMT), and TCSPC for fluorescence lifetime detection150. b ML workflow involving image preprocessing, feature extraction (PCA), and classification using fluorescence lifetime parameters (τ1, τ2, a1, a2). c DL model (CNN) processes FLIM data through convolution, pooling, and fully connected layers for classificationn151.
-
Skala et al., 2007 utilized FLIM to study the metabolic states of precancerous tissues by measuring the lifetimes of the auto-fluorescent cofactors NADH and FAD. They reported that protein-bound NADH levels were significantly greater in high-grade dysplastic tissues than in normal tissues, indicating a shift in redox balance. FAD levels change depending on the grade of dysplasia, with increased protein-bound FAD in low-grade lesions but decreased levels in high-grade lesions124. Walsh et al. applied FLIM to breast cancer xenografts in mice to differentiate between normal, malignant, and metastatic cells by analyzing their redox ratios. They reported that HER2-targeted therapies induced metabolic changes detectable within 48 hours, significantly earlier than changes identified via FDG-PET imaging172. Furthermore, Boissonnas et al. (2007) employed FLIM to visualize the interactions between cytotoxic T lymphocytes and tumor cells within the tumor microenvironment. This allows real-time tracking of immune cell motility and their engagement with cancer cells173. Brown et al. (2001) combined FLIM with intravital two-photon microscopy to study the expression of VEGF, hypoxia, and acidosis in brain tumors. By quantifying these factors, researchers revealed how tumors adapt to their microenvironment, providing insights into angiogenesis and metabolic regulation under stress conditions174. Zhang et al. (2006) used FLIM to image NADH fluorescence in tumor cells and identify the role of carboxyl-terminal binding protein (CtBP) in regulating tumor metastasis under hypoxic conditions. By tracking changes in NADH lifetimes, they linked metabolic shifts to specific transcriptional changes. In another study, FLIM imaging of hamster cheek pouch tissues revealed metabolic alterations that correlated with the early stages of epithelial cancer175. Another study employed FLIM-FRET imaging in a pancreatic cancer model to assess dynamic biomarkers and drug responses at single-cell resolution in live tumor tissue. The findings revealed enhanced drug efficacy with combination therapy, whereas FLIM-FRET detected spatial regulation of Src protein activity. This method improves drug target validation and informs therapeutic strategies by capturing subtle, context-dependent protein dynamics133. A subsequent study demonstrated that Cluster-FLIM identified distinct uptake pathways of molecules of interest (MOIs), distinguishing between normal and tumor cells. This method provides high-throughput, detailed visualization of MOI localization, confirming its efficacy in analyzing drug delivery mechanisms within complex biological environments, including cells and 3D tissue models, highlighting potential applications in preclinical research for evaluating therapeutic efficacy176. Further studies utilized FLIM to noninvasively track the metabolic profiles of breast cancer spheroids in a 3D microenvironment, with a focus on how collagen concentration influences cell behavior. The results revealed that the MCF-10A spheroids shifted toward lower FLIRR values, which was consistent with the findings of glycolysis, particularly at higher collagen concentrations. In contrast, MDA-MB-231 spheroids, which are more invasive, shifted toward higher FLIRR values over time, indicating a reliance on oxidative phosphorylation, with a more pronounced effect on higher collagen densities. The study also demonstrated spatial metabolic gradients within the spheroids, with cells at the spheroid periphery exhibiting higher FLIRR values, suggesting a migratory phenotype. These findings highlight FLIM’s potential in tracking metabolic changes in 3D tumor models, offering insights into tumor progression and response to extracellular matrix variations177.
Pal et al.’s 2022 study explored the use of fluorescence lifetime imaging with panitumumab-IRDye800CW, a cancer-targeted near infrared probe, for tumor identification during surgery and cancer diagnostics. Research has revealed that the fluorescence lifetime in epidermal growth factor receptor-overexpressing cancer cells is longer than that in normal tissue, indicating tumor specificity at the cellular level. The fluorescence lifetime images showed high sensitivity and specificity for classifying tumors vs normal tissue, with consistent changes across multiple patients. This study underscores the safety and efficacy of panitumumab-IRDye800CW in human tissue and its potential impact on surgical guidance for various cancers178. A clinical study by Walsh et al. (2013) used optical metabolic imaging (OMI) to monitor cellular metabolism in cancer cells and tissues. OMI measures the fluorescence intensities and lifetimes of metabolic coenzymes, allowing for high-resolution, noninvasive, and dynamic assessment of cellular metabolism. Researchers have measured the fluorescence lifetimes of NADH and FAD to assess glycolytic levels and cellular respiration. Integration with ML algorithms enhanced the analysis, enabling precise differentiation of cancer subtypes and early identification of treatment responses. This approach highlights the potential of FLIM for personalized cancer therapy172.
-
FLIM, when integrated with DL, offers a transformative approach to cancer research by providing precise, spatially resolved molecular data. This synergy enables detailed insights into cellular metabolism, the tumor microenvironment, and therapeutic responses, while DL enhances the speed, resolution, and classification capabilities of FLIM data. Table 2 provides an overview of the application of FLIM in cancer research and the role of DL. One of the key future directions for this integrated approach is the development of noninvasive diagnostic platforms for early cancer detection, allowing the identification of subtle metabolic changes. Additionally, this technology can refine drug discovery processes by monitoring cellular responses and evaluating drug efficacy in real time. As FLIM continues to evolve, it may become automated and portable, making it suitable for widespread clinical use. Coupling FLIM with other emerging imaging technologies, such as multiphoton imaging and super resolution microscopy, could significantly improve imaging depth and resolution, providing a more detailed understanding of cancer progression and heterogeneity. Despite its potential, the integration of FLIM with DL faces several challenges. High computational costs, the complexity of DL algorithms, and the need for extensive labeled datasets are major barriers. FLIM instrumentation itself is also expensive and requires specialized expertise. Additionally, the lack of standardized imaging protocols and data acquisition methods limits reproducibility and consistency across studies. Another significant challenge is the integration of FLIM with other imaging modalities, which requires advanced computational and technical capabilities. Furthermore, regulatory hurdles and the need for clinical validation must be addressed to ensure that FLIM-based technologies can meet the standards for clinical application. In conclusion, the combination of FLIM with DL represents a promising frontier in cancer research, offering the potential for precision medicine and better patient outcomes. While challenges remain, ongoing technological advancements and collaborative efforts could make this integrated approach an indispensable tool in cancer diagnosis and therapy, transforming healthcare and providing new insights into cancer biology.
Type of Cancer FLIM Parameter Biological Insights Application Role of DL Outcomes References Breast Cancer Fluorescence Lifetime Tumor microenvironment and metabolic changes Tumor detection, staging, treatment monitoring DL models analyze FLIM data for tumor characterization and segmentation DL enhances the accuracy of tumor detection and differentiation from surrounding tissues. 179,180 Lung Cancer Fluorescence Decay Time Tumor hypoxia and oxygenation level Monitoring oxygen levels, tumor progression, metastasis DL aids in identifying subtle changes in fluorescence decay for early diagnosis Improved early detection, especially in early-stage lung cancer detection. 181,182 Glioblastoma Lifetime Imaging of Metabolites Abnormal metabolic pathways and nutrient utilization Real-time tumor metabolism and assessment of therapy DL algorithms process complex FLIM datasets for tumor classification and therapy response Better understanding of tumor metabolic activity and therapy response. 183,184 Prostate Cancer Fluorescence Intensity Distribution Alterations in cell density and vascularization Prostate biopsy assessment, intraoperative guidance DL can identify tumor regions by analyzing the intensity distribution from FLIM data Enhanced precision in tumor boundary detection during prostate cancer surgeries 185,186 Skin Cancer (Melanoma) Fluorescence Lifetime and Intensity Changes in cellular autofluorescence and tissue morphology Skin cancer screening, lesion analysis DL models enhance tumor detection and delineation based on FLIM data Increased sensitivity and specificity in skin cancer detection compared to traditional methods. 187 Cervical Cancer Fluorescence Lifetime of NADH/FAD Metabolic dysfunction in cellular respiration Screening, diagnostic tool for early cervical cancer DL assists in automating the analysis of FLIM datasets to detect early-stage abnormalities DL-powered FLIM analysis improves early detection of cervical dysplasia and cancer. 188 Colorectal Cancer Fluorescence Intensity and Lifetime Altered metabolic states and tumor-specific changes Monitoring tumor progression, treatment assessment DL algorithms help identify subtle features in FLIM data related to metastasis Significant improvement in assessing colon tumor response to treatment. 189,190 Ovarian Cancer Lifetime of Cellular Components Changes in mitochondrial function and cellular structure In vivo tumor detection and therapy monitoring DL aids in accurate classification of tumors and assessment of therapeutic efficacy More accurate staging of ovarian cancer and prediction of therapeutic outcomes. 191,192 Table 2. Overview of the application of FLIM in cancer research and the role of DL.
-
NM thank Indian Council of Medical Research (ITR/Ad-hoc/43/2020-21, ID No. 2020-3286), Department of Science and Technology, (GITA/DST/TWN/P-95/2021) Government of India, India for financial support. NM thanks the Manipal School of Life Sciences, Manipal Academy of Higher Education (MAHE), Manipal for providing the infrastructure and facilities.
Application of fluorescence lifetime imaging-integrated deep learning analysis for cancer research
- Light: Advanced Manufacturing , Article number: (2025)
- Received: 30 December 2024
- Revised: 17 May 2025
- Accepted: 03 June 2025 Published online: 05 August 2025
doi: https://doi.org/10.37188/lam.2025.049
Abstract: Fluorescence lifetime imaging microscopy (FLIM) has emerged as a transformative imaging technique in cancer research, offering quantitative insights into cellular metabolism, tumor microenvironments, and therapeutic responses. By measuring the fluorescence lifetimes of metabolic cofactors such as NADH and FAD, FLIM facilitates the analysis of cancer-specific metabolic reprogramming and heterogeneity. Integration with deep learning further enhances FLIM’s diagnostic and therapeutic potential, enabling high-resolution imaging, automated data analysis, and biomarker identification. This review provides a comprehensive overview of the principles and technological advancements of FLIM, highlighting its applications in cancer diagnostics, drug delivery, and therapy, as well as its integration with deep learning to increase imaging precision and data interpretation. Challenges such as high costs, high computational complexity, and the need for standardized imaging protocols are also addressed. By bridging FLIM with cutting-edge computational techniques, this review highlights its potential to revolutionize cancer research, paving the way for early diagnosis, personalized therapies, and deeper insights into tumor biology.
Research Summary
Biomedical imaging: Deep learning enhanced FLIM for cancer insights
A review led by Nirmal Mazumder at Manipal Academy of Higher Education, India discusses the transformative role of fluorescence lifetime imaging microscopy (FLIM) in cancer research. FLIM quantifies metabolic activity through fluorescence lifetimes of auto-fluorophores including NADH and FAD, enabling precise insights into tumor biology. The integration of deep learning enhances FLIM’s diagnostic potential by automating image analysis, identifying subtle metabolic changes, and improving classification accuracy. Applications range from real-time drug monitoring and tumor margin identification to early diagnostics. This review outlines advancements in FLIM instrumentation, computational models, and clinical relevance, emphasizing its promise for precision oncology and noninvasive cancer monitoring.
Rights and permissions
Open Access This article is licensed under a Creative Commons Attribution 4.0 International License, which permits use, sharing, adaptation, distribution and reproduction in any medium or format, as long as you give appropriate credit to the original author(s) and the source, provide a link to the Creative Commons license, and indicate if changes were made. The images or other third party material in this article are included in the article′s Creative Commons license, unless indicated otherwise in a credit line to the material. If material is not included in the article′s Creative Commons license and your intended use is not permitted by statutory regulation or exceeds the permitted use, you will need to obtain permission directly from the copyright holder. To view a copy of this license, visit http://creativecommons.org/licenses/by/4.0/.

 DownLoad: