


-
Multiple degree-of-freedom (DOF) measurement is essential for accurately determining the position and orientation of components in space, ensuring the quality of operations across fields such as aerospace1–2, semiconductors3–4, and precision instruments5–8. For instance, in synthetic aperture radar (SAR) mapping1, real-time pose measurements are critical for dynamically adjusting the baseline length to achieve high-precision remote sensing2. In large-scale grating-based lithography3, precise substrate positioning ensures correct stitching exposure, which is vital for maintaining high manufacturing yield4. Furthermore, applications like the assembly of ultra-large telescopes require in-situ multi-DOF measurements. Large focal plane arrays, often composed of stitched detectors, demand precise pose measurements to ensure flatness5–6, while segmented mirrors require alignment to prevent image distortion7. These scenarios demand high-precision absolute measurements with the most compact and efficient setups.
However, existing multi-DOF measurement techniques face significant limitations. Many rely on cooperative targets9–10 and complex optical configurations11, increasing system complexity and introducing uncertainties, especially in uncontrolled environments where deformation, misalignment, or environmental instability can severely affect performance. In particular, traditional methods often require multiple beams for multiple-DOF measurements12, complicating alignment and calibration while adding systematic errors. These challenges become increasingly pronounced as the number of measurement DOFs grows.
Current mainstream methods for multi-DOF measurement including inertial sensors9,13–14, vision-based approaches15–17, geometric methods18–23, and interferometric systems11,24–32. Inertial sensors integrate accelerometers or gyroscopes into objects, which are unsuitable for production settings and potentially failing in harsh environmental tests. Vision-based approaches provide noncontact, real-time, and large-range measurements, but are limited by lighting conditions and imaging resolution, reducing accuracy. Geometric methods, while relatively precise, rely on pre-defined cooperative targets and cannot measure displacement along the optical axis. Interferometric systems, such as heterodyne interferometers and grating interferometers, achieve sub-nanometer displacement resolution. Their derivatives in multiple DOF interferometry also inherit this high-precision characteristic11,24–27. However, these interferometers require cooperative targets, which complicates compact setups and introduces uncertainties during installation. Although speckle interferometry28,29 or laser self-mixing interferometry30,31 can handle non-cooperative targets, they are limited to relative measurements, making them unsuitable for absolute positioning.
Recent advancements have explored single-probe beam setups for multi-DOF measurements. For example, fringe analysis has been applied to smooth surfaces, enabling pitch and yaw measurement by analyzing interference patterns32,33. However, such techniques depend on cooperative targets and struggle to cover a broader range of measurable DOFs. A typical application is aligning optical components in gravitational wave interferometers, known as differential wavefront sensing34. The low coherence of broad-spectrum light sources is widely employed in the complex measurement of non-cooperative surfaces35,36, as it obviates the need for phase information. Thus, utilizing the low coherence of light to analyze the position and orientation of non-cooperative surfaces is a viable approach, well-known among experienced researchers. Yet, the strict working distance constraints of low-coherence interferometry have hindered its application in practical scenarios. Mode-locked lasers have expanded the possibilities of coherent measurements by enabling low-coherence envelope detection in unequal arm configurations37–42, paving the way for envelope-based multi-DOF methods.
In this study, we demonstrate a low-coherence spatial interferometry (LCSI) system using a mode-locked femtosecond laser for high-precision multi-DOF measurements with a single probe beam. Temporal phase shifting by repetition frequency modulation was used to obtain a more accurate coherence envelope. For a planar sample, whether smooth or rough, LCSI can be employed to simultaneously measure the axial distance, pitch angle, and yaw angle, achieving submicron and arcsecond precision at a measurement speed of 100 Hz. Additionally, the system allows simultaneous measurement of multiple targets within a single field of view, offering a compact and versatile solution for applications such as structural alignment and dynamic calibration.
-
Fig. 1a illustrates the optical setup of the femtosecond-laser-based LCSI system. The system utilizes a repetition frequency (fr) modulated femtosecond laser, which emits a total average power of 3.4 mW, evenly divided between two outputs subsequently collimated by collimators 1 and 2 into spatial beams. The transform-limited pulse duration of the laser is calculated as 78 fs. However, the actual output pulse width is slightly broadened due to the fiber dispersion. After dispersion compensation, the pulse width from FC1 is 140 fs, and that from FC2 is 105 fs, both measured by an autocorrelator (pulseCheck NX50, APE). Beam collimation in the system is achieved using plano-convex lenses with a focal length of 100 mm.
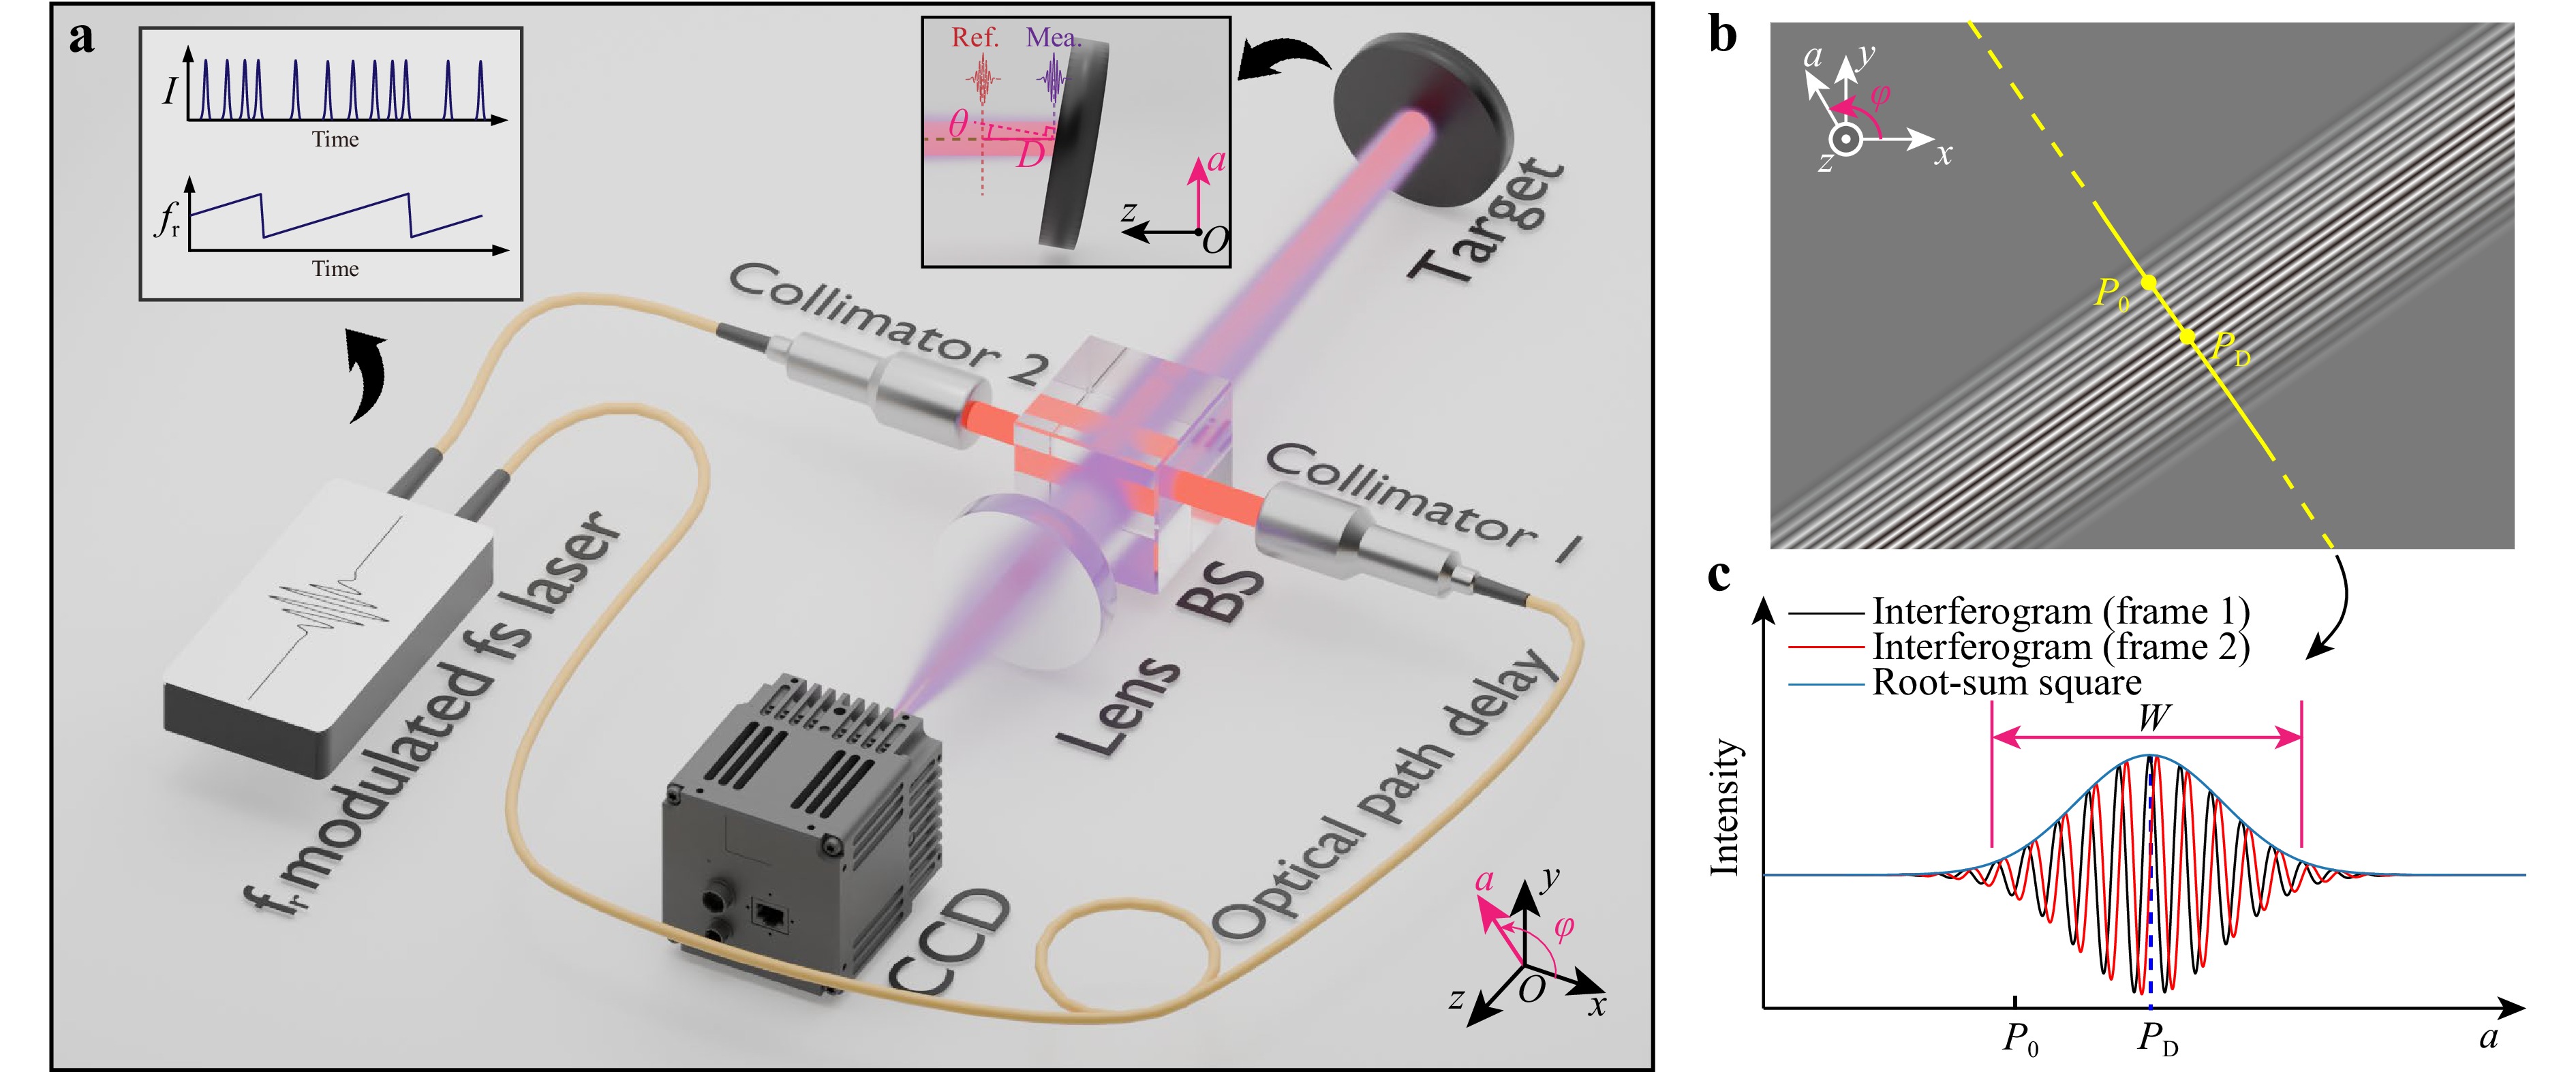
Fig. 1 Diagram of femtosecond-laser-based LCSI system. a The periodic coherence of the mode-locked laser enables the capture of low-coherence interferograms on CCD for samples at any location, either by modulating the repetition rate of the light source or by adjusting the optical path difference. By dynamically fine-tuning the pulse interval, the time delay between each pair of measurement and reference pulses received by CCD is varied, achieving modulation of the interference phase. BS: beam splitter; CCD: charge-coupled device; Mea.: measurement pulse; Ref.: the equivalent position of the reference pulse in the measuring arm. b Interference pattern captured on the CCD when the surface of the sample is flat. Here, P0 is the midpoint of the CCD and the yellow line corresponds to the image on the CCD. c One-dimensional distribution of the interference signal observed along the yellow line, where the black and red lines represent the interference signals of adjacent frames, and the blue line is the coherence envelope extracted based on their root-sum square.
The light from Collimator 1, serving as the measurement beam, is reflected by a beam splitter (BS) onto the target surface and, after reflection from the target, passes through the BS again to be imaged onto the CCD by a lens. Light from Collimator 2 acts as the reference beam, reflected by the BS and then scaled down onto the CCD by the lens. This configuration results in the measurement beam reaching the CCD later than the reference beam due to the spatial distance from the BS to the target and delays in the optical fiber. The laser’s periodic coherence ensures that when the optical path difference precisely matches an integer multiple of the pulse interval, measurement and reference pulses align, producing an interference pattern on the CCD as shown in Fig. 1b. By manipulating the repetition frequency fr, we can determine the axial distance when pulses are aligned42 (Detailed frequency modulation methodology is provided in Supplementary Information S4). Presence of a polar angle θ relative to the optical axis on the target surface results in a coherence interferogram, the width of which reflects the magnitude of θ, and the direction of which indicates the azimuth angle ϕ. Assuming the image center P0 is the point of interest, the axial distance D relative to the center of the coherence interferogram can be deduced from θ, with the center’s axial distance derived from the repetition frequency, thus enabling the calculation for the absolute axial distance of P0.
To precisely extract the coherent envelope from the captured images, we dynamically modulate the laser’s fr, generating a continuous temporal phase shift. The relationship between the phase shift value Δφ and frequency modulation value Δfr is Δφ = 2πMcΔfr/(λcfr2), where c represents the speed of light in vacuum, and M is defined as the ordinal difference during pulse alignment43. In our setup, with the laser’s center wavelength λc = 1.558 μm and a repetition frequency fr ≈ 63.804 MHz, the optical path difference in the interferometer is approximately 84.6 m (Mth = 18th). This allows for a linear scan with a period of 1/4 frame rate and a modulation range of 1.2 Hz for fr, ensuring a π/2 phase difference between adjacent frames as demonstrated in Fig. 1c. After removing the DC component of the interference signal, the complete coherence envelope was extracted by the root-sum square of the orthogonal AC signals. The center position and width of the envelope can be quickly obtained using the centroid and root-mean-square methods, respectively. Therefore, the axial position D, polar angle θ, and azimuth angle φ of probe mirror M in the world coordinate system can be directly obtained by analyzing the shape of the low-coherence interference envelope on the CCD. The world coordinate system can be transformed into an object coordinate system via a coordinate transformation to obtain the three-DOF of the object (the axial position D, pitch angle θx and yaw angle θy).
-
First, a mirror was chosen as the sample and imaged using an aspheric lens with a focal length of 100 mm, and the interferograms are detected utilizing a short-wave-infrared CCD (G-033, Allied Vision), set to a frame rate of 100 fps at 640 × 512 resolution and 14-bit depth. The mirror’s position and orientation was adjusted such that only the x-directional spatial interferometric fringe appeared on the CCD (i.e., φ = 0), as shown in Fig. 2a. In this case, W can be obtained from the envelope extracted from any row: When blocking the collimator of one interference arm, the background light intensity of the other arm is obtained. By eliminating the pre-measured background signal, a clean low coherence interferogram can be obtained, as shown in Fig. 2b. Subsequently, the coherence envelope distribution C(x,y), shown in Fig. 2c, can be obtained based on two adjacent frames with a temporal phase shift. By selecting two rows from the CCD in Fig. 2c and measuring their envelope distributions, as shown in Fig. 2d, the characteristics of the two-dimensional coherence envelope on the CCD can be inferred based on these features.
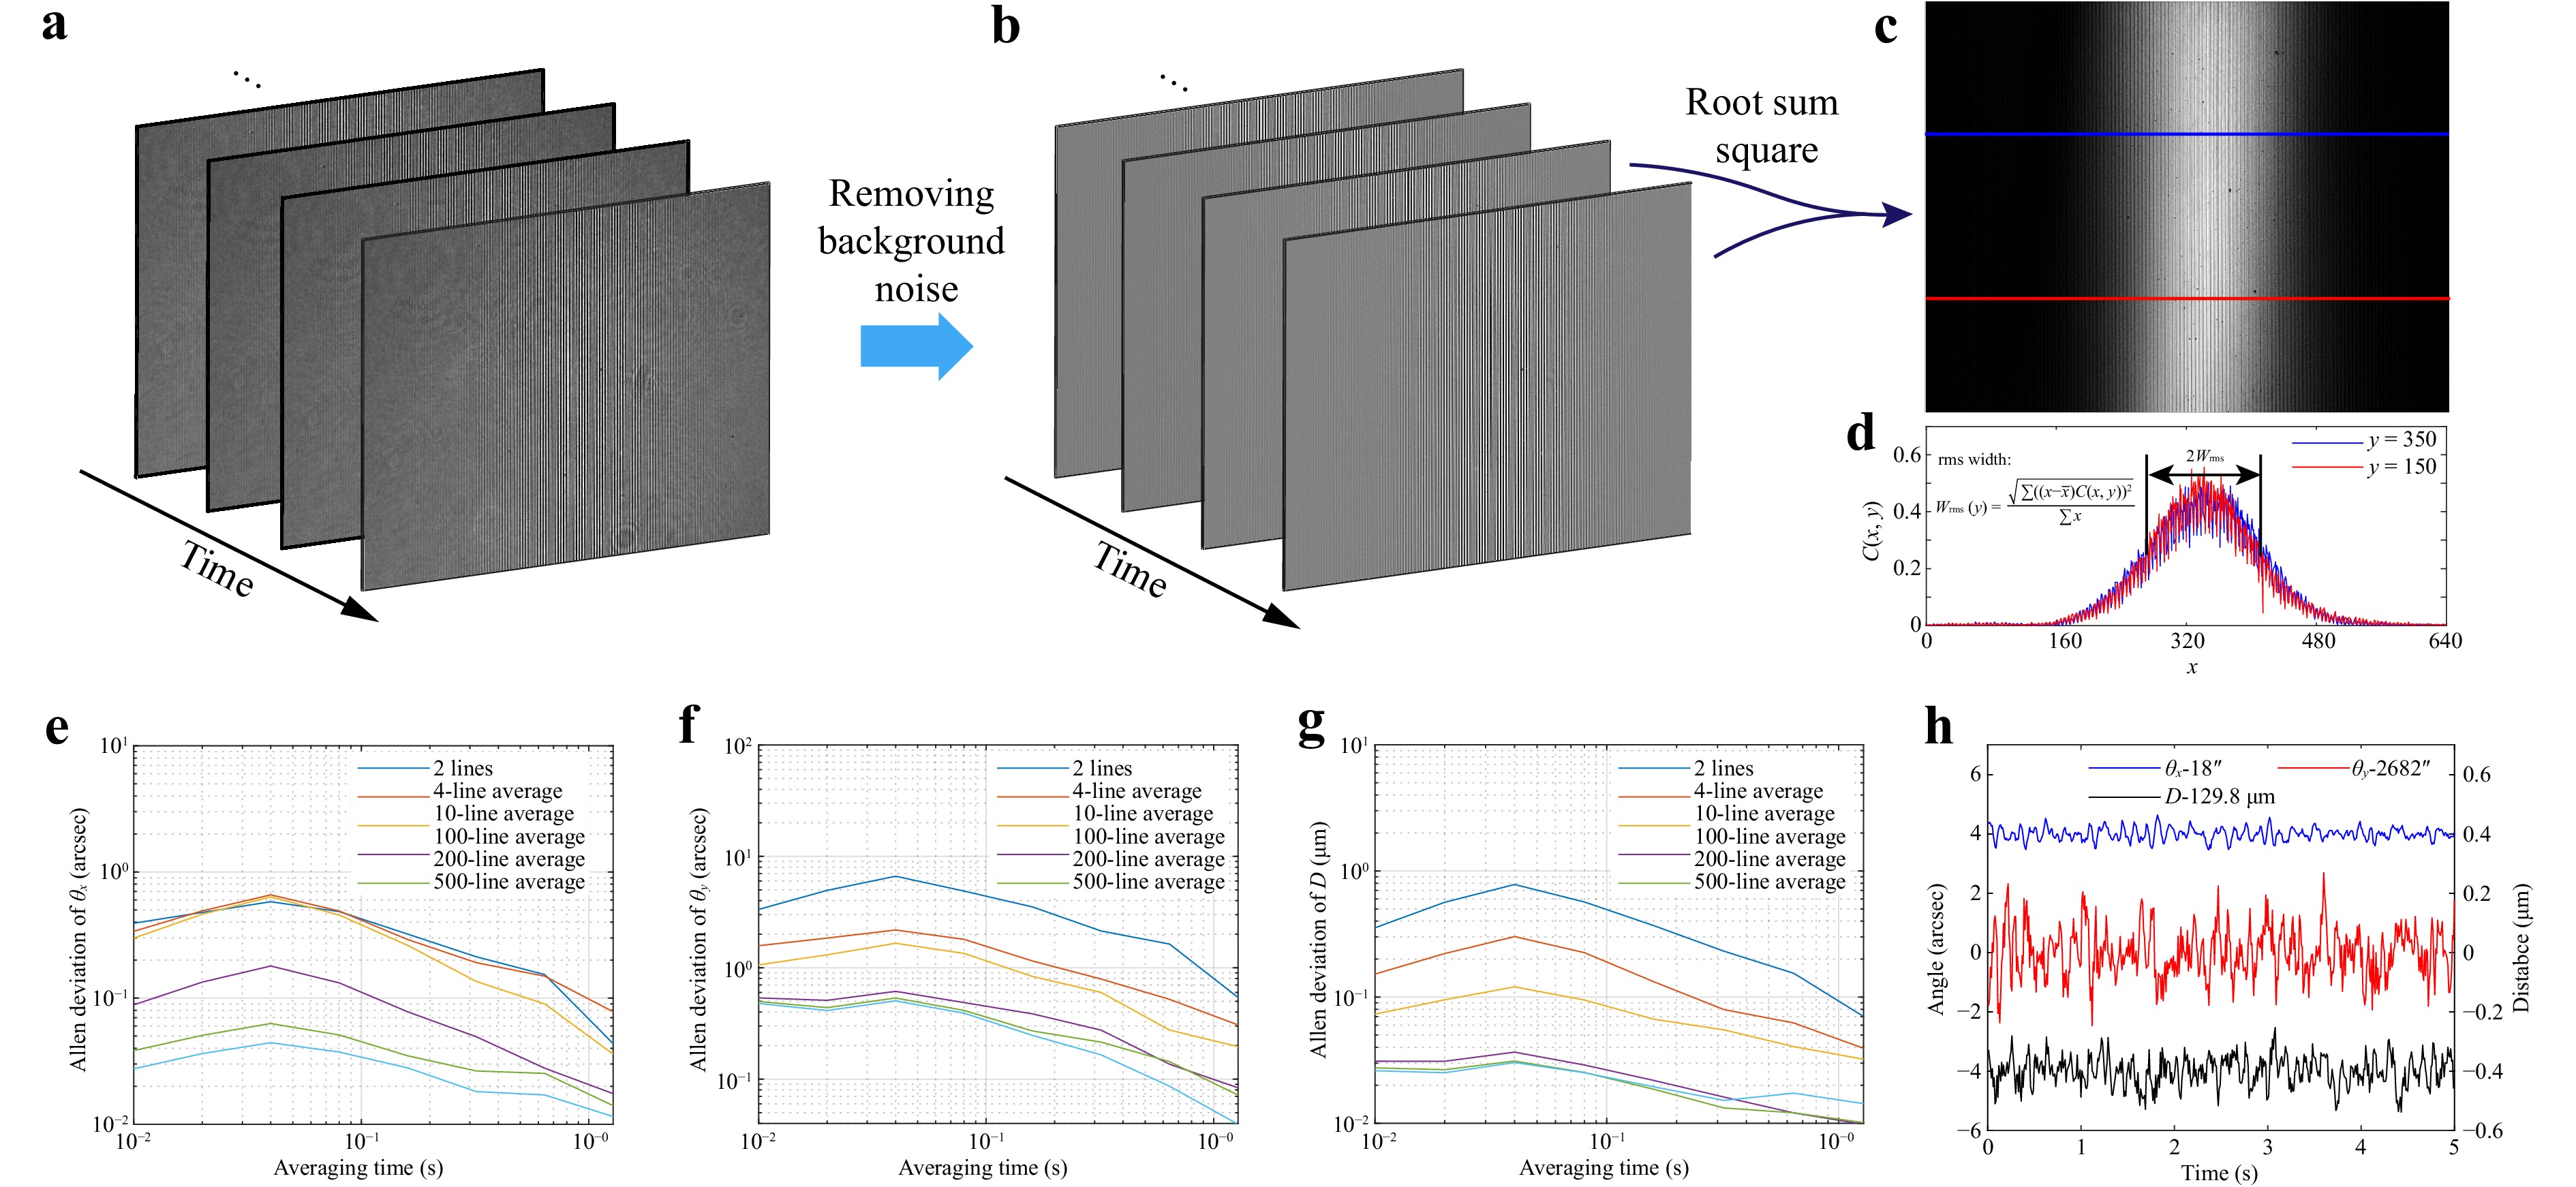
Fig. 2 Schematic diagram of signal processing and the static measurement results. a Raw signal captured by CCD. b Interferograms with background noise removed. c By modulating the fr periodically, the phase difference between every two adjacent interferograms is π/2, and their root sum square is the coherence intensity. d 1D coherence intensity distribution corresponding to the section of (c) along the line. e-g Static measurement results of pitch angle, yaw angle and axial distance. h Static measurement results after 100-line spatial averaging in the time domain.
The results of the polar angle θ measurement can be traced back to the coherence time τ of the light source, specifically tan θ = 2W/Acτ, where the imaging system magnification A is equal to 0.98. The τ is obtained by fitting the calibration results of the autocollimator. Under the current configuration, the relationship between θ and W is consistent with the theoretical prediction within a range of 1000" (2450″ to 3450″).
In theory, selecting any two lines on the CCD that contain complete envelopes is sufficient for performing the calculations. Furthermore, by averaging multiple lines, the precision of a single measurement can be further improved. This is called spatial averaging. To validate the effectiveness of spatial averaging, y = 7 and y = 506 was selected as the first pair of intersection lines used for the measurement. Intersecting lines were progressively added towards the center until 500 lines were selected, ranging from y = 7 to y = 506. Then, the average measurement results from different sets of lines were compared. Taking a 5-second data set as an example, Fig. 2e-g show several spatial averaging parameters corresponding to the Allen deviation of the three-DOF measurements. The precision of θx is about an order of magnitude better than that of θy, because when φ ≈ 0, most of the error of θ is transmitted to θy. The sensitivity of D is related to θ, but the limited range of measurable θ has little effect on precision. From these three graphs, it can be observed that 100-line spatial averaging can increase the precision of a single frame by one order of magnitude, and a further increase in the number of spatial averaging has little effect on the measurement results. At this point, the single-frame angular precision can reach the subarcsecond level, and the distance measurement precision can reach tens of nanometers. The three-DOF measurement results obtained after 100-line spatial averaging are shown in Fig. 2h. After 100-line averaging, the angular measurement had a standard deviation better than 1", and the axial distance measurement had a standard deviation better than 0.1 micrometers, both at a measurement rate of 100 Hz.
-
Unlike other interferometric methods, LCSI uses a coherence envelope for positioning and does not rely on phase values; therefore, it is also suitable for non-smooth surfaces. When the sample surface was a rough plane, the light intensity, interference amplitude, and phase received by each camera pixel were randomly modulated. However, under the statistical effect of a large number of measurement points in the entire field, the distribution of the coherence envelope remained distinguishable. Fig. 3 shows the measurement results for 220-grit ground glass (DG10-220, Thorlabs). Fig. 3b, c show the raw speckle pattern captured by the CCD and the extracted coherence intensity using a similar method, respectively. Fig. 3d shows the coherence intensity distribution on two intercepting lines, y = 306 and y = 207. The results of the three-DOF precision are shown in Fig. 3e. Using the method described earlier, 100 rows were averaged per frame, and the angle precision was still better than 1" under a measurement rate of 100 Hz, and the distance precision was better than 0.1 micrometers, which could be further improved by time averaging. In addition, a six-DOF piezoelectric displacement stage (P562.6CD, PI) was controlled to perform stepwise motion to test the system resolution, with an angle step of 2" and a distance step of 0.2 micrometers, each step lasting 0.5 seconds. The experimental results are shown in Fig. 3f. It should be noted that the vertical axes in the figure represent absolute measurement results with respect to the system’s internal parameters. The angles reflect the actual angle between the two interfering beams of light, while the distance refers to the position where the measured plane is translated by the specified distance, resulting in the highest contrast pulse alignment interference at the center of the camera’s field of view. Even for rough surfaces, LCSI can distinguish changes in the angle and displacement at the arcseconds and submicrometer levels, respectively.
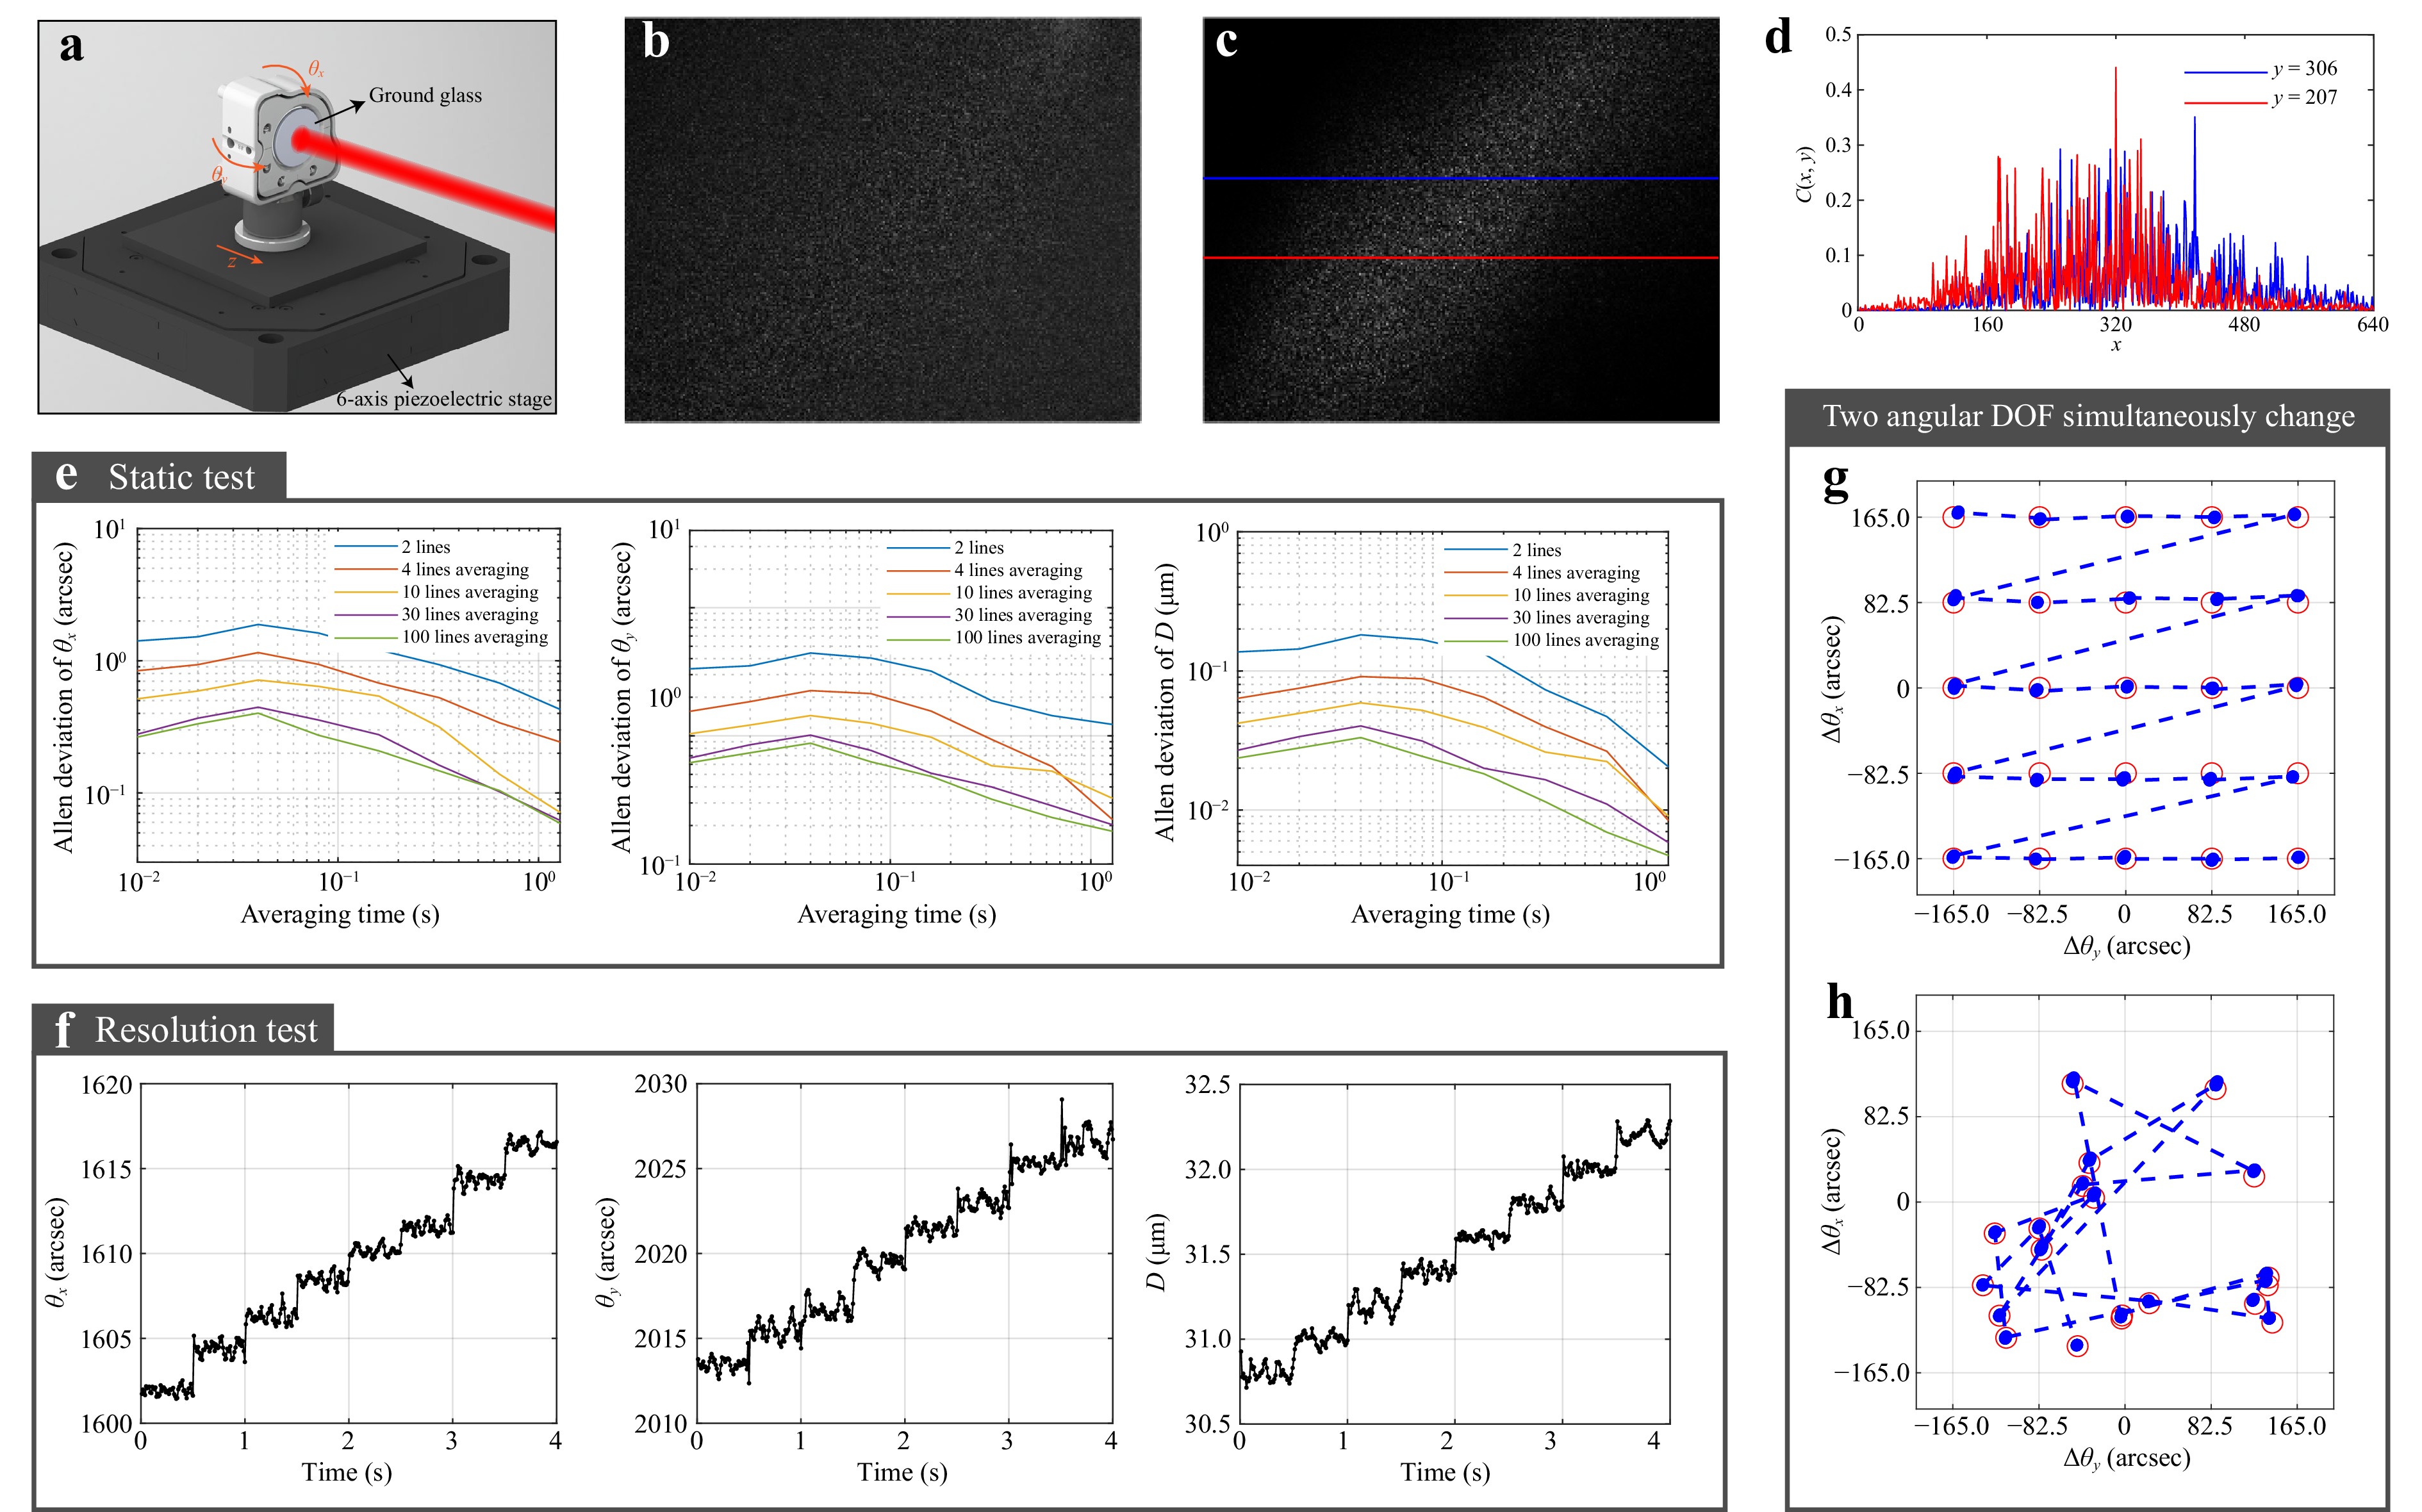
Fig. 3 Three degrees of freedom measurement results of ground glass. a Diagram of measurement sample installation. b a raw signal captured by CCD. c 2D distribution of coherence intensity after removing background noise and interference phase. d 1D distribution of coherence intensity corresponding to the section line in (c). e Allen deviation of pitch angle, yaw angle and axial distance. f resolution test results, where the step length of pitch angle or yaw angle is 2", of axial distance is 0.2 μm. g Results of two angular DOF equal step scanning. The red circle denotes the stage’s target position with a radius of 10", while the blue dashed line traces the measurement results' trajectory. h Results of random two angular DOF motion, detailed further in the Supplementary video showcasing the dynamic measurement process.
To further verify the coupling between the two angular DOF, a two-dimensional scan of pitch and yaw was performed by driving the piezoelectric displacement stage within its stroke with a scanning step of 82.5", as shown in Fig. 3g. The red circle represents the target position of the stage with a radius of 10". The dashed blue line indicates the trajectory of the measurement results. It can be inferred that the angular measurement accuracy of the system is better than 10" within a range of motion of 330" × 330". This angular range is limited by the stroke of the stage, while the stage can provide a closed-loop repeatability better than 0.03" within this range, making it a reliable reference. Additionally, a random angular loading experiment was conducted, and the measurement trajectory is shown in Fig. 3h. The measured values match the set values.
-
The method described above, which employs image analysis for measurement, enables the simultaneous acquisition of the 3-DOF of multiple targets within the same FOV. This capability is valuable in many precision splicing processes. For instance, segmented mirrors are constructed by splicing together multiple sub-apertures, thus achieving a larger aperture at a reduced cost. To ensure imaging quality, it is essential to control the relative positions of the sub-apertures at their junctions to maintain phase synchronization44–46, necessitating synchronous measurement of each sub-aperture’s position and orientation. To demonstrate LCSI’s application in multi-target measurements, a model of segmented mirror was used as the sample, as shown in Fig. 4a. Due to the large radius of curvature of each surface, they are approximated as planes. The model includes three surfaces polished with 800-grit sandpaper, with a PZT supporting the central junction area, enabling the simultaneous adjustment of the three surfaces by actuating the PZT. Using LCSI, a grayscale image of the sample’s center was obtained within the FOV, as illustrated in Fig. 4b, where P0 indicates the midpoint of the image. Here, the imaging system is performed using a combination of two lenses, each with a focal length of 150 mm. The camera used is an extended short-wave-infrared CCD (G-130, Allied Vision), with a frame rate set to 40 fps at 1280 × 1024 resolution and 12-bit depth. From the image, the coherence intensity was extracted as shown in Fig. 4c, revealing three distinct coherence envelope distribution lines due to the different DOFs of the three targets. For analyzing the 3-DOF, a cyan square region was selected on each of the three envelopes, each containing 250 × 250 pixels. Thirty measurement lines were horizontally selected for spatial averaging to measure the 3-DOF coordinates of each target’s plane at P0. When subjected to a 5 Hz sinusoidal voltage applied to the PZT, LCSI effectively captured the subtle 3-DOF changes for each of the three target planes, as demonstrated in Fig. 4d-f. Therefore, our LCSI method benefits from not relying on phase-based measurements, and thus is not subject to the decorrelation issues that affect traditional method (heterodyne interferometry or speckle interferometry) when the target undergoes relatively fast motion.
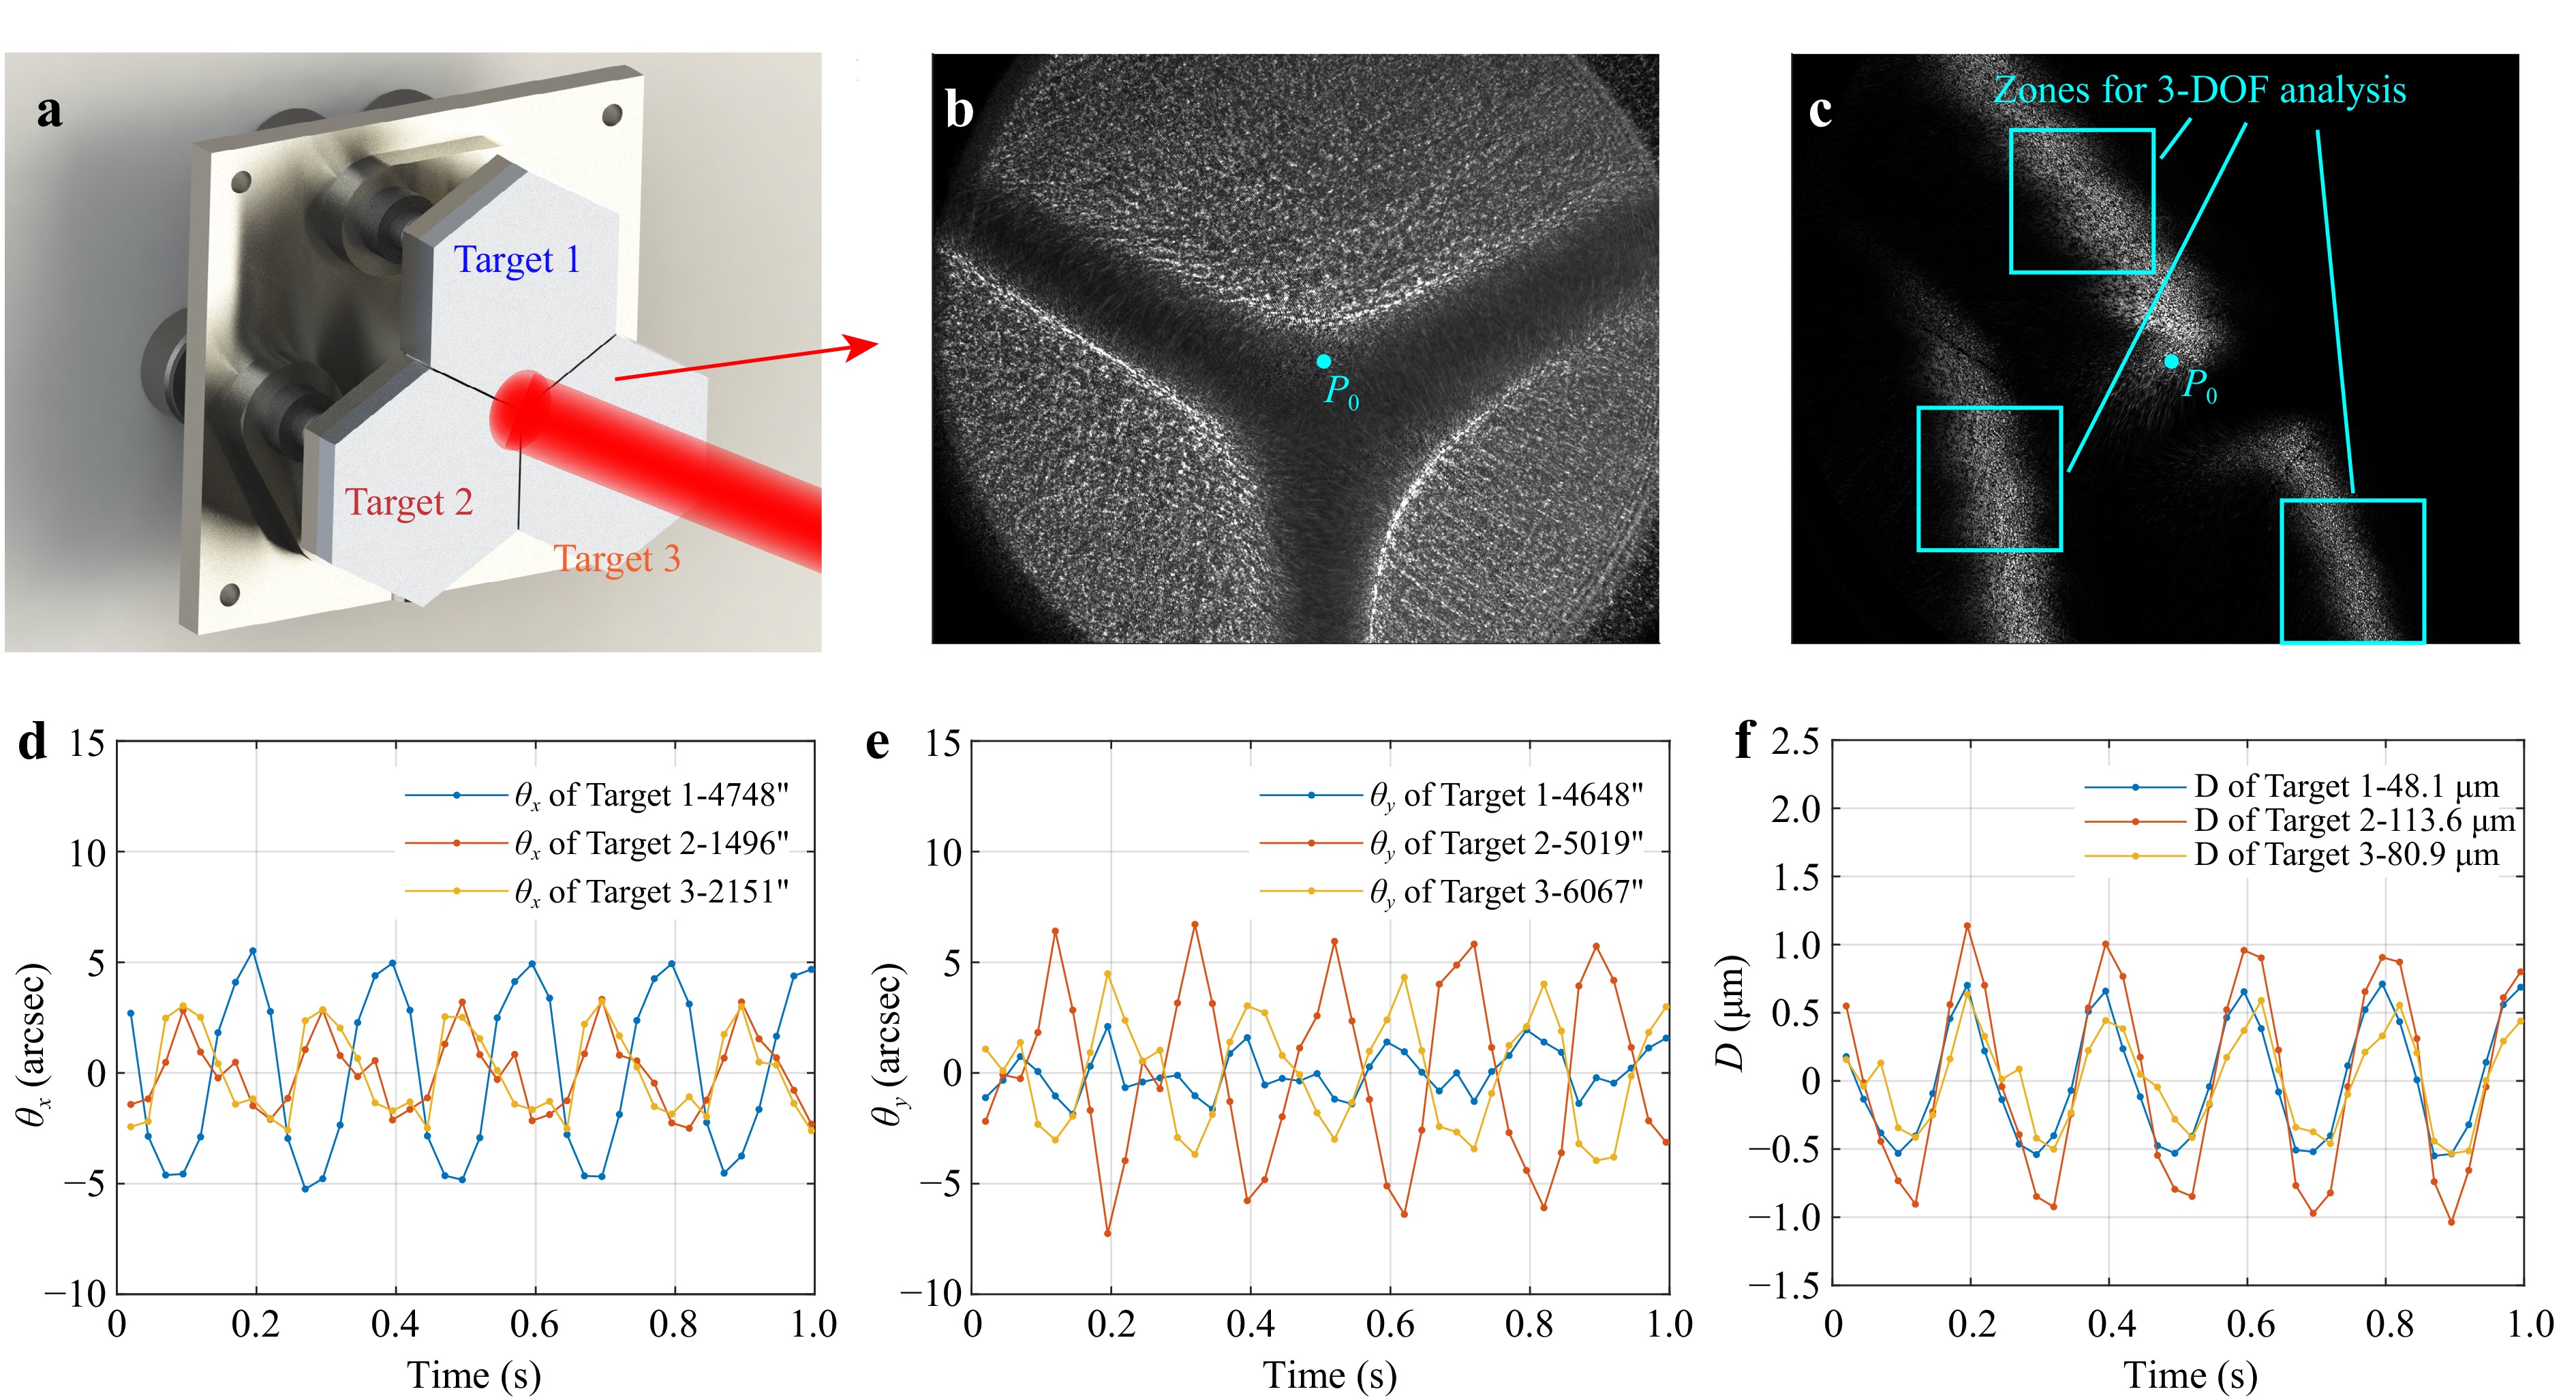
Fig. 4 Multi-target measurement results of the synthetic aperture model. a Schematic diagram of the sample and measurement beam, where the beam diameter is approximately 18 mm; b Raw image of the sample’s center in LCSI; c 2D coherence intensity distribution after temporal phase-shifting; d-f Movement of the three targets in pitch angle θx, yaw angle θy, and axial position D, respectively, measured during the vibration of the PZT.
-
In this paper, we explored the feasibility of single-beam pose measurement through the analysis of low-coherence interferograms, employing a mode-locked femtosecond laser with fr modulation to realize a LCSI system that operates without mechanical scanning. This system captures low-coherence interferograms reflecting the target pose at any distance, utilizing pulse alignment and imaging techniques. The demodulation of the coherence envelope, applicable to both smooth and rough surfaces, forms the method’s crux. High quality in the coherence envelope is achieved through dynamic adjustment of fr, allowing for continuous phase shifting and the extraction of key parameters for 3-DOF measurement. Furthermore, this technique has potential for expansion; when measuring rough surfaces, it complements digital speckle pattern correlation techniques perfectly47–48, paving the way towards video-rate six-DOF measurements of non-cooperative targets with a single beam.
The validation of LCSI was conducted using both plane mirrors and ground glass, achieving arcsecond-level precision in angular measurements and submicrometer precision in distance measurements at a 100 Hz frame rate, with further precision enhancement possible through temporal averaging. Although deviations caused by the random distribution of particles on rough surfaces cannot be eliminated through temporal averaging, no particularly significant impact was observed in the experiments. Meanwhile, this method exhibits minimal sensitivity to laser noise. On one hand, due to the short time interval (M/fr = 282 ns) between interfering pulses from our mode-locked laser, integrated phase jitter is negligible. On the other hand, intensity fluctuations typically remained below 1%, causing substantially less impact on interferogram quality compared to other uncertainties, such as phase-shift errors and pixel discretization.
One limitation identified is the angular measurement range, primarily constrained by detector pixel dimensions and imaging system aperture, restricting coherence envelope extraction at larger angular separations. Possible approaches to overcoming this limitation include applying nonlinear calibration to extend the measurable range, employing higher-resolution detectors combined with larger-aperture imaging systems to directly expand angular measurement capabilities, or adjusting the reference mirror orientation to accommodate targets with larger angular displacements. Such optimizations can be tailored according to specific engineering needs and operational scenarios.
The computational efficiency of the 3-DOF solving algorithm suggests that it has the potential to meet the demands of real-time measurements, demonstrating its suitability for the rigorous positioning requirements of industrial production and scientific research. Applications include monitoring the deformation of structures deep within aviation engines or the dynamic changes in thin films. Moreover, this method’s ability to simultaneously measure multiple targets within a single FOV is particularly beneficial for high-precision assembly tasks. It facilitates direct inspection of the work surface, eliminating the concern for assembly inaccuracies that cooperative targets might introduce.
In conclusion, our research marks a significant advancement in precise multi-DOF measurement, a field where most currently reported methods concentrate on high-sensitivity targets or surface materials, with the absolute measurement of non-cooperative targets remaining a persistent challenge. The comparison with previous multiple DOF measurement methods can be found in Supplementary Information S1. This breakthrough opens new avenues for addressing complex measurement tasks in industrial production and scientific research.
-
According to Fermat’s principle, the polar angle θ between the optical axis and reference plane can be calculated as θ = tan−1(AcτW/2), where A represents the imaging transmittance, c represents the speed of light, τ represents the coherence time of the light source, and W is the coherence width measured on the CCD. The axial distance D is obtained by the average repetition frequency of the light source and the pulse alignment position. After measuring the azimuth angle φ from the coherence image, the coordinate system of the object is established by first translating along the axial direction by D, followed by counterclockwise rotation around the x-axis by θx = −tan−1(tanθsinφ), and then counterclockwise rotation around the y-axis by θy = sin−1(sinθcosφ). See Supplementary Information S2 for detailed explanations and S3 for data processing flow.
The τ and A were calibrated before measurement. The coherence time τ is obtained by fitting the relationship between the coherence width W and the change in polar angle θ. The imaging transmittance A is determined by dividing the imaging size of a specific target by its actual size. Calibration details are provided in Supplementary Information S5 and S6.
We employed the root-mean-square (rms) method to calculate the coherence width. Compared with the typical Gaussian fitting method, the rms method offers superior speed and repeatability. More details and supporting information can be found in Supplementary Information S7.
-
In the optical system shown in Fig. 1a, the interference light intensity I received by a pixel on the camera can be approximated as the product of the coherence envelope and the carrier phase, expressed as: I = I0exp[−(L − mLpp)2/w2]cos[2π/λc(L − mLpp) + mΔφceo]. Here, I0 is the average intensity of the interference signal, L represents the optical path difference between the two beams, m is the order number of the pulses overlapping due to misalignment, Lpp is the period of pulse propagation in vacuum (also represented as c/fr), w is a coefficient related to the pulse width, λc is the central wavelength, and Δφceo is the phase difference between adjacent pulses. After determining an appropriate initial Lpp (denoted as Lpp0), a continuous linear phase shift is achieved by controlling fr feedback to scan mLpp linearly from mLpp0 + λc/2 to mLpp0-λc/2, causing a full cycle change in the carrier phase, and then directly switching back to mLpp0 + λc/2 to repeat the process. During this process, the change in mLpp relative to the pulse width coefficient w is small, thus its impact on the coherence intensity is negligible. The scanning speed is synchronized with the camera frame rate, maintaining 4 frames per cycle.
-
The authors kindly thank Prof. Liangcai Cao and Prof. Yuanmu Yang of Tsinghua University for fruitful discussions, and Prof. Haoyun Wei for equipment loan. This work was supported by the National Natural Science Foundation of China (Grants No. 52327805, 62227822).
Three-degree-of-freedom measurement using a single probe beam
- Light: Advanced Manufacturing , Article number: (2025)
- Received: 15 January 2025
- Revised: 31 July 2025
- Accepted: 15 August 2025 Published online: 14 October 2025
doi: https://doi.org/10.37188/lam.2025.068
Abstract: Determination of position and orientation is essential in advanced manufacturing, automation, and material physics analysis. Traditional high-precision multiple degree-of-freedom (DOF) measurement techniques often rely on multiple probe beams to measure cooperative targets, introducing system complexity and potential measurement errors. Here, we present a novel method for three-degree-of-freedom measurement that employs low-coherence spatial interferometry (LCSI) with a single probe beam. Unlike conventional approaches, this method eliminates the need for cooperative targets and extends applicability to both smooth and rough surfaces. By leveraging the geometric characteristics of the coherence envelope and pulse alignment in a mode-locked femtosecond laser, our system acquires low-coherence interferograms at flexible axial positions, overcoming the constraint of equal-arm interference. Demonstrated at a real-time speed of 100 Hz, the method achieves arcsecond-level angular precision and sub-micrometer distance precision. Furthermore, it enables simultaneous measurement of multiple targets within the field of view, offering transformative potential for applications such as ensuring pose consistency in precision assembly and monitoring deformation during environmental testing. This work presents a novel single-probe-beam measurement approach, providing a compact and versatile solution for multi-DOF dynamic measurement.
Research Summary
Femtosecond pulse interferometry – precise pose measurement with a single beam
A new method based on femtosecond pulse interferometry enables high-precision measurement of distance and orientation using only a single laser beam. Unlike conventional systems that rely on special reflectors or cooperative targets, this technique works directly on rough or unprepared surfaces. It can measure axial position with sub-micrometer accuracy and detect angular changes below one arcsecond. Its compact design and ability to monitor multiple targets simultaneously make it especially suited for high-precision alignment and structural testing in advanced manufacturing environments.
Rights and permissions
Open Access This article is licensed under a Creative Commons Attribution 4.0 International License, which permits use, sharing, adaptation, distribution and reproduction in any medium or format, as long as you give appropriate credit to the original author(s) and the source, provide a link to the Creative Commons license, and indicate if changes were made. The images or other third party material in this article are included in the article′s Creative Commons license, unless indicated otherwise in a credit line to the material. If material is not included in the article′s Creative Commons license and your intended use is not permitted by statutory regulation or exceeds the permitted use, you will need to obtain permission directly from the copyright holder. To view a copy of this license, visit http://creativecommons.org/licenses/by/4.0/.

 DownLoad: