


-
Reverberant optical coherence elastography (Rev-OCE) utilizes reverberant wave fields generated by the continuous interference of multiple arbitrary mechanical waves traveling in all directions. Various excitation sources have been employed to generate reverberant wave fields; however, a fully noncontact method has yet to be developed, which would be beneficial for clinical translation. In this study, we introduce a novel modality to generate reverberant fields without contact using an array of non-focused air-coupled ultrasonic (ACUS) transducers (resonant frequency of 40 kHz). A robust reverberant field was characterized in a gelatin phantom to probe the efficacy of this reverberant elastography technique and applied to an ex vivo porcine cornea.
Optical coherence elastography (OCE), an elastography method based on optical coherence tomography (OCT)1, is a well-established technique for measuring the biomechanical properties of tissues by tracking the propagation of mechanical perturbations within the sample.2 Perturbations can be generated by several kinds of sources, and they have been used in OCE to produce waves within the samples2,3; however, truly noncontact loading methods are largely preferred for many applications, such as for the eye. To this end, ACUS transducers4 have been used to excite mechanical waves in ocular tissues, such as in vivo rabbit5 and mouse6–8 corneas and in vivo rabbit sclera9. In addition, ACUS-OCE has been used to determine the biomechanical properties of engineered skin scaffolds10, demonstrating its capacity to produce guided waves in delicate specimens without causing significant damage. In addition to truly noncontact excitation, ACUS provides tight control over the spatiotemporal characteristics of the stimulation4,11, which is critical for robust mechanical quantitation12.
Wave-based OCE has emerged as a popular method for biomechanical characterization of tissues in the past decade because mechanical parameters such as Young’s modulus can be quantified without knowledge of the loading forces, which is in contrast to the other popular OCE method, compression OCE3,13,14. Various wave-based methods and corresponding models have been developed, with those based on shear and surface waves being the most widely used. In addition, guided waves can describe the biomechanical properties of thin tissues like the cornea. However, complex boundary conditions in highly heterogeneous structures severely limit the use of these typical wave-based OCE techniques. Rev-OCE overcomes this disadvantage because the multiple reflections that otherwise are undesirable provide for enhanced mechanical contrast in comparison to typical wave-based OCE12. In Rev-OCE, multiple excitation sources induce a reverberant field15, which is the interference of multiple arbitrary mechanical waves propagating in multiple directions. The generation of a reverberant shear field with Rev-OCE has been performed using up to 8 sources (a 3D-printed ring with eight rods attached to a piezoelectric bender)12,16,17, a multifocal acoustic radiation force with 718 and 3 acoustic lenses19, and semi-RevOCE with two rods in contact with the sample20. To our knowledge, all presented Rev-OCE methods require direct contact, indirect contact21, or a coupling media to generate the mechanical waves in the sample. Thus, in this study, we developed an array of five ACUS transducers arranged for confocal OCT imaging, and the mechanical contrast and resolution in a heterogeneous tissue-mimicking phantom were characterized to demonstrate the feasibility of truly noncontact, i.e., “no touch” Rev-OCE.
The unfocused ACUS transducers (resonant frequency of 40 kHz, TCT40-16, Shenzhen HiLetgo Technology Co., Ltd, China) are commonly used as ultrasonic distance sensors in a transmitter and receiver paradigm with separated piezoelectric hardware22,23. These transducers have also been used to build an acoustic resonator for measurement of index of refraction by defocusing shadowgraphy24. In this study, these transmitters were used to generate a reverberant field. They were characterized using a microphone, as shown in Fig. 1a, which assessed the beam width (~4.37 mm) at the maximum acoustic pressure (Fig. 1b) at a working distance of ~ 10 mm for a single transducer. Once the working distance at the maximum acoustic pressure was determined, five ACUS transducers were aligned in a circle to generate mechanical waves independently with ~10 mm spacing between each transducer (Fig. 1c). The distance between the transducers ensured no overlap in the excitation spots and guaranteed excitation of a robust reverberant field, as shown in Fig. 1d, which shows the pressure distribution of the arrangement of 5 transducers shown in Fig. 1c. As described above, the 2D acoustic pressure distribution generated by the array of transducers was measured by the microphone, demonstrating aligning of multiple acoustic beams in the same plane.
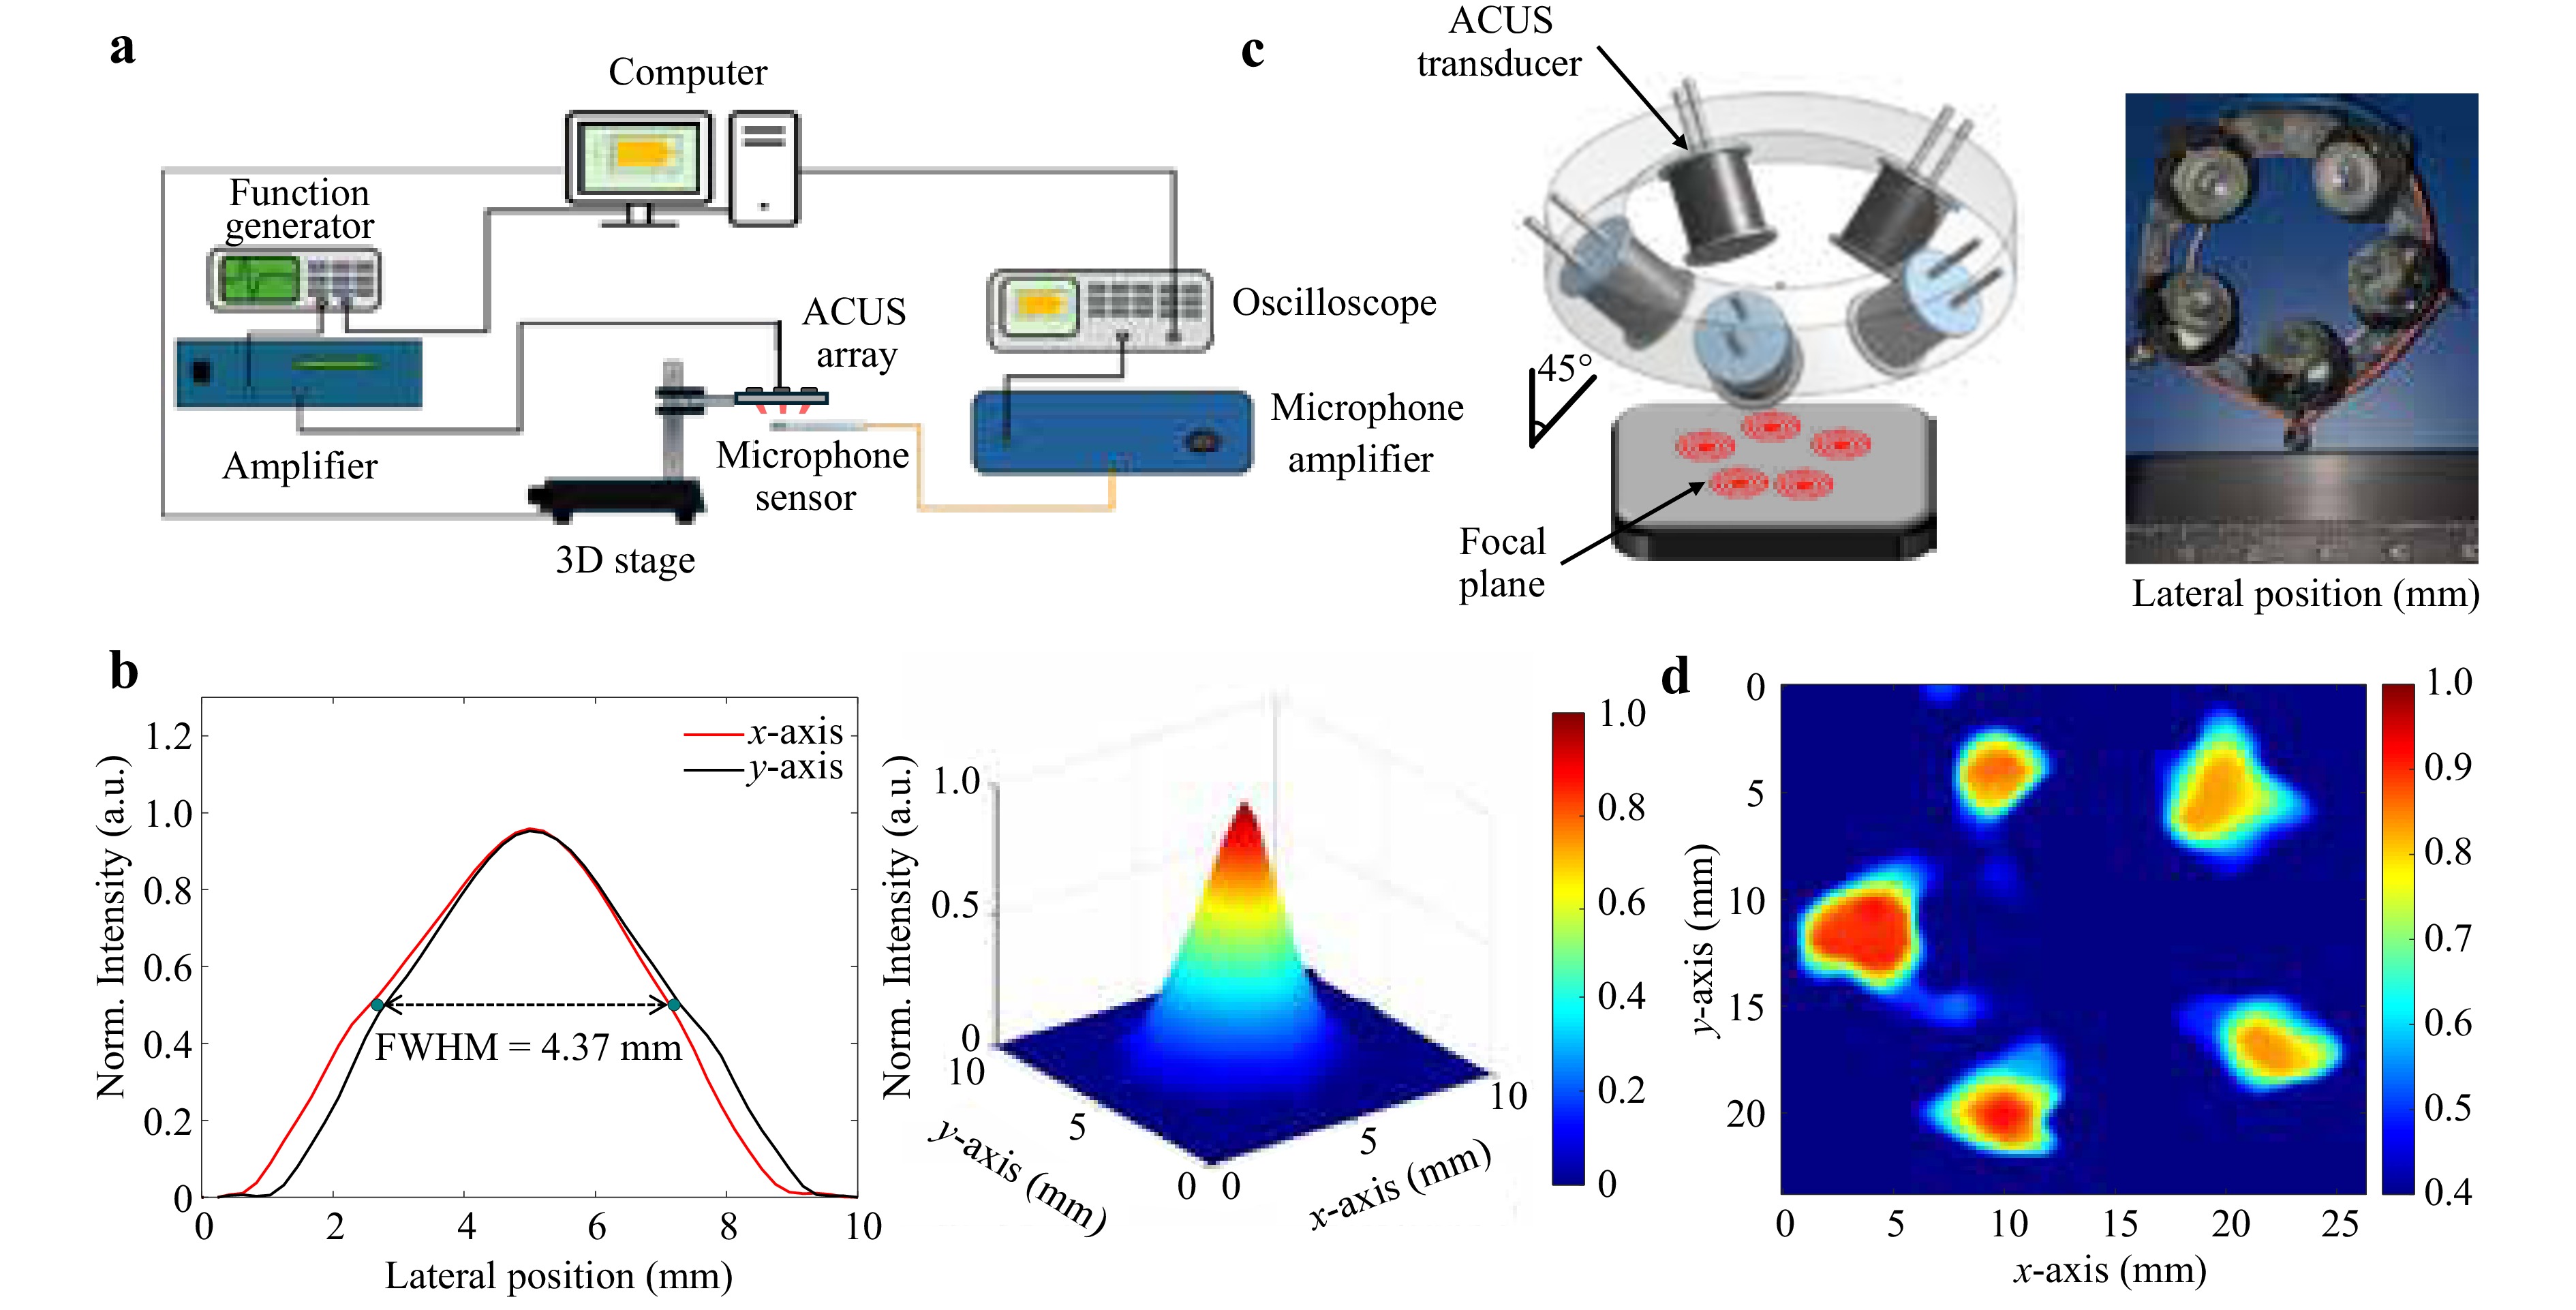
Fig. 1 Characterization of the ACUS reverberant setup. a Schematic of the setup used to measure the pressure field of a single ACUS transducer using a microphone mounted on an automatic translational stage for 2D scanning in the xy-plane. b Normalized acoustic pressure distribution at the focal plane (FWHM = 4.37 mm) of a single transducer. c 3D representation of the ACUS array and 3D printed holding ring alongside an image of the device. d Normalized acoustic pressure distribution at the focal xy-plane produced by the five-transducer array.
-
Fig. 2a illustrates a schematic of the phase-sensitive spectral domain OCT (PhS-SDOCT) system6 used to evaluate the capabilities of the ACUS transducer array in a heterogeneous gelatin phantom with a stiffer (8% gelatin concentration, w/w) and softer (4% gelatin concentration, w/w) side (Fig. 2b). As shown in Fig. 2c, the motion volume snapshots reveal the reverberant wave field, highlighting the distinct wavelengths between the softer and stiffer regions in the tissue-mimicking side-by-side phantom. The soft region (4% gelatin) presented an attenuated particle velocity compared to the stiffer region of the phantom (8% gelatin), which could be attributed to the mechanical differences between both sides of the phantoms and the excitation closer to the sample25. This demonstrates the ability of the ACUS transducer array to effectively generate a reverberant wave field.
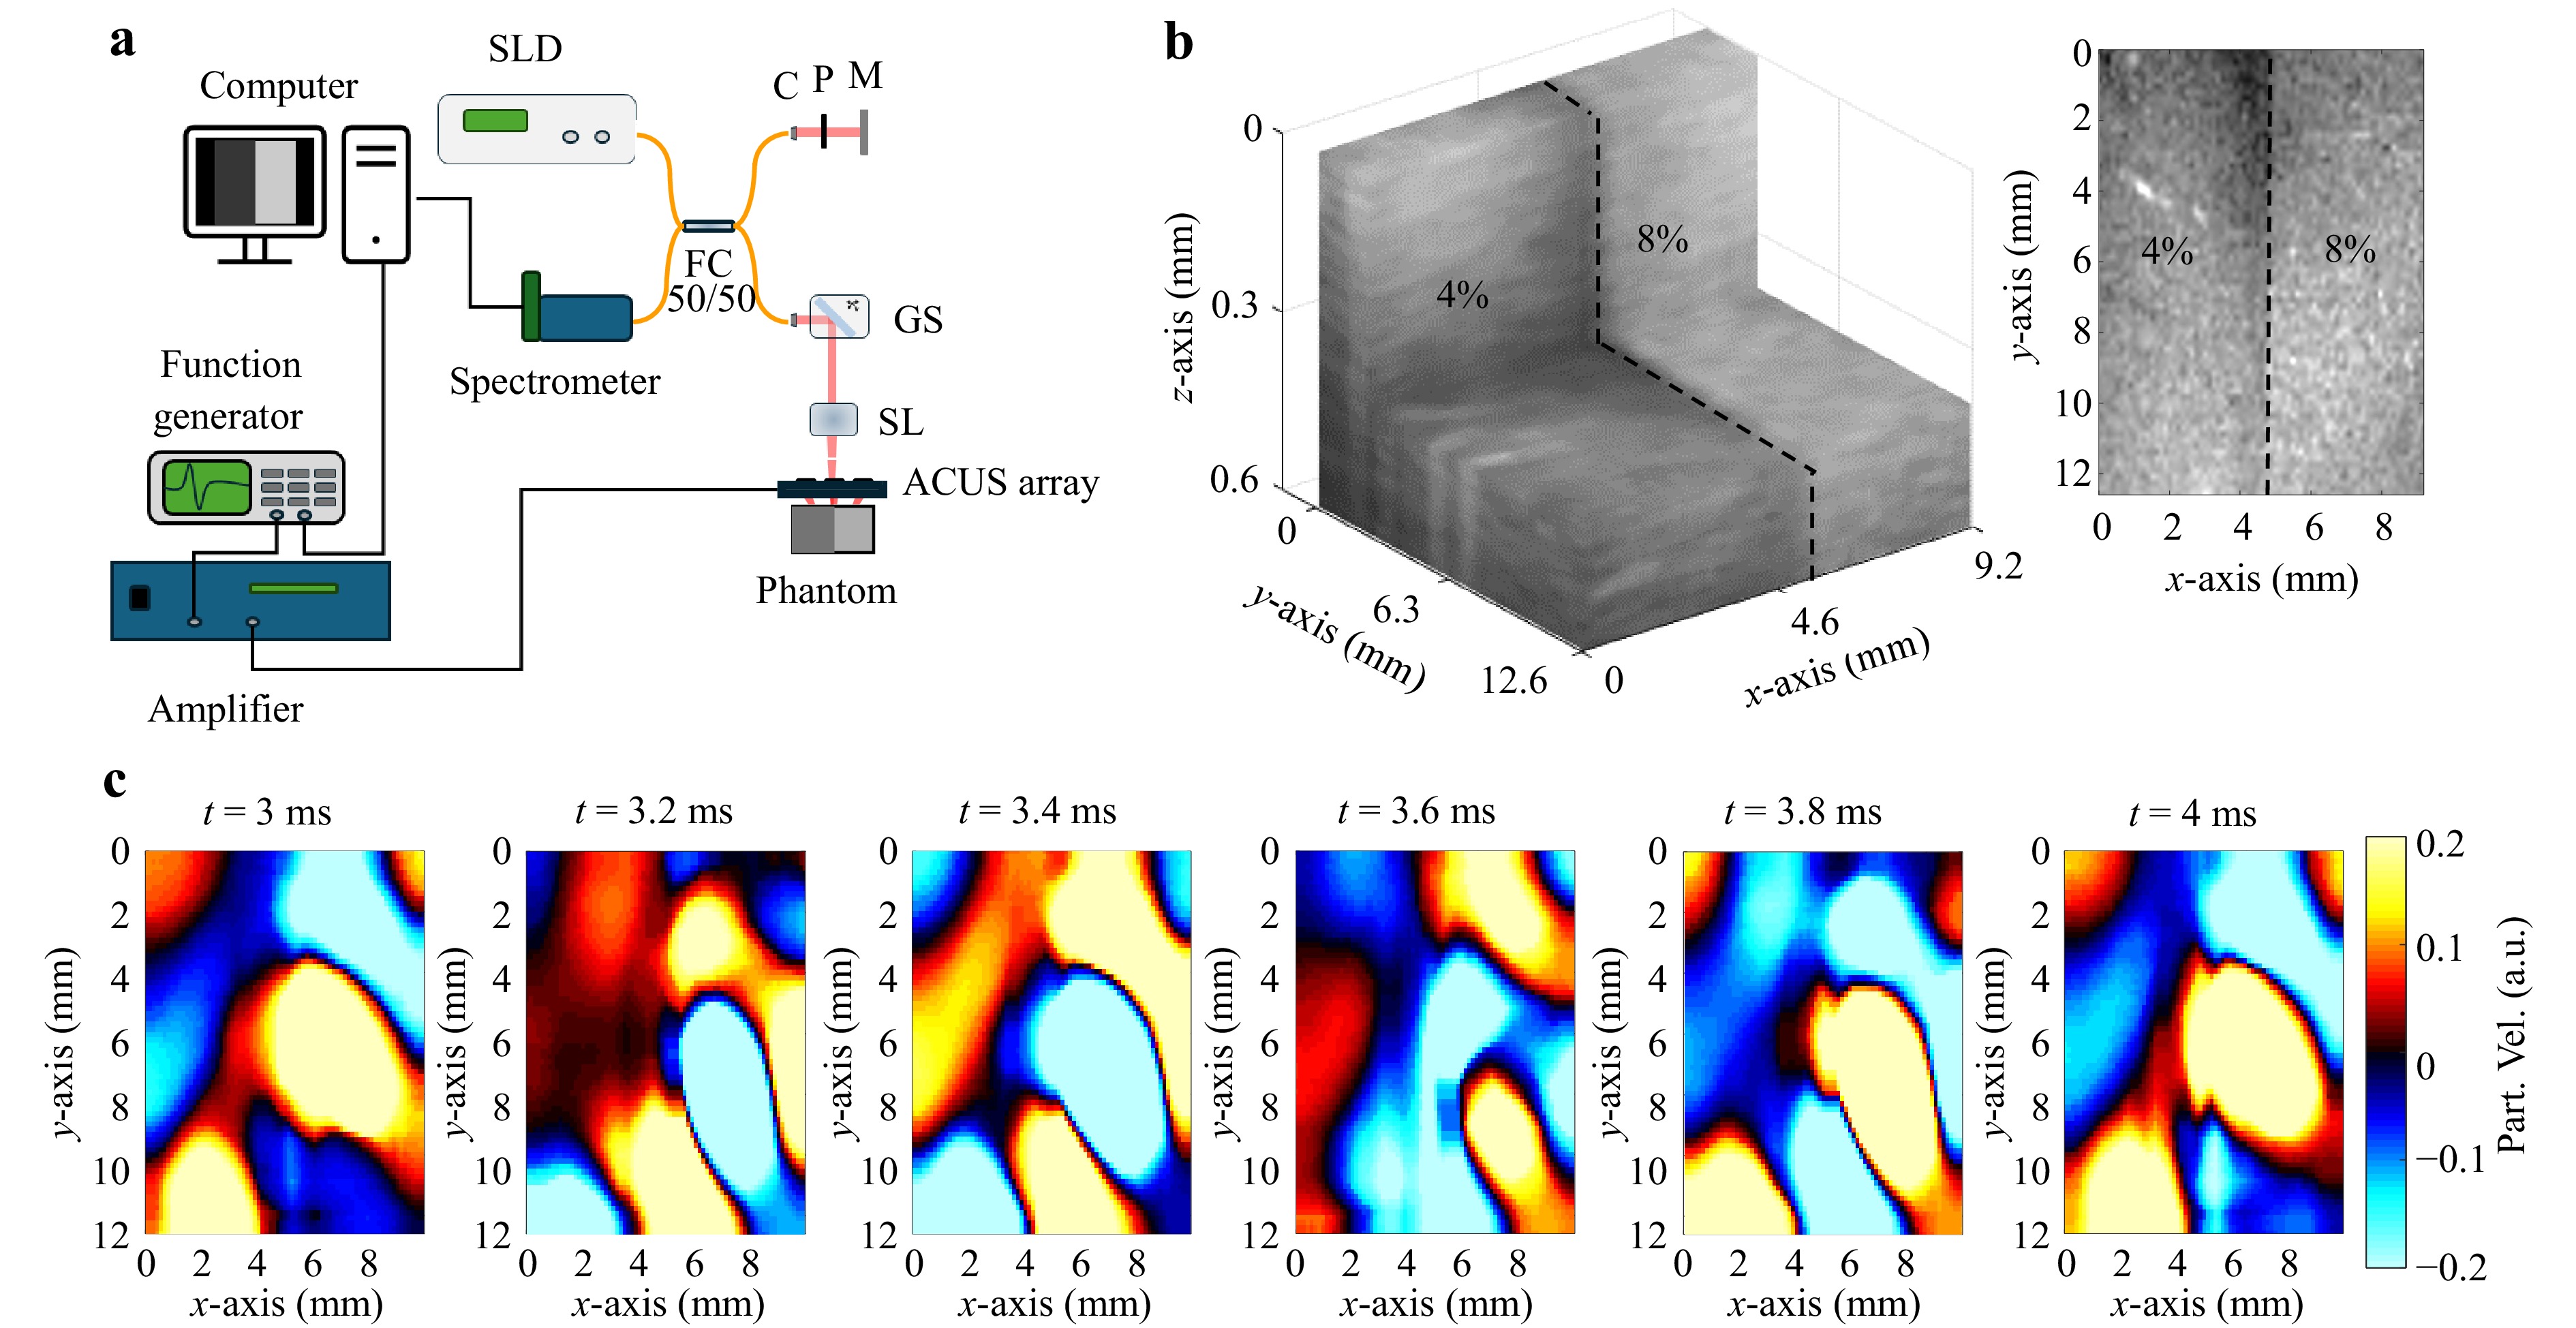
Fig. 2 Rev-OCE imaging of a heterogeneous tissue-mimicking gelatin phantom. a PhS-SDOCT system setup used for Rev-OCE imaging induced by the array of ACUS transducers. C: collimator, GS: 2D Galvo scanner, M: mirror, P: pinhole, SL: scan lens. SLD: superluminescent diode. b 3D OCT image of a side-to-side phantom (12.6 × 9.2 × 0.56 mm3) with lateral distribution of two layers (gelatin concentration of 4%) and a stiffer layer (gelatin concentration of 8%) and en face image side-by-side (z = 0.3 mm). c Snapshots of the reverberant shear field at the indicated time points after excitation (en face image side-by-side, z = 0.3 mm). The color bar refers to the axial particle velocity.
The axial particle velocity was utilized to calculate the wave speed in each xy-plane by fitting the 2D-autocorrelation profiles according to the standard Rev-OCE processing method,12 detailed in the Materials and Methods section. The elastic contrast between the softer and stiffer regions in the phantoms is illustrated in Fig. 3a, where the average elastic wave speed in the soft region (4% gelatin concentration) was 1.6 ± 0.1 m/s, and 2.6 ± 0.1 m/s in the stiff region (8% gelatin concentration). Figure 3b shows that the lateral elastic resolution was 208.8 ± 72.4 μm measured in three different side-to-side phantoms quantified as the full width at half maximum (FWHM) of a derivative of a sigmoid fitted to the speed profile18 across the boxed area in Fig. 3a.
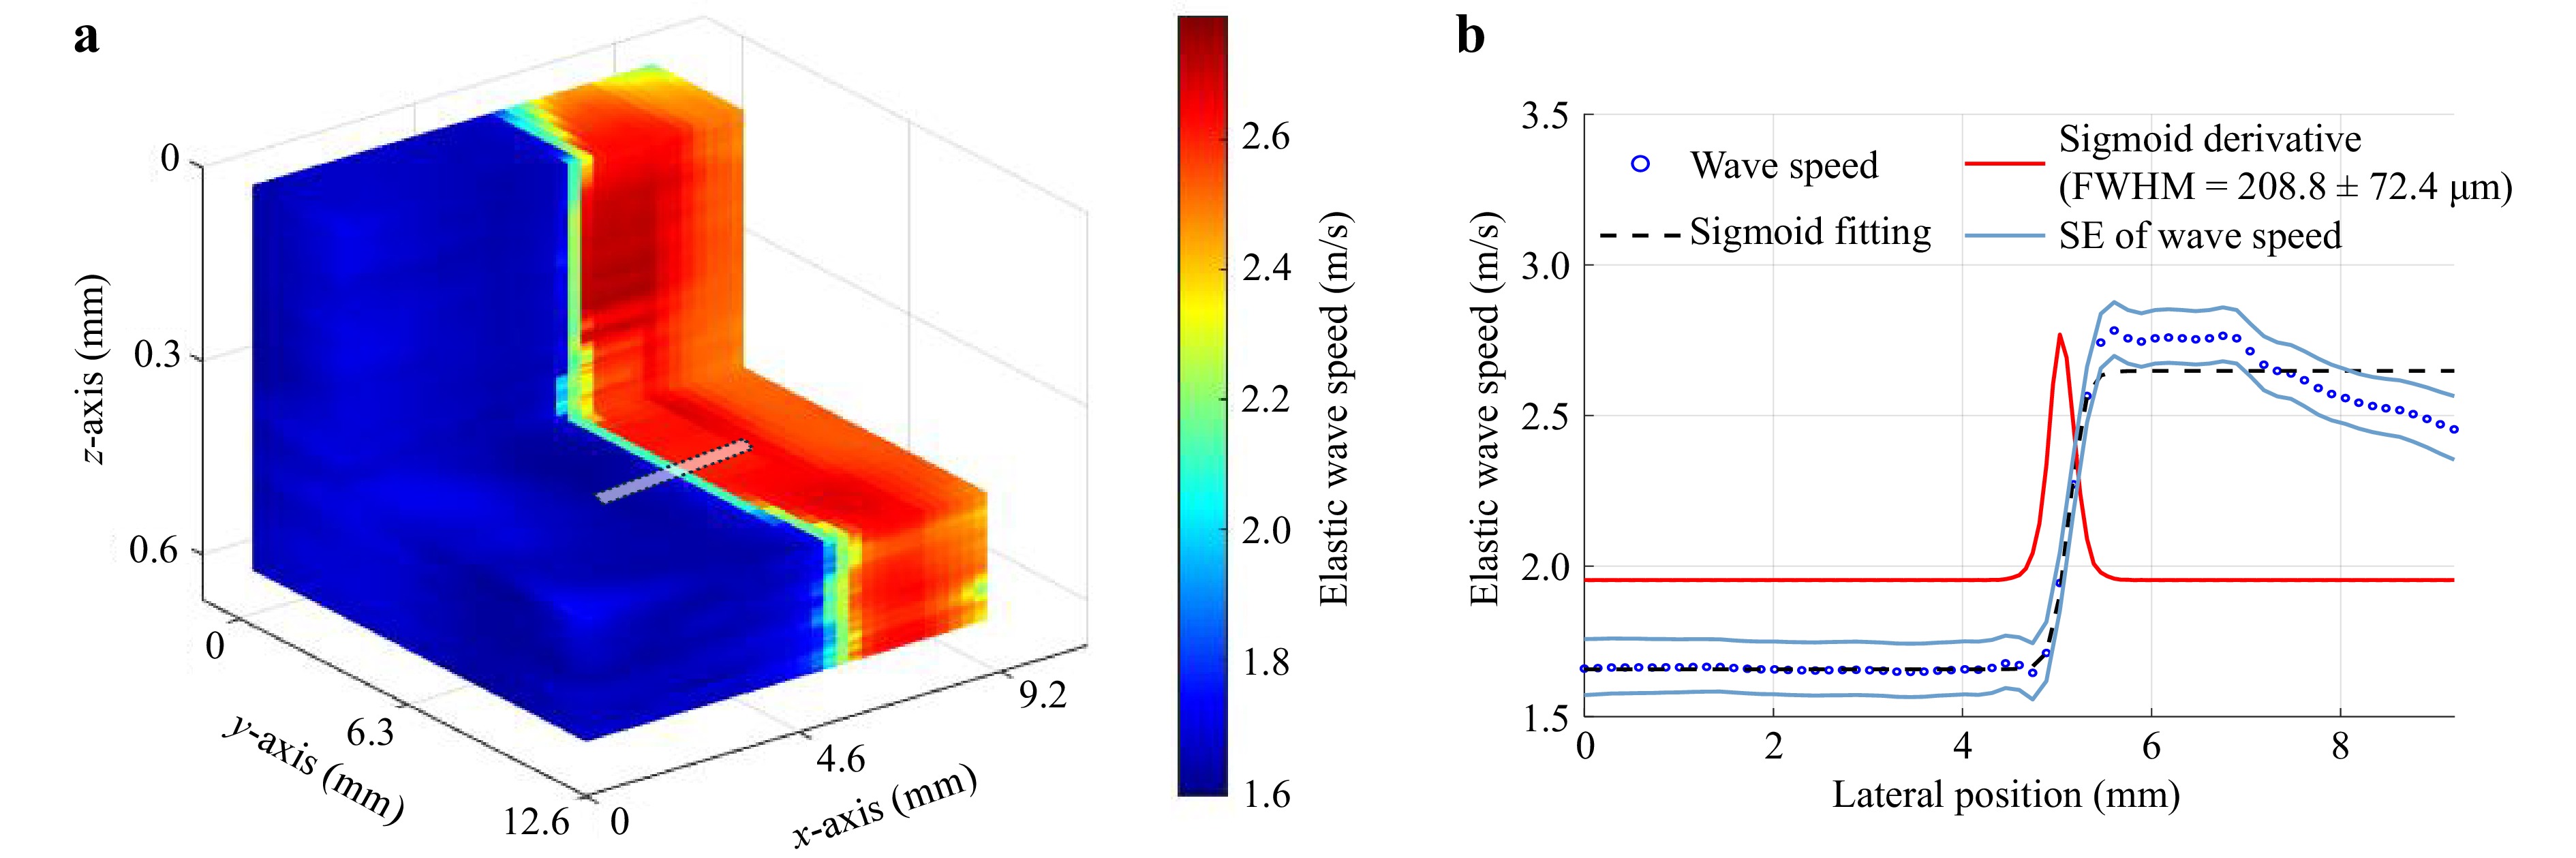
Fig. 3 Mechanical mapping and resolution characterization in a side-by-side heterogeneous phantom as shown in Fig. 2. a 3D-spatial wave speed map in the side-side tissue-mimicking phantom showing en face and axial cross-sections of the elastogram. An ROI of interest, shown as the small rectangle, was selected to produce the lateral shear wave speed profile. b Lateral wave speed profile and sigmoid fit at the transition between soft and stiff region (n = 3 phantoms). The mechanical resolution was determined as the FWHM of the sigmoid derivative.
Fig. 4a depicts an ex vivo porcine cornea under an artificial intraocular pressure (IOP) of 10 mmHg, where a strong reverberant field was induced within the cornea, as shown in the particle velocity maps at different time points (Fig. 4b). The results show the depth dependence of the wave velocity from the epithelium to the endothelium in the cornea. Anterior corneal layers demonstrated higher velocity (3.7 m/s), i.e., higher stiffness, while the posterior layers were softer (2.2 m/s). Driving an ACUS transducer by a pre-amplified input peak amplitude of 250 mV and a square pulse train with a 50% duty cycle and frequency of 1 kHz, resulted in a pressure peak amplitude of 634 Pa with a spatial-peak pulse-average (SPPA) intensity of 0.05 W/cm2 and a mechanical index (MI) of 0.003.

Fig. 4 Porcine cornea mechanical mapping using Rev-OCE. a 3D OCT structural volume and B-mode image of the porcine cornea. b 3D volume snapshots of the reverberant shear field at the indicated time point after excitation. c 3D volume of the shear wave speed map of the cornea and 2D wave speed slice.
-
Since Rev-OCE was first shown, it has been applied to map the mechanical properties of various tissues, such as the cornea12,26, brain27, and muscles28, using contact-based excitation with an eight-pronged stimulator. To overcome the limitations of contact-based excitation, we have developed an ultrasound-based method to generate a reverberant field18,19, but this method requires an acoustic coupling media such as a gel or water. Thus, only the ACUS method is a truly “no touch” reverberant method. The present study demonstrates the promising generation of a robust reverberant field using commonly available ACUS transducers, and although they produce long diffuse ultrasonic beams over several meters, they can produce the acoustic radiation force at just 10 mm. These characteristics make them an ideal candidate to produce reverberant fields without any contact.
The acoustic radiation force generated by ACUS transducers arises from the significant impedance mismatch between air and tissue. Unlike immersion transducers, where acoustic energy penetrates deeply into the tissue and is primarily absorbed, the majority of energy in air-coupled ultrasound is reflected at the tissue surface, generating radiation force. Consequently, air-coupled ultrasound is considered a safer method for tissue excitation compared to water-coupled ultrasound. Currently, no specific FDA safety regulations exist for air-coupled ultrasound; therefore, we based our estimations on the safety recommendations established for standard medical ultrasound in ophthalmology. Our estimations indicate that the applied acoustic intensity is well below FDA limits for sensitive organs such as the eye29.
As shown in the Results section, a completely noncontact Rev-OCE methodology was developed, producing a strong reverberant wave propagation. As shown in the gelatin phantom (Fig. 2) and an ex vivo porcine cornea (Fig. 4), this method can be used to quantify the stiffness of tissues with high accuracy. Therefore, using a mechanically heterogeneous phantom was important to determine the Rev-OCE mechanical resolution that can achieved using this methodology18. There is a substantial difference in the amplitude of the wave propagation between 4% w/w and 8% w/w gelatin, which was previously observed in soft samples18,30, where wave propagation seems to be diminished compared with the stiffer regions of the sample. In terms of mechanical resolution, using ACUS wave-based OCE4, and a 2 kHz quasi-harmonic excitation, a lateral resolution of 210 μm was obtained. In addition, Kunanta et al16. showed that using Rev-OCE with a quasi-harmonic signal at a frequency of 1 kHz, a lateral resolution of 300 μm was obtained. In contrast, using our ACUS-based Rev-OCE with a quasi-harmonic excitation of 1 kHz, 208.8 μm was obtained. Our future work will focus on a rigorous characterization of the mechanical resolution parameters of Rev-OCE, including axial resolution and its dependence on mechanical contrast.
The 40 kHz transducers were chosen due to their broad commercial availability, cost-effectiveness (a pair of receiver-emitter transducers is ~$1 USD), and lower resonant frequency as compared to previously demonstrated ACUS transducers (e.g., 1 MHz4). This lower frequency enabled a robust and strong reverberant field. Higher frequencies are particularly useful in transient impulse wave-based OCE, where broadband elastic wave generation is critical for viscoelastic characterization2,3; however, this is not a strict requirement for Rev-OCE since multiple cycles of excitation are required in order to establish the reverberant field15,21.
A completely noncontact method for Rev-OCE could provide a finer mechanical resolution with enhanced elastic contrast in sensitive tissues, such as the cornea12, where acoustic pressure safety parameters29 must be carefully considered for in vivo imaging (as shown in Fig. 4). In addition, a limitation for in vivo applications is the OCT imaging paradigm applied to perform Rev-OCE, where several seconds may be necessary to acquire a large number of M-mode points with traditional imaging. However, ultra-fast OCE systems could overcome this limitation31, and a recent study by Schmidt et al.20 showed a method for Rev-OCE with traditional B-mode imaging, significantly reducing the acquisition time. In addition, in conventional reverberant methods, the reverberant field can be contaminated with unidirectional shear waves that add aberrations in the shear wave estimations using the autocorrelation fitting method. The phase gradient method developed by Ormachea et al.25 overcomes this limitation, with the ability to calculate wave speed of reverberant fields with high unidirectional shear wave contamination and a reduced kernel size. Future work will involve overcoming the aforementioned limitations to optimize acquisition time and using phase gradient estimation together with the implementation of new ACUS transducer holders with the capability to reduce the discomfort of potential patients.
-
The ACUS transducers (TCT40-16, Shenzhen HiLetgo Technology Co., Ltd, China) had a nominal resonant frequency of 40 kHz and a diameter of 16 mm24. The acoustic exposure levels of the transducers were characterized using a microphone (Eta 100 Ultra; XARION, Austria). The transducers were characterized using a driving signal of a single pulse with a duration of 0.5 ms modulating a continuous 40 kHz carrier signal generated with an arbitrary function generator (DG4162, RIGOL Tech, China) and amplified by an RF power amplifier (1040L, Electronics & Innovation, Ltd., USA). A 3-axis motorized stage driven by a motion controller (ESP301, Newport Co., USA) was used to scan the xy-plane of maximum acoustic pressure to characterize the spatial properties of the acoustic pressure field of a single transducer and the arrangement of 5 transducers. The acoustic pressure of a single transducer was characterized over a 10 × 10 mm2 area at the transducer’s maximum pressure plane. The detected pressure intensity was pre-amplified and transferred to a computer via a digital oscilloscope (DS4000, RIGOL Tech, China).
The safety parameters described by the US Food and Drug Administration (FDA)29 for the use of ultrasound devices on ocular tissue are based on calculations of the mechanical index (safety limit: 0.23) and spatial-peak pulse-average (SPPA) intensity (safety limit: 28 W/cm2). The acoustic pressure was calculated as $ P={{Voltage}_{microphone\;measured}}/{S ensitivity\;microphone} $, and the intensity ($ I $) was $ I={{P}^{2}}/{\rho c} $, where $ \rho $ was the density of air (1.293 kg/m3) and $ c $ was the speed of sound in air (343 m/s). The spatial-peak pulse-average intensity is calculated as $ {I}_{SPPA}={1}/{T}{\int }_{0}^{T}{{P}^{2}}/({\rho c})dt $. The mechanical index was calculated as $ MI={{P}_{r}}/{\sqrt{f}} $, where $ {P}_{r} $ was the peak negative pressure and $ f $ was the central frequency of the transducer32.
A 3D printed ring of 4.5 cm external diameter and a thickness of 4 mm (Stratasys Objet Eden 260 v, Stratasys, Israel) was built to hold the array of five transducers in a ring. The inner wall was beveled at 45° inclination, and the five ACUS transducers were equally spaced in the ring (72° separation). All transducers were connected in a parallel configuration, and the acoustic pressure field was characterized as mentioned above, using a microphone over a 25 × 25 mm2 area at the transducer plane as determined by the location of maximum acoustic pressure.
-
Rev-OCE imaging was performed with a PhS-SDOCT system. The system was based on a superluminescent diode (S48W0-B-I-20; Superlum Diodes Ltd., Ireland) with a central wavelength of 840 nm and a bandwidth of 50 nm, and with an axial and transverse resolution of ~9 µm and ~8 µm in air, respectively. The displacement sensitivity was 0.28 nm at an OCT signal-to-noise ratio > 30 dB.
A side-by-side heterogeneous gelatin phantom with two distinct mechanical properties (4% and 8% gelatin concentrations) was used to test the capabilities of the multi-ACUS array to generate a reverberant field. The heterogeneous gelatin phantom was cast using porcine gelatin (Sigma-Aldrich, St. Louis, MO) mixed with TiO2 (Pantai Chemical, GA) to improve scattering. Softer tissue was represented by the 4% w/w gelatin mixed with 0.05% w/w TiO2, and 8% w/w gelatin mixed with 0.1% w/w TiO2 represented stiffer tissue. First, the 4% gelatin phantom was cast in a standard culture dish with a diameter of ~35 mm and a height of ~10 mm. Once solidified, half of the phantom was gently removed, and 8% w/w gelatin mix (almost at gelation temperature) was poured into the empty space and cooled in a 4°C fridge to gel. Three such phantoms were cast.
A whole porcine cornea (less than 24 hours of enucleation) was obtained (Sioux-Preme Packing Co., Iowa City, IA) and mounted in a custom holder. The eye globe was cannulated for artificial IOP control with a previously described system based on a closed loop feedback control of a micro-infusion pump and pressure transducer33. The IOP was set to 10 mmHg during Rev-OCE imaging.
For the phantom experiments, Rev-OCE imaging was performed over an area of 9.2 mm and 12.6 mm in the x-axis and y-axis, respectively. A total of 500 A-lines per M-mode scan with 75 × 75 M-mode scan points were acquired in three-dimensional M-mode scanning2,34. In the case of the porcine cornea experiment, the scanning was performed over an area of 6.1 mm and 6.9 mm for the y-axis and x-axis, respectively. Here, 101 × 101 M-mode scan points were acquired with 500 A-lines per M-mode scan. Due to the size of the cornea and eye-globe, the excitation points were at or near the limbus35, where the imaged region was at the apex of the cornea. In this experiment, the function generator (DG4162, Rigol Technologies, China) was used to generate a quasi-harmonic square pulse signal of ten cycles of 1 kHz (2 kHz for cornea) with a 50% duty cycle, which amplitude-modulated a continuous 40 kHz sinusoidal signal. The modulated signal was amplified by an RF power amplifier (1040L, Electronics & Innovation, Ltd., USA) before driving the multi-ACUS array. The signal was synchronized to the OCT system frame trigger2,3,36. The A-scan rate was set to 50 kHz, so the temporal resolution was 20 μs.
-
Rev-OCE data analysis was performed following the methods described by Zvietcovich et al.12, where the axial particle velocity was obtained from the axial temporal phase difference37. The surface of the gelatin phantom was tracked using intensity thresholding, and the motion under the surface was corrected for the refractive index mismatch38. The axial particle velocity in the gelatin phantoms was filtered at a frequency of 1 kHz, i.e., the excitation frequency, with a bandwidth of 200 Hz (Fig. 5), using a first-order FIR filter with the aim of reducing irregularities during speed calculations39.
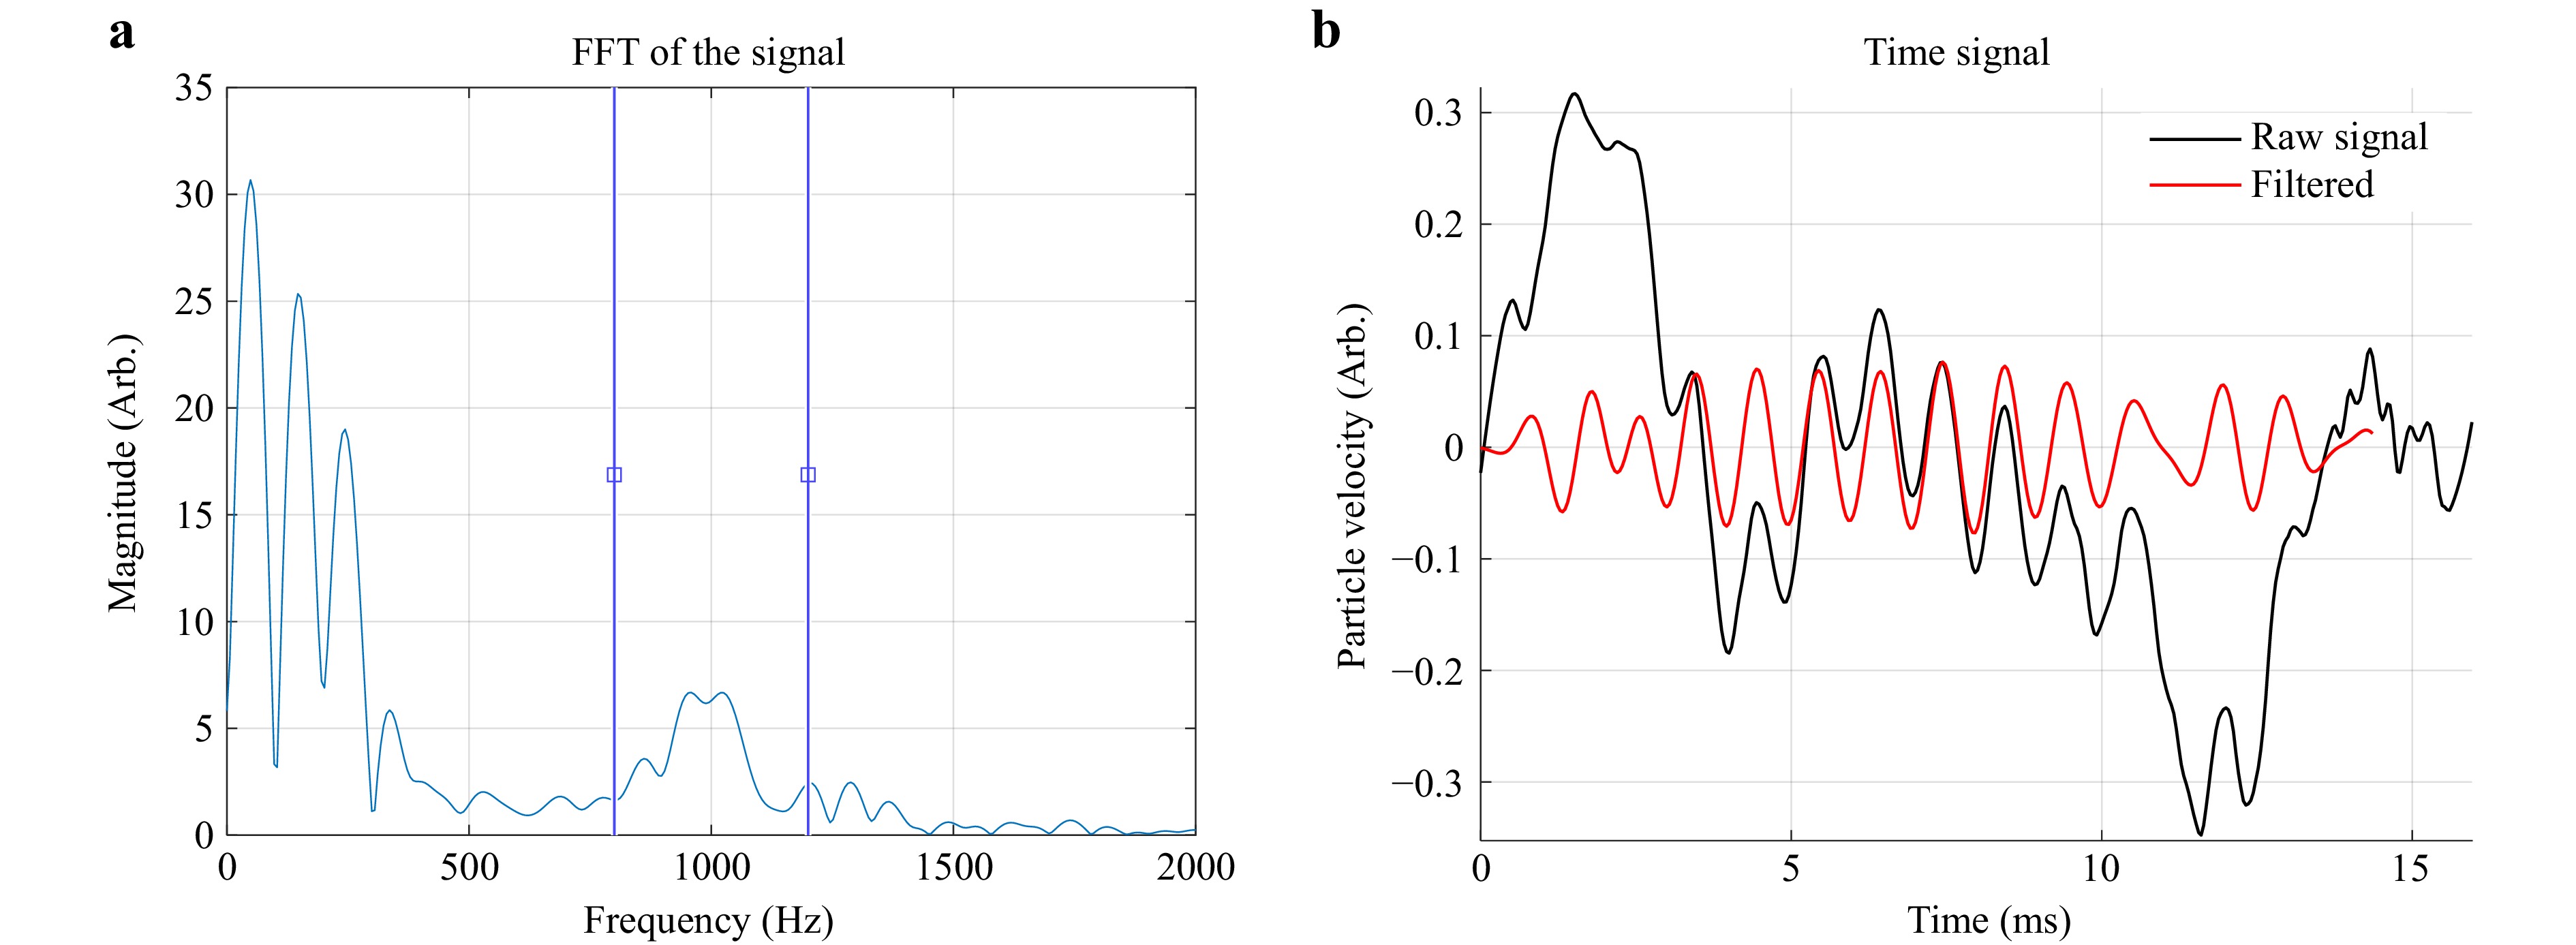
Fig. 5 Frequency filtering for wave propagation analysis. a Power spectrum for Rev-OCE excitation. b Filtered temporal response using finite impulse response (FIR) filter.
A 2D spatial bandpass filter was utilized to minimize noise within the speed range of 0.2 m/s to 10.0 m/s in all particle velocity volumes12. The 2D autocorrelation profiles were obtained over a 1.75 × 1.75 mm2 window size in each particle velocity volume, and the autocorrelation profiles were fitted to the analytical solution of the reverberant shear field12,15,40. The same methodology was used in the cornea. After tracking the cornea surface and obtaining each in-depth layer, the particle velocity was filtered at a frequency of 2 kHz with a bandwidth of 200 Hz using a first-order FIR filter. The 2D autocorrelation for each cornea layer in the xy-plane was obtained using a window size of 1.5 × 1.5 mm2 and fitted to the reverberant analytical solution.
-
This research was supported by the National Institutes of Health (P30EY07551, R01EY022362, R01EY030063, R01HD095520, R61AR078078).
Air-coupled ultrasound based noncontact reverberant optical coherence elastography
- Light: Advanced Manufacturing , Article number: (2025)
- Received: 22 October 2024
- Revised: 01 September 2025
- Accepted: 08 September 2025 Published online: 09 December 2025
doi: https://doi.org/10.37188/lam.2025.076
Abstract: Reverberant optical coherence elastography (Rev-OCE) has been used to map the mechanical properties of tissues with high quality and resolution regardless of tissue boundaries and stiffness. Generally, Rev-OCE utilizes the interference of multiple arbitrary mechanical waves generated by distinct sources in direct contact with the sample. In this study, a novel methodology was designed and implemented to create a completely noncontact method utilizing multiple air-coupled ultrasound (ACUS) transducers capable of generating a reverberant field within the sample. An array of unfocused ACUS transducers with a resonant frequency of 40 kHz was characterized and placed in a 3D-printed ring to produce a reverberant field in a side-by-side gelatin phantom (4% and 8% w/w gelatin concentration). The results showed the generation of a reverberant field within the sample with a transverse resolution of 208.8 ± 72.4 μm. Also, this method was tested in porcine cornea showing the stiffness differences found in the corneal layers, where the wave speed is substantially higher in the epithelium (3.7 m/s) and anterior stroma regions compared with the posterior and endothelium regions (2.2 m/s). The generation of a reverberant field using ACUS Rev-OCE guarantees the integrity of sensitive samples, and it shows its potential to be used in-vivo without causing any damage or discomfort in live subjects.
Research Summary
Air-Coupled Ultrasound Based Noncontact Reverberant Optical Coherence Elastography
Reverberant optical coherence elastography (Rev-OCE) utilizes reverberant wave fields generated by the continuous interference of multiple mechanical waves traveling in all directions. Various excitation sources have been employed to generate reverberant wave fields; however, a fully noncontact method has yet to be developed, which would be beneficial for clinical translation. Kirill V. Larin from the Department of Biomedical Engineering, at the University of Houston, USA now reports the development of a novel modality to generate reverberant fields in a truly contact free fashion using an array of non-focused air-coupled ultrasonic (ACUS) transducers (resonant frequency of 40 kHz). A robust reverberant field was characterized in a gelatin phantom and porcine cornea to probe the efficacy of this reverberant elastography technique.
Rights and permissions
Open Access This article is licensed under a Creative Commons Attribution 4.0 International License, which permits use, sharing, adaptation, distribution and reproduction in any medium or format, as long as you give appropriate credit to the original author(s) and the source, provide a link to the Creative Commons license, and indicate if changes were made. The images or other third party material in this article are included in the article′s Creative Commons license, unless indicated otherwise in a credit line to the material. If material is not included in the article′s Creative Commons license and your intended use is not permitted by statutory regulation or exceeds the permitted use, you will need to obtain permission directly from the copyright holder. To view a copy of this license, visit http://creativecommons.org/licenses/by/4.0/.

 DownLoad: