


-
The combined use of different imaging modalities becomes nowadays a mainstream in biomedical research. The integration of different experimental techniques into a single imaging complex is particularly desirable, since it potentially enables the retrieval of complementary data on different aspects of a process occurring both at the molecular and cellular/tissue levels. One of the most prospective combinations of imaging modalities is that of fluorescence microscopy with quantitative phase imaging (QPI). QPI provides data on the optical phase shift introduced by a sample into a recording wavefront. This parameter is a product of the difference in refractive indices of the sample and surrounding medium and the sample thickness. For cell samples, QPI provides quantitative data on the morphological and optical parameters of cells1. Being label-free and utilising low-power radiation, it is almost nondestructive and allows for long-term monitoring of cell samples, providing data on cell parameters in dynamics. At the same time, the limited molecular specificity of QPI techniques prevents investigation of intracellular processes at the molecular level. Fluorescence microscopy combined with QPI can provide a synergistic effect, offering data on the dynamics of various endogenous and exogenous molecular probes.
Several research groups have successfully combined QPI techniques with fluorescence imaging. Chowdhury et al. developed a single-camera device allowing for simultaneous two-channel fluorescence imaging and one-channel QPI and validated its workability on a model object of fluorescent microspheres and on a fixed cell sample2. Dudenkova and Zakharov presented a combination of off-axis digital holography and fluorescence fluctuation microscopy in a single optical setup, which enabled attainment of spatial superresolution3. Alonso et al. proposed a common-path dual-mode imaging platform combining fluorescence and holographic microscopy and tested its workability on both static model objects and live cell samples4. Schurmann et al. combined holographic and fluorescence tomography with optofluidic rotation to investigate intracellular structures in suspended cells5. Descloux et al. developed a multimodal multi-plane imaging platform utilising superresolution optical fluctuation imaging followed by 3D phase imaging using a customised prism for simultaneous acquisition of eight planes along the Z-axis6. To the best of our knowledge, no platform combining QPI with fluorescence lifetime imaging microscopy (FLIM) has been reported.
A biomedical research direction in which multimodal analysis is highly advantageous is the monitoring of cell death and identification of specific death pathways under external stimuli, drugs, or treatment procedures. Photodynamic therapy is one of the relevant treatment modalities. In this respect, the feasibility of simultaneous monitoring of changes in cell morphology by QPI and variations in cellular metabolism by analysis of the fluorescence parameters of the metabolic coenzymes nicotinamide adenine dinucleotide (NADH) and flavin adenine dinucleotide (FAD) by FLIM in the course of cell death displays significant potential, especially since both techniques are almost nondestructive and allow for cell monitoring over the entire death process. Concurrent FLIM-assisted monitoring of photosensitizer (PS) uptake by cells, intracellular transportation, and accumulation is of particular interest.
Understanding the process of PS accumulation in cells is important for predicting the PS performance and treatment efficacy. Few studies have demonstrated the time-resolved monitoring of PS uptake using FLIM. In particular, the 5-hour long redistribution of Photofrin from the membrane to the cytoplasm and further into the mitochondria was demonstrated through variations in its fluorescence lifetime components7. Minor variations in the fluorescence lifetimes of Foscan and Foslip in cells were observed after 3 and 24 h of incubation8. Such variations in the fluorescence properties of PSs may be associated with variations in the characteristics of the intracellular microenvironment during their uptake and accumulation in specific organelles.
We recently demonstrated that QPI-assisted analysis of specific changes in cell morphology enables identification of major cell death pathways, apoptosis or necrosis9, 10. Fluorescence imaging of NADH and FAD based on the recording of intensity distributions has been used for decades to quantify glycolysis and oxidative phosphorylation, and to identify cancer tissues (see, for example,11, 12. Time-resolved fluorescence imaging using FLIM considerably improved the measurement specificity and allowed for better separation of signals from different substances fluorescing in overlapping spectral ranges. Another important advantage of fluorescence lifetime measurements over intensity measurements is their independence on intensity fluctuations13.
NADH is a critical coenzyme and redox regulator involved in numerous cellular processes, primarily as a mediator in energy metabolism as an electron/proton carrier. It is widely used as an endogenous fluorescent probe of the metabolic state of a cell through an analysis of variations in its fluorescence intensity and lifetime14, 15. The analysis is based on variations of the two major lifetime components (0.4–0.5 ns and 2–4 ns) associated with free and bound NADH, respectively, and the contributions of these lifetimes in the total time-resolved fluorescence signal16, 17. Therefore, the analysis of time-resolved fluorescence signals provides information on the variations in the ratio of free and bound forms of NADH as a result of changes in cellular metabolism. FLIM-assisted monitoring of NADH fluorescence in cells was applied to measure the response to treatment of various cancer pathologies18, 19, analyse early apoptosis in HIV-1-infected cells and tissue sections20, detect cell death21, etc.
FAD is another important redox coenzyme involved in several key reactions including formation of the riboflavin moiety, glutathione synthesis, and cholesterol metabolism. It functions as an electron carrier and donor of electrons mainly to complex II22. FAD autofluorescence has been used to analyse complex II-dependent mitochondrial respiration to assess cell death22. Flavin fluorescence has been recommended for use in brain tumour detection and classification23. Fluorescence imaging of flavoproteins, FAD-consisting in particular, was suggested to be applied for visualisation of cortical activity through changes in the redox state of mitochondrial flavoproteins24. However, flavin fluorescence analysis is complicated due to potential contributions from different substances, flavin mononucleotide (FMN) in particular, which are often underestimated25. Another potential source of errors is the enzyme-bound coenzyme pyridoxal 5-phosphate, which fluorescence spectrum overlaps with that of FAD26. The combined analysis of NADH and FAD fluorescence was applied to discriminate between subtypes and functional states of immune cells27, assess the redox states of cancer cells28, analyse the metabolic variations associated with Huntington’s disease29, evaluate cell oncogenicity due to the Warburg Effect30, 31, suggesting predominance of oxidative phosphorylation in normal cells and glycolysis in cancer cells, to name only a few.
In this paper, we present the experimental complex providing concurrent imaging of cell samples in two channels: QPI and FLIM. The complex was used for performing a multimodal analysis of the response of cell cultures in vitro to photodynamic treatment. QPI was realised in the schematics of spatial light interference microscopy (SLIM)32. The FLIM technique was used for analysing the time-resolved fluorescence of the metabolic coenzymes NADH and FAD and for monitoring the uptake and accumulation of Radachlorin PS in cells. The photosensitizer was also used for photodynamic treatment of the cells. Experiments were performed on cell samples of two established oncogenic lines: human cervical epidermoid carcinoma HeLa and human alveolar basal epithelial adenocarcinoma A549. These two widely used established cell lines were selected as a model of two different malignant cell lines to demonstrate the set of parameters that could be retrieved from the concurrent monitoring of cell samples using SLIM and FLIM.
Monitoring of time-resolved fluorescence parameters of NADH and FAD is widely used for analysing the energy metabolism in cells, crucial for evaluation of cellular physiology. One of the important advantages of this approach is its noninvasive manner, owing to the absence of exogenous fluorophores. SLIM technique allows for monitoring cellular morphology also non-invasively, using very low power densities of the recording light in almost any spectral range. The combination of these methods (QPI and FLIM) and concurrent recording of the set of cellular parameters enabled us to obtain an extended set of data on the morphological and physiological parameters of cells and their energy metabolism and to monitor these characteristics over a long time, either in living cells during their lifecycle or in response to external stimuli. The latter was demonstrated in our case on a specific example of photodynamic treatment.
-
Fig. 1 shows an optical schematic of the experimental setup. The setup was based on an inverted Nikon Ti2-A microscope and equipped with two peripheral channels connected to the two output ports of the microscope and utilised for phase (QPI) and time-resolved fluorescence (FLIM) measurements, as illustrated in the upper and bottom parts of Fig. 1a. The cell samples were monitored using a 40× water-immersion microscope objective with a numerical aperture of 1.15.
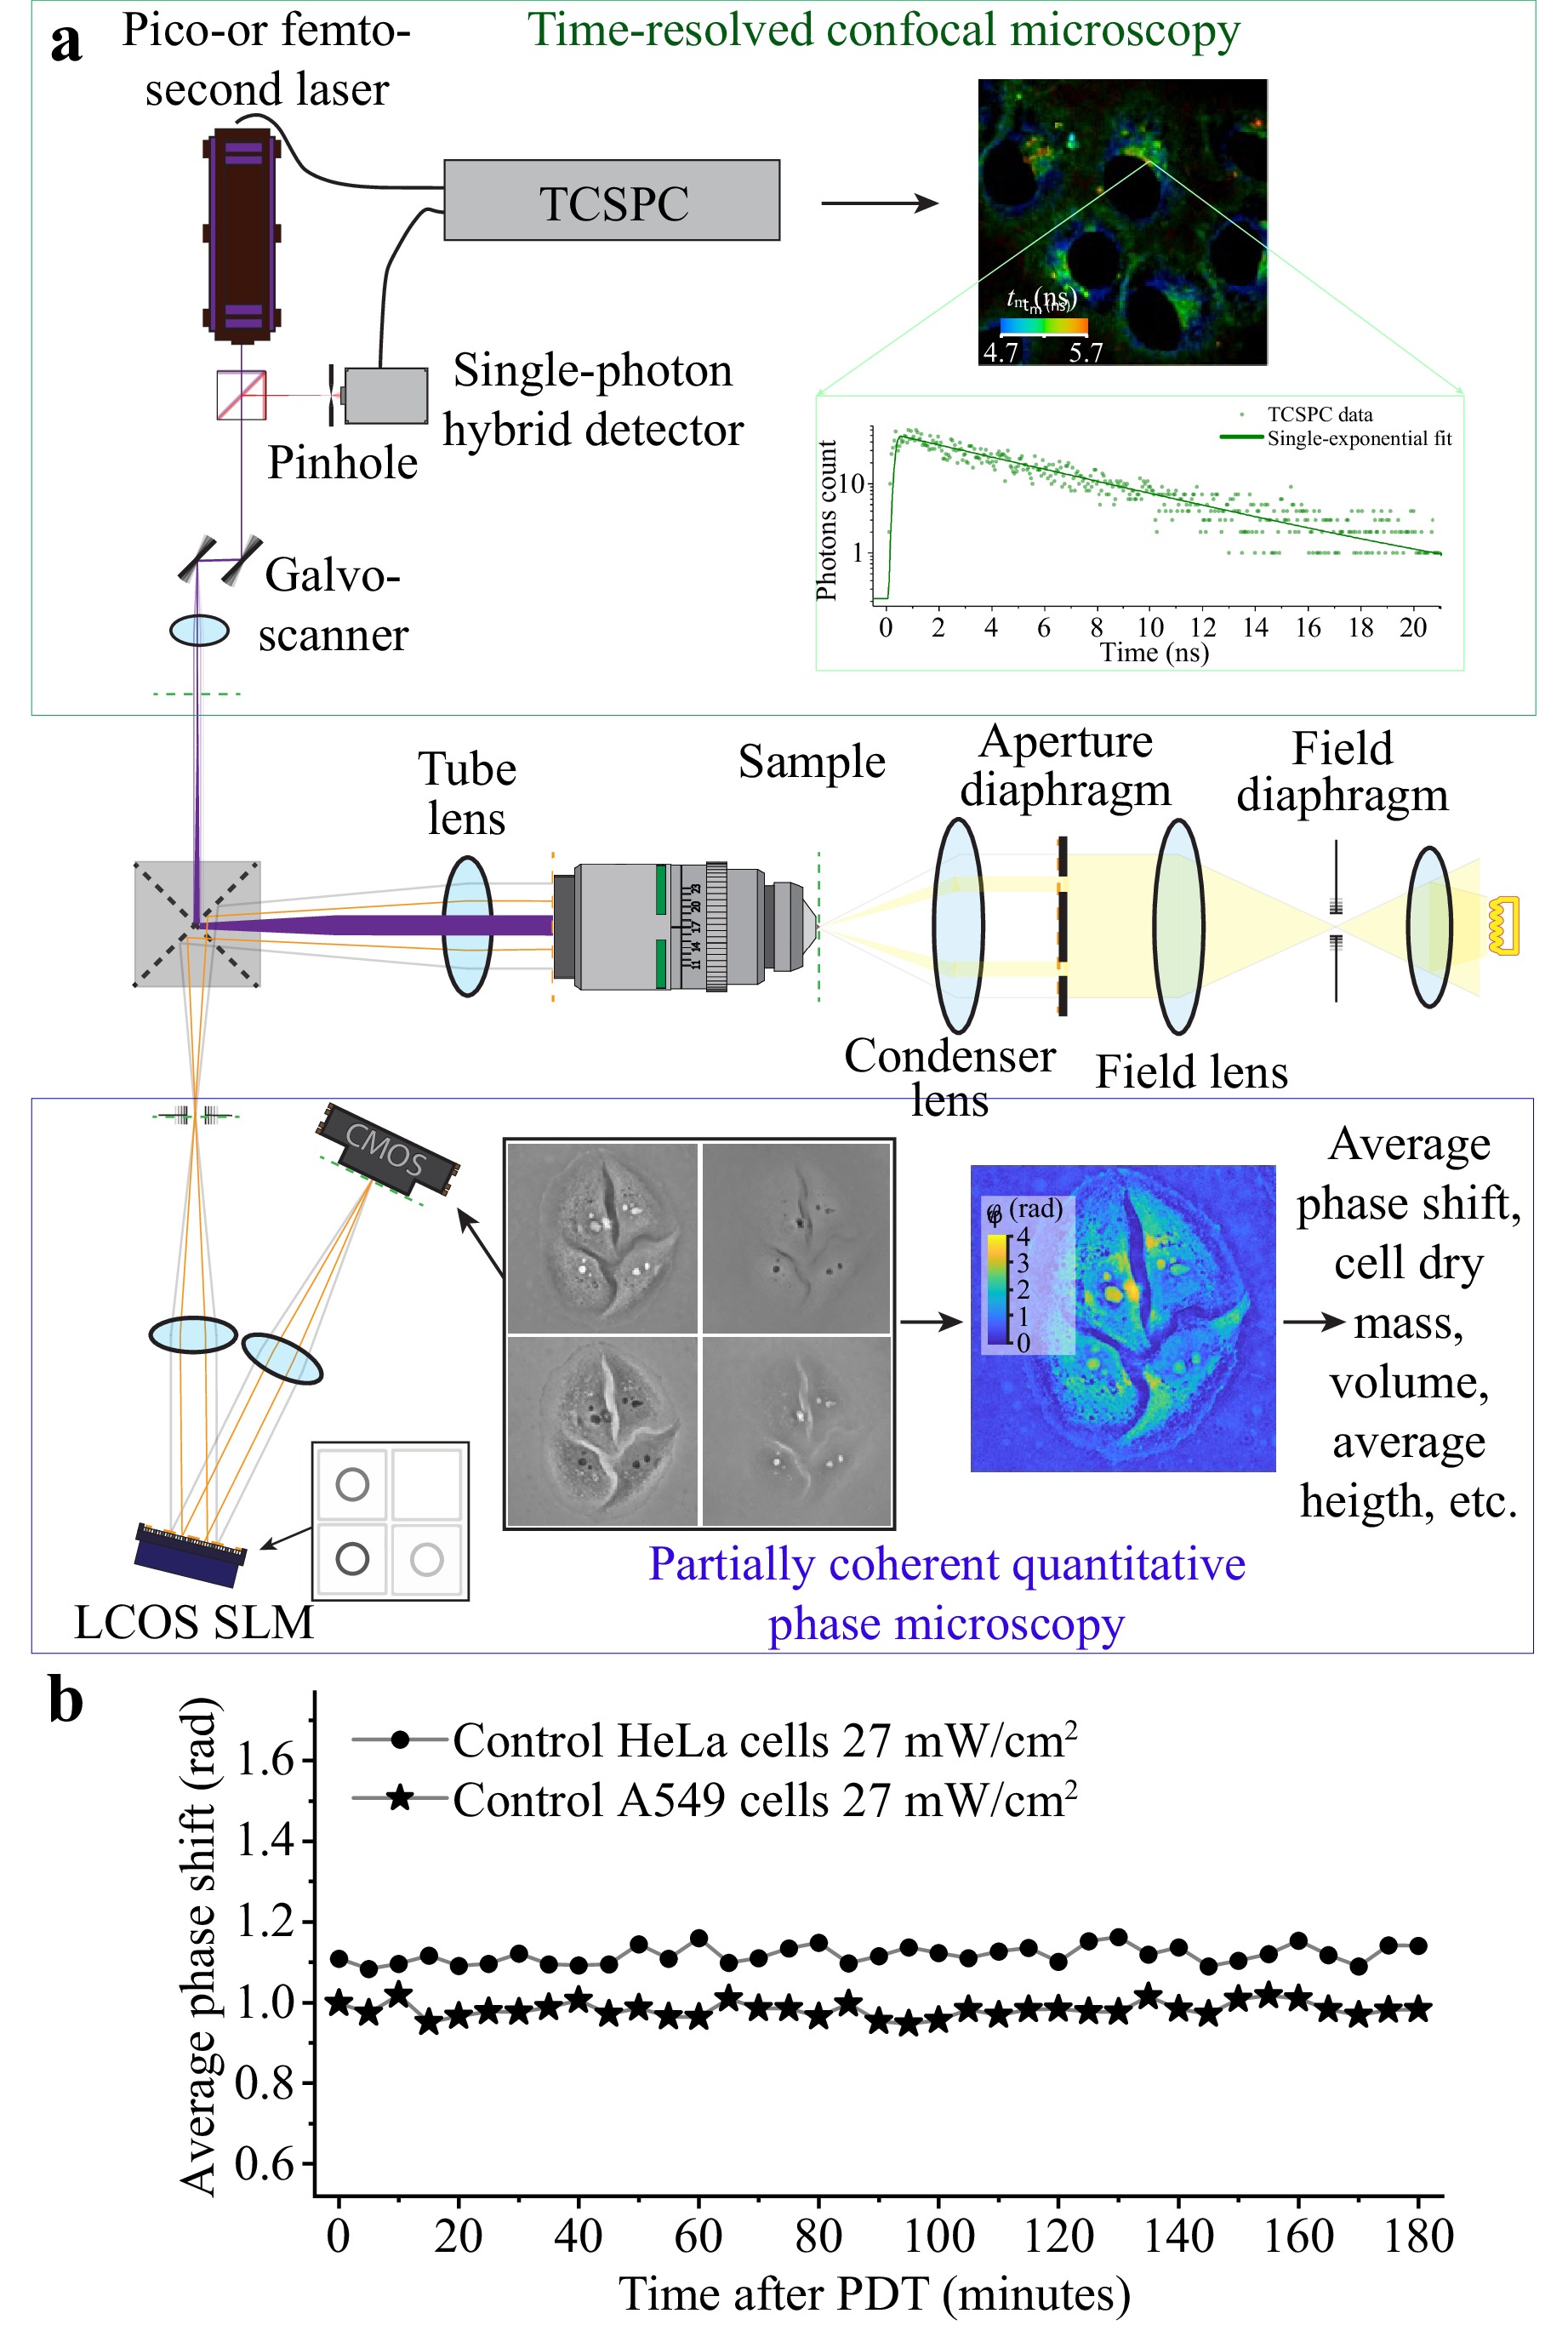
Fig. 1 a Schematics of the experimental setup combining the inverted biological microscope (central part), FLIM module (upper part), and SLIM module (bottom part). b Dynamics of average phase shift in non-photosensitised HeLa and A549 cells in control experiments with 5-min continuous irradiation at 405 nm with power density of 27 mW/cm2.
-
For the phase measurements, we utilised the SLIM technique suggested recently by G. Popescu and his team32, 33. In our setup, the SLIM technique was implemented using a spatial light modulator (LCOS-SLM) PLUTO-2.1 NIR-133 (Holoeye) located in a plane conjugated to the aperture plane of the microscope. The illumination ring of the phase-contrast module of the microscope was projected onto the variable phase-shifting ring of the SLM. The phase modulation within the ring on the SLM was shifted sequentially from 0 to $ {3{\text{π}}}/{2} $ in ${{\text{π}}}/{2} $ steps. This provided a set of phase shifts for the unscattered (reference) wave of [0; $ {{\text{π}}}/{2} $; $ {\text{π}} $; ${3{\text{π}}}/{2} $]. The phase-modulated light reflected from SLM was directed to the image plane, where it interfered with the light scattered by the cell sample (object wave). A set of thus obtained four on-axis digital holograms of the cell sample with different values of the phase shift introduced by the SLM into the reference wave were recorded by a digital camera (ToupCam 5.0 MP) and processed using the phase-step method. This provided reconstruction of the spatial distributions of phase introduced by the cells into the recording wave front (See Ref. 34 for details). A low-coherence radiation source used to record on-axis holograms allowed for minimising errors associated with coherent noise. An example of the set of four phase-contrast images of living HeLa cells and the resulting distribution of phase shift are shown on the bottom part of Fig. 1a. Radiation from the light source was spectrally selected by a bandpass filter with the transmission band of 510–530 nm. The resulting power density on the sample was 0.8 mW/cm2. This low power density did not cause damage to the live cells after continuous monitoring for 3 h.
An analysis of the obtained phase-shift distribution under the assumption of a constant refractive index of the cell provides the spatial distribution of the thickness and enables calculation of a number of cellular parameters such as the average and maximal height of the cell, cell volume, projection and membrane area, dry mass, etc.35. An analysis of the dynamics of phase distributions of living cells after photodynamic treatment allowed for identification of the variations in cellular morphology corresponding to specific death pathways9, 10.
The statistical data on cellular morphology obtained by SLIM were validated by evaluating the same parameters of cells of the same line from fluorescent images of acridine orange (AO) in cells. AO was added to the culture medium at a concentration of 2.5 μg/ml, cells were incubated in this solution for 2–3 min. Images of the AO fluorescence in the cells were obtained using an Olympus FV3000 laser scanning confocal fluorescence microscope with excitation at 488 nm and recording in the range of 500–560 nm.
-
A time-correlated single photon counting (TCSPC) confocal scanner DCS-120 MP (Becker&Hickl, Germany) connected to the second port of the Nikon Ti2-A microscope was used to record spatial distributions of the intensity and decay times of the PS fluorescence and autofluorescence of the endogenous coenzymes NADH and FAD and the dynamics of their variations. The fluorescence lifetime images were recorded using a Hybrid GaAsP photodetector (Becker&Hickl) with an IRF of $ \approx $120 ps FWHM. The recorded time-resolved signals were fitted by single- or double-exponential functions using SPCImage data analysis software (Becker&Hickl).
NADH molecules were excited at 367 nm by a laser beam obtained by frequency doubling of the fundamental output at 734 nm of a femtosecond Ti: Sa laser Mai-Tai HP DS (Spectra Physics) using a second-harmonic generator Inspire Blue (Spectra Physics). The power density used for NADH imaging was 3.5 μW/cm2. FAD molecules were excited at 445 nm in the one-photon mode by a picosecond diode laser BDS-SM-445-PS-101 at a pulse repetition rate of 80 MHz. The power density used for FAD imaging was 7 μW/cm2. The typical acquisition time for NADH and FAD signals was 100 s. NADH fluorescence was recorded in the spectral range of 426–446 nm selected by a bandpass filter ET436/20 (Chroma). This corresponded to the range in which fluorescence of FAD (also slightly absorbing at 367 nm) was not observed. FAD fluorescence was recorded in the spectral range of 510–560 nm selected by a bandpass filter ET535/50 (Chroma). The selected observation ranges allowed for minimising the overlap of the fluorescence of these two endogenous fluorophores and for extracting correct information on the proportion of the fast and slow components of their fluorescence. Radachlorin molecules were excited using a picosecond diode laser BDS-SM-405-PS-101 operating at 405 nm with pulse duration of $ \approx $60 ps and pulse repetition rate of 20 MHz. Radachlorin fluorescence was recorded in the spectral range of 607–682 nm selected by an ET645/75 filter (Chroma). For Radachlorin photosensitizer, the acquisition time depended on its accumulation and varied in the range of 30–100 s.
-
Experiments were performed on live cell samples of two established oncogenic cell lines: human cervix epidermoid carcinoma HeLa and human alveolar basal epithelial adenocarcinoma A549. Both the lines were obtained from the collection of Institute of Cytology RAS (the shared research facility ‘Vertebrate Cell Culture Collection’). Cells were grown at 37 °C in a 5% CO2 atmosphere for 48 h in Dulbecco Modified Eagle Medium (DMEM) (GIBCO, USA) supplemented with 10% fetal bovine serum (FBS) (GIBCO, USA) and 1% penicillin-streptomycin.
Photodynamic treatment of cells was performed using the clinically approved chlorin-based PS Radachlorin (RadaPharma). After the cells attained 80% confluence, Radachlorin was added to the culture medium at a concentration of 20 μg/ml. Note that care was taken to prevent formation of a monolayer of cells in the sample, since it often causes variations in cell morphology. Typically, we observed one–two groups of cells in the field of view, each containing 4–12 cells.
To monitor the photosensitizer uptake and intracellular transportation, cells were incubated in this solution for different times ranging from 1 min to 24 h. The dependence of Radachlorin fluorescence intensity on the incubation time was analysed using the epifluorescence microscopy system of the Nikon Ti2-A microscope. The dependence of Radachlorin fluorescence lifetime on the incubation time was analysed using the FLIM channel. The Radachlorin-containing culture medium was replaced with pure one right before the irradiation and measurements. For photodynamic treatment, cells were irradiated for 5 min by a 405 nm continuous-wave laser diode at different power densities ranging from 7.5 to 24 mW/cm2. Control experiments on 3 h continuous monitoring of the dynamics of phase shift in non-photosensitised cells subjected to 5 min irradiation at 27 mW/cm2 validated cell survival without the photosensitizing agent.
The conclusions based on the SLIM measurements were validated by standard live/dead test assays. The cell morphology and integrity of plasma and nuclear membranes were analysed by staining with Acidine Orange and Ethidium Bromide (AO/EB) assay (Merck, Germany). As known, AO penetrates cellular membranes and accumulates in acidic structures and nuclei, staining these green. EB penetrates cells only if the plasma membrane is damaged, and stains the nucleus red. In the experiments, cells were stained before and after photodynamic treatment with a mixture of 2.5 μg/ml AO and 5 μg/ml EB for 1 min. Apoptotic cells were validated using a FITC-Annexin V/Dead Cell Apoptosis Kit with FITC Annexin V and Propidium Iodide (PI) (Thermo Fisher Scientific, USA). In both the tests, the fluorescence of AO/EB and Annexin V/PI was excited using an Ar laser at 488 nm and recorded in two spectral ranges: 500–560 nm for AO and Annexin V, and 590–680 nm for EB and PI. Fluorescence images were recorded using a scanning confocal fluorescence microscope (Leica TCS SP5).
It is worth noting that one of the major components of serum, bovine serum albumin (BSA), has been shown to efficiently bind Radachlorin molecules at 1:1 model36, 37. The colocalisation of Radachlorin molecules with lysosomes and endosomes (characterised by acidic internal medium) was analysed using LysoTracker Green (DND-26, Invitrogen). The colocalisation with mitochondria was tested using MitoTracker (MitoTracker Green FM, Invitrogen). Either agent was added to the culture medium in cell samples 20 min before observation at the concentration of 50 nM.
Different amounts of fields of view were analysed in different experiments. In particular, more than 25 fields of view were used to perform statistical analysis of cell morphology. The analysis of cell response to photodynamic treatment was based on monitoring of 10–15 fields of view for each treatment dose. In all the experiments, only the cells observed entirely in the field of view were included in the analysis.
-
The concurrent monitoring of cell samples in the two channels provided complementary information on the ongoing intracellular processes. Fig. 2 presents a representative example of a set of images of the same group of HeLa cells obtained in parallel in the SLIM channel in terms of phase-shift distributions, in the optical microscope as differential interference contrast (DIC) images and in the FLIM channel in terms of the distributions of Radachlorin, NADH, and FAD fluorescence lifetimes. A set of phase, DIC, and Radachlorin fluorescence lifetime images before and after photodynamic treatment with the irradiation dose of 23 mW/cm2 causing cell necrosis are shown on the right-hand side of Fig. 2.
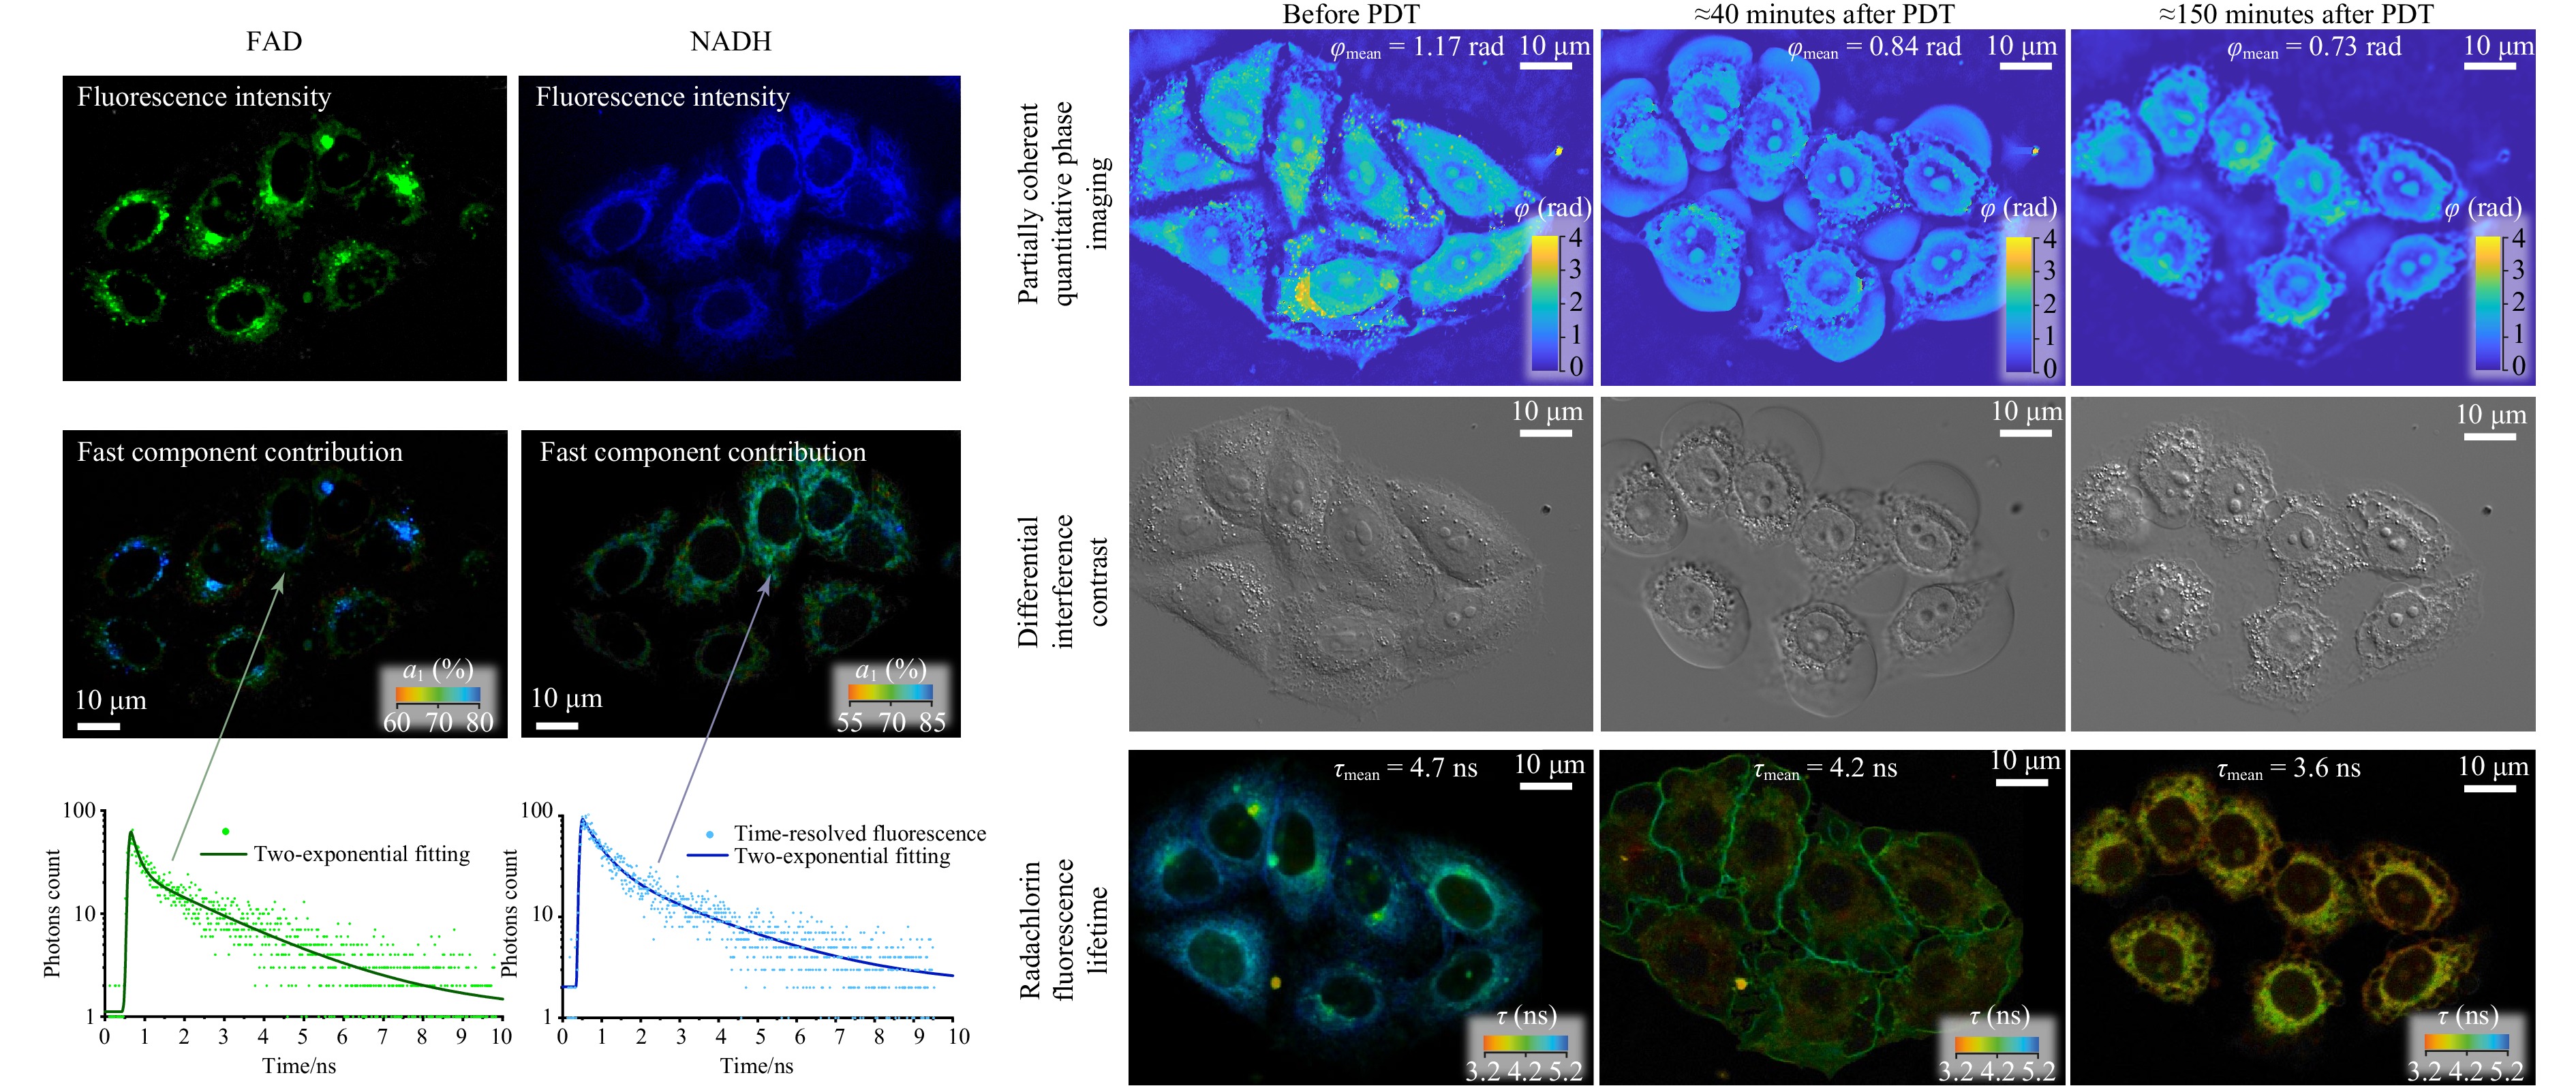
Fig. 2 Images of the group of HeLa cells obtained concurrently in the SLIM and FLIM channels. On the left: images in terms of fluorescence intensities and lifetimes of NADH and FAD coenzymes. On the right: images obtained by SLIM, DIC, and FLIM (the third in terms of Radachlorin fluorescence lifetime). The images on the right demonstrate changes in cells after photodynamic treatment with the irradiation dose of 23 mW/cm2 causing cell necrosis.
-
The SLIM channel enabled evaluation of the morphological changes in cells in a noninvasive manner without introducing any exogenous markers. The average refractive index of cells of the two lines used in this work was determined by measurements using a holographic tomographic microscope (3D Cell Explorer, Nanolive). This value corresponds to the data available in the literature. An example of the height distributions in the cells of the two lines obtained by SLIM is shown in the top row of Fig. 3. Notwithstanding the widespread use of holographic methods for determining the morphological parameters of cells, the results obtained by SLIM were validated using confocal fluorescence microscopy with AO as a fluorescent marker. AO is a fluorescent dye which easily penetrates cellular membranes and stains intracellular structures.
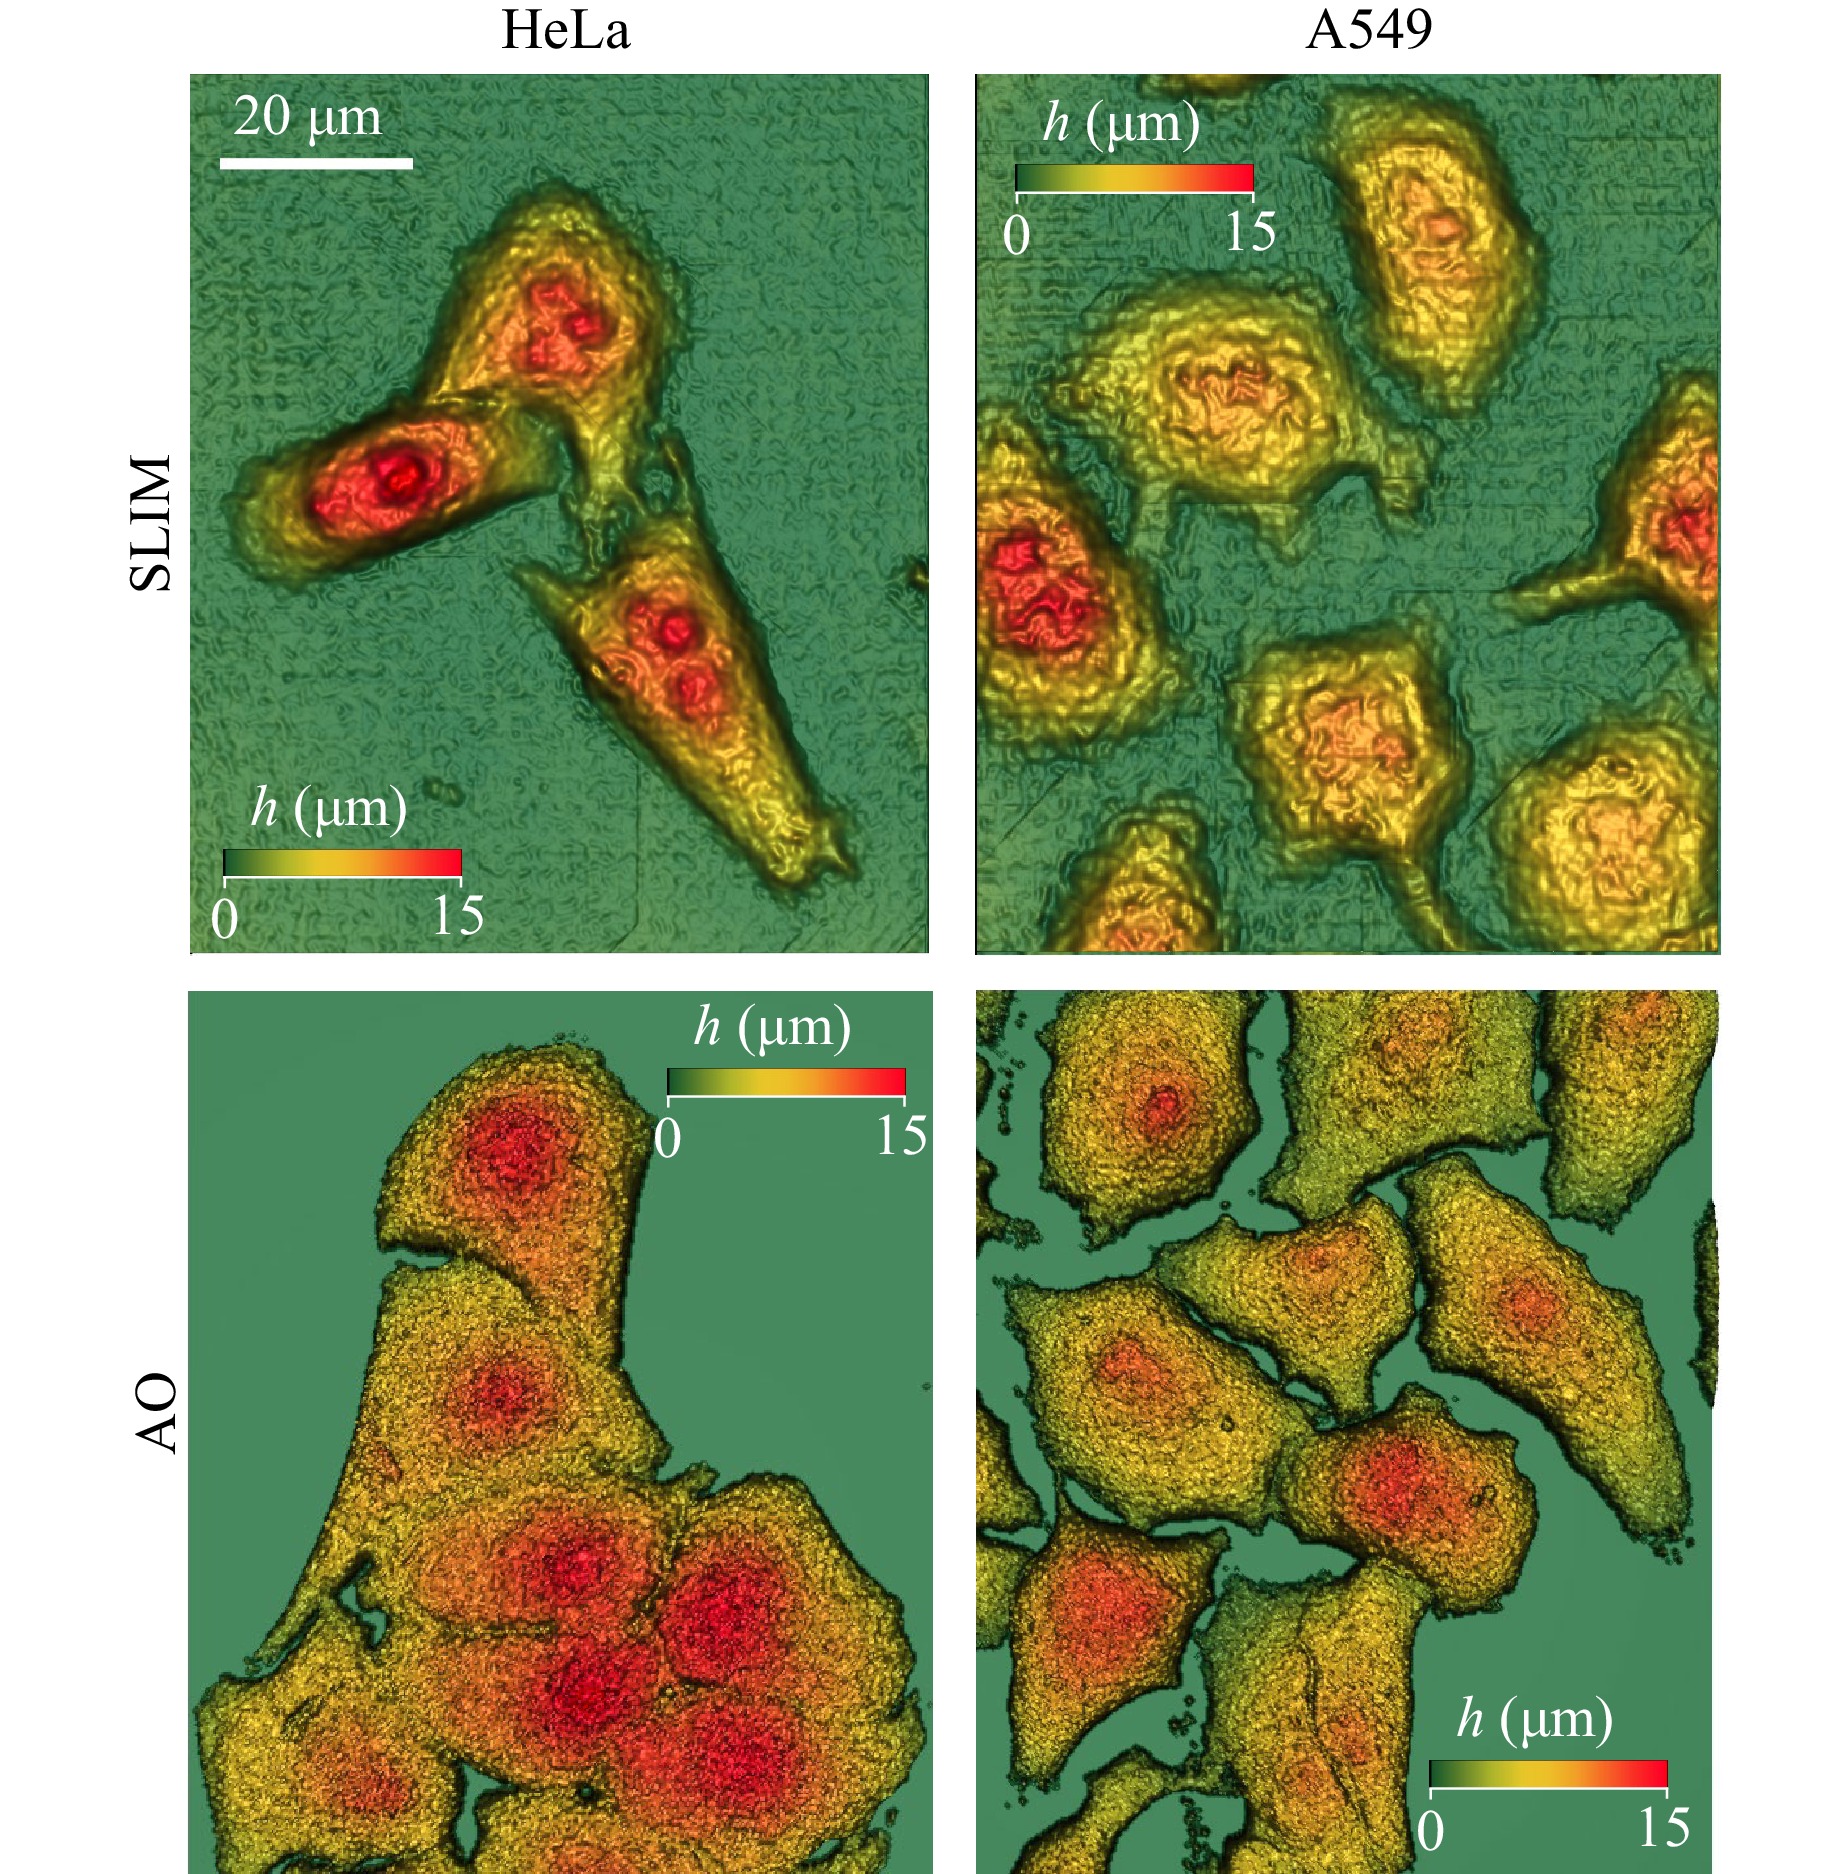
Fig. 3 Height maps of HeLa and A549 cells obtained by SLIM and from 3D distributions of acridine orange (AO) fluorescence.
Scanning the sample in a confocal fluorescence microscope provided a series of XY cross-sectional images of a 3D fluorescent sample with a step along the Z-axis of 0.5 μm. Processing of this set of images allowed for reconstruction of a 3D fluorescent image of the cell sample. The segmentation of individual cells based on clipping noise below a preset value of AO fluorescence intensity enabled the capture of 3D images of cells and calculation of the main morphological parameters of cells. Examples of height distributions in cells of the two lines are shown in the bottom row of Fig. 3.
Table 1 presents statistical data on the characteristic morphological parameters of HeLa and A549 cells obtained by analysing SLIM data and calculated from AO fluorescence images obtained by FLIM. Examples of the corresponding height distributions in HeLa and A549 cells obtained using the two methods are shown in Fig. 3. The data in Table 1 demonstrate a good correspondence between the morphological parameters of the cells obtained by the two methods and validate the performance accuracy of the SLIM channel.
SLIM AO HeLa A549 HeLa A549 V (μm3) 4457 ± 935 4350 ± 978 4277 ± 848 4270 ± 876 Ssurf (μm2) 2026 ± 533 2215 ± 657 2211 ± 553 2136 ± 517 Spr (μm2) 591 ± 177 775 ± 112 594 ± 137 710 ± 132 hav (μm) 7.5 ± 1.1 5.6 ± 0.8 7.4 ± 1.5 6.0 ± 1.6 Table 1. Morphological parameters of HeLa and A549 cells obtained from SLIM data and from 3D distributions of AO fluorescence intensity
The approximation of the constant refractive index of the intracellular medium resulted in certain deviations of the cell parameters measured by SLIM from those obtained in the control experiments using confocal fluorescence microscopy. Nevertheless, with the correct selection of the refractive index of cells, the SLIM technique provides good estimates of the morphological parameters of cells if the data are averaged over several dozen individual cells. A549 cells under normal physiological conditions were observed to have an average thickness of approximately 5.6 μm, whereas HeLa cells were on average 1.9 μm thicker. At the same time, cells of both lines had similar volumes. It was also not feasible to statistically identify the difference in membrane areas of cells between the two lines.
Data on the parameters of individual cells can be informative for assessing cell resistance to external stimuli. In particular, an extended membrane area can facilitate accumulation of photosensitizers and other drugs that are taken up via endocytosis. This effect should be taken into account when evaluating the resistance of cells to specific treatments. Significant differences in cell heights should be considered when analysing integral fluorescence signals to assess an amount of accumulated fluorophore in the cells.
The use of low-coherence, non-invasive SLIM microscopy allows for monitoring variations in cellular morphology that occur owing to various intracellular processes such as cell death by apoptosis or necrosis. While initiation of the programmed cell death, apoptosis, results in cell rounding, minimisation of the area of its contact with the Petri dish, and an increase in its height, necrosis manifests itself in an increase in the cell area owing to an efflux of the cell contents and formation of large necrotic blebs. Therefore, the analysis of variations in average phase shift induced by cells in these two cases can be effectively used to identify the type of cell death9, 10. Additionally, because a lower dose of oxidative stress is required to initiate apoptosis than that for necrosis, a comparative analysis of different regimes of photodynamic treatment that induce certain cell death mechanisms can also be used to assess the cell resistance to treatment with a specific photosensitizer.
Fig. 4 demonstrates the dynamics of average phase shift in photosensitised HeLa and A549 cells after irradiation at power densities of 7.5, 15, and 23 mW/cm2. The dynamics of variations in the average phase shift introduced by the cells into the recording wavefront were determined by averaging the data over several dozen cells in a sample. The graphs on the left-hand side of Fig. 4 demonstrate four scenarios of cell response to treatment, characteristic of survival (A549 cells at the power density of 7.5 mW/cm2), apoptosis (A549 cells at 15 mW/cm2, HeLa cells at 7.5 mW/cm2), and necrosis (HeLa cells at 15 and 23 mW/cm2 and A549 cells at 23 mW/cm2). The images on the right-hand side of Fig. 4 present typical distributions of average phase shift in cells of the two lines taken in 1.5 h after photodynamic treatment at the indicated doses.
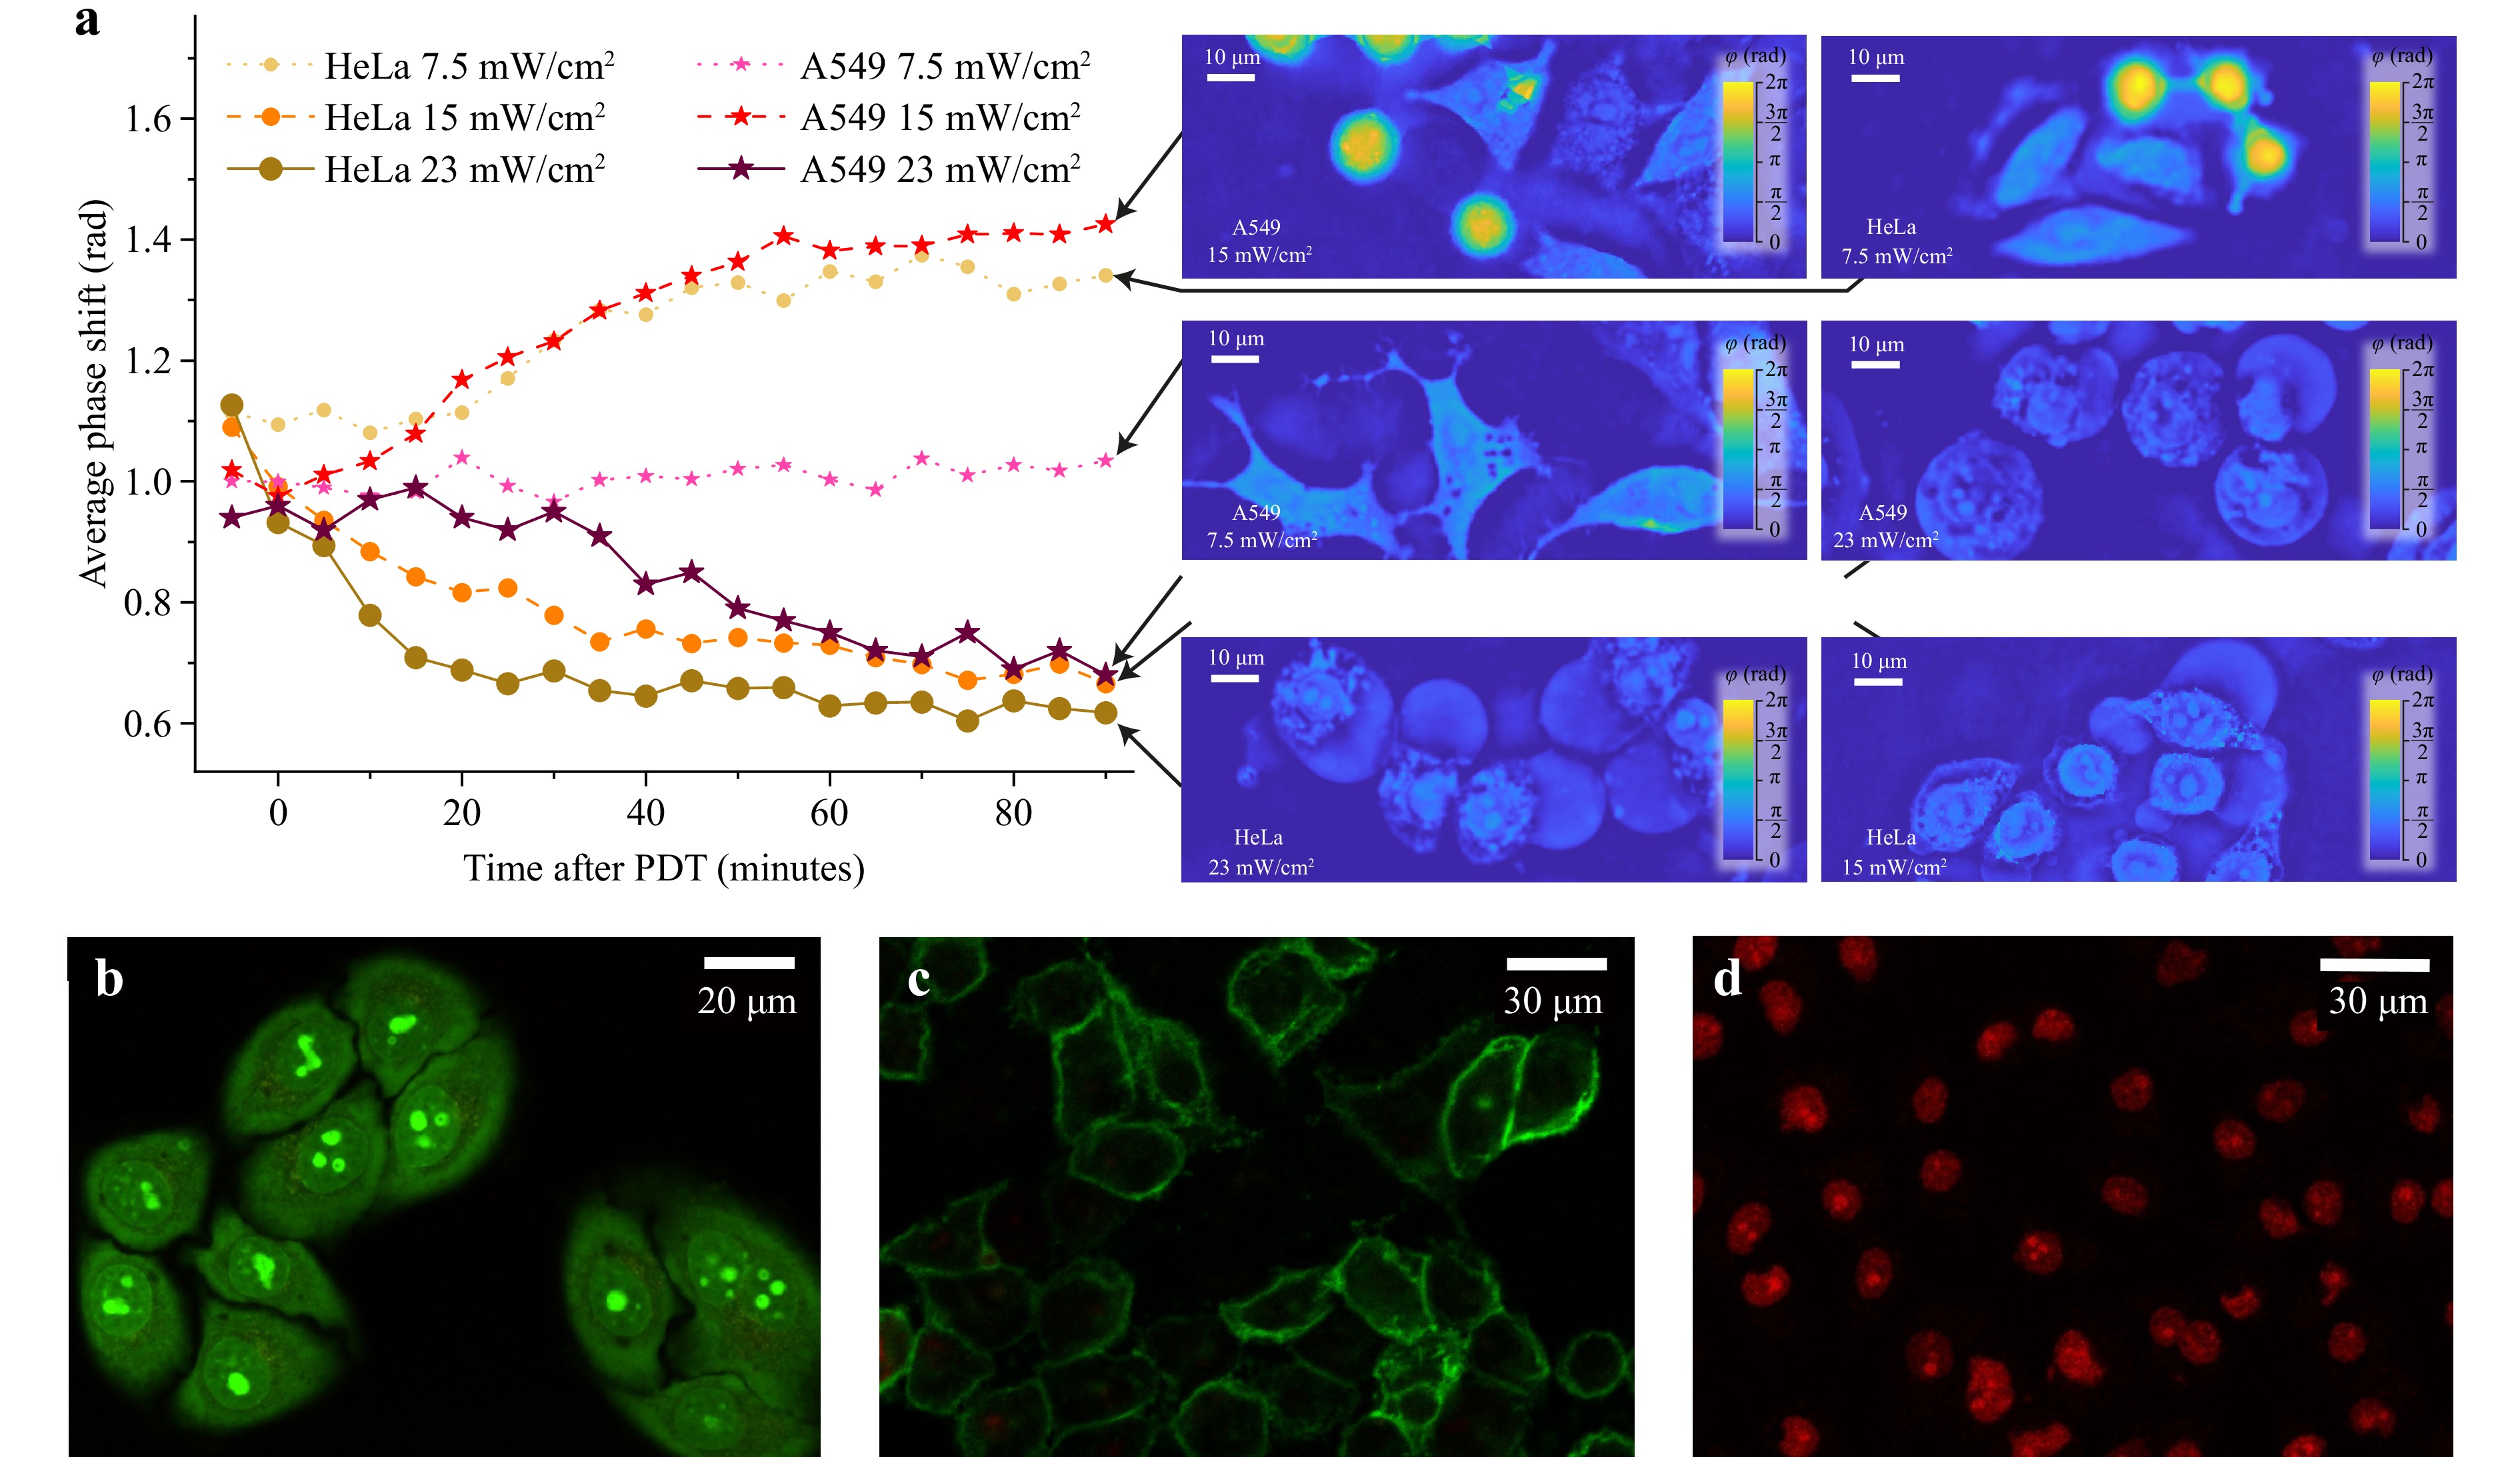
Fig. 4 a Dynamics of average phase shift in HeLa and A549 cells after photodynamic treatment with Radachlorin at different irradiation power densities. Data are shown for cells incubated with Radachlorin for 24 h. Representative examples of phase images corresponding to different cell states are shown on the right. b-d Examples of fluorescence images of HeLa cells validating cell state using common live/dead test assays. b Control non-irradiated HeLa cells stained with AO/EB assay. c Apoptosis of HeLa cells induced by photodynamic treatment with power density of 7.5 mW/cm2, validated using Annexin V/PI staining. Here, the bright fluorescence of Annexin V on the cellular membranes indicates apoptotic processes. d Necrosis of HeLa cells induced by photodynamic treatment with power density of 23 mW/cm2, validated using AO/EB staining. Here, the EB fluorescence in the cell nuclei indicates necrosis.
Therefore, relatively low UV radiation power densities of approximately 7.5 mW/cm2 (total dose of 2.2 J) did not cause any statistically significant variations in the average phase shift in A549 cells, but caused the initiation of apoptosis in HeLa cells. An increase in the irradiation dose up to 15 mW/cm2 (total irradiation dose of 4.5 J) resulted in the phase-shift kinetics characteristic of apoptosis in A549 cells and a nearly exponential decrease in the average phase shift in HeLa cells typical for necrosis. The further increase in the irradiation dose to 23 mW/cm2 caused a decrease in the average phase shift in cells of both types. However, in HeLa cells, the decrease began earlier and was moderately more prominent. The conclusions made regarding the cell death pathways were verified by a fluorescent analysis with commonly used cell death assays: Annexin V/PI confirmed apoptosis, and AO/EB confirmed live cells and cells dead by necrosis. Representative images of live, apoptotic, and necrotic HeLa cells stained with these test assays are shown in Fig. 4b-d. The analysis performed suggests that A549 cells were more resistant to photodynamic treatment with Radachlorin photosensitizer than HeLa cells. This may be owing to the different efficiencies of the antioxidant mechanisms in these types of cells.
-
The developed multimodal setup enabled us not only to monitor the morphological changes in cells caused by photodynamic treatment, but also to analyse the mechanisms of photosensitizer uptake, accumulation, and localisation in cells, which can govern the cell response to treatment. By varying the incubation time of cells of the two lines in Radachlorin-containing culture medium, we obtained information on the mechanism of penetration of photosensitizer molecules into the cells and determined their prevailing localisation in the cells. Fig. 5 shows spatial distributions of Radachlorin fluorescence lifetimes in HeLa cells at different incubation times. As can be seen in Fig. 5a-d, in the first stage of uptake, the Radachlorin molecules were predominantly localised on the cellular membrane. The fluorescence lifetime in these areas was about 5.5 ns (see Fig. 5a). After about 30 min of incubation, a prominent granular distribution of Radachlorin fluorescence intensity was observed in almost all areas of the intracellular space except for the nuclei, while a weak fluorescence was observed on the cell membrane as well. The characteristic lifetime of Radachlorin fluorescence in the formed spherical structures was in the range of 4.5–5 ns (Fig. 5b). At the same time, the Radachlorin fluorescence lifetime decreased with an increase in the distance from the membrane. A further increase in the incubation time to 60–90 min caused almost complete reduction of photosensitizer fluorescence on the cellular membranes and formation of an area near the nucleus with the fluorescence lifetime of about 4 ns (Fig. 5c). After incubation for 24 h, Radachlorin was predominantly localised in the perinuclear area (Fig. 5d). The dynamics of variations in the average lifetime of Radachlorin fluorescence in Hela cells as a function of incubation time is shown in Fig. 5e, where its monotonous decrease is clearly seen. The general pattern of Radachlorin uptake was the same in A549 cells. The concurrent monitoring of photosensitised (but not irradiated by the excitation laser) cells in the SLIM channel verified the lack of changes in the optical and morphological parameters of cells.
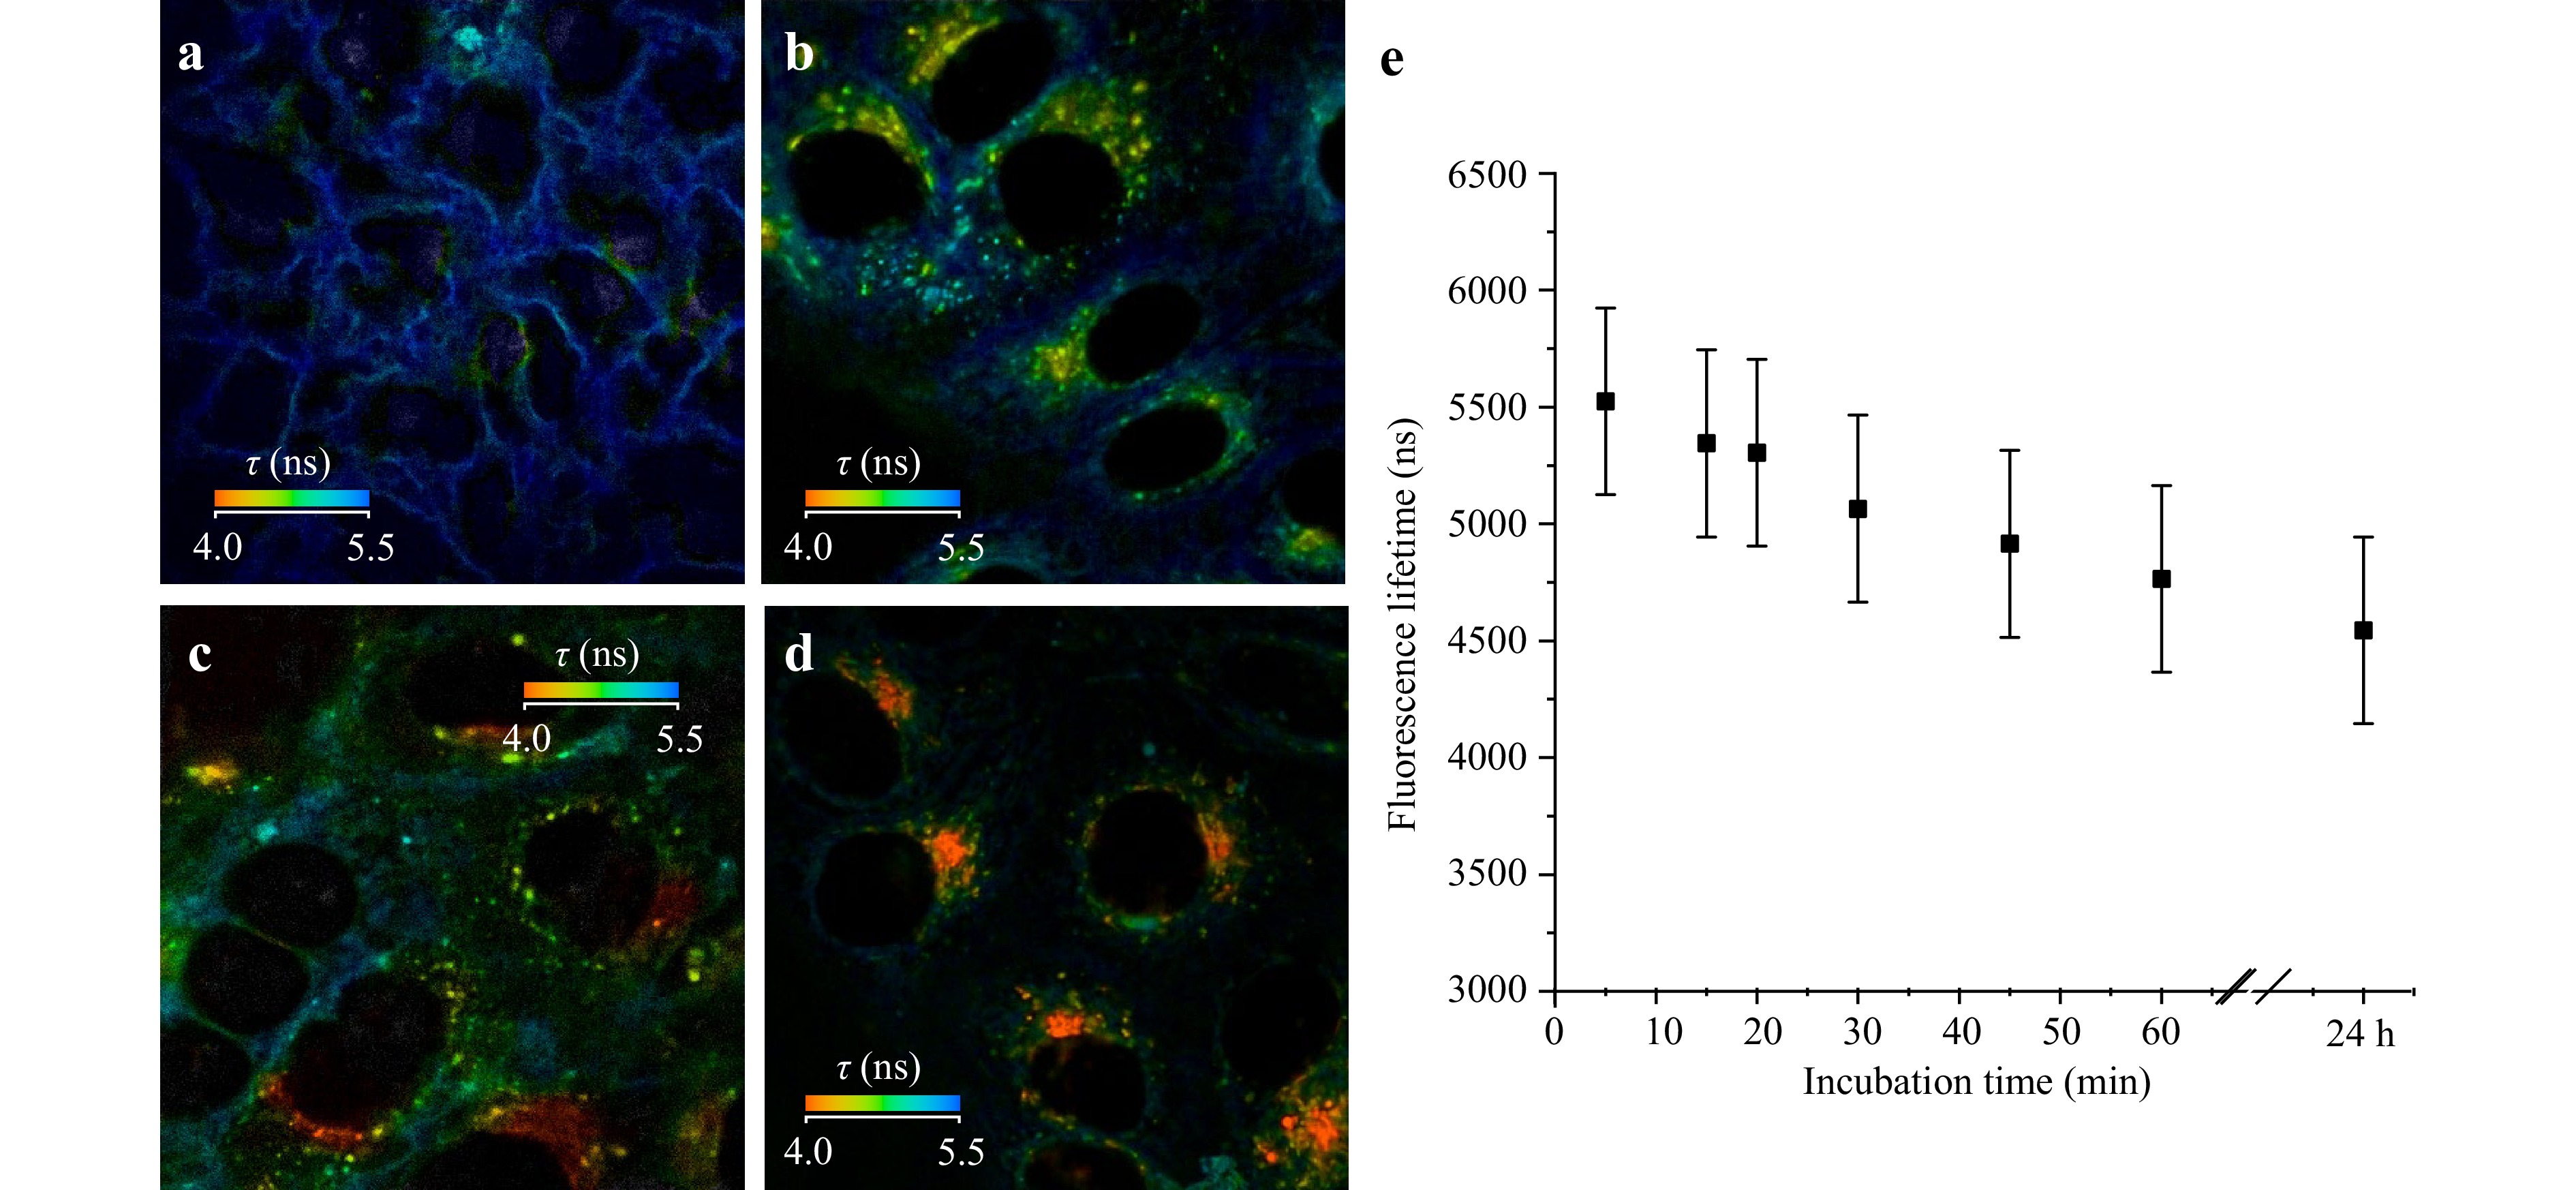
Fig. 5 Dynamics of Radachlorin fluorescence lifetime in HeLa cells in the course of its uptake and accumulation. FLIM images captured after incubation with Radachlorin for 2 a, 30 b, and 60 c min and 24 h d. Dynamics of Radachlorin fluorescence lifetime as a function of incubation time e.
Fig. 6 presents fluorescent images of HeLa and A549 cells incubated for 24 h in Radachlorin-containing culture medium with further addition of fluorescent markers of lysosomes (LysoTracker Green) and mitochondria (MitoTracker Green). The merged images clearly show the prevailing colocalisation of Radachlorin with lysosomes and insignificant colocalisation with mitochondria.
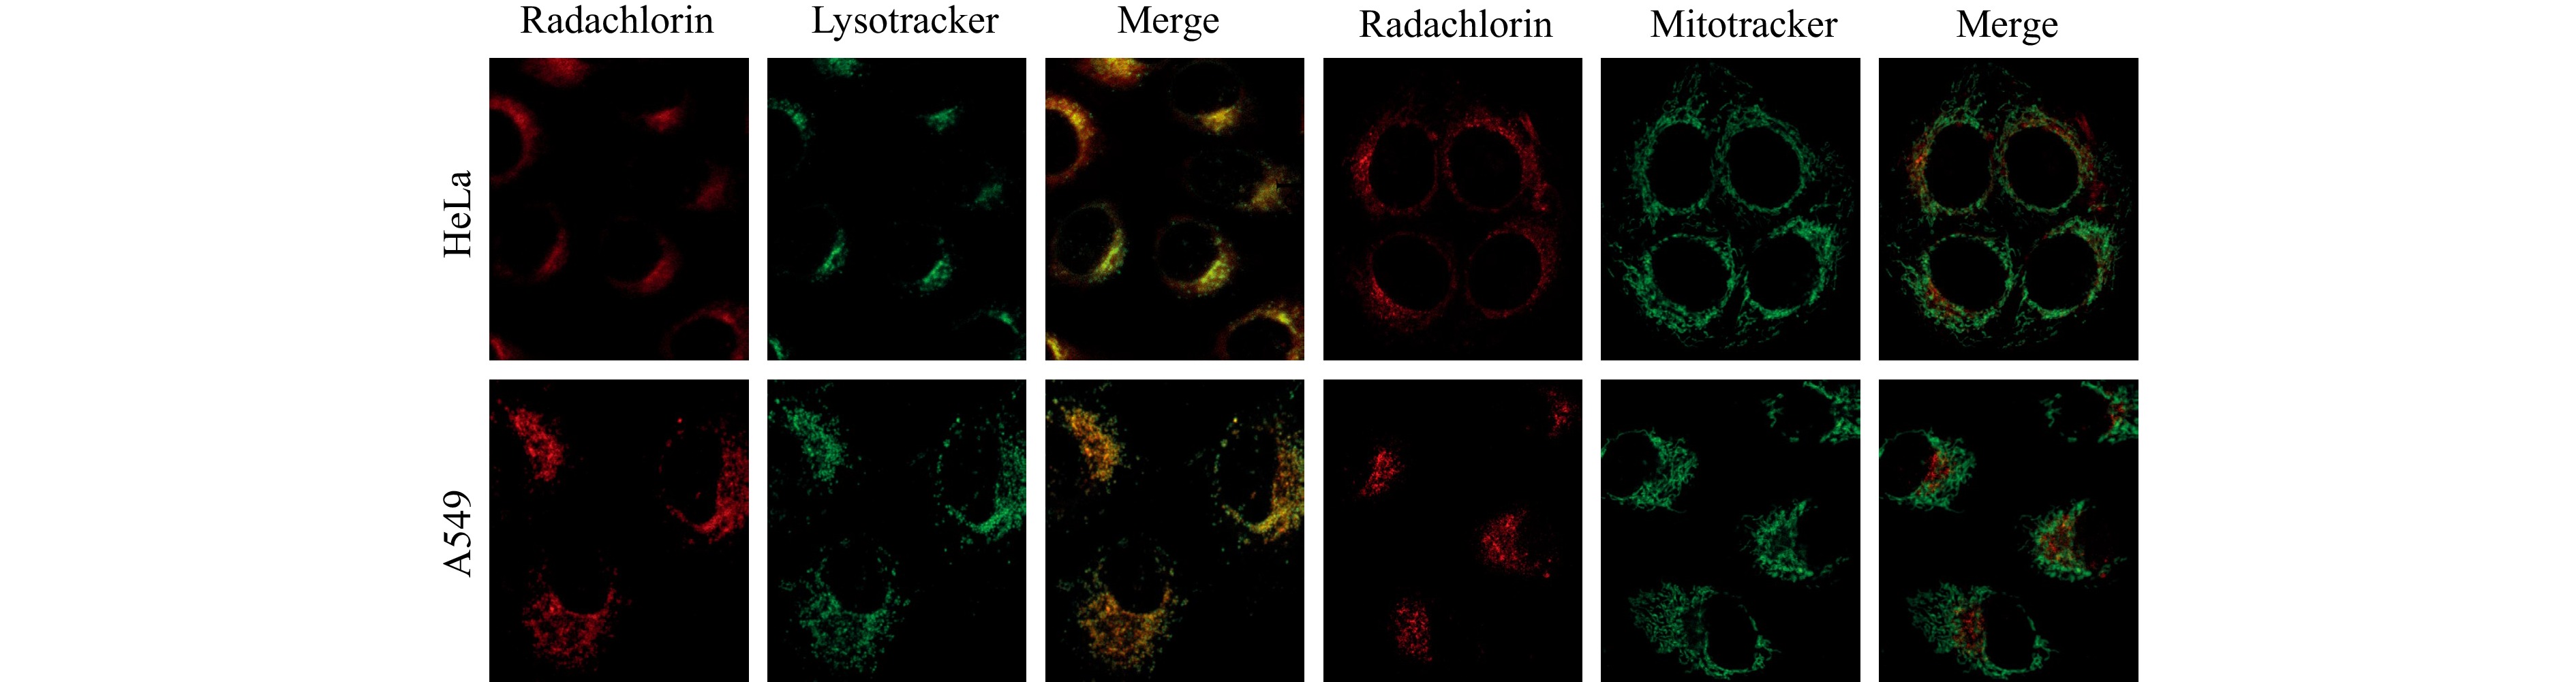
Fig. 6 Colocalisation images of Radachlorin, LysoTracker, and MitoTracker fluorescence in HeLa and A549 living cells.
The observed granular pattern of Radachlorin fluorescence in cells and its predominant localisation in lysosomes suggests that endocytosis is the major pathway for its uptake by cells. We have previously shown that Radachlorin molecules have high affinity for serum albumin36, 37. At the same time, since endocytosis is the major mechanism of albumin uptake by cells38-40, it is reasonable to assume that Radachlorin is also taken up and transported in cells through the endocytic pathway. The observed noticeable change of Radachlorin fluorescence lifetime in the course of its intracellular transportation from the cell membrane by endosomes to lysosomes can be associated with the corresponding variations in the microenvironment conditions, particularly polarity and acidity, because the Radachlorin-BSA complex is known to be sensitive to variations in both polarity and acidity of the microenvironment36, 41. The observed higher fluorescence lifetime on the cell membrane can be associated with its higher polarity, while the internalisation of complexes in endosomes and the subsequent transportation towards lysosomes led to a gradual increase in the microenvironment acidity and caused the decrease in Radachlorin fluorescence lifetime36, 41. The shortest lifetime was observed in the most acidic cell structures, i.e., lysosomes. However, as can be seen in Fig. 5d, e, even after 24 h of incubation, the average lifetime of Radachlorin fluorescence over the entire cell was still higher than that in the lysosomes, which was likely owing to incomplete binding of Radachlorin molecules to serum albumin and the presence of free molecules in the cytoplasm and other cellular structures. Similar patterns of Radachlorin fluorescence lifetime were observed in A549 cells.
Fig. 7a shows the dynamics of the variations in Radachlorin fluorescence intensity in the cells of the two lines as a function of incubation time. As can be seen from the graphs, Radachlorin accumulation increased rapidly during the first 5 h of incubation and then reached a plateau. To compare the accumulation dynamics in the cells of the two lines, we used the equation $ I = I_0(1-e^{-kt}) $ with the coefficient $ k $ characterizing the accumulation rate. The calculated values of $ k $ for HeLa and A549 cells are shown in the legends to the graphs in Fig. 7a.
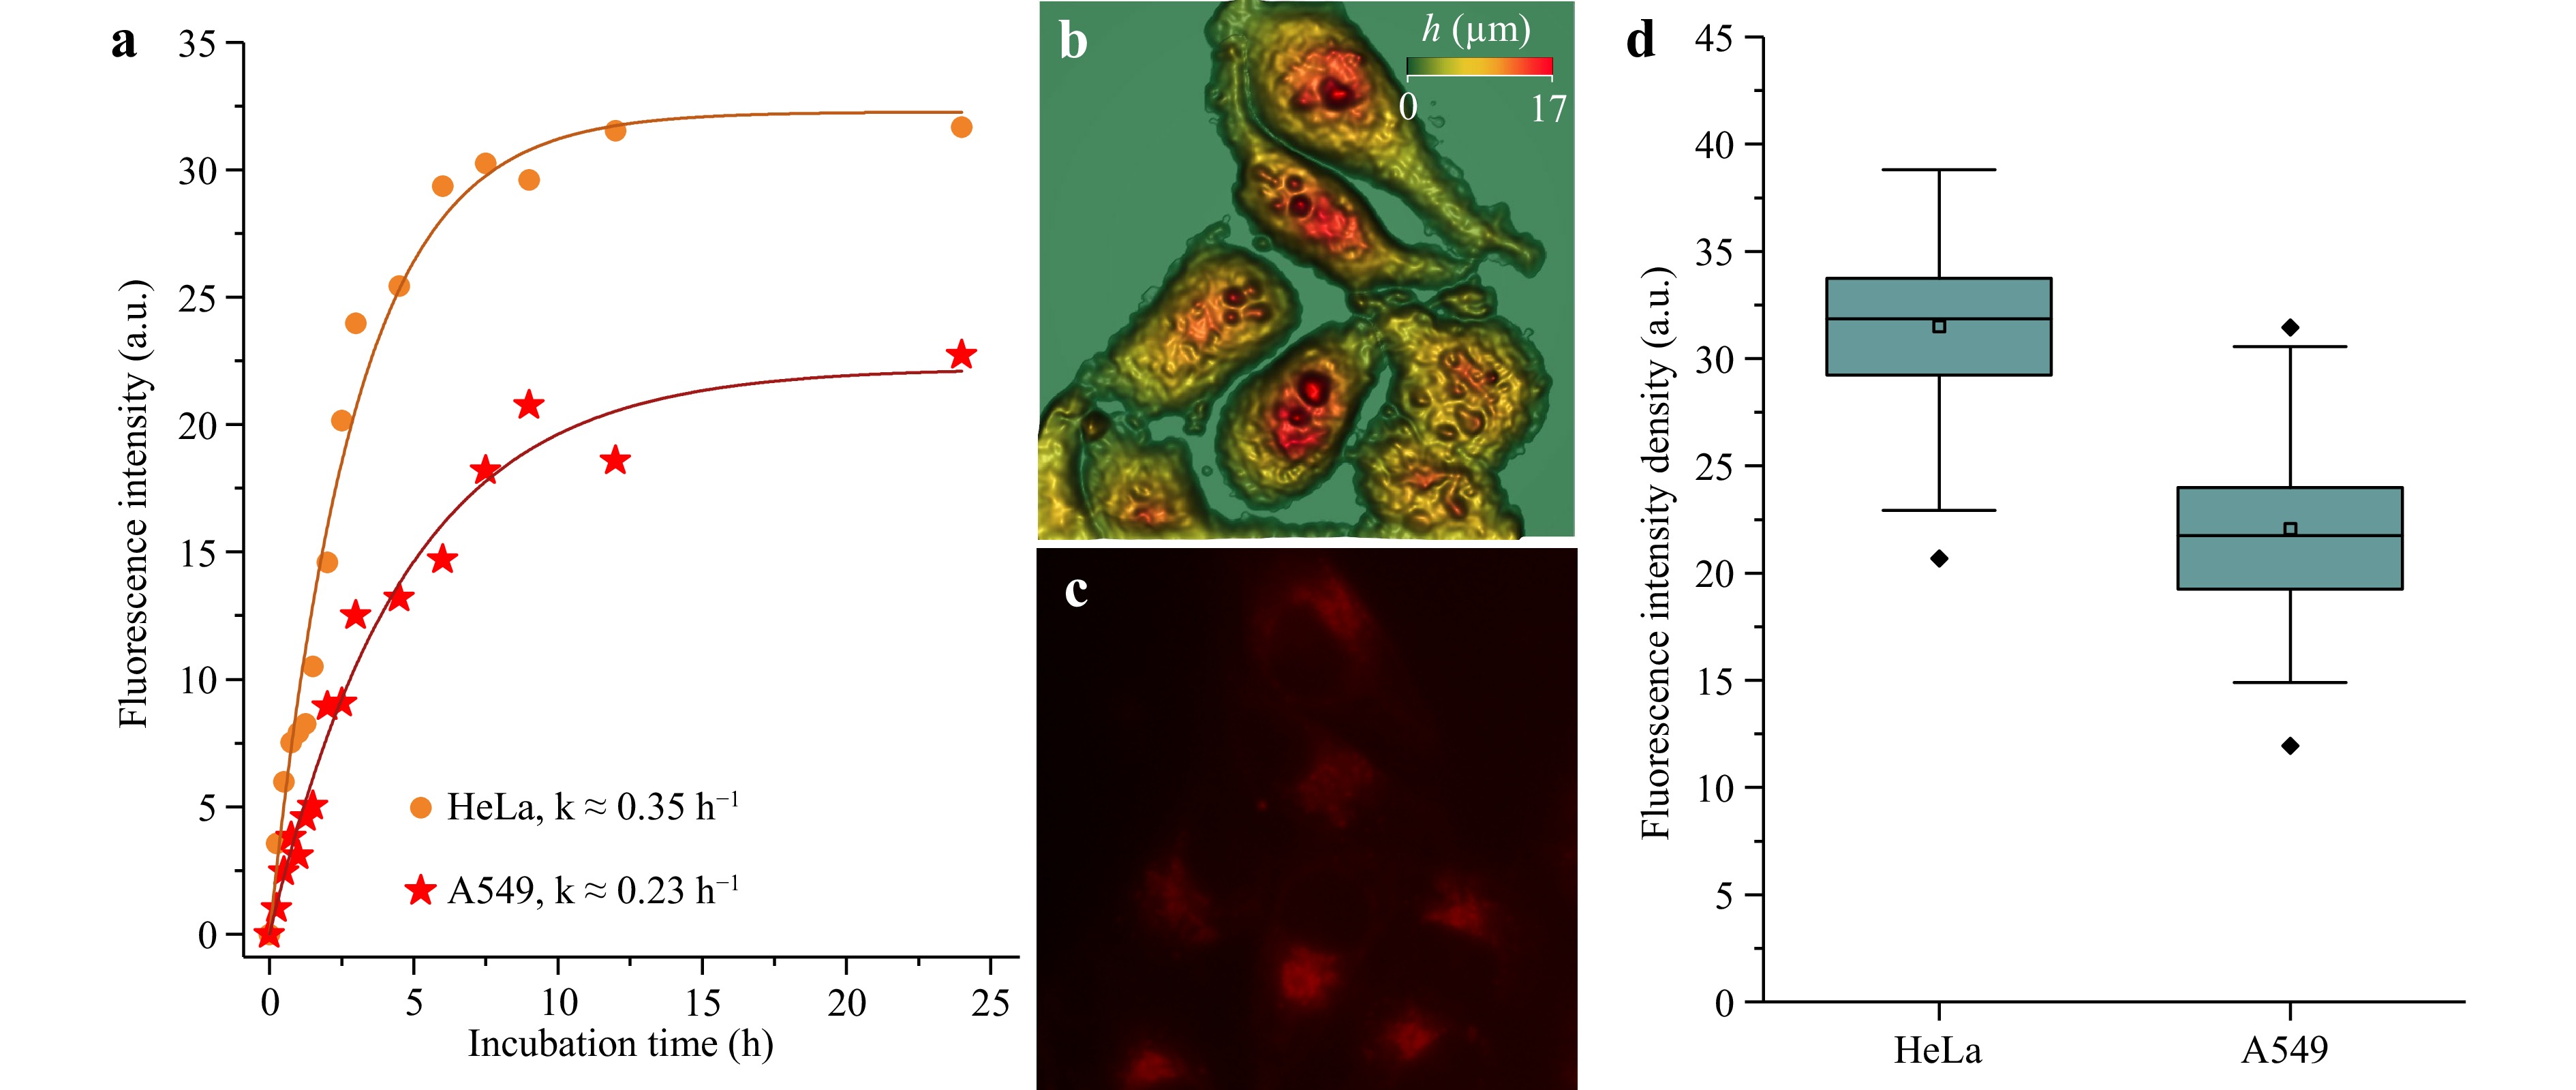
Fig. 7 a Kinetics of Radachlorin accumulation in HeLa and A549 cells as a function of incubation time. b, c Examples of the height map of HeLa cells reconstructed from SLIM data and Radachlorin epifluorescence image utilised for evaluating Radachlorin accumulation in cells. d Comparative analysis of the Radachlorin amount accumulated in HeLa and A549 cells after 24 h of incubation in 20 μg/ml Radachlorin solution per cell volume calculated from SLIM data. Each point in the graph a was obtained from the analysis of data from approximately 15 cells in several fields of view. In d, the middle point in the box plot represents the mean value, the horizontal middle line is a median, and the box denotes the 25- and 75-percentiles.
The simultaneous recording of Radachlorin fluorescence intensity in cells and their phase images in the SLIM channel demonstrated that Radachlorin finally accumulated in the perinuclear area, characterised by the largest thickness (see Fig. 7b, c). The analysis of the same cells in the two channels enabled us to consider the variations in cellular morphology and estimate the fluorescence intensity density as a ratio of the total intensity of Radachlorin fluorescence in a cell to the cell volume. The data are presented as box plots in Fig. 7d. As can be seen, Hela cells accumulated a slightly higher concentration of Radachlorin than A549 cells. This could be a reason for their low resistance to photodynamic treatment compared to A549 cells.
-
Distributions of time-resolved fluorescence signals of endogenous fluorophores in cells recorded in the FLIM channel enable the characterisation of cellular metabolism. The endogenous coenzymes NADH and FAD are key agents that are strongly involved in cellular metabolism. Both the types of metabolic reactions in living mammalian cells, glycolysis and oxidative phosphorylation, occur with participation of these two coenzymes 42. The decay times of their fluorescence depend on whether these molecules are bound to proteins. The fluorescence decay times of bound FAD and free NADH molecules are in the time domain of hundreds of picoseconds, while those of free FAD and bound NADH molecules are in the nanosecond time domain43.
Several methods have been developed to assess the predominant type of metabolism in cells (See Ref. 44 and references therein). One of the most widely used optical method is assessing the fluorescence lifetime induced redox ratio (FLIRR) (See in Ref. 11,25,28,45). This approach is based on the estimation of the ratio of the slow component of the time-resolved fluorescence signal of NADH to the fast component of that of FAD: $ FLIRR = a_2^{NADH}/a_1^{FAD} $. The main advantage of this approach is that it does not depend on the absolute number of NADH and FAD molecules in the cell and relies only on the proportion of bound and free molecules. This is particularly important when analysing different cells and comparing different cultures, where the total amount of these substances or their concentration per unit volume may vary depending on the physiological or morphological features.
Fig. 8 shows representative examples of the distributions of $ a_1 $, $ \tau_1 $, and $ \tau_2 $ for FAD and NADH in cells of the two lines. The analysis of time-resolved fluorescence signals of NADH and FAD revealed a lack of statistically significant differences in the short fluorescence lifetimes of the coenzymes in the cells of both lines within the experimental error. The slow components of the time-resolved fluorescence signals also did not differ, which is fully consistent with the assumption that the main differences between the two cell types were not related to characteristics of the microenvironment of coenzymes. At the same time, the contributions of the fast and slow components of the time-resolved fluorescence signals of NADH and FAD in HeLa and A549 cells differed slightly, that provided different values of the FLIRR index in these cells: $ FLIRR_{A549} $ = 0.52, and $ FLIRR_{HeLa} $ = 0.41. These data may be indicative that oxydative phosphorylation prevails in A549 cells, while glycolysis dominates in HeLa cells.
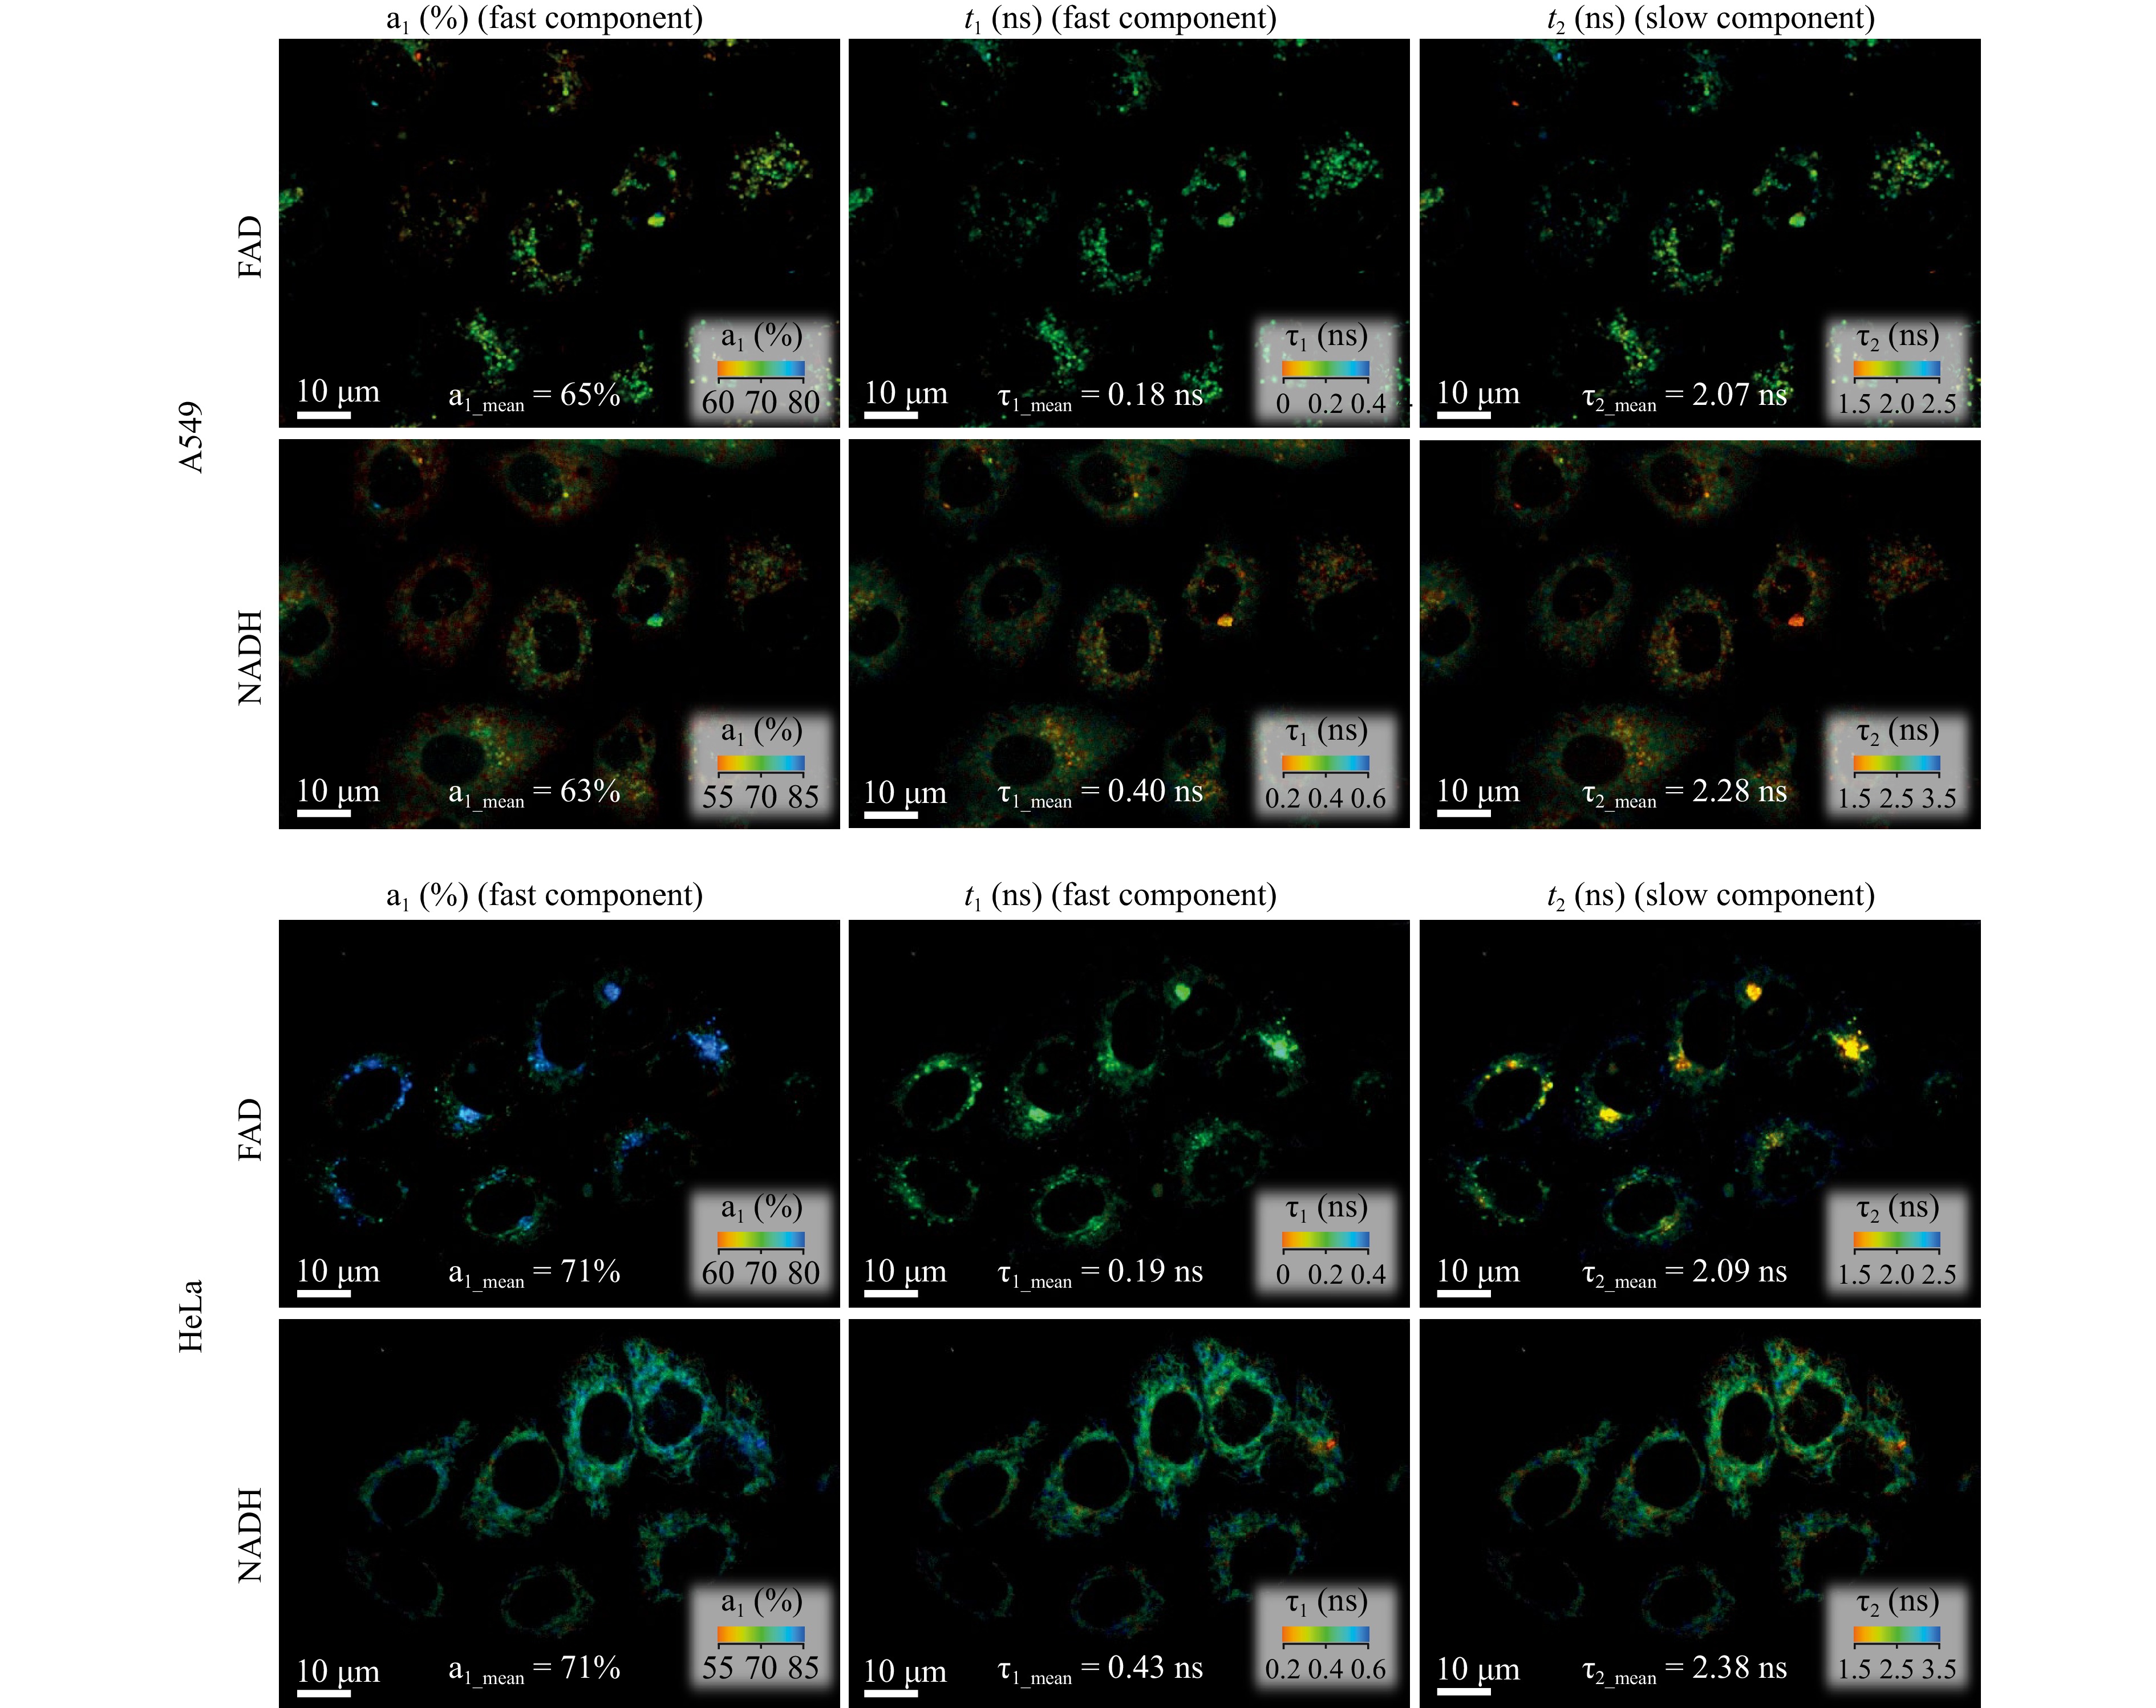
Fig. 8 Examples of NADH and FAD fluorescence lifetime images in HeLa and A549 cells.
-
The developed multimodal fluorescence-holographic approach enabled us to retrieve a wide range of cellular parameters, characterising cell morphology, metabolism, accumulation and localisation of the photosensitizer, as well as to evaluate the resistance of cells to photodynamic treatment. The observed difference in the FLIRR indices of HeLa and A549 cells (Table 2 and Fig. 8) indicates that oxydative phosphorylation was reduced and glycolysis was enhanced in HeLa cells more than in A549. Similar results were reported by Penjweini et al.46, who demonstrated lower glycolysis in A549 cells than in HeLa cells. Cells of both types had an approximately equal average volume, but their height and ‘spread’ differed: HeLa cells were thicker, while A549 cells had a larger area of attachment to the Petri dish (Table 1 and Fig. 3). Despite having the same volume, HeLa cells accumulated approximately 40% higher concentration of Radachlorin (Fig. 7d), as well as had a higher accumulation rate (Fig. 7a). In both the cell types, the photosensitizer was predominantly localised in lysosomes (Fig. 6). The mechanism of its uptake by cells of both types was endocytosis and its transportation was accompanied by a gradual decrease in the fluorescence lifetime (Fig. 5). This was explained by the gradual acidification of endosomes in the course of their way to lysosomes. At the same time, the comparative analysis of the dynamics of the morphological changes in cells that occurred under photodynamic treatment revealed that HeLa cells were less resistant and died at lower irradiation doses than A549 cells (Fig. 4).
Cell type FAD NADH FLIRR a1 (%) τ1 (ns) τ2 (ns) a1 (%) τ1 (ns) τ2 (ns) A549 67 0.18 2.12 65 0.41 2.22 0.52 HeLa 70 0.20 2.08 71 0.45 2.40 0.41 Table 2. NADH and FAD fluorescence parameters in HeLa and A549 cells and FLIRR coefficient determined from the data.
The combined use of QPI and FLIM enabled us to significantly expand the range of retrievable information on the cell samples. This combination also provided more accurate assessment of the rate and degree of photosensitizer uptake and accumulation in cells. The developed approach can be applied for analysis of a wide range of fluorescent substances and for determination of cell response to other external stimuli. QPI allows for evaluation of an extended set of morphological parameters of cells in a non-invasive manner. Time-resolved fluorescence microscopy provides additional information regarding the physiological state of cells, allowing for assessment cellular metabolism and accumulation of various fluorescent substances in cells.
One of the particular problems for which the developed approach could provide potentially crucial information is the recently observed difference in the response of cells obtained from solid tumours of individual patients, to photodynamic treatment47. The complementary information on cellular metabolism and photosensitizer accumulation in cells can provide insights into the origin of these differences.
-
AAZ, AVB, AVS, and IVS acknowledge the financial support provided by the Russian Science Foundation under grant No. 21–72-10044.
QPI- and FLIM-assisted multimodal analysis of the dynamics of morphological and physiological parameters of cells
- Light: Advanced Manufacturing , Article number: (2025)
- Received: 31 December 2024
- Revised: 10 October 2025
- Accepted: 20 October 2025 Published online: 25 November 2025
doi: https://doi.org/10.37188/lam.2025.079
Abstract: This paper presents a multimodal approach that combines time-resolved fluorescence microscopy and spatial light interference microscopy into a single complex allowing for a concurrent comprehensive analysis of cell samples in vitro. The combined application of quantitative phase imaging using partially coherent radiation with time-resolved fluorescence imaging of endogenic coenzymes NADH and FAD, as well as Radachlorin photosensitizer, allowed for evaluation of a set of morphological and physiological parameters of cells of the two lines, HeLa and A549, in the course of photodynamic treatment. Besides comparison of cells of the two lines in terms of volume, height, dry mass, projected area, and redox ratio, we analysed the mechanisms and rate of Radachlorin accumulation. Using the developed multimodal approach, we demonstrated that in both the cell lines, Radachlorin was taken up in complexes with serum albumin, transported by endocytosis, and accumulated primarily in lysosomes. The Radachlorin transportation through the cellular membrane to lysosomes was accompanied by a decrease in its fluorescence lifetime, which was apparently owing to a gradual increase in endosome acidity. The different contributions of the fast and slow components of time-resolved fluorescence signals of nicotinamide adenine dinucleotide (NADH) and flavin adenine dinucleotide (FAD) enabled us to demonstrate the difference in the redox ratios of cells of the two lines. The average concentration of the accumulated Radachlorin photosensitizer in cells of the two lines and their resistivity to photodynamic treatment also differed: HeLa cells tended to accumulate more Radachlorin and demonstrated lower resistivity to photodynamic treatment.
Research Summary
Multimodal Platform: Fluorescence-Holographic Approach for Studying Living Cells
The authors present a new combined multimodal approach utilising time-resolved fluorescence and low-coherence holographic microscopy and tailored to a comprehensive analysis of the dynamics of changes in physiological and morphological parameters of living cells in vitro. The combination of these techniques and the joint analysis of data obtained on phase shift induced by cells to the transmitted wavefront, as well as on the fluorescence decay times of endogenous and exogenous fluorophores, allows drawing conclusions about important parameters of the intracellular environment, metabolic characteristics, phase of the cell life cycle, cellular morphology and protein concentration. The authors demonstrated that a combined analysis of variations in the above mentioned parameters occurred as a result of photodynamic treatment, enabled for characterization of cell cultures of different types and identification of their resistance to treatment.
Rights and permissions
Open Access This article is licensed under a Creative Commons Attribution 4.0 International License, which permits use, sharing, adaptation, distribution and reproduction in any medium or format, as long as you give appropriate credit to the original author(s) and the source, provide a link to the Creative Commons license, and indicate if changes were made. The images or other third party material in this article are included in the article′s Creative Commons license, unless indicated otherwise in a credit line to the material. If material is not included in the article′s Creative Commons license and your intended use is not permitted by statutory regulation or exceeds the permitted use, you will need to obtain permission directly from the copyright holder. To view a copy of this license, visit http://creativecommons.org/licenses/by/4.0/.

 DownLoad: