


-
Ultrasensitive gas sensors have broad application prospects in various fields, including the health monitoring of energy batteries1–3, the detection of environmental pollutants4,5, and the analysis of exhaled gases in biomedical6–8. Traditional electrochemical sensors based on gas-sensitive materials have gained significant attention due to their unique advantages, such as minimal sample requirements and rapid response times. However, this technology faces limitations in maintaining stability because of the sensitivity of gas-sensitive materials to poisoning effects. The optical gas detection technologies, such as fluorescence, gas chromatography, and infrared spectroscopy, exhibit exceptional sensitivity and selectivity, but their large size, high maintenance costs, and complex operational procedures considerably restrict the practicality in real-world applications. Therefore, developing ultrasensitive and miniaturized gas sensors with low cost and repeatability remains a significant challenge in current research.
Photoacoustic spectroscopy (PAS) has emerged as a leading approach for online trace gas detection due to its advantages of high sensitivity, excellent selectivity, and rapid response time9–12. Its core detection process relies on the selective absorption of lasers with specific wavelengths by gas molecules. Photoacoustic (PA) gas sensor detects sound waves generated by thermal expansion and contraction of gas molecules absorbing modulated light. Different from direct absorption spectroscopy13, PAS uses a micro-electro-mechanical system (MEMS) microphone to detect acoustic signal related to gas concentration, eliminating the need for expensive infrared photodetectors and offering a background-free detection capability. Typically, the PA signal was measured in a PA cell. Gong et al.14 proposed a T-type semi-open photoacoustic cell (PAC) with a volume of about 25 mL, achieving a limit of detection (LOD) of 0.7 parts per billion (ppb) for acetylene (C2H2) gas. Li et al.15 designed a multi-channel Helmholtz-type cell, which achieved a LOD of 18 ppb for C2H2 with an integration time of 166 s. Zhao et al.16 used a differential multi-pass cell with a volume of 162 mL and an optical path of 4.92 m to enhance the PA signal, achieving a minimum detection limit of 0.6 ppb for methane (CH4).
However, the traditional PAS technique requires large-volume PA cell and complex external equipment, limiting its application in scenarios requiring rapid response, miniaturization, and precise monitoring17,18. With the development of micro spectroscopy technology, there is an increasing demand for intelligent sensors with miniaturization, integration and remote monitoring capability. MEMS microphones have been widely used as the PA signal collection devices due to their small size and high sensitivity. The transmission of electrical signals necessitates external circuitry, but the conventional optical fiber can only transmit optical signals, not electrical signals. The limitation complicates the integration and miniaturization of sensors19–24. Multimaterial thermal drawing technology enables the integration of diverse functional materials such as metals, semiconductors, crystals, glass, polymers, and even micro-devices into a single fiber, achieving multifunctional composite structures to meet various application needs25–27. Combining the PA cell with the multimaterial optoelectronic fiber offers an ideal solution to the above challenges, paving the way for miniaturized optoelectronic gas detection devices.
In this study, we designed a PA gas sensor by integrating a multimaterial optoelectronic fiber, a T-PAC and a MEMS microphone. The sensor can achieve simultaneous transmission of pump light signals and detection electrical signals. Compared to traditional H-type longitudinal resonance PA cell, the designed T-PAC has a higher cell constant, faster response time, and a simpler fabrication process, while reducing the cavity volume to only 0.02 mL. The optical pathlength-to-volume ratio (OPVR) of the sensor is 1736.8 mm·mL−1. The experimental results show that the sensor has a low detection limit of 211 ppb and a response time of ~3 s for C2H2 gas. This work establishes a new class of optical sensors featuring compact size, ultrahigh sensitivity, environmental robustness, and scalable multiplexed detection capabilities for harsh environments.
-
The structure of the designed PA gas sensor based on the multimaterial optoelectronic fiber is shown in Fig. 1a. Gas molecules diffuse into the miniature T-PAC, where they absorb pump light and generate acoustic waves. The acoustic waves are tightly confined by the T-PAC, which acts as a hard acoustic boundary, resulting in pressure levels several orders of magnitude higher than those of free-space-expanding PA waves. Simultaneously, the T-PAC resonance amplifies the pressure level of the acoustic waves. The excitation and demodulation scheme of the PA signals is illustrated in Fig. 1b, the center wavelength of the pump light was slowly scanned over the gas absorption line, and its frequency was sinusoidally modulated. The locally excited PA waves were amplified by the T-PAC and collected by a MEMS microphone, which were then converted into electrical signals. A lock-in amplifier was used to acquire the second harmonic (2f) signals of the PA signals to determine the gas concentration.
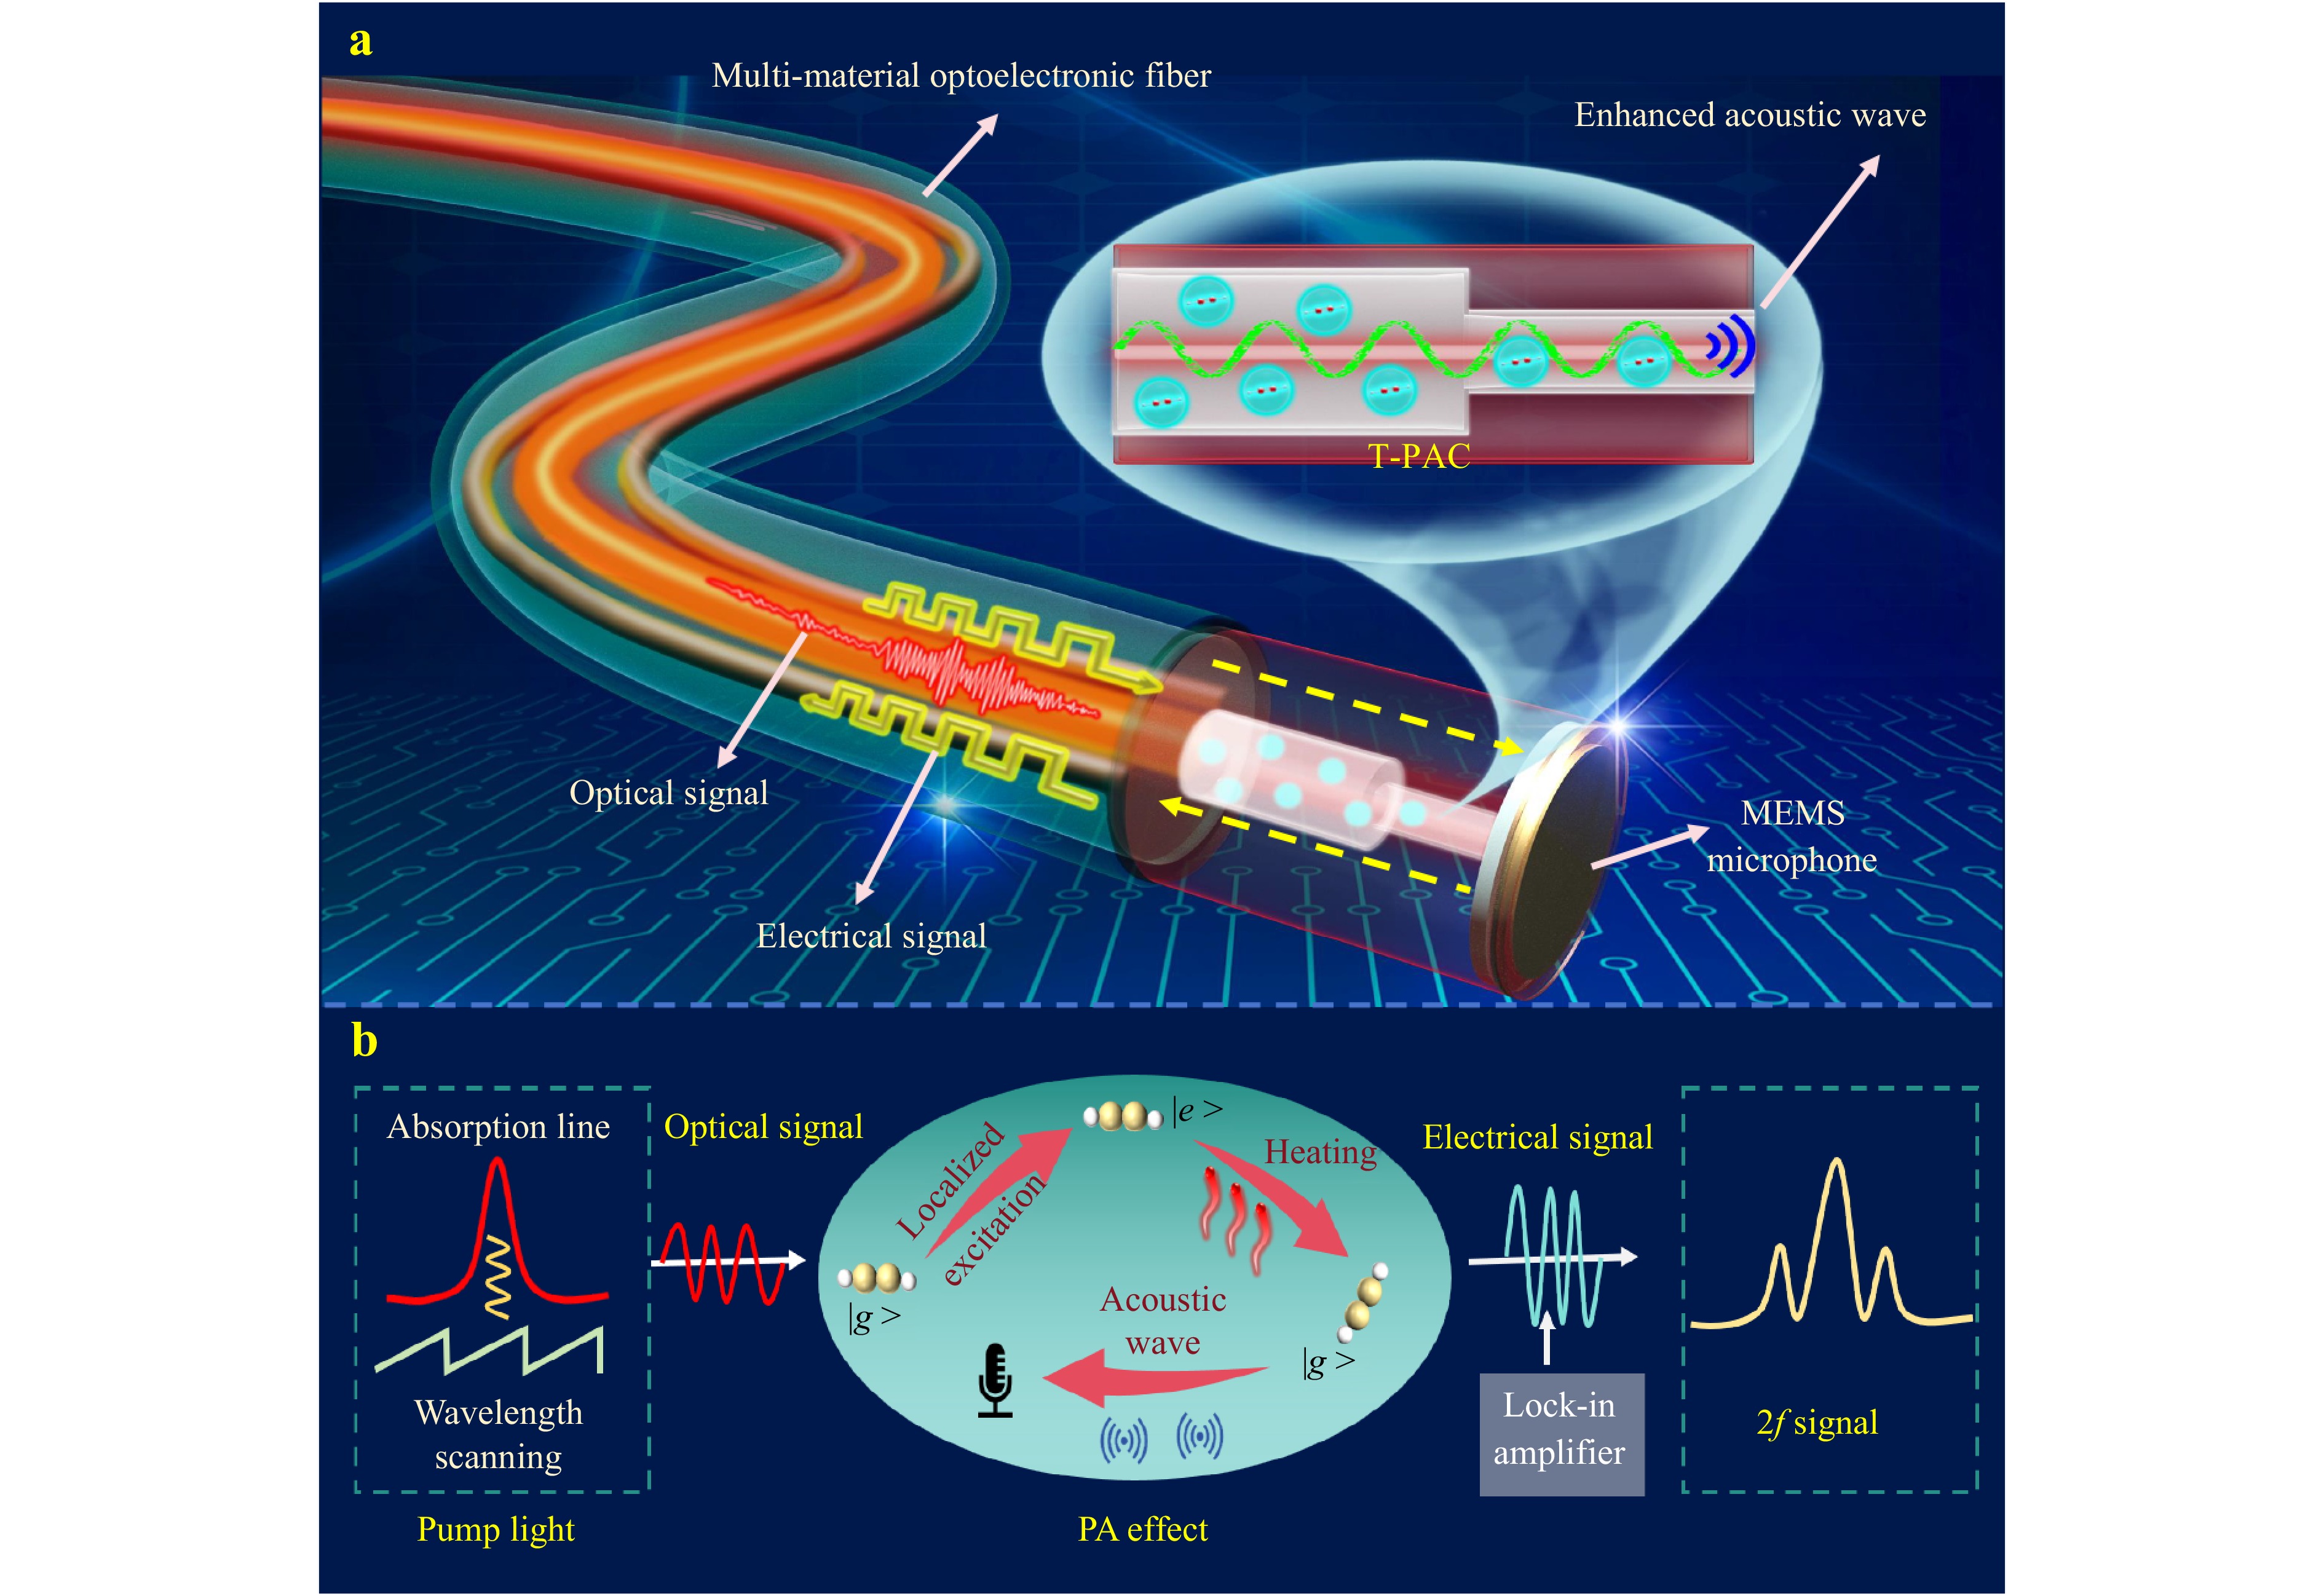
Fig. 1 a Structural schematic diagram and b PA gas sensing principal diagram of the high-integrated all-fiber sensor.
Assuming a frequency-modulated beam with the light intensity I (r, t) and the frequency ν is incident into T-PAC. Gas molecules within the cell transition from the ground state to the excited state upon absorbing light energy, generating a thermal power density source H (r, t), which can be expressed as28
$$ H(r,t)=c\sigma I(r,t)=aI(r,t) $$ (1) where c, σ and a are the concentration, absorption cross-section and absorption coefficient of the gas molecules, respectively. The light intensity I (r, t) is frequency-modulated, so the thermal power density source H (r, t) oscillates at the same frequency. Under the condition of unsaturated absorption, H (r, t) is proportional to the gas concentration N when the light intensity I (r, t) remain constant. According to the working mode of acoustic waves, PA cell includes resonant PA cell and non-resonant PA cell. Compared with the non-resonant PA cell, the resonant PA cell has higher sensitivity for trace gas detection. Utilizing the acoustic resonance of the PA cell is one of the effective means to increase the intensity of PA excitation. For a T-type PA cell, its first-order longitudinal acoustic mode $ {P}_{(100T)}(\vec r) $ and resonant frequency f(100T) can be written as29,30
$$ {P}_{(100T)}(\vec r)=\cos \left(\frac{\pi }{2L}z\right) $$ (2) $$ {f}_{(100T)}=\frac{s}{4{L}_{eff}} $$ (3) where L is the geometric length of the resonant cavity, s is the speed of sound in the target gas, and z is the longitudinal coordinate. When z=0, $ {P}_{(100T)}(\vec r)=1 $, the antinode of the standing wave is located at the end of the T-PAC away from the buffer cavity. When z=L, $ {P}_{(100T)}(\vec r)=0 $, the node is at the interface between the resonant cavity and the buffer cavity31. Assuming the radius of resonant cavity is R, the effective length Leff can be written as
$$ {L}_{eff}=L+\frac{16}{3\pi }R $$ (4) When R$\ll $L, the resonant frequency f(100T) is approximately inversely proportional to L. When neglecting the viscous and the thermal losses of the gas, the periodic thermal power density source induces periodic pressure changes. The acoustic signal is converted into the electrical signal by an acoustic transducer, and the amplitude SPA of the output signal can be expressed as32
$$ {S}_{\text{PA}}={S}_{0}{P}_{\text{eff}}Fca={C}_{\text{cell}}a{P}_{\text{eff}} $$ (5) where S0 is the sensitivity of the acoustic transducer (mV·Pa−1); Peff is the effective optical power (W); F is the cell constant (Pa·cm−1·W−1), it directly reflects the PAC's capability to enhance PA signals; c is the gas concentration (ppb); α is the gas absorption coefficient (cm−1); Ccell represents the efficiency of light-to-sound energy conversion in the PA system.
-
Multimaterial optoelectronic fibers are fabricated using a scalable thermal drawing technique, which enables the integration of diverse functional materials such as glasses, metals, and polymers into a single fiber33–36. During this process, macroscopic preforms with the desired material composition are heated to a softened state in a furnace and then drawn into kilometers-long fibers with micro- or nanoscale features under a pulling force, as illustrated in Fig. 2a. This technique allows precise control over the fiber's geometry and material distribution, facilitating the creation of complex architectures. In a typical fabrication process, an optoelectronic fiber composed of metal electrode, silica fiber, and polymer are thermally drawn. Two copper filaments and a silica fiber are fed into a polymethyl methacrylate (PMMA) cladding to form the final fiber. The fiber diameter is regulated by controlling the drawing temperature, drawing speed, preform feeding speed, and the initial diameter of the preform. As a result, fibers with diameters ranging from macroscale to microscale can be successfully produced. The fabrication process is highly scalable, enabling the production of kilometers-long fibers within one hour. A bundle of drawn optoelectronic fibers is shown in Fig. 2b, while Fig. 2c displays the configuration with the central waveguide surrounded by two metal electrodes. The final fiber retains the geometry and composition of the macroscopic preform. The structure of the drawn fibers is highly intact, with the central silica fiber and copper electrodes closely adhering to the PMMA cladding. The polymer PMMA is used as the outer cladding material to integrate the metal electrodes and the glass fiber core. Specifically, the glass fiber core functions to transmit optical signals, while the copper electrodes are responsible for receiving electrical signals.
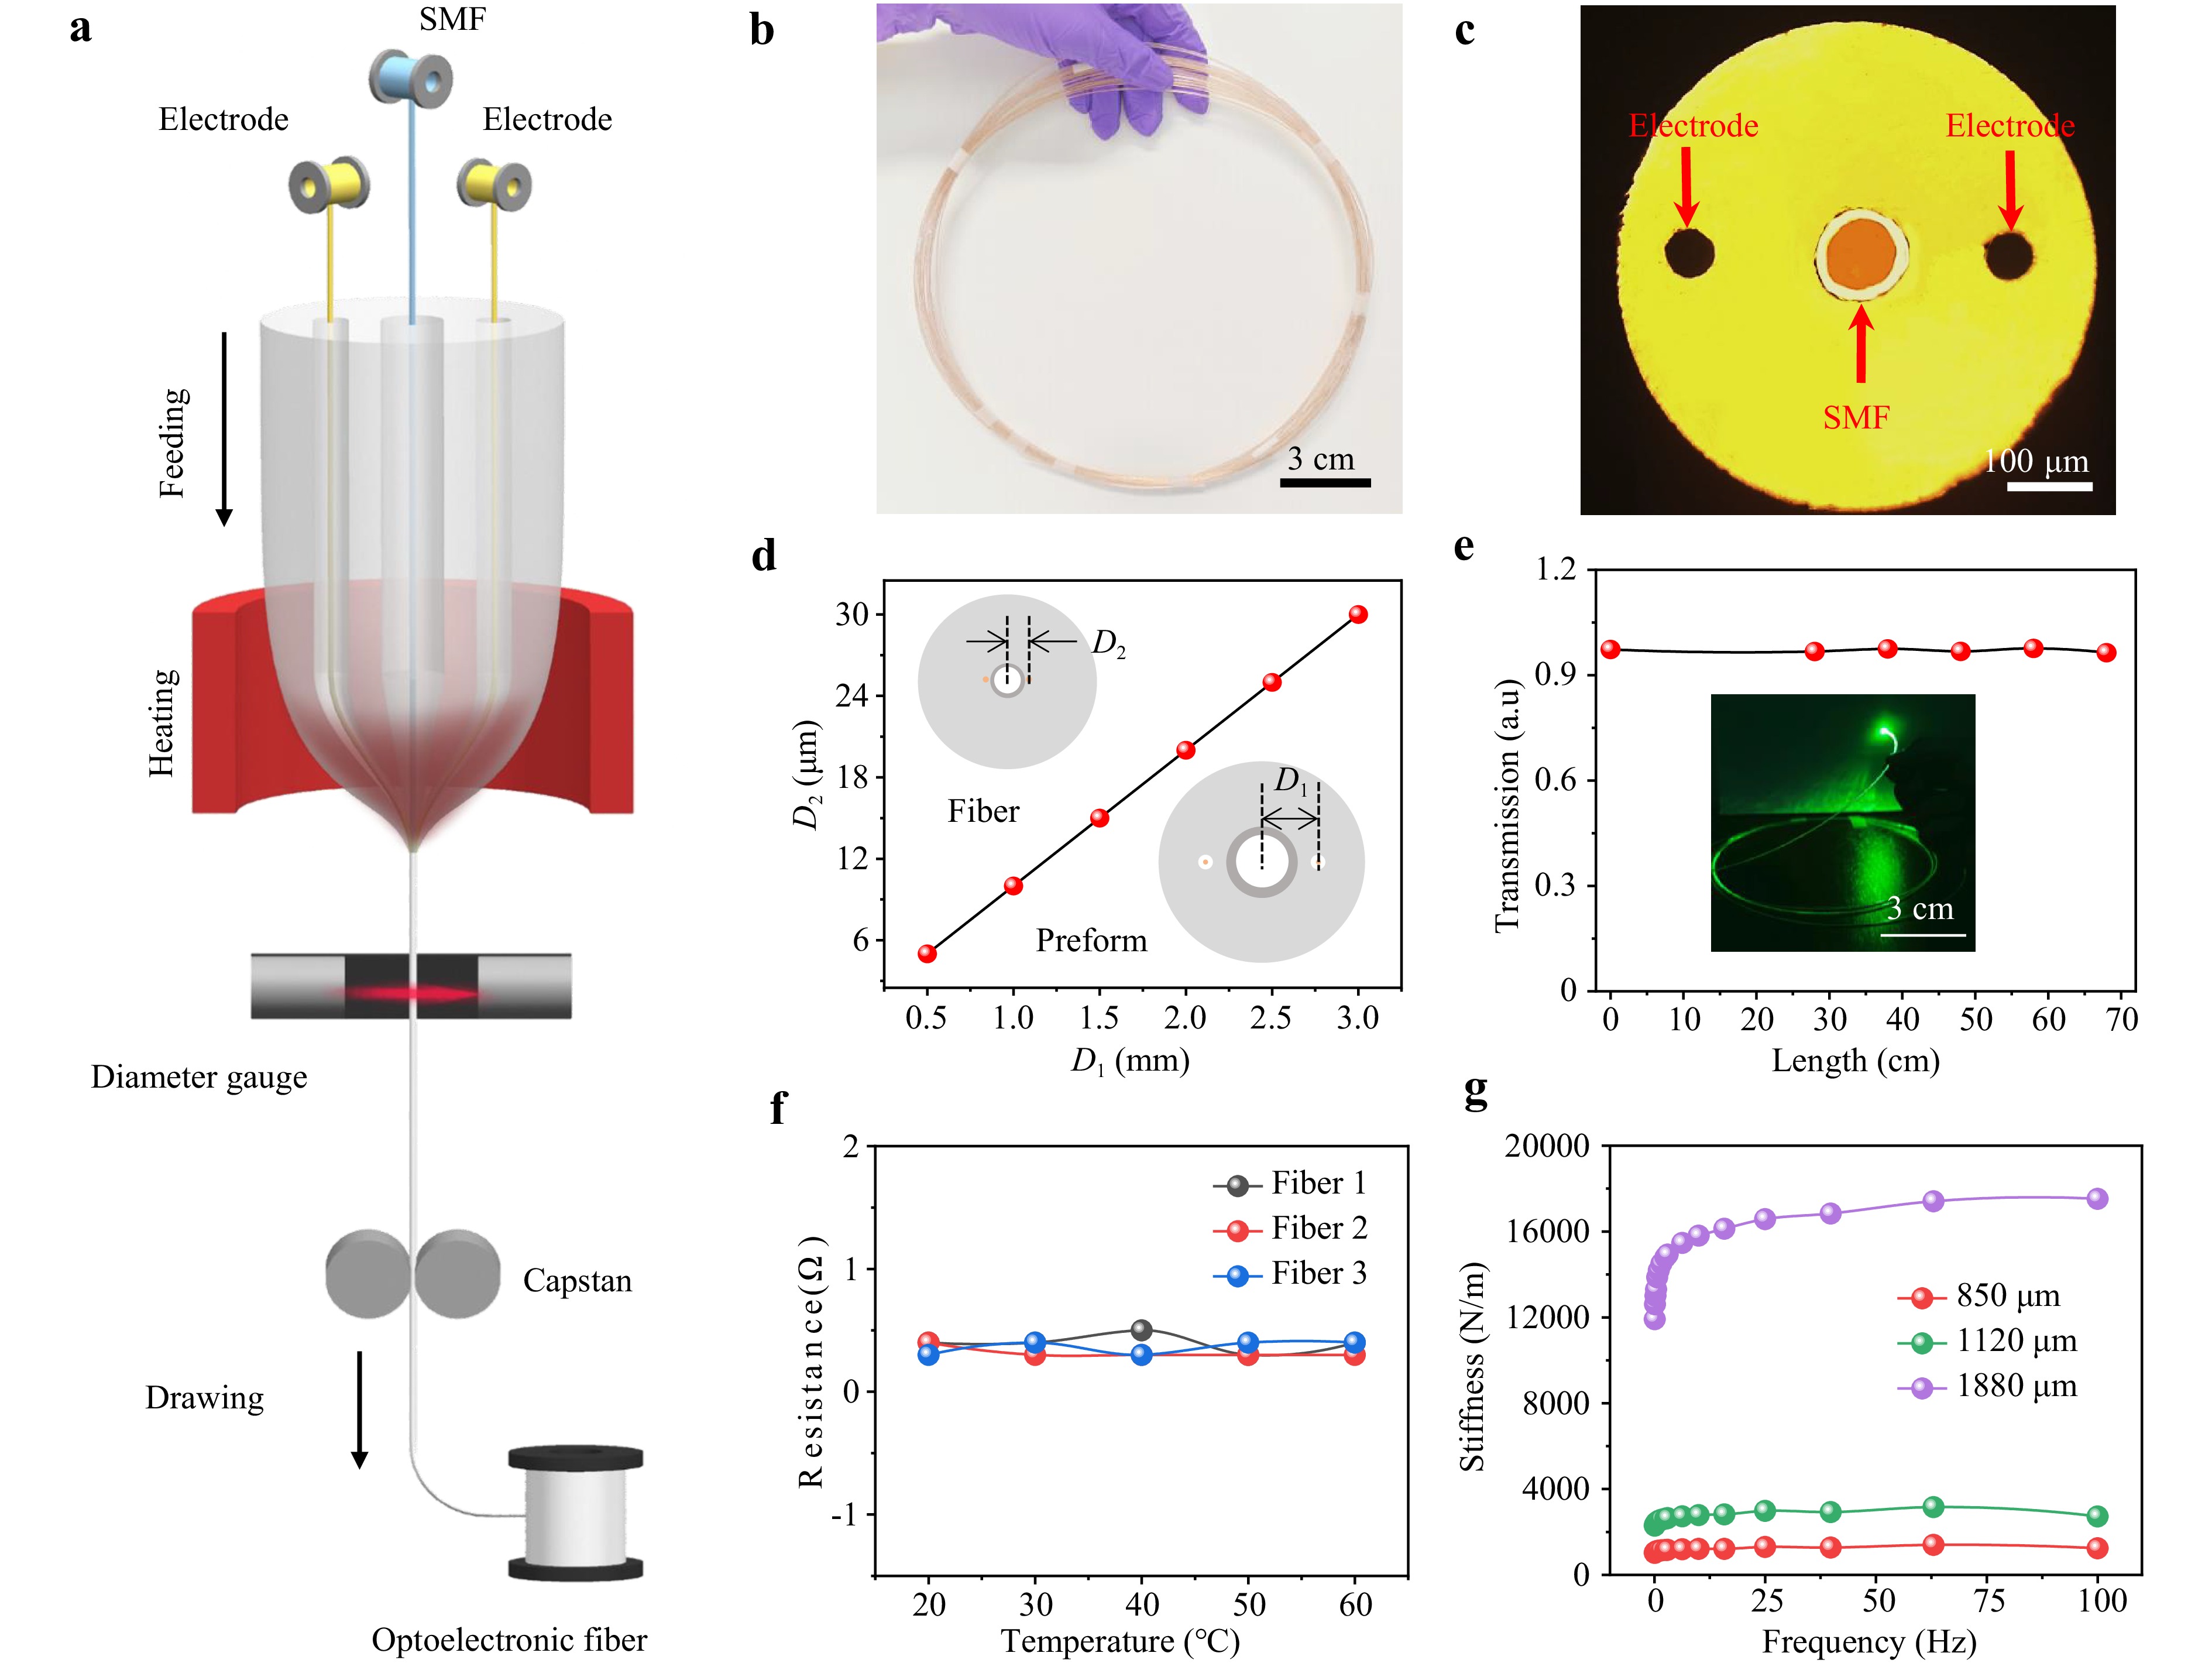
Fig. 2 Fabrication and characterization of multimaterial optoelectronic fiber. a Schematic of the thermal drawing process. b Photograph of the drawn optoelectronic fibers. c Optical image of cross-section of the drawn multimaterial optoelectronic fiber. d Linear dependence of the characteristic scale of the optoelectronic fiber on the pre-designed configuration after fixing the drawing parameters. e Transmission spectra of the optoelectronic fiber at different lengths at a wavelength of 1550 nm. The inset shows a photograph of fiber when it is excited by a 532 nm laser. f Correlation of electrical properties of optoelectronic fibers with temperature. Fiber 1, 2, 3 represents the fiber embedded with copper electrodes with diameters of 100, 200, 250 μm, respectively. g Mechanical stiffness of optoelectronic fiber as a function of frequency.
A unique advantage of this technique is the ability to precisely control the separation distance between the electrode and the central waveguide. As shown in Fig. 2d, the characteristic size of the fiber is gradually reduced in the neck-down region during the thermal drawing process. By fixing the feeding and drawing parameters, the separation distance D2 scales linearly with the initial distance D1. Additionally, the arrangement of the electrode and waveguide can be easily adjusted. The optoelectronic fiber exhibits excellent light transmission capabilities. As shown in Fig. 2e, the transmission spectra and corresponding images demonstrate high transmission (> 90%) at the wavelength of 1550 nm. The fibers retain light transmission performance comparable to commercial single-mode fiber, indicating that the thermal drawing process does not compromise their performance. Furthermore, the internal silica fiber can be seamlessly integrated with commercial fiber systems without mode-field mismatch concerns.
The fabricated optoelectronic fiber also demonstrates excellent electrical properties due to the pure copper filaments uniformly distributed along the fiber’s axial direction. The resistance of the fiber was measured using a multimeter, as shown in Fig. 2f. Owing to its metallic properties, the fiber's resistance shows minimal changes as the temperature increases from 20 °C to 60 °C, making it highly suitable for electrical signal collection and transmission. Additionally, the fabricated optoelectronic fibers are highly flexible. Its bending stiffness is evaluated over a frequency range of 0–100 Hz, as shown in Fig. 2g. The results reveal that stiffness of the fiber increases with the fiber diameter. The mechanical properties of the fiber can be further improved by optimizing the fiber diameter. The robust mechanical properties of the optoelectronic fiber make it an ideal candidate for next-generation flexible gas sensors capable of withstanding compressive or tensile stress.
-
In low-frequency PA gas sensors, flicker noise (1/f noise) dominates, and the resonant frequency f(100T) is approximately inversely proportional to the cavity length L. This conclusion assumes negligible optical transmission loss in the PA cell. Otherwise, the signal-to-noise ratio (SNR) degrades with increasing cavity length. Additionally, the cavity radius R has minimal impact on f(100T) compared to L, and the cell constant F is inversely proportional to R. A smaller R can improve SNR and increase viscous damping, so it is necessary to strike a balance between sensitivity and stability37,38. Fig. 3a illustrates a perspective view of the PA gas sensor, in which the T-PAC is integrated with the multimaterial optoelectronic fiber. The MEMS microphone is compactly embedded within the end structure of the T-PAC. The prepared optoelectronic fiber is soaked in a dichloromethane solution, which corrodes the PMMA material, and then soldering the exposed metal electrodes to the pins of the MEMS microphone. The electrode connection points are completely wrapped and sealed by the polymer matrix, isolating them from the external environment, thereby completely avoiding issues such as oxidation and electrolytic corrosion, resulting in excellent stability.
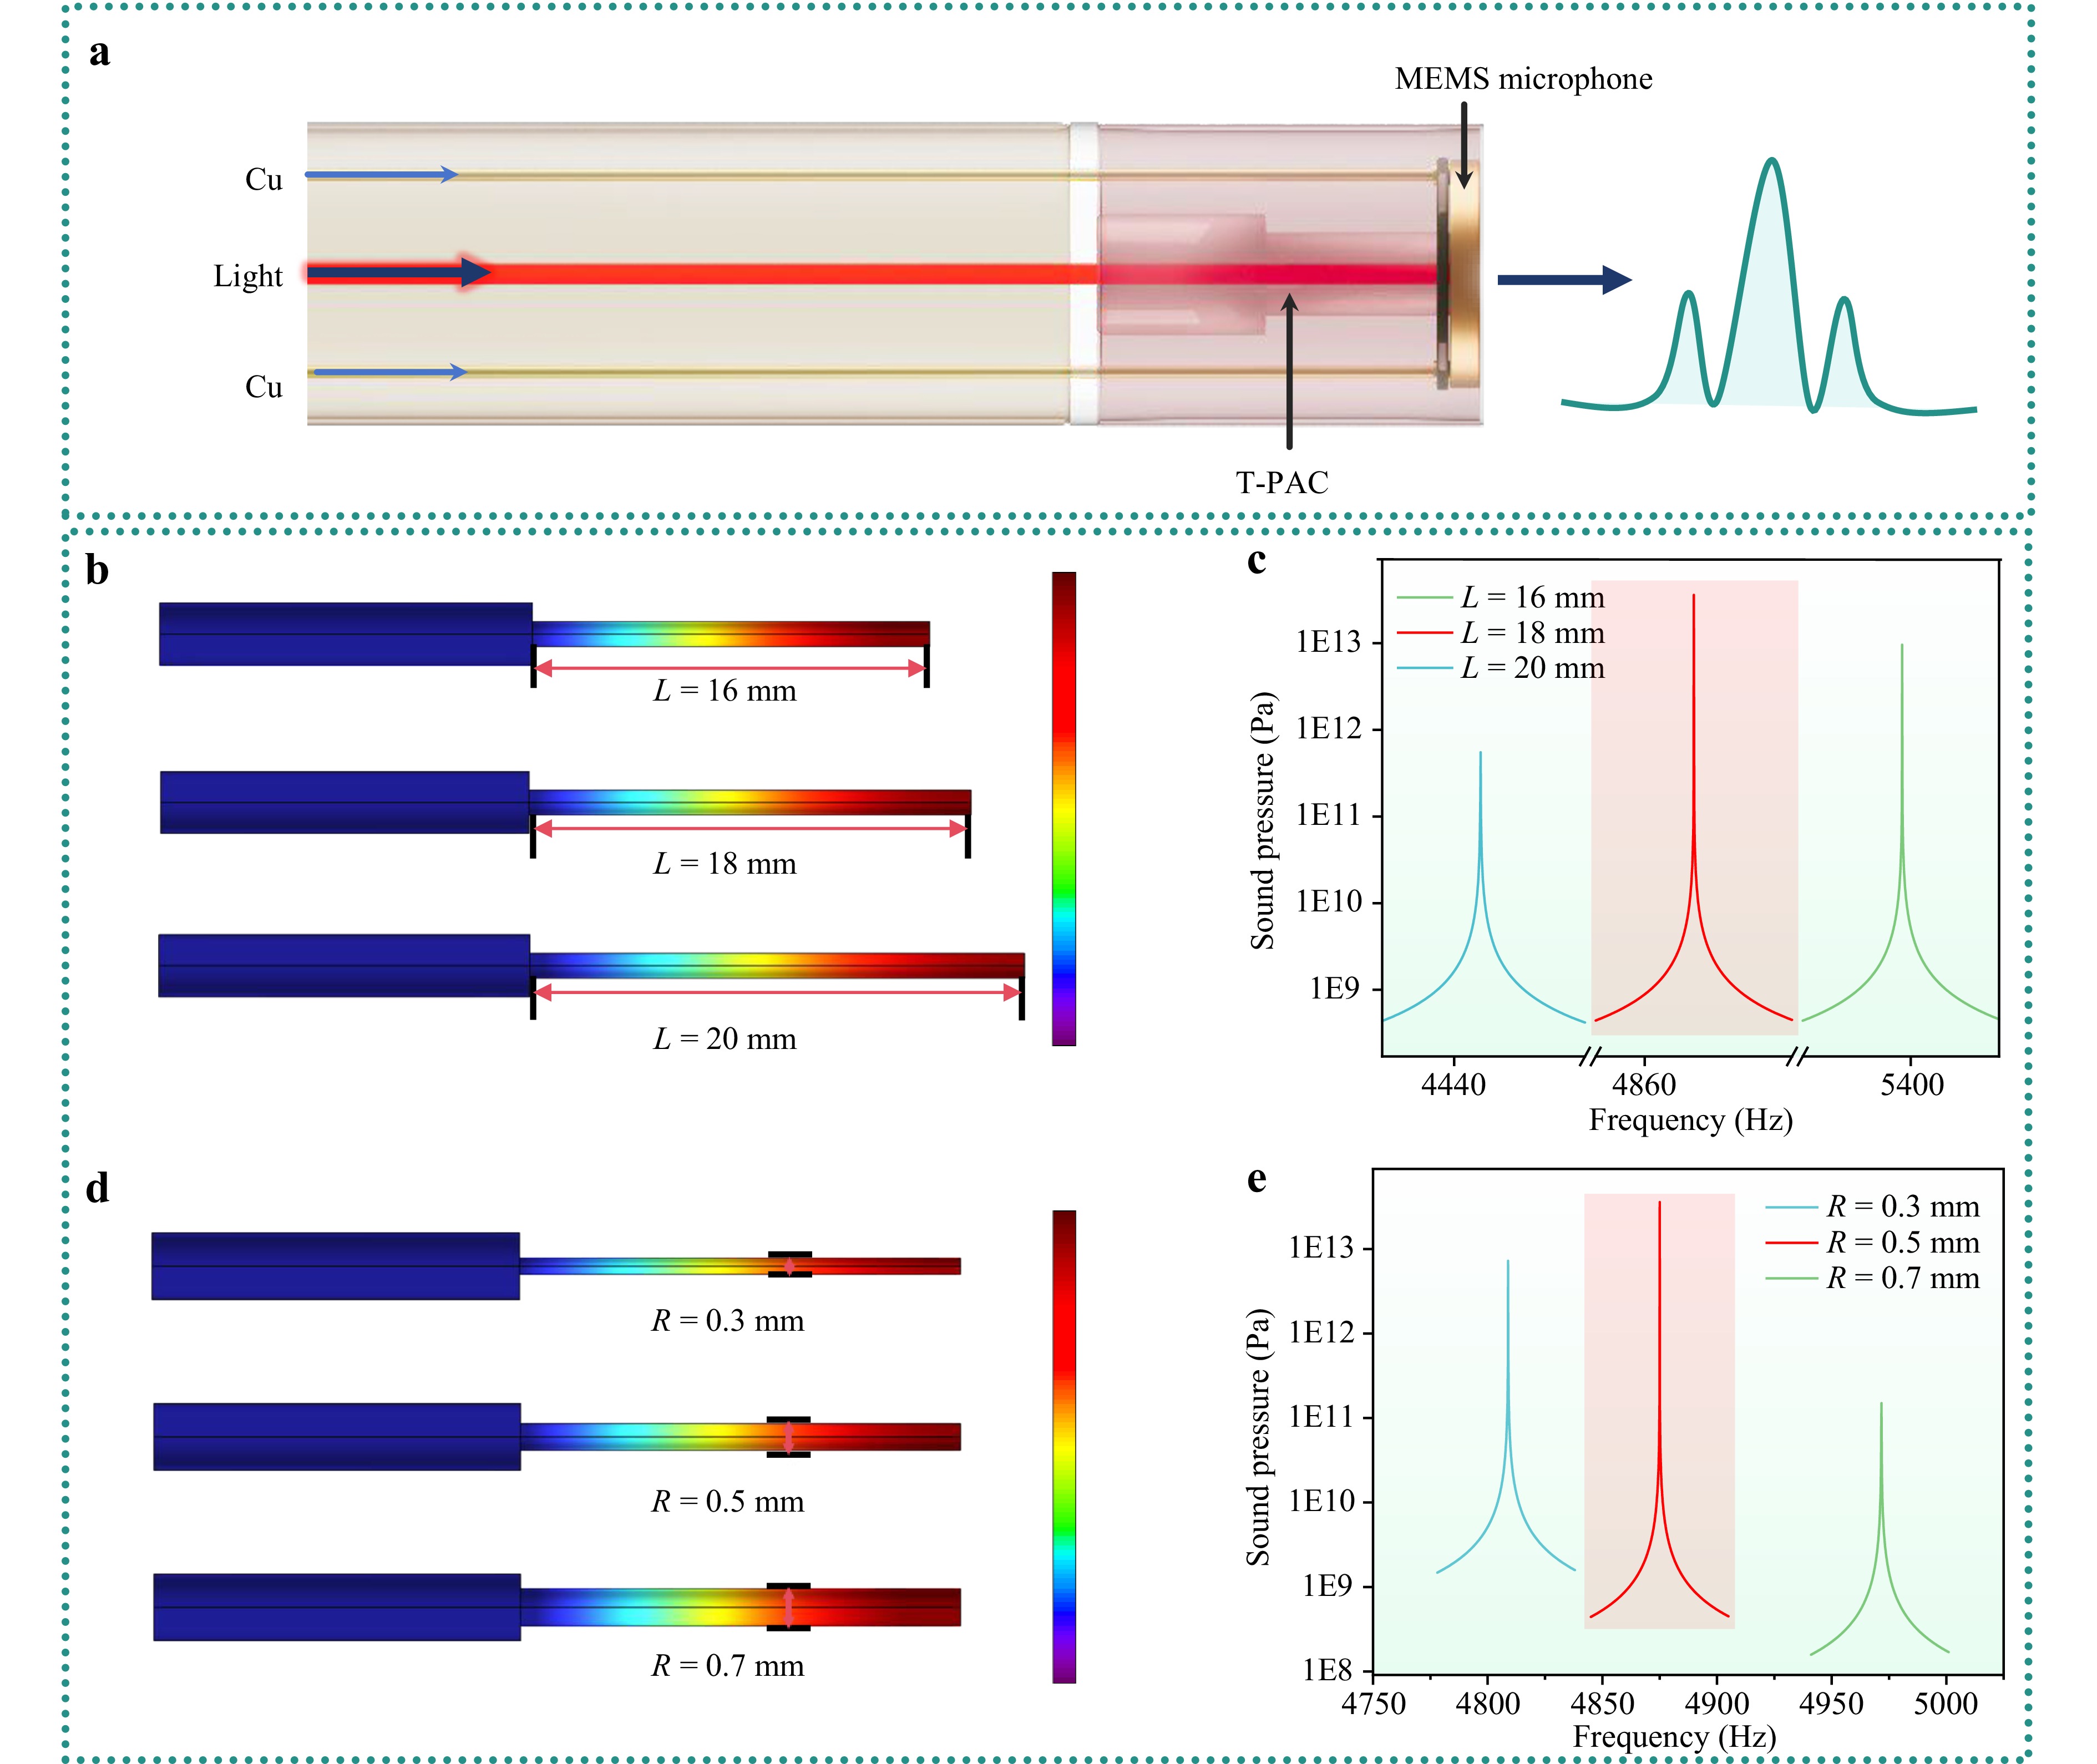
Fig. 3 a The structure diagram and sensing principle of the PA gas sensor. b The simulated sound pressure distribution of the resonant cavity at lengths of 16 mm, 18 mm and 20 mm. c The magnitudes of sound pressure and resonant frequency at different lengths. d The simulated sound pressure distribution of the resonant cavity at radii of 0.3 mm, 0.5 mm and 0.7 mm. e The magnitudes of sound pressure and resonant frequency at different radii.
To design high-integrated and miniaturized PA cell, the finite element method (FEM) simulations were employed to analyze the sound pressure magnitude of the buffer cavity and resonant cavity at varying radii and lengths by COMSOL software. In the simulations, the temperature was set to 300 K and the pressure was set to 1 atm. To ensure high integration with the multimaterial optoelectronic fiber, a ceramic insert with an inner diameter of 126 μm and an outer diameter of 1.25 mm was integrated onto the fiber end-face, therefore, the inner diameter of the buffer chamber is determined to be 1.25 mm. According to the theoretical derivation, the smaller the size, the greater the sound pressure, but reducing the radius also increases the noise level of the PA cell, so the radius should not be excessively small. In order to balance the sound pressure and noise, the length of the buffer chamber is set to 15 mm. Fig. 3b shows the sound pressure distribution of the resonant cavity at lengths of 16 mm, 18 mm and 20 mm. The wave belly and wave node are located at the two ends of the resonator, and the maximum sound intensity occurs at the top of the T-PAC. Therefore, the MEMS microphone should be mounted at the apex to capture the maximum PA signals. Fig. 3c shows the magnitudes of sound pressure and resonant frequency of the resonant cavity at different lengths. With the increase of length, the sound pressure first increases and then decreases, and the resonant frequency always decreases. Fig. 3d shows the sound pressure distribution of the resonant cavity at radii of 0.3 mm, 0.5 mm and 0.7 mm. Fig. 3e shows the magnitudes of sound pressure and resonant frequency of the resonant cavity at different radii. With the increase of radius, the sound pressure first increases and then decreases, and the resonant frequency keeps increasing. Considering the difficulty and precision of processing, the radius and the length of the resonant cavity were set to 0.5 mm and 18 mm, respectively, with a resonance frequency of 4875 Hz. It is worth mentioning that the total volume of the T-PAC is only 0.02 mL, significantly smaller than that of conventional PA cells.
-
The structural diagram of the experimental system is depicted in Fig. 4a. Fig. 4b presents the absorbance of 1 part per million (ppm) C2H2, 1000 ppm H2O and 500 ppm CO2 within the wavelength range of 1532 nm to 1533.5 nm. To mitigate the interference effects of H2O and CO2 in the air, an excitation light wavelength of 1532.8 nm was selected for C2H2 detection. To achieve the maximum resonance effect, it is essential to perfectly match the modulation frequency of the laser with the resonant frequency of the T-PAC. Therefore, the modulation frequency of the laser was optimized prior to gas experiments. A gas flow controller was used to introduce 5000 ppm C2H2 gas into the T-PAC. Fig. 4c displays the frequency response curve of the T-PAC within the range of 4200 Hz to 5600 Hz. It is evident that the PA signal amplitude reaches maximum when the resonant frequency of the T-PAC is 4920 Hz, corresponding to the modulation frequency of 2460 Hz for the laser. Therefore, the first resonant frequency of the T-PAC is determined to be 4920 Hz, which closely matches the simulated value of 4875 Hz. The discrepancies between the actual resonant frequency and simulated resonant frequency of T-PAC primarily stem from two factors: first, simulations rely on idealized geometric models, which do not account for material inconsistencies and manufacturing tolerances; second, real-world testing is susceptible to environmental factors like temperature, pressure, and humidity, which may introduce minor deviations. However, such subtle discrepancies are generally deemed acceptable in practical applications. To maximize the PA signal amplitude, the modulation depth of the laser was also optimized. Fig. 4d illustrates the relationship between the PA signal amplitude and the modulation depth. When the modulation depth is below 90 mV, the PA signal amplitude increases with the modulation depth. However, the PA signal amplitude no longer exhibits significant changes when modulation depth is beyond 90 mV. Therefore, the modulation depth of the laser was set to 90 mV.
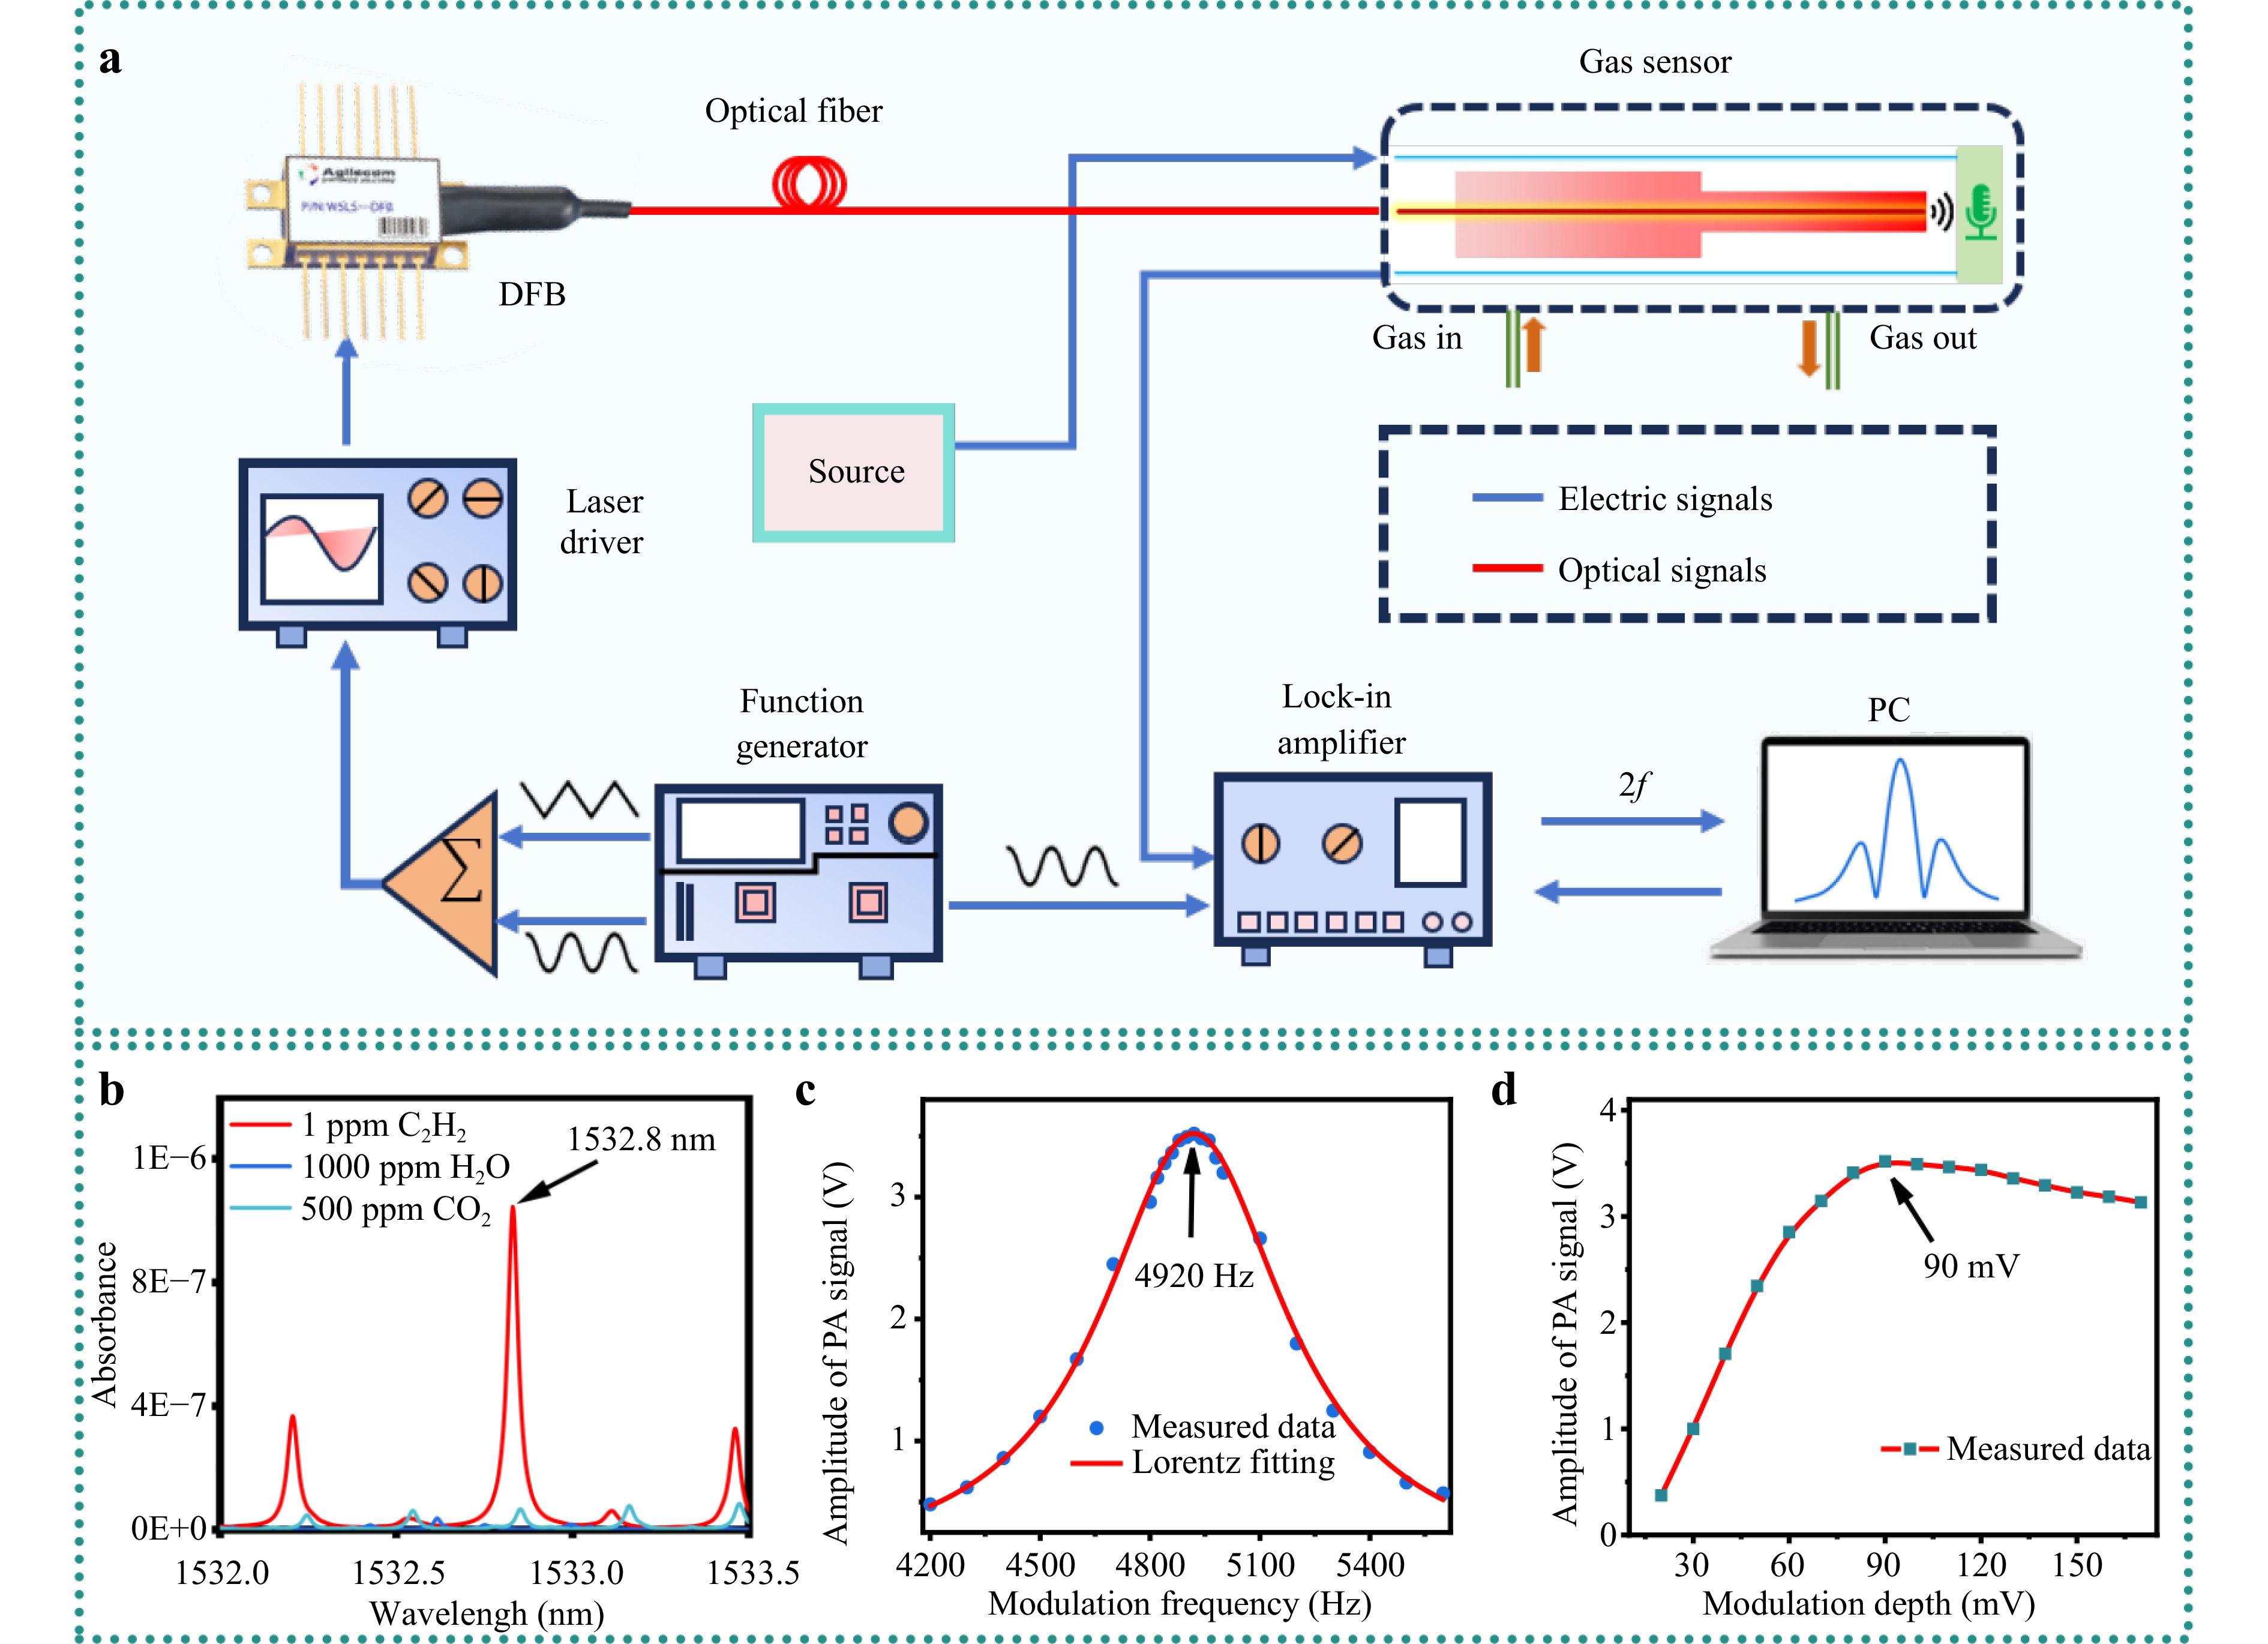
Fig. 4 a The structural diagram of the experimental system. b The absorbance of 1 ppm C2H2, 1000 ppm H2O and 500 ppm CO2 within the wavelength range of 1532 nm to 1533.5 nm. c The frequency response curve of the T-PAC within the range of 4200 Hz to 5600 Hz. d The relationship between the PA signal amplitude and the modulation depth.
The performance of the developed PA gas sensor through a series of experiments was evaluated. The PA signal amplitudes of the non- resonant PA cell and the T-PAC at a concentration of 2% C2H2 gas were compared under the same dimensions. As shown in Fig. 5a, the 2f signal amplitudes of the non-resonant PA cell and T-PAC are 4.13 V and 13.44 V, respectively. Compared with the non-resonant cavity, the PA signal amplitude and the SNR of the T-PAC are improved by a factor of ~3.3 and ~7.0, respectively. As shown in Fig. 5b, the repeatability of the sensor was evaluated by performing six response recovery cycles at a concentration of 0.3% C2H2 gas, and the result shows that the response remained almost constant after six cycles. As shown in Fig. 5c, the response time of the sensor was tested at a concentration of 0.3% C2H2 gas, and the results show that the rise time T10%-90% is 2.4 s and the fall time T90%-10% is 3.3 s, the PA cell structure can be optimized to shorten the diffusion path and accelerate the gas renewal process to further reduce the response time in the future. In order to evaluate the response characteristics of the developed gas sensor to C2H2 gas, C2H2 gas with concentrations of 0.3%, 0.5%, 1%, 1.5%, and 2% was prepared through the MFC, and then passed into the T-PAC at a flow rate of 100 sccm. Fig. 5d shows the PA signal amplitudes at different C2H2 gas concentrations, and the PA signal amplitudes are relatively flat at the same concentration, which indicates a good stability of the sensor. Fig. 5e shows the waveforms of the extracted 2f signals at different C2H2 gas concentrations. In order to evaluate the relationship between the PA signal and gas concentration, a linear fit was used to show the trend of the responsivity. As shown in Fig. 5f, there is a linear relationship between the PA signal amplitudes and the C2H2 gas concentrations, with a responsivity of 0.667 mV·ppm-1. The R-squared value is estimated to be 0.999, which exhibits a very good linearity. Humidity is a key factor affecting the performance of the sensor. To evaluate the effect of humidity, the gas sensor was exposed to 0.3% C2H2 at room temperature, with relative humidity (RH) levels varying from dry to 80%, which is a typical range for non-rainy conditions. The uniform and stable relative humidity in the chamber is controlled by
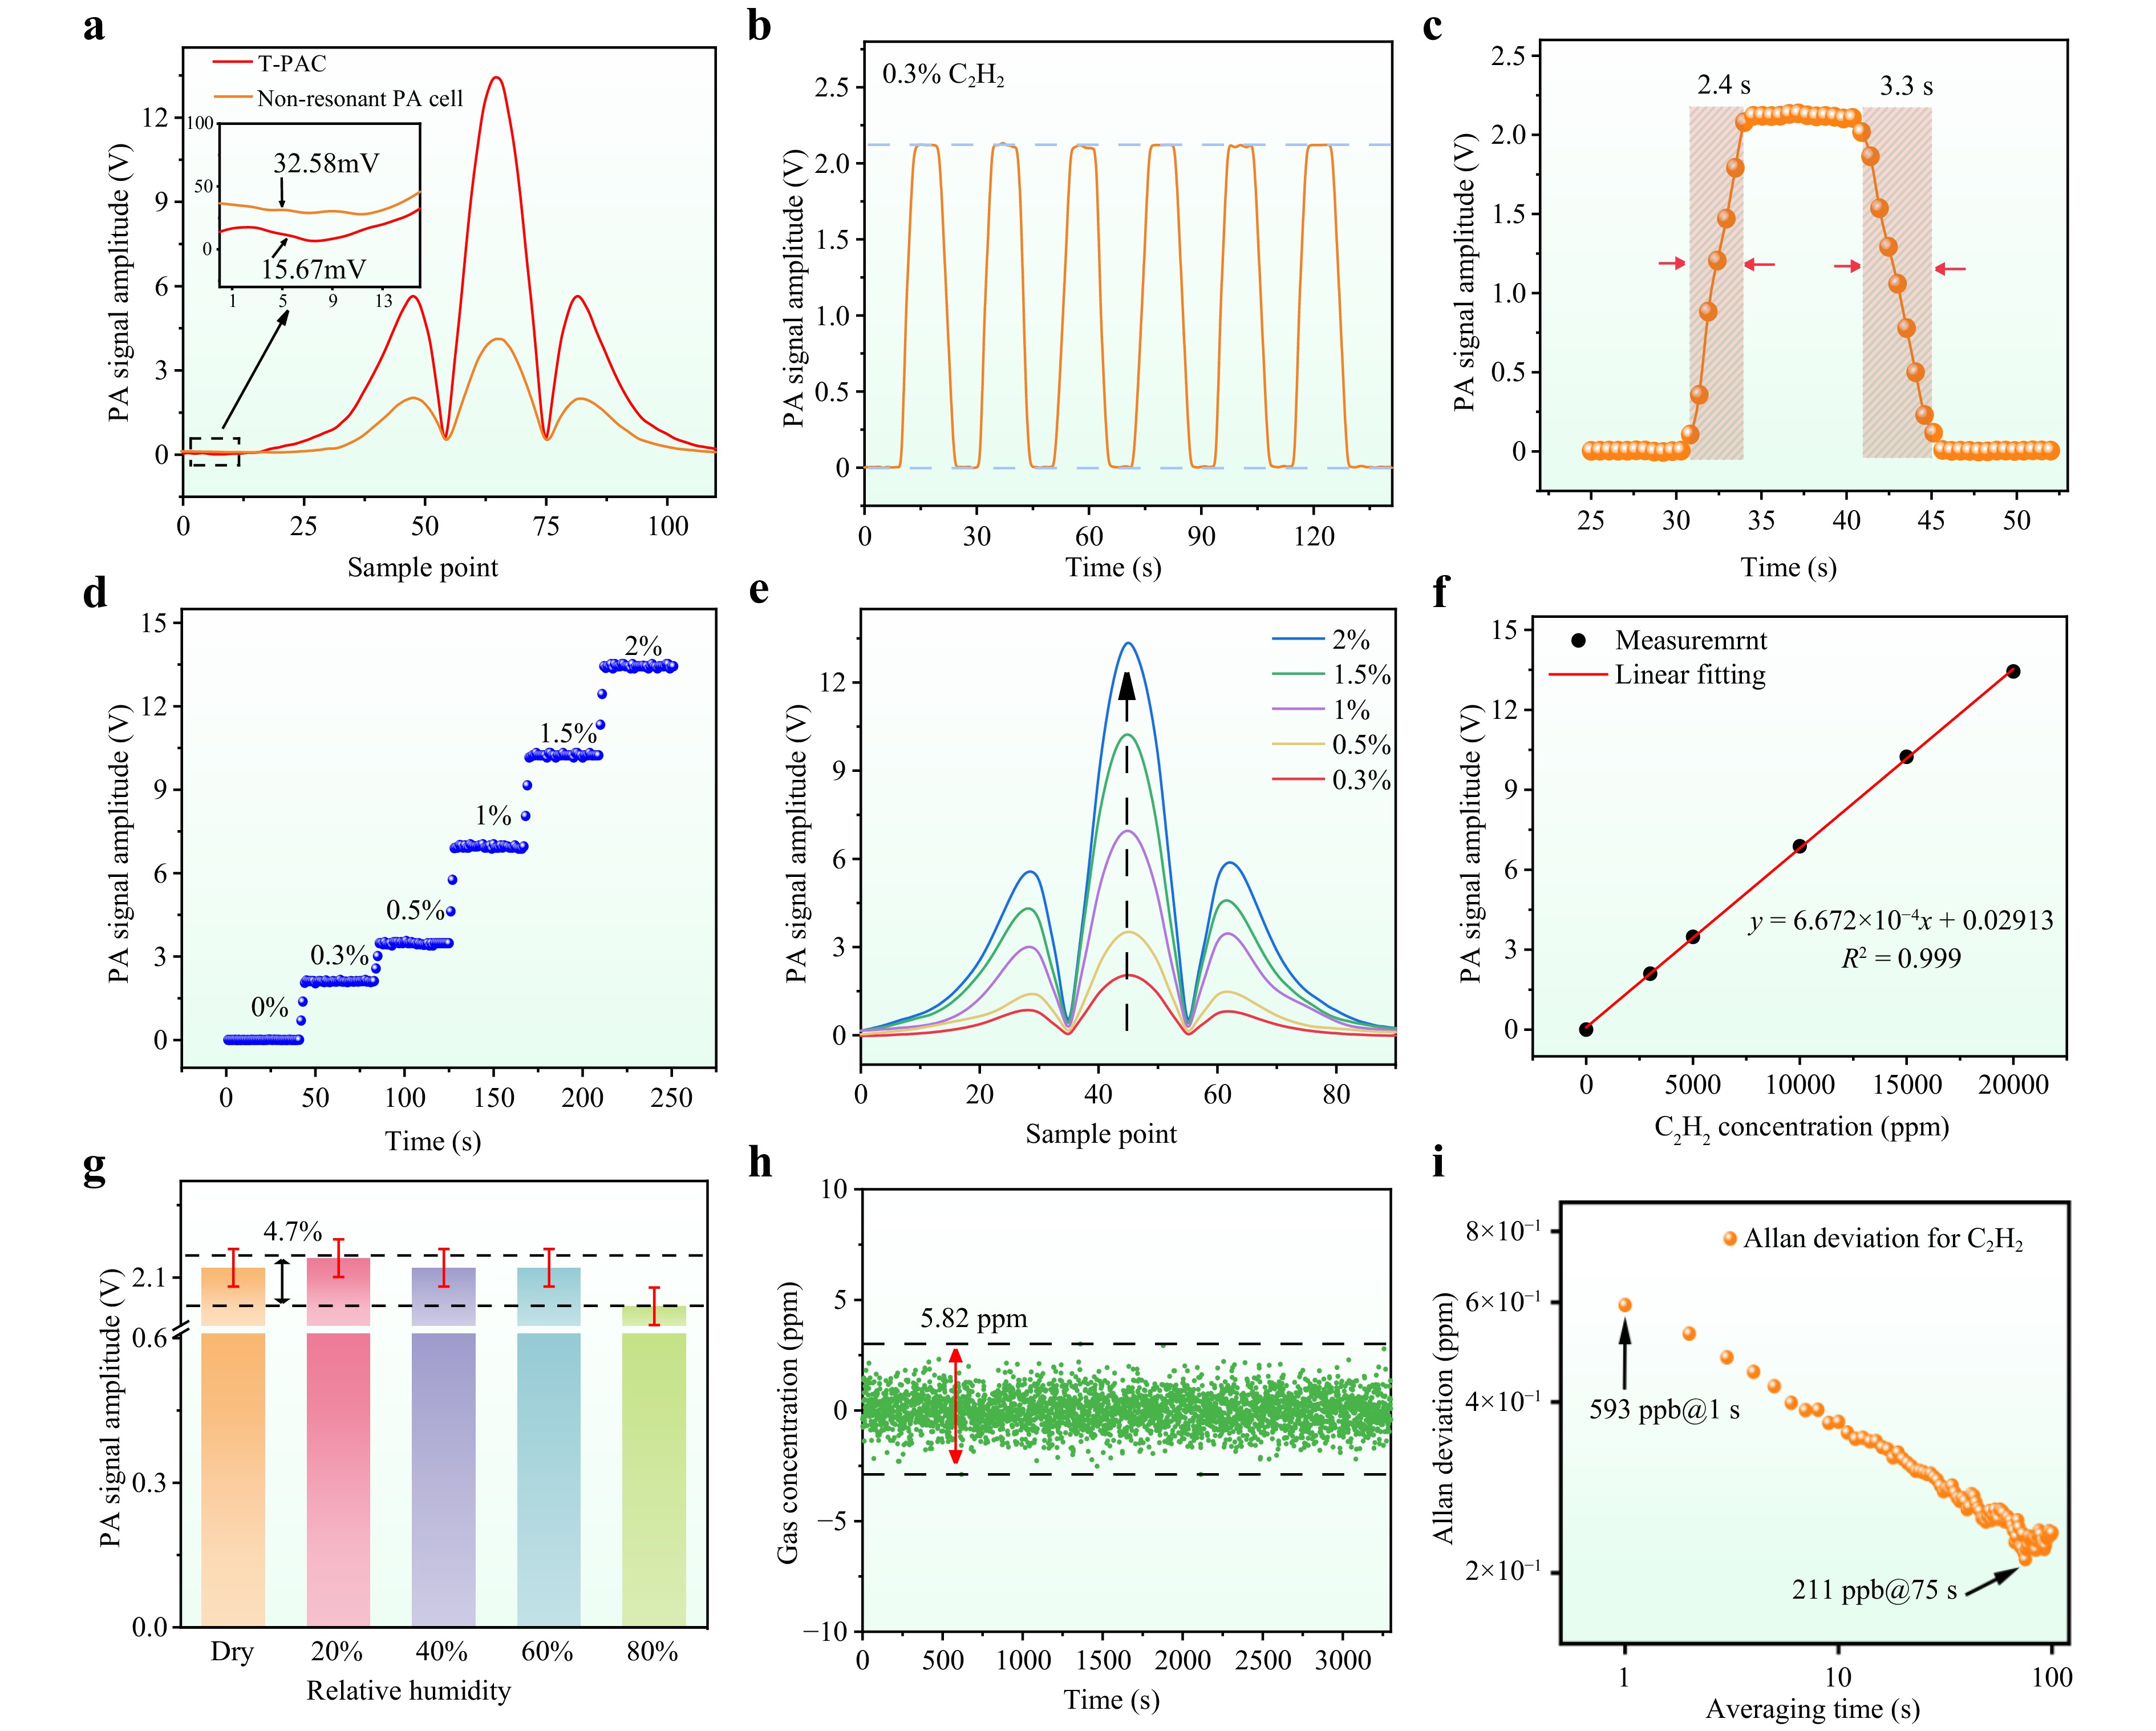
Fig. 5 a The 2f signal comparison of T-PAC and non-resonant PA cell at a concentration of 2% C2H2 gas. b Repeatability and response characteristics of the gas sensor at a concentration of 0.3% C2H2 gas. c Response time testing results of the gas sensor. d The PA signal amplitudes at different C2H2 gas concentrations. e The waveforms of the 2f signals at different C2H2 gas concentrations. f The linear relationship between the PA signal amplitudes and the C2H2 gas concentrations. g The PA signal amplitudes of 0.3% C2H2 gas at different humidity levels. h Long-time stability testing of the gas sensor. i The variation curve of Allan-Werle deviation versus average time.
Humidity generator (TAIAN HART, HT0211, China) and calibrated by commercial humidity sensor (TASTEK, TAS-WS-R0C000, China). Fig. 5g shows the measured PA signal amplitudes at different humidity levels, and it can be seen that changes in humidity have little impact on the performance of the gas sensor. The maximum difference is within 4.17%. The stability and detection limit of the developed gas sensor were evaluated at normal temperature and pressure. The long-term stability of the gas sensor was evaluated by introducing pure nitrogen into the T-PAC. As shown in Fig. 5h, the measured gas concentration fluctuates from −2.88 ppm to 2.94 ppm. The detection limit of the gas sensor can be evaluated by Allan-Werle deviation analysis. As shown in Fig. 5i, the detection limit of C2H2 gradually decreases with increasing averaging time. When the averaging time is 1 s, the detection limit is 593 ppb. As the averaging time increases, the detection limit can be reduced, and the detection limit is estimated to be 211 ppb for an optimum averaging time of 75 s.
Both the normalized noise equivalent absorption (NNEA) coefficient and the OPVR are key parameters for evaluating the performance of PA gas sensor, which can be expressed by Eq. 6 and Eq. 739,40, respectively, namely
$$ NNEA=\frac{{D}_{\text{L}}a(v)P}{\sqrt{ENBW}} $$ (6) $$ OPVR=\frac{L}{V} $$ (7) where DL is the detection limit, a(v) is the absorption coefficient, P is the output power of the light source, ENBW is the equivalent noise bandwidth, L and V represent the optical path length and the volume of the PA cell, respectively. In this work, the output power P is about 14 mW, the absorption coefficient a(v) is 0.57 cm−1 at 1532.8 nm based on the HITRAN database, the ENBW is 0.25 Hz for 1 s integration time. Therefore, the NNEA coefficient was calculated as 9.46 × 10⁻⁹ cm−1·W·Hz−1/2. In addition, the OPVR can be calculated to be 1736.8 mm·mL−1. OPVR represents the effective optical pathlength per unit volume of the detection cavity in a PA sensor. Its physical meaning is a core parameter for measuring the interaction opportunity between light and gas molecules per unit volume. A higher value indicates that under the same cavity volume, the interaction path between light and gas is longer, alternatively, under the same optical pathlength, the required cavity volume is smaller.
To evaluate the performance and innovation of this sensor, Table 1 presents the performance of other PA sensors in recent years. The NNEA value of the proposed PA sensor demonstrates moderate performance compared to others, primarily due to the trade-off between integration level and sensitivity. The further improvement of the NNEA value can be achieved by increasing the optical path length. It is worth mentioning that the proposed T-PAC has a very small volume of only 0.02 mL, the OPVR of the sensor is 1736.8 mm·mL−1, which is higher than that of other types of sensors, indicating that the proposed sensor can achieve a longer optical path in a unit volume and maintain high performance in a compact volume. In addition, the proposed sensor has shorter response time and higher integration compared to other sensors, making it more suitable for practical applications.
Ref. Pump power (mW) NNEA (cm−1·W·Hz−1/2) OPVR (mm·mL−1) Response time (s) Volume (mL) Optoelectronic integration 30 15.6 5.70 × 10⁻⁹ 26.9 − 3 No 41 1000 1.84 × 10⁻⁸ 3.9 − 204 No 42 13 2.27 × 10⁻⁹ 0.5 − 102 No 43 800 8.18 × 10⁻⁸ 3.2 − 52 No 44 14.7 1.10 × 10⁻⁸ 303.5 − 0.85 No 45 20 2.49 × 10⁻⁸ 141.7 ~63 0.13 No This work 14 9.46 × 10⁻⁹ 1736.8 ~3 0.02 Yes Table 1. Performance comparisons between the proposed photoacoustic sensor and the others.
-
In conclusion, this paper developed a miniaturized PA gas sensor based on the multimaterial optoelectronic fiber. The optoelectronic fibers were fabricated by a scalable thermal drawing technique. The T-PAC was designed and integrated on the tip of the fiber to realize simultaneous transmission of light signals and electrical signals, which avoids the disadvantages of traditional PA gas sensors such as bulky size and non-integration. Meanwhile, the size of the T-PAC was optimized by balancing the volume and sensitivity of the sensor. C2H2 gas was selected as the target gas to evaluate the performance of the proposed sensor. Compared to the PA gas sensor with non-resonant PA cell at the same size, the SNR of the proposed PA gas sensor with T-PAC was improved by a factor of 7.0. The sensor shows a high sensitivity with a response rate of 0.667 mV/ppm when the lock-in integration time is 1 s. The Allan-Werle deviation analysis results show that the sensor has a detection limit of 593 ppb for an average of 1 s, and the detection limit is reduced to 211 ppb at an averaging time of 75 s. The total volume of the sensor is only 0.02 mL, which is much smaller than that of the traditional PA gas sensors. Therefore, the sensor can adapt to narrower environments. At the same time, by changing the laser, it can be extended to a variety of gas detection. The experimental results demonstrate the excellent performance of the developed gas sensor, which has great potential for applications in industrial safety, environmental monitoring and healthcare.
-
The multimaterial optoelectronic fibers were fabricated using a glass fiber and two copper electrodes as the core components, with PMMA as the cladding. A PMMA rod (30 mm diameter, 12 cm length) was prepared with one central hole (8 mm diameter, 12 cm length) and two side holes (3 mm diameter), positioned symmetrically 5 mm from the central axis.
The preform was thermally drawn using a three-zone furnace at 160 ± 5°C (top), 250 ± 10 °C (middle), and 120 ± 5 °C (bottom). The feeding and drawing speed were 1 ± 0.1 mm/min and 2 ± 0.1 m/min, respectively. During the drawing process, two copper electrodes wires (with diameters of 50 μm) and one glass fiber (with a diameter of 125 μm) were continuously inserted into the respective holes. The fiber diameter was monitored in real time by a laser rangefinder.
-
A distributed feedback (DFB) diode laser was used as the light source, and its temperature and current were controlled using a laser driver (Thorlabs, CLD1015, USA). A signal generator (Gwinstek, MFG-2260M, Taiwan) produced a combined signal consisting of a periodic triangular scanning wave signal and a periodic sinusoidal wave modulation signal to drive the laser by the laser driver. The frequency of the sinusoidal wave signal was set to half the resonant frequency of the T-PAC. The modulated pump light from the DFB laser was directed through a multimaterial optoelectronic fiber into the T-PAC, where it interacted with the target gas to generate a periodic PA signal. The PA signal was detected by a miniature MEMS microphone, then converted into an electrical signal, and finally transmitted via a copper wire to a lock-in amplifier (Stanford Research Systems, SR860, USA), the lock-in amplifier has an integrated preamplifier and bandpass filter inside, which can effectively extract weak signals while suppressing noise and interference. The lock-in amplifier extracted the 2f signals, which is proportional to the gas concentrations. To prepare the desired target concentrations of C2H2 gas, standard concentrations of C2H2 and nitrogen gas were mixed using a mass flow control (MFC).
-
This work was supported by the National Natural Science Foundation of China (No. 62035006, 62405111), the Program of Marine Economy Development Special Fund (six marine industries) under Department of Natural Resources of Guangdong Province (No. GDNRC [2024]16), the Guangdong Basic and Applied Basic Research Foundation (No. 2025A1515010112, 2023A1515110071), the National Key Research and Development Program of China (No. 2024YFE0209200), the Guangzhou Science and Technology Project (No. 2025A04J2279), the Fundamental Research Funds for the Central Universities (No. 21624346).
Microcavity-enhanced optoelectronic fiber photoacoustic spectroscopy for ppb-level trace gas sensing
- Light: Advanced Manufacturing 7, Article number: 28 (2026)
- Received: 03 August 2025
- Revised: 16 January 2026
- Accepted: 25 January 2026 Published online: 10 February 2026
doi: https://doi.org/10.37188/lam.2026.028
Abstract: Photoacoustic spectroscopy is a highly sensitive analytical technique for trace chemical detection in gaseous and liquid phases. Conventional systems relying on free-space optics face limitations in light-matter interaction efficiency and electronic integration. To address this, we developed a miniaturized, ultrasensitive photoacoustic spectroscopy gas sensor by integrating a thermally drawn multi-material optoelectronic fiber, a T-type resonant photoacoustic cell, and a MEMS microphone at the fiber tip. This system enables amplified light-gas interactions and simultaneous electrical signal acquisition, achieving ppb-level detection within seconds using sub-microliter sample volumes (0.02 mL). By leveraging mass-producible optoelectronic fibers and MEMS technology, this work establishes a new class of optical sensors featuring compact size, ultrahigh sensitivity, environmental robustness, and scalable multiplexed detection capabilities for harsh environments.
Research Summary
Optoelectronic fibers: Integrated optical excitation & electrical detection for gas sensing
Photoacoustic spectroscopy is a highly sensitive analytical technique for trace chemical detection in gaseous and liquid phases. Conventional systems relying on free-space optics face limitations in light-matter interaction efficiency and electronic integration. By leveraging mass-producible optoelectronic fibers and MEMS technology, Tuan Guo from China’s Jinan University and collaborative team now report development of photoacoustic gas sensor featuring compact size, ultrahigh sensitivity, environmental robustness, and scalable multiplexed detection capabilities for harsh environments. The photoacoustic gas sensor by integrating a thermally drawn multi-material optoelectronic fiber, a T-type resonant photoacoustic cell, and a MEMS microphone at the fiber tip. This system enables amplified light-gas interactions and simultaneous electrical signal acquisition, achieving ppb-level detection within seconds using sub-microliter sample volumes.
Rights and permissions
Open Access This article is licensed under a Creative Commons Attribution 4.0 International License, which permits use, sharing, adaptation, distribution and reproduction in any medium or format, as long as you give appropriate credit to the original author(s) and the source, provide a link to the Creative Commons license, and indicate if changes were made. The images or other third party material in this article are included in the article′s Creative Commons license, unless indicated otherwise in a credit line to the material. If material is not included in the article′s Creative Commons license and your intended use is not permitted by statutory regulation or exceeds the permitted use, you will need to obtain permission directly from the copyright holder. To view a copy of this license, visit http://creativecommons.org/licenses/by/4.0/.

 DownLoad: