


-
Broadband nonlinear light sources with specific spectral properties are essential for many applications such as metrology1,2, optical coherence tomography3, and spectroscopy4. Within the context of nonlinear frequency conversion, one successful approach is the soliton-based supercontinuum generation (SCG), which relies on the fission of higher-order solitons and the associated emission of dispersive waves (DWs)5. Because of the long light/matter interaction lengths and strong mode confinement, this SCG scheme is highly effective in waveguides, particularly in optical fibres. It relies heavily on the dispersive properties of the underlying waveguide, suggesting a pathway for tailoring the light generation process through waveguide engineering.
One essential challenge in current supercontinuum (SC) research is the design of ultrafast soliton-based sources with a flat output spectrum, that is, with a flat power spectral density across defined spectral intervals. Spectral flatness is required, for example, to provide high quality point spread functions in optical coherence tomography6 and for handheld spectroscopic devices that cannot provide high dynamic ranges compared to modern heavy laboratory equipment7. Using long pulse lengths or high pulse energies is an alternative method to obtain flat broadband spectra through modulation instability8,9. However, this is directly associated with the pulse-to-pulse fluctuations of the output spectrum and the associated loss of coherence10. Here, one promising pathway to spectrally homogenise the output at low input energy without using modulation instability relies on longitudinally modulating the dispersion of the waveguide by geometrically changing the waveguide cross section along its axis, leading to effects such as multiple DW emission11. Both cascaded step-wise, discreetly changing the dispersion profiles via spliced fibre sections12,13; furthermore, continuously (smoothly) varying dispersion landscapes have been realised in systems such as tapered photonic crystal fibres, tapered multimode fibres, and planar waveguides with varying width14–18. Reconfigurable dispersion tailoring concepts exploit temperature gradients along a liquid core fibre19,20 and plasma density gradients along gas-filled hollow-core photonic crystal fibres21,22.
As shown in a recent work23, one novel pathway to modulate waveguide dispersion in a desired manner relies on the introduction of optical resonances into the waveguide system through nanoscale photonic elements. These resonances interact with the optical mode at specific wavelengths, leading to modal anti-crossings that substantially change the dispersion and consequently, the nonlinear frequency conversion process24. In recent proof-of-concept experiments, we successfully demonstrated this concept (named resonance-enhanced SCG) on an example of nanofilms of constant thickness located on the core sections of exposed core fibres (ECFs). This allows for the tailoring of the properties of the output light, that is, the DW emitted by adjusting the nanofilm thickness. In this work, we explore this concept in the context of spectrally homogenising the SC output by introducing high refractive index (RI) nanofilms with gradually changing thicknesses deposited directly on a fibre core, substantially modulating and, particularly, flattening the spectral output through longitudinally varying resonances. The nanofilms were realised by tilted deposition, representing a nanofabrication technology that is compatible with waveguides with exposed cores and following the laws of a detailed 3D deposition model. Because modal dispersion is correlated with the local nanofilm thickness, this scheme enables precise longitudinal dispersion engineering by designing a specific layer thickness profile along the fibre. With the possibility of local dispersion management, the soliton dynamics are substantially modulated during pulse propagation, drastically improving the bandwidth and uniformity of the resulting SC spectrum. Here, we describe an SCG scheme that yields flat broadband output spectra without using soliton fission, thus demanding only a small pump power in contrast with commonly used approaches involving large excitation powers, that is, high soliton numbers15,25,26. Other low-power SCG designs that yield high coherence include SPM-based broadening in near-zero-flattened normal dispersion fibres27–29 and using highly nonlinear media such as inorganic solvents in liquid core fibres30 or high RI chalcogenides/semiconductors in combination with strong mode confinement in nano-waveguides31.
-
The impact of longitudinally varying resonances on waveguide dispersion was demonstrated in this work by gradually varying the dielectric nanofilms deposited on the cores of microstructured ECFs32 (Fig. 1a). This fibre geometry is particularly suited for the study presented as it consists of a core, which is formed by three air holes surrounding a suspended triangular core made of pure silica. Because one hole is open to the environment (inset of Fig. 1a), the core is side-wise accessible, allowing for the deposition of gradient thickness nanofilms23,33,34 aiming to tailor nonlinear pulse propagation such as flattening the spectrum and extending the bandwidth (Fig. 1b). If high-RI nanofilms are placed on low-index substrates (as here on the fibre core), resonances in the form of guided optical modes dominantly confined to the nanofilm are added to the system. The additional layer mode interacts with the fundamental fibre core mode, imposing an avoided crossing of their phase indices- a modal anti-crossing at a specific wavelength that depends on the nanofilm thickness t. This anti-crossing strongly bends the spectral evolution of the phase index (Fig. 2a), impacting dispersion, particularly, group velocity dispersion (GVD). As an example, the central cross-section profiles of the two involved modes at λ = 1120 nm for a nanofilm thickness of t = 100 nm are shown in Fig. 2b. The mode profiles and their dispersion were calculated using Finite-Element modelling, including the concrete fibre cross-section (details in the method section). The fundamental mode of the waveguide without the nanofilm shows two zero dispersion wavelengths (ZDWs, λZD); the short-wavelength one strongly red-shifts in contrast to its long-wavelength counterpart in the case where nanofilms are added and increased in thickness. It should be noted that this is a fundamentally different behaviour compared to the size, temperature, and material tuning schemes, where, primarily, the second ZDW is shifted19,35. Efficient conversion to the phase-matched DW principally demands a high β3 to β2 ratio36. Small β2 values are ensured by the close proximity of the pump wavelength (λp) and λZD; therefore, the simulations presented suggest that DW generation (at wavelength λDW) can be achieved by red-shifting the first ZDW closer to λp by adjusting the nanofilm thickness (dλZD/dt = 17.5 nm nm−1, red line in Fig. 2c). It is worth noting that for our ECF (SEM in the Supplementary Information, Fig. S1a) without nanofilm, the core (diameter 1.75 μm) is too small to enable DW formation when pumped at λp = 1570 nm, because the first ZDW at 780 nm is spectrally too far from the pump.
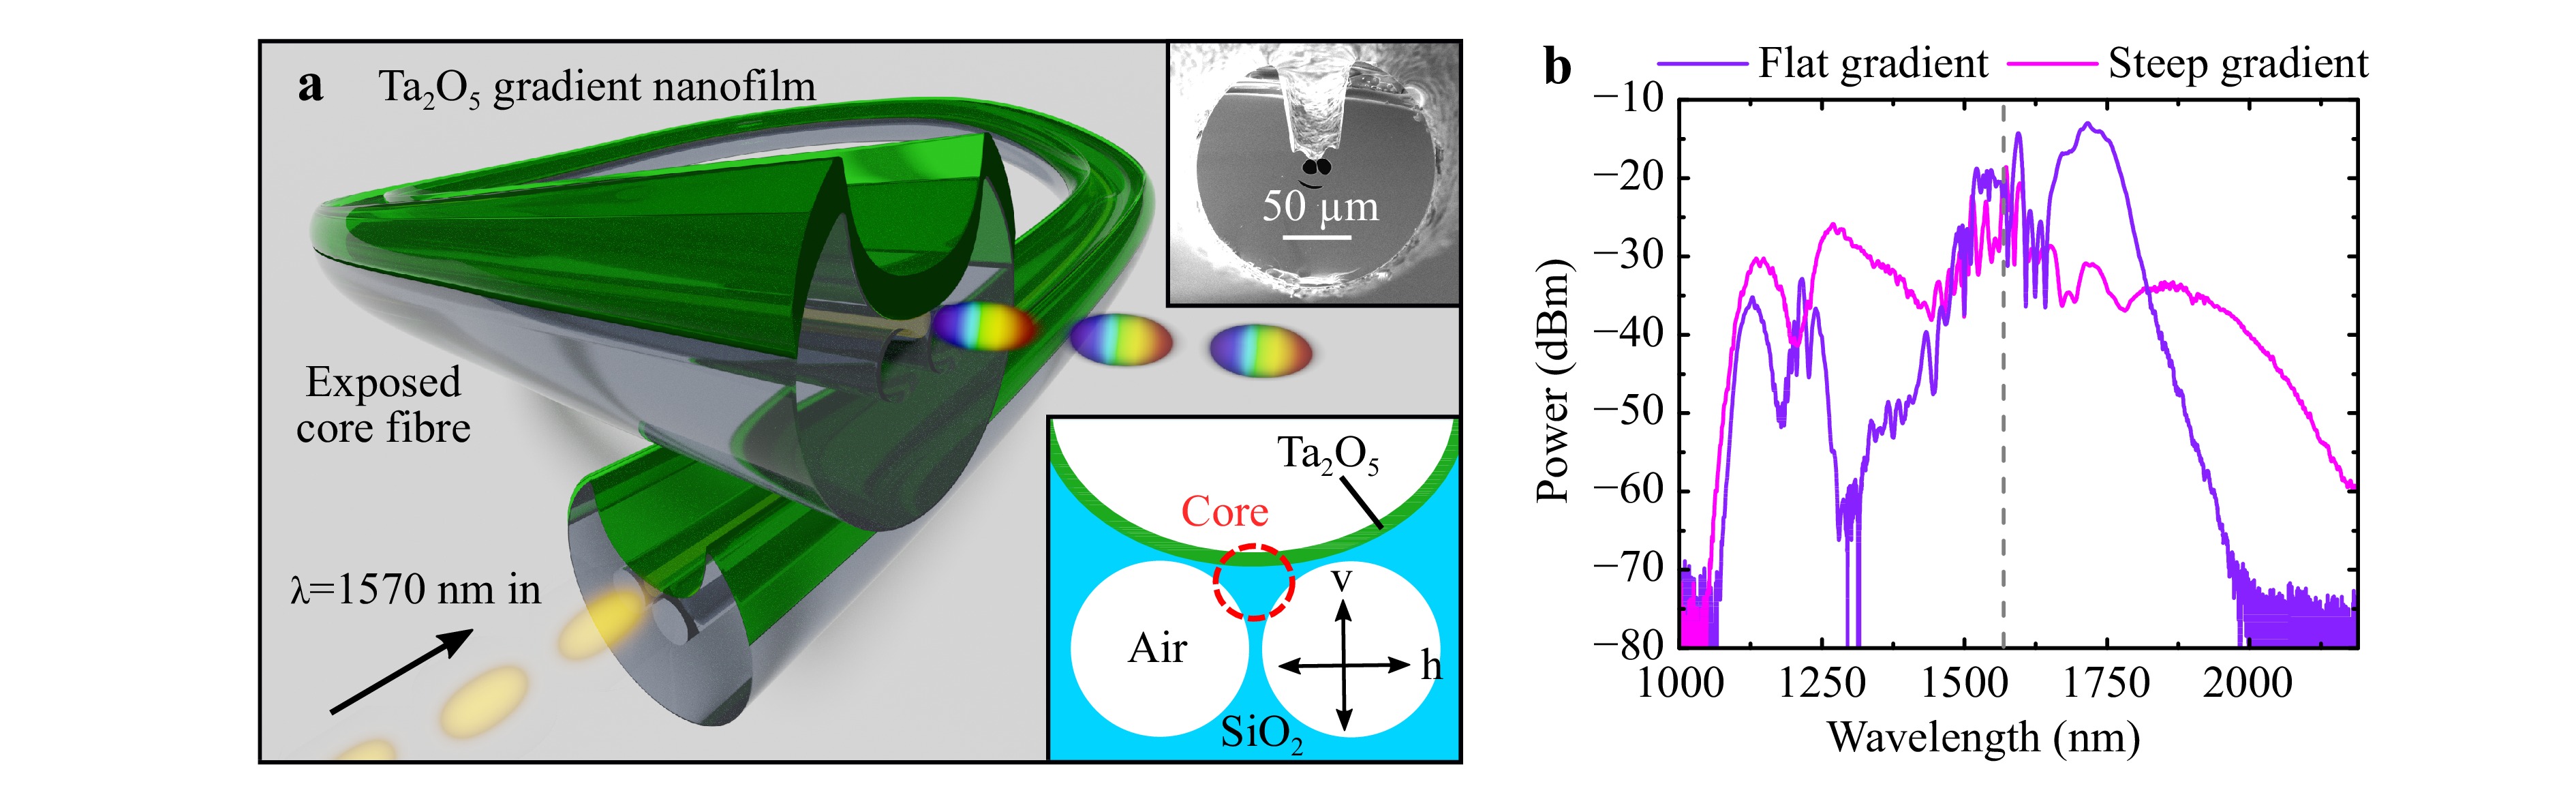
Fig. 1
a Illustration of the nanofilm enhanced exposed core fibre. The top inset is a SEM image of the cross-section of the fibre and the bottom inset shows the schematic cross-section of the core region. A red dashed circle marks the core area and the coordinate system defines horizontal (h) and vertical (v) polarisation. b Examples of the measured spectral output of a fibre with almost uniform nanofilm thickness (62–70 nm thickness, 70 mm fibre length, purple) and having a steep gradient of ~1.1 nm mm–1 (59–144 nm thickness, 68 mm fibre length, pink) with similar starting thicknesses. The central pump wavelength is indicated by the vertical dashed line.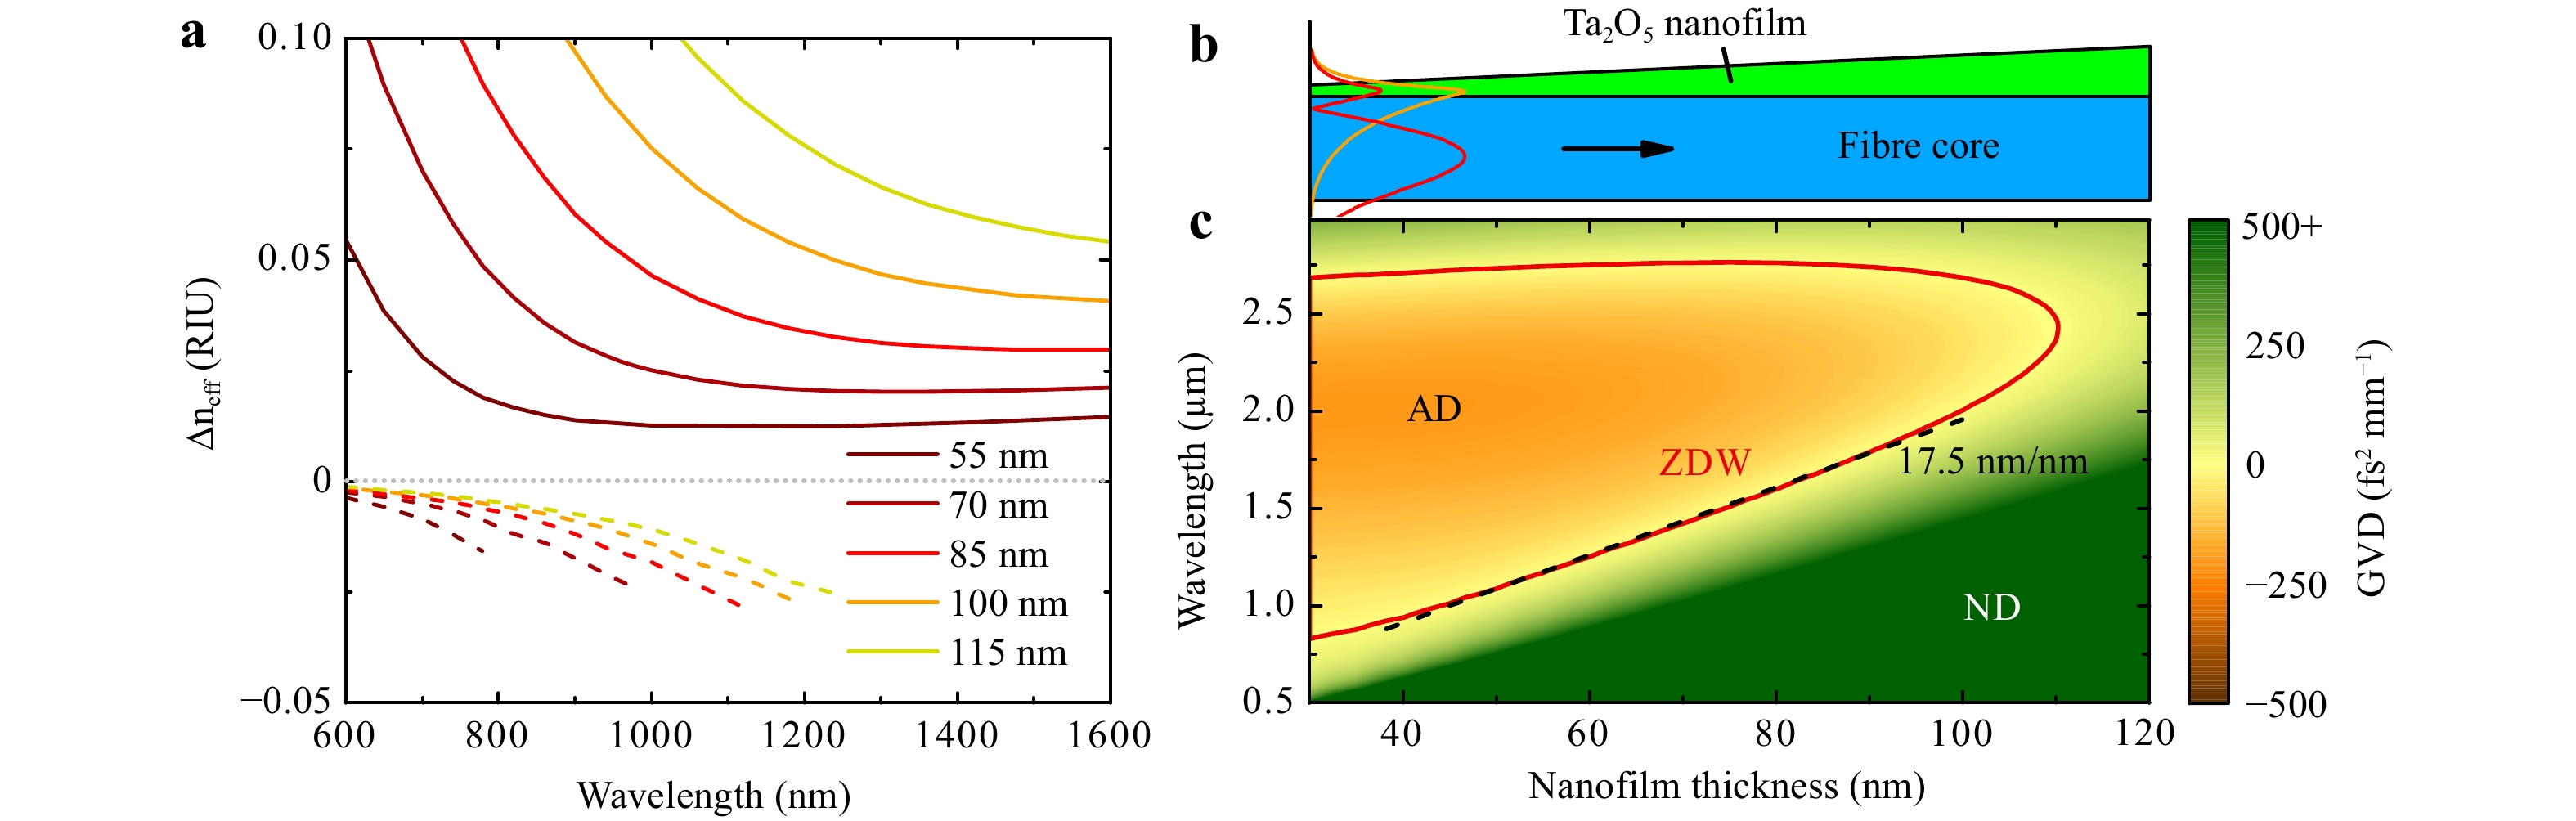
Fig. 2
a Spectral distribution of the relative effective refractive index (in relation to the situation without the nanofilm) revealing an anti-crossing of fundamental (solid) and a higher order (dashed) mode (layer thicknesses indicated in the legend). All modes have horizontal polarization. b Cross section of the waveguide system that includes a nanofilm with gradually changing thickness on its top. Orange and red curves represent the central cross section profile of the normalized electric field of fundamental and higher order mode at λ = 1120 nm, respectively. c Group velocity dispersion distribution and zero dispersion wavelength (red line) as functions of nanofilm thickness, with the red line dividing the regions of anomalous and normal dispersion.As shown by the authors in a previous study23, nanofilm-enhanced ECFs with constant layer thickness (t = constant) were adjusted such to have anomalous dispersion (AD) at λp, which is in close proximity to the first ZDW, allows the generation of a fundamental soliton that creates a single peaked DW in the normal dispersive (ND) domain. Although the wavelength of specific features is tuneable, the resulting individual spectra include a particular amount of non-uniformity, which is mostly due to the lack of frequencies generated between λp and λDW. Moreover, on the long wavelength side, the bandwidth is limited because of the small Raman shift that the soliton experiences during propagation.
The idea of this work is to gradually change the thickness of the nanofilm along the ECF (Fig. 2b) to create a complex longitudinal dispersion landscape, allowing for phase matching to DWs at different wavelengths from the same soliton11. This effectively fills the mentioned spectral gap and leads to a uniform nonlinear frequency conversion across a large spectral interval. One essential feature of our study is that the soliton number N remains below two for all nanofilm gradients (NFGs); therefore, neither higher-order solitons nor higher-order soliton fission are observed. Here, the influences of the starting thickness and gradient strength (gs) are examined, and the gradient parameters are optimised according to a figure-of-merit (FoM) that reflects the bandwidth and flatness of the achieved output spectra.
-
To determine the most suitable experimental test NFGs, the impacts of the starting thickness and gs (i.e. slope) were evaluated through simulations. In this section, a linear and positive gs NFG along an ECF of fixed length (75 mm) is assumed. First, the influence of gs and starting thickness on the ZDW were evaluated separately, with the other parameters kept constant at a moderate value. For a fixed NFG (e.g. gs = 0.5 nm mm−1), the ZDW (obtained from eigenmode simulations using a Finite-Element solver (COMSOL Multiphysics)) increases linearly with the position along the fibre and with the starting thickness (Fig. 3a). Starting at thin layers, λZD is spectrally far away from λp, whereas for larger nanofilm thicknesses, the ZDW moves towards λp until they coincide at t = 79 nm. Considering a self-phase modulation length of approximately 8 mm before soliton creation (obtained from nonlinear pulse propagation simulations solving the generalised nonlinear Schrödinger equation (GNLSE) (see Supplementary Information, Fig. S2), starting thicknesses larger than 75 nm are disadvantageous for this gradient because the fibre becomes entirely normal dispersive at λp = 1570 nm. For thinner starting nanofilm thicknesses, the fibre starts in the AD domain to enable phase matching between the soliton and DW and becomes ND for λp at a specific point along its length as the nanofilm thickness increases (red line in Fig. 3a, b). Considering constant layers, the ND domain would cause the fibre at these layer thicknesses to be non-functional for nonlinear frequency conversion. Including the NFGs, however, the soliton might still be in the AD domain (λp < λZD < λsoliton) to continue contributing to the nonlinear dynamics (provided that the pump starts in the AD region).
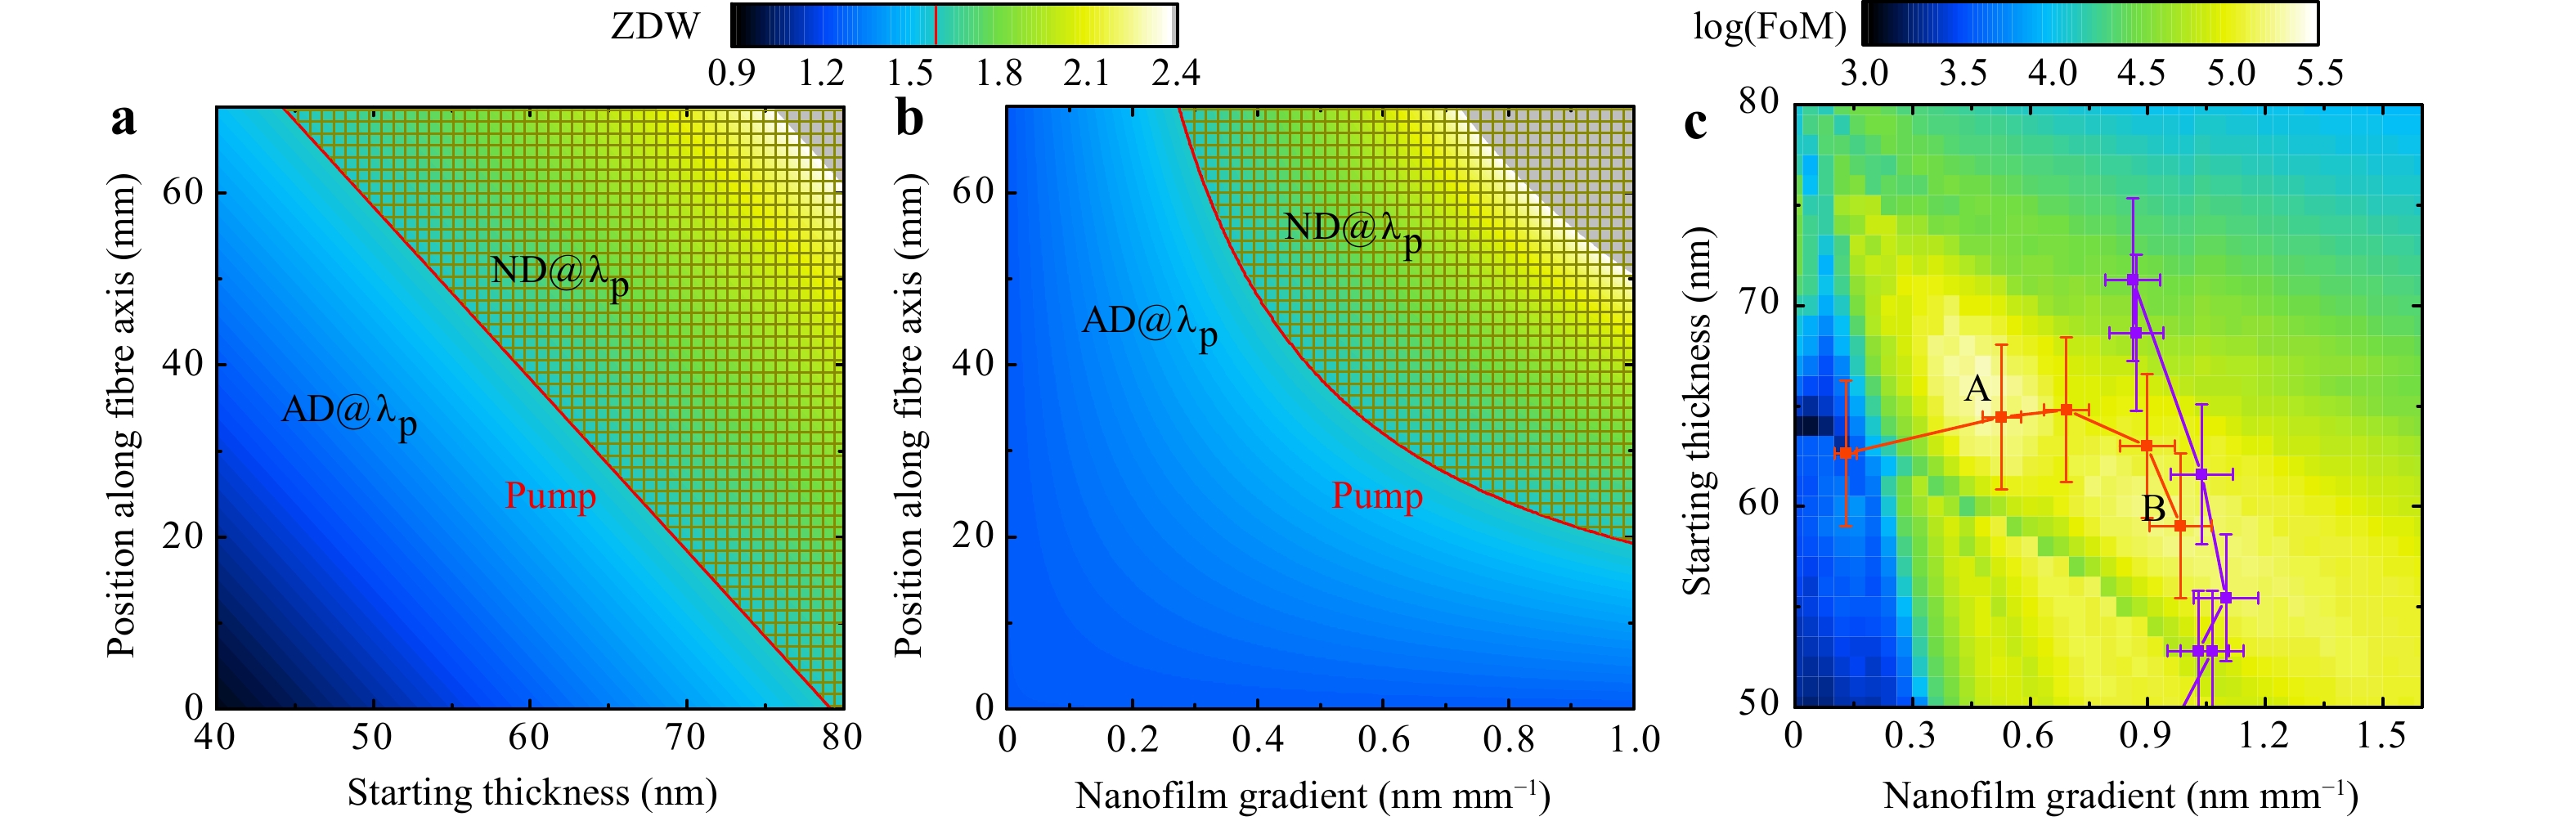
Fig. 3
Distribution of short-wavelength zero dispersion wavelength (ZDW) along the ECF for a different starting thicknesses at a fixed gradient of gs = 0.5 nm mm−1 and b different gradients with a fixed starting thickness of 60 nm. The laser and fibre parameters are fixed as given in the main text. The red line marks the central wavelength of the pump (λp = 1570 nm) and divides the plot into an anomalous dispersive (AD) and normal dispersive (ND) domain below and above λp. c Assessment of the concept’s capability to create a uniform and broadband spectrum for our fibre and laser configuration using the figure-of-merit (FoM) parameter described in the main text (larger values are better, the two best cases are marked with A and B). The experimental NFG parameters are marked in the plot (sets 1 and 2 in red and purple, respectively).For a fixed starting thickness of 60 nm and different gs, the dispersion dependence on the NFG is nonlinear (Fig. 3b). Near the fibre end, where the thickness exceeds 110 nm, no ZDW exists (compare to Fig. 2c).
As shown in Fig. 3a, b, the starting thickness and gs have a strong impact on the final output spectrum of our ECF considering our specific laser configuration. To assess a particular device configuration with respect to the spectral flatness and total bandwidth, an FoM is introduced. This is defined here as the bandwidth of the spectral distribution of the output power P divided by its root mean square (RMS) value within that bandwidth.
$$\begin{split} {\rm{FoM}} =& {\rm{bandwidt}}{{\rm h}_{\rm{\lambda }}}/{\rm{RM}}{{\rm S}_\nu } = \\ &\left( {{{\rm{\lambda }}_{\max}}-{{\rm{\lambda }}_{\min}}} \right){\left( {\frac{{\int_{\rm{bandwidth}} {\left( {P\left( \nu \right) - \bar P} \right)d\nu } }}{{{\nu _{\max}} - {\nu _{\min}}}}} \right)^{ - 0.5}} \end{split}$$ (1) According to the definition in Eq. 1, a broader and flatter spectrum leads to a larger FoM value. The bandwidth is given in terms of wavelengths to allow for direct comparison to the presented spectra, whereas the frequency representation is used for the RMS value because it shifts the focus of flatness to the interesting DW region. The bandwidth limit for the experimental data was set to −30 dB of the maximum spectral power density. For the simulated data, however, the long-wavelength threshold is set to −10 dB because, in some cases, low-power and experimentally undetectable spectral features appear near 2400 nm which should be excluded from falling into the bandwidth definition. The simulated solitons have slower decaying tails compared to the experiments (see the loss section in the Supplementary Information), making the spectral bandwidth comparable even though using different definitions.
Fig. 3c shows an overview of the FoM values calculated for different NFGs on our ECF by solving the GNLSE (pump pulse: 9 kW peak power, 28.4 fs FWHM (measured with an autocorrelator) λp = 1570 nm; details on the simulation are presented in the Methods section). There are two areas of significantly low FoM, which are unfavourable for operation (breakdown of RMS values and bandwidth can be found in Fig. S3): one is at thick starting layers because λZD gets to close to λp, lowering the bandwidth because the DW and soliton are spectrally close. The other is located on the small gs side. Below t = 64 nm, the small FoM results from the narrow bandwidth because no DW is created as the ZDW is spectrally far from the pump. For t > 64 nm, the DW is generated, but the large spectral gap between λp and λDW leads to a high RMS value. This sudden jump of the DW appearing and falling into the -30 dB bandwidth criterion can be seen as a sharp edge in the small gs section and throughout the plot. For a maximum bandwidth, the NFG parameters above this edge should be considered. There are two FoM maxima along the secondary diagonal: the one at the flatter NFG (marked A) originates from an excellent RMS, whereas the maximum at a higher gs (marked B) is due to a larger bandwidth. This behaviour indicates that there is a trade-off between the flatness and bandwidth.
To experimentally confirm the best NFG, two series of samples were addressed in this work. One corresponds to a horizontal line through the FoM map (red line in Fig. 3c), where gs is varied with an almost comparable starting thickness. The second set has a similar gs at different starting thicknesses, as represented by the purple data in Fig. 3c. Because the experimentally realised NFGs are not perfectly linear, the points shown in the FoM map are averaged gradients within the first 5 cm of each fibre. Additionally, the coupling efficiencies vary, and the experimental conditions do not meet the constant input peak power of 9 kW assumed for the simulations. Thus, the indicated experimental points in Fig. 3c should be considered as a rough indication.
-
The key to the proposed tuning concept is the controlled deposition of the nanofilm with the gradually changing thickness, which uses tilted deposition as nano-fabrication technology. As a layer material, we chose tantalum pentoxide (Ta2O5) because its RI is sufficiently high to keep the required layer thicknesses thin while providing high transparency37. It should be noted that this material has been successfully used in various experiments, including optical sensing38, nonlinear applications39,40, and enhancing third harmonic generation33 and is readily available in our laboratory; other oxide materials can also be considered. In the context of this work, Tantalum can be used as a reactive magnetron sputtering target and enables the deposition of layers with a defined slope, as shown for the Ti-Ta system41. In our work, the layer gradient was achieved by tilting a glass substrate containing attached ECFs at an angle φ above a Ta target inside a reactive magnetron sputtering chamber42,43 (Fig. 4a). Details of the deposition are provided in the Supplementary Information (Fig. S1). Within one deposition run, we simultaneously coated several fibres mounted at different angles using the same sputtering time, resulting in the angle-dependent thickness profiles shown in Fig. 4b. It is worth noting that the thicknesses and extracted gs were measured by an ellipsometer on individual planar glass substrates (Borofloat 33), to which all fibres were directly attached. Because of the slot-type geometry of the ECF, the layer thickness on the fibre core is less and is accounted for by the correction factor fc (details in the Supplementary Information (Fig. S1a)). For flat angles less than φ < 35°, the thickness distributions are concave and form a plateau at the side closer to the sputtering target. For angles around φ ≈ 38° (dark green curve), the NFG shape becomes linear and convex at even steeper angles. This unintuitively results in a similar gs within the first 40 mm of the fibre (0.85 < gs < 1.1 nm mm-1), where most of the nonlinear effects occur as proven by the simulations. This behaviour is attributed to the complex sputtering deposition mechanism that can be fully explained and reproduced using the adapted model based on the work of Fan et al.44 (Supplementary Information, Fig. S4a). Because the nonlinear shaped part of the NFG occurs mainly for t ≥ 110 nm where no ZDW exists (Fig. 2c), the influence of that part of the fibres can be neglected because the ND contribution to the nonlinear frequency conversion process is only minor. Thus, this set of fibres can be regarded as allowing for the study of different starting thicknesses at similar slopes (defined in the following as set 2).
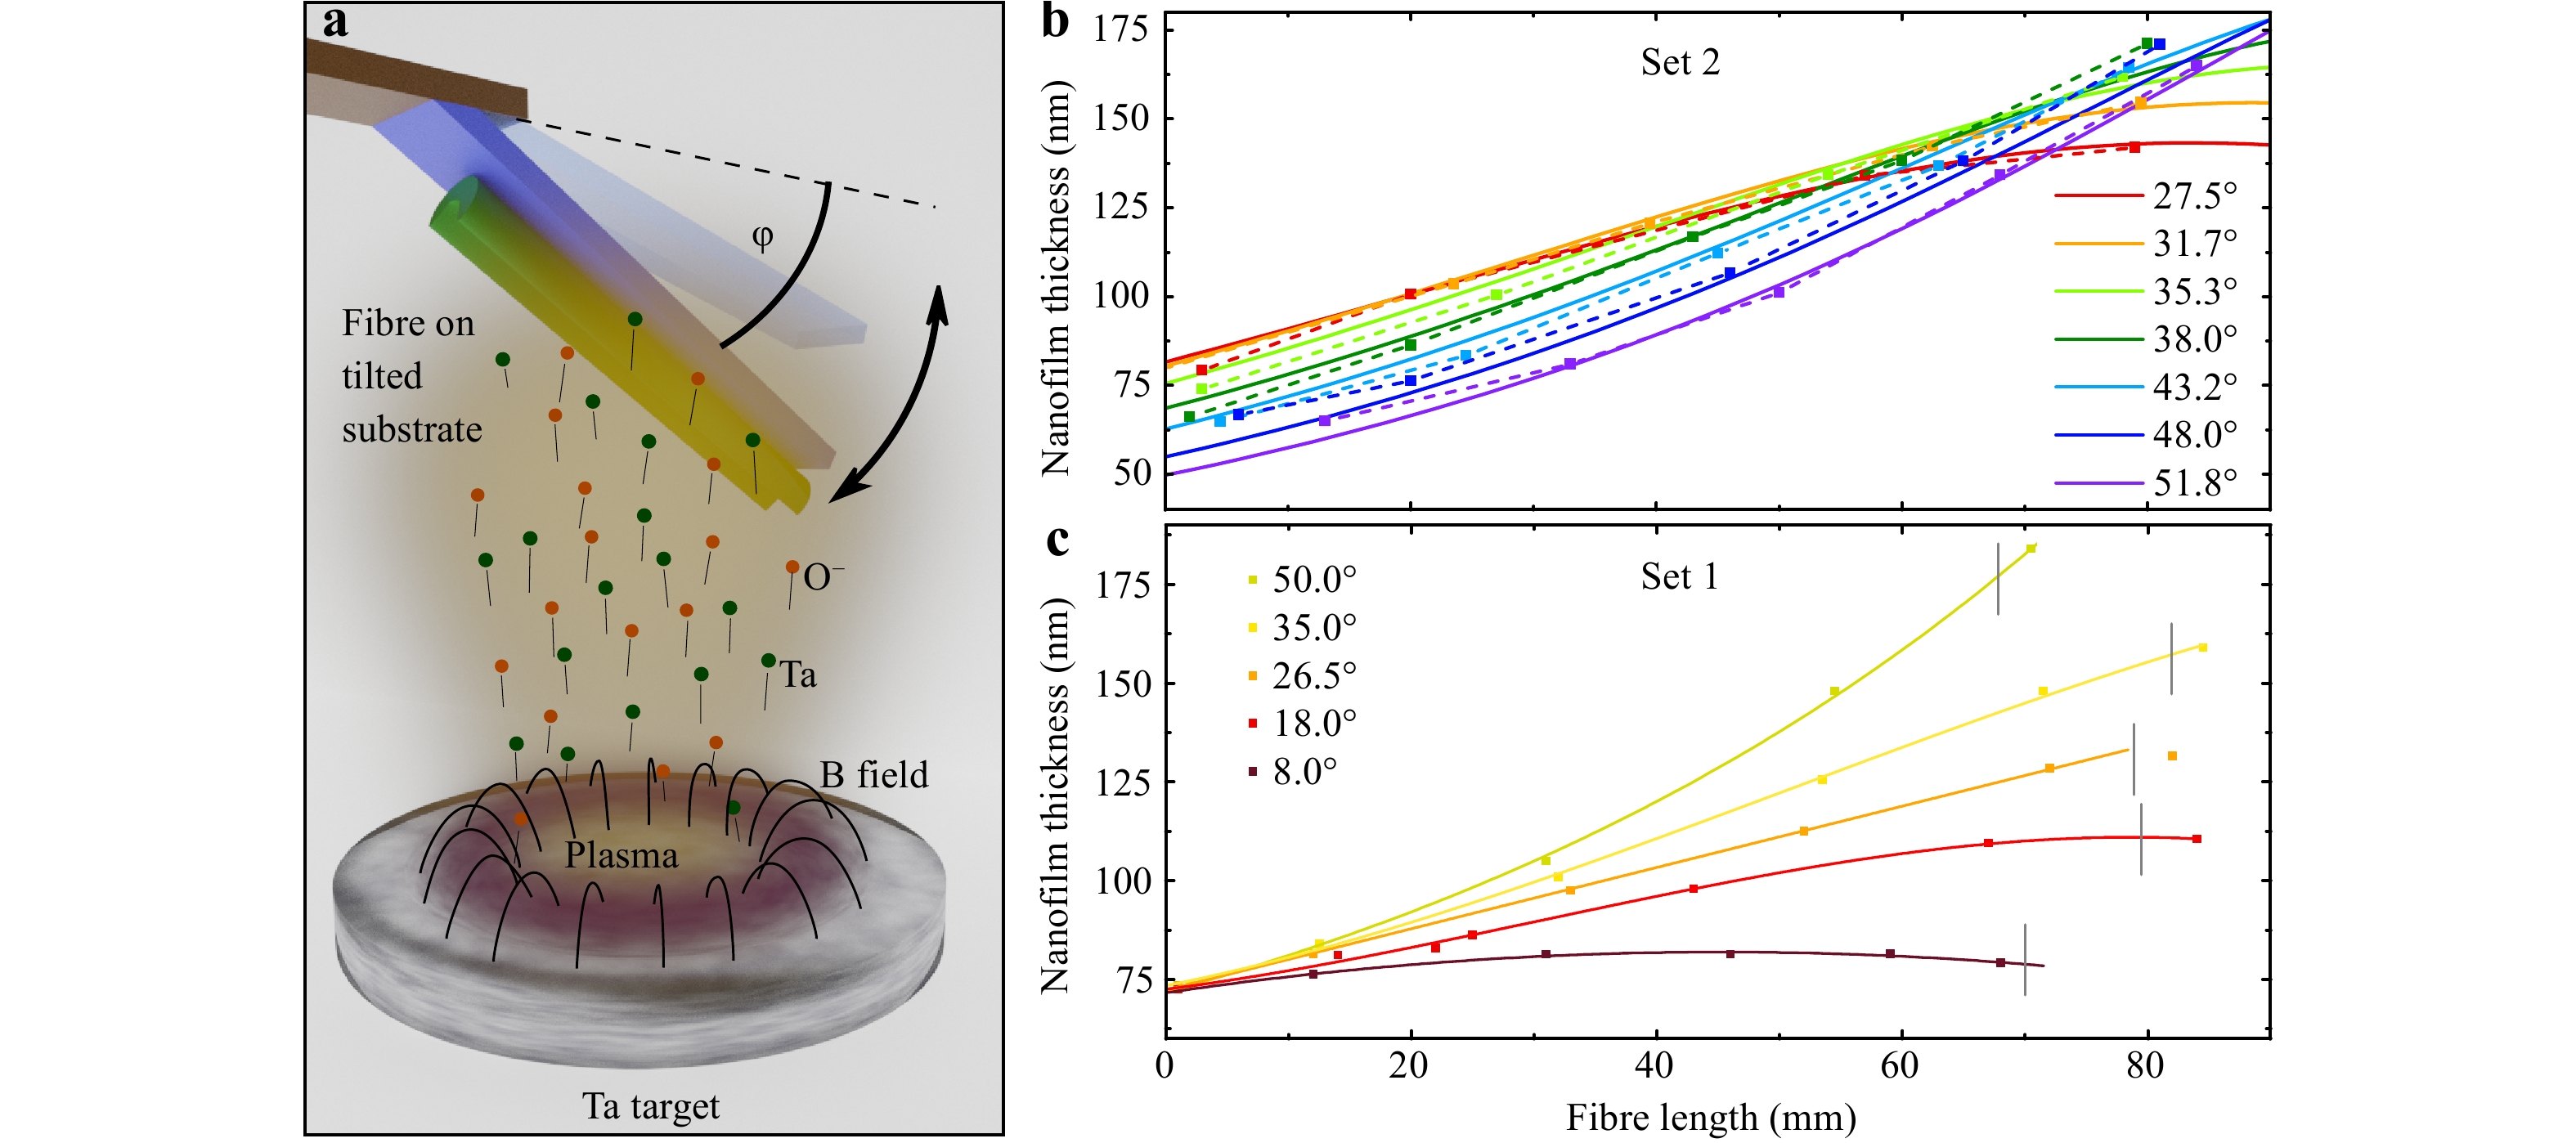
Fig. 4
a Schematic of the gradient layer deposition procedure using a tilted substrate at varying angles φ and reactive magnetron sputtering. Resulting layer thickness distribution on the reference glass substrate without b and with c the adaptation of the sputtering time for a set of inclination angles φ. Dashed lines in b are guides-to-the-eye of respective measured thicknesses. Solid lines in c are fits whereas in b they represent a theoretical thickness distribution using the related sputtering model described in the Supplementary Information (Fig. S4a). Grey vertical lines indicate the experimental ends of the fibres.In contrast, if the fibres were coated individually and the sputtering time was adapted for each angle, a set of fibres with the same starting thickness but different gs can be obtained (Fig. 4c). This set focuses on the effect of gs varying from gs = 0.15 to gs = 1.2 nm mm-1 within the first 50 mm (defined as set 1).
It should be noted that for the nonlinear pulse propagation simulations, the measured thickness profiles of the layers were used with fc as a parameter to match the simulations and experiments. For set 1 (Fig. 4c), using fc = 0.87, 0.895, 0.905, 0.875, and 0.82, respectively, (ordered by increasing φ values) is within the expected range. For the ECFs used for sample set 2 (Fig. 4b), fc is set to 0.88 without additional simulations based on the expected value of the actual nanofilm thickness measurements inside and outside the fibre groove (Supplementary Information Fig. 1a). Including this correction, the points marked in Fig. 3c are not on a straight line, although they have the same measured starting thickness on their substrates.
-
All fabricated coated fibres were optically evaluated using the setup described in ref. 23 consisting of an ultrafast laser (FFpro IRS II, Toptica Photonics, λp = 1570 nm repetition rate 80 MHz), high-precision coupling optics (Martock MDE510, Elliot Scientific Ltd.), and spectral diagnostics. The pulses with a width of 28 fs were passed through an attenuator and polarisation control before being launched with an aspheric lens (C230TME-C, Thorlabs Inc.) into the fibres. A similar lens was used for outcoupling to a collection fibre with a core diameter of 1 mm (FT1000EMT, Thorlabs Inc.) connected to an optical spectrum analyser (AQ6315A, Ando Corp. or AQ6375, Yokogawa Corp., dependent on the spectral range of interest). Details of the measurements can be found in the Methods section.
-
In Fig. 5a, the spectra at a maximum input power of ~190 mW are shown for the first set of nanofilm-enhanced fibres with the same starting thickness (set 1), suggesting roughly similar thicknesses at a propagation distance of ~8 mm where the first DW was created. Therefore, the short wavelength edge of the SC (λ ≈ 1050 nm), which is controlled by the first DW, is comparable for all fibres in this series. Without any gradient, that is, for t = constant, this would be the only DW created leaving a broad spectral gap between λDW and λp, as experimentally demonstrated in ref. 23. Using the sputtering deposition technique without substrate tilting, a small NFG was created, especially on smaller 4" deposition facilities (see Supplementary Information, Fig. S2b). This gradient, also present for the φ = 8° fibre, leads to a splitting of this DW, an effect that can be clearly observed in the corresponding power/spectral evolutions (Fig. 5b and e). Larger input powers reduce the length of the self-phase-modulation-dominated broadening before the creation of the fundamental soliton and first DW. At low input powers, the soliton is created within the constant thickness plateau (> 30 mm fibre length in Fig. 4c, 8°) and creates a single DW. For Pin > 150 mW, the position of the first soliton creation is moved to the remaining thickness gradient at the start of the fibre. The different dispersions for the remaining fibre leads to the creation of a second DW in close spectral proximity to the first one (see propagation simulation in the Supplementary Information, Fig. S2d). For larger gs (φ = 26.5°, Fig. 5c, f), more DWs are created, filling up the gap and decreasing the RMS part of the FoM (see pulse propagating simulation in the Supplementary Information, Fig. S2). Interestingly, the DWs are not created continuously despite the phase-matching condition changing smoothly along the fibre, but rather form individual spectral features11,45. The peak height of the shortest wavelength DW decreases relative to the remaining spectrum for steeper fibres (from φ = 26.5° to φ = 50°) (Fig. 5a), which is confirmed by the simulations and leads to an increasing experimental FoM for steeper fibres in this series.
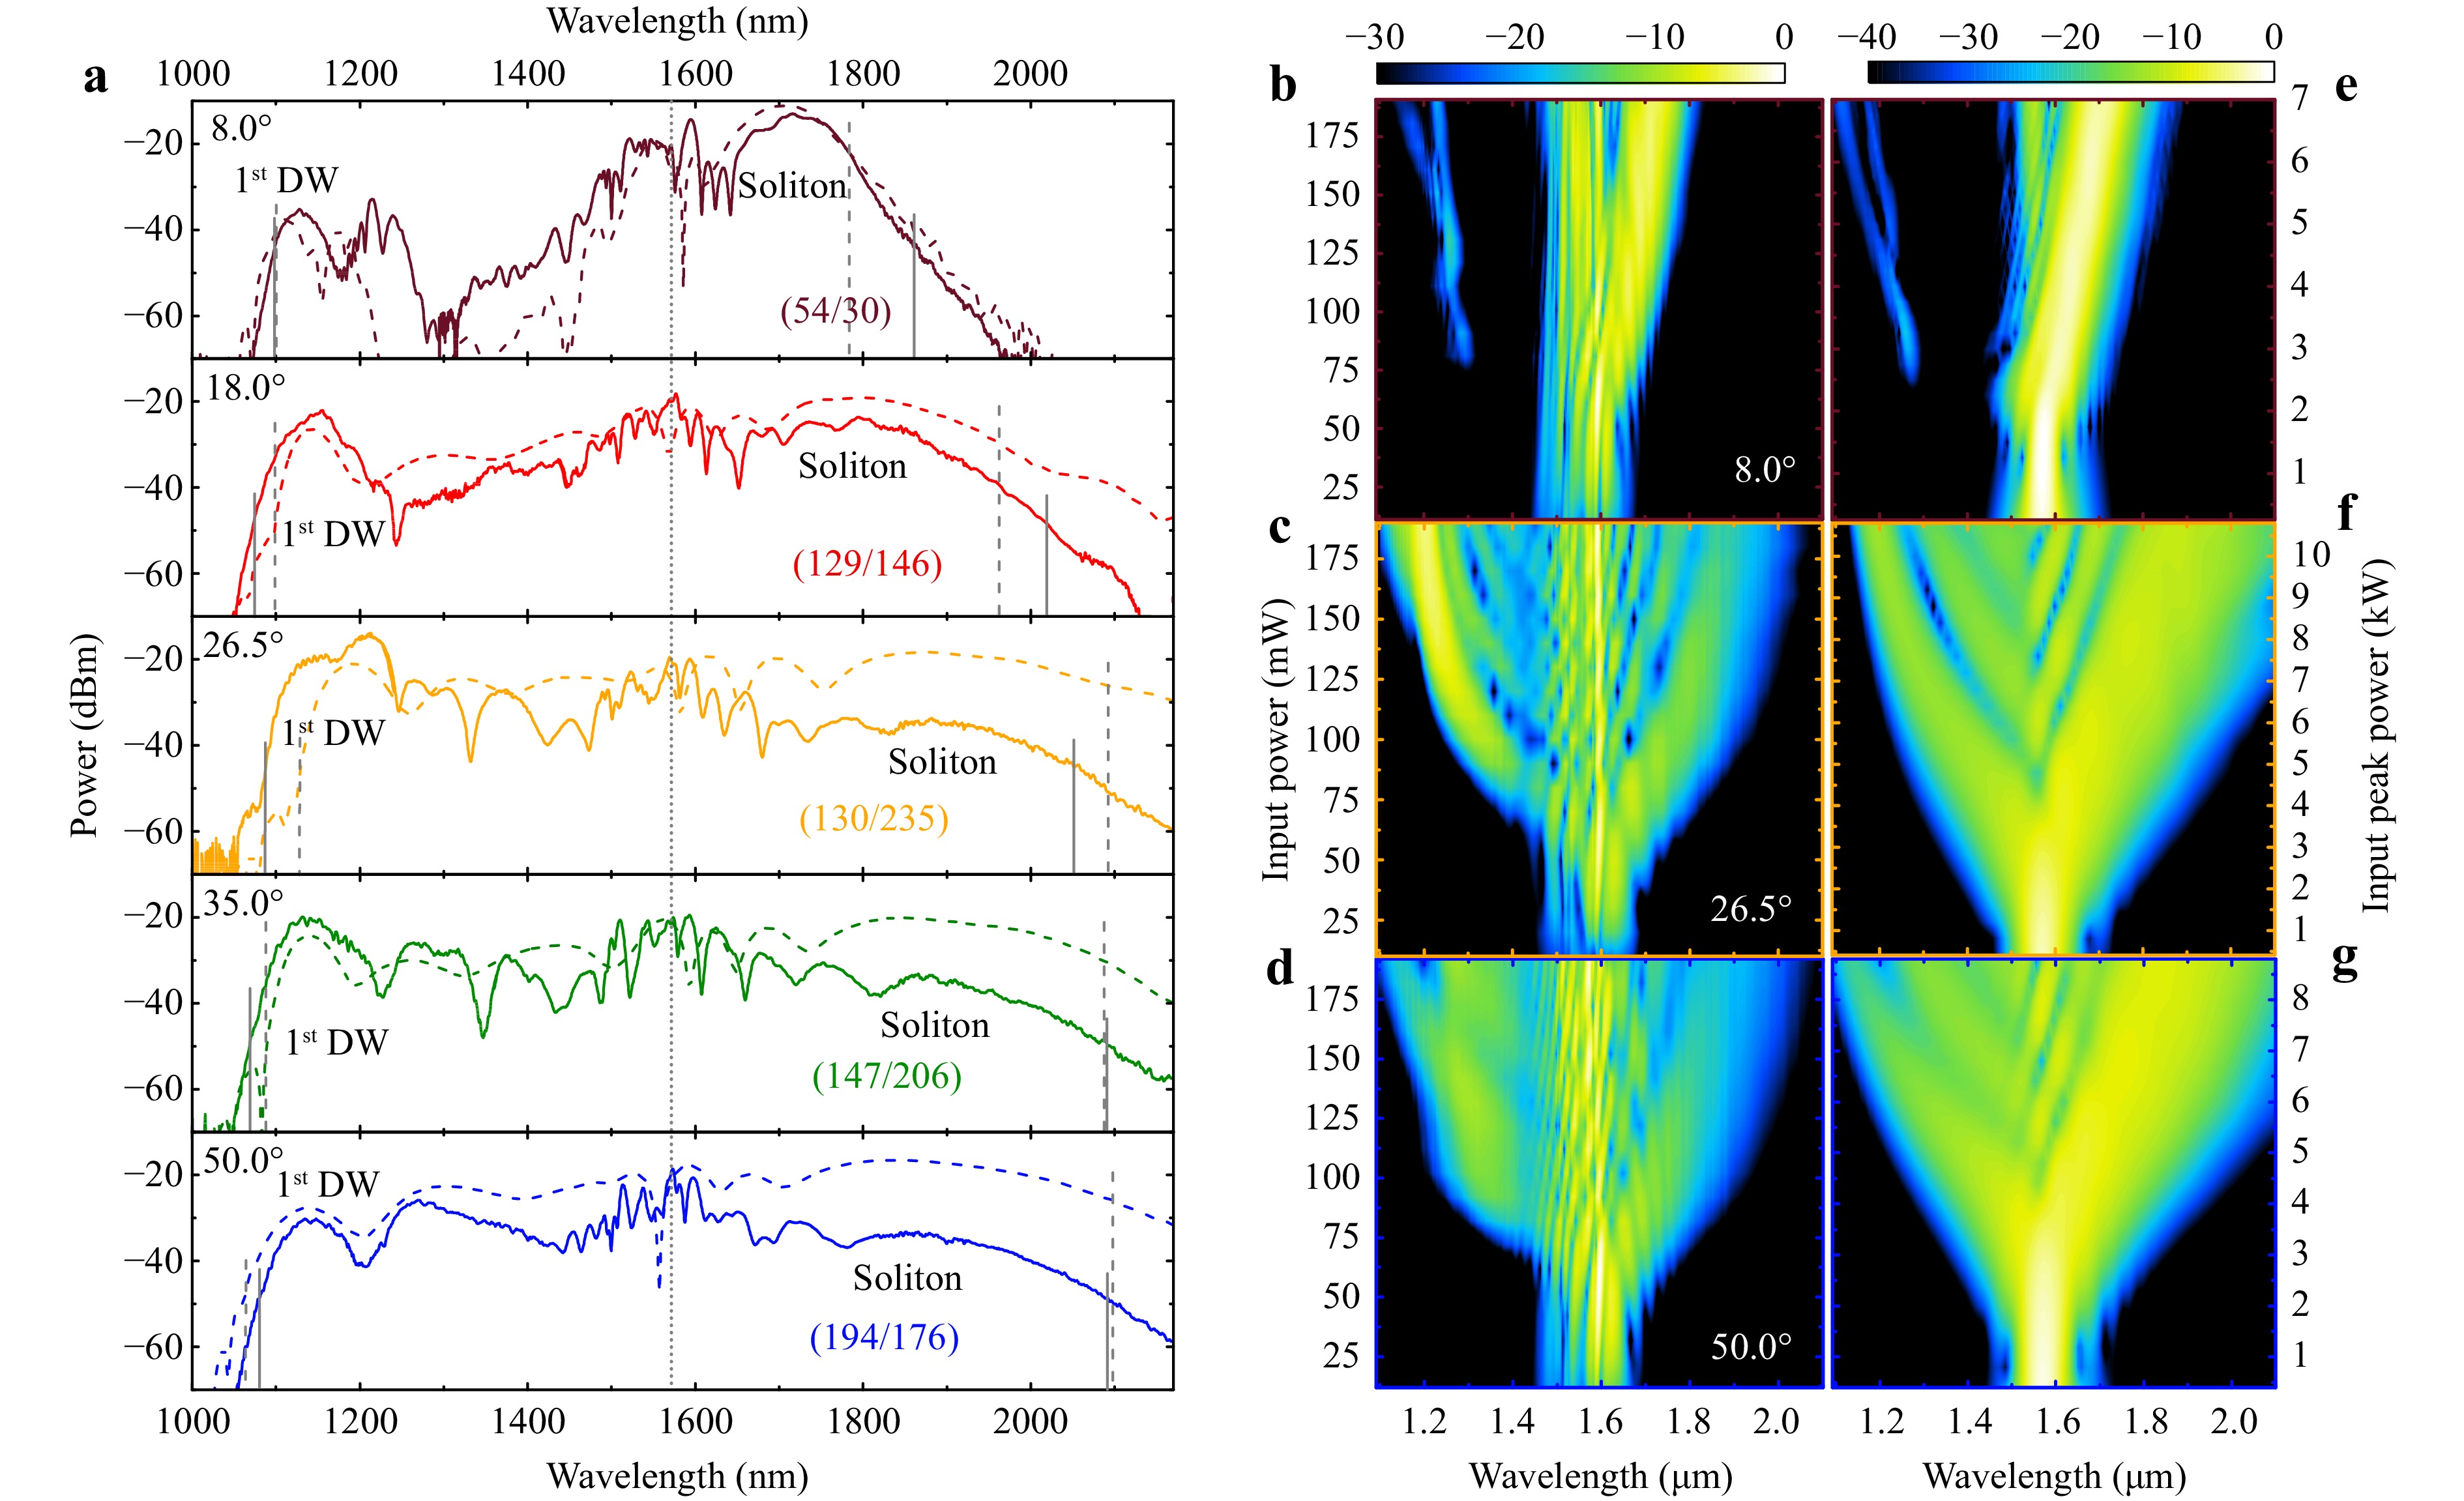
Fig. 5 Spectral broadening for samples of different nanofilm gradients with similar starting thicknesses (sample set 1).
a Experimental (solid line) and simulated (dashed line) spectra at maximum input power (~190 mW) for the layer geometries presented in Fig. 4c. The corresponding FoMs are displayed in parentheses (experimental/simulated). Solid and dashed vertical lines mark the bandwidth used to calculate the FOM, respectively, and the dotted line represents λp. The experimental b−d and simulated e−g power/spectral evolution for the flattest (top row), medium (middle row), and steepest gradient (bottom row, color-matched to a).At the long wavelength side, the soliton is relatively close to λp for small gs, showing a well-known but weak Raman red shift, as observed in the case of uniform TiO2 nanofilms23. Changing the dispersion along the fibre with larger gs imposes the ZDW to follow the soliton towards longer wavelengths. Keeping the GVD of a Raman shifting soliton constantly at a small value significantly enhances its red shift (Supplementary Information, Fig. S2). For NFGs of up to φ = 26°, the bandwidth is increased towards the IR by more than 200 nm, where it saturates even for a larger gs because the thick sections with t > 110 nm at the fibre end only add ND.
By utilising thickness gradients, layer thicknesses of more than 80 nm present at some positions of the fibre contribute to the spectral broadening, which would otherwise be useless if only uniform layers are considered. For example, no spectral broadening was observed for an ECF with a constant 115 nm Ta2O5 nanofilm. Moreover, the NFG direction is important because coupling light from the thick nanofilm side does not broaden the input pulse spectrum because no soliton can be created in the ND domain at the start of the fibre. Owing to significant temporal pulse broadening, soliton creation at the fibre positions where the dispersion eventually becomes AD is no longer possible.
-
The spectral measurements of the second sample set with similar gradients (0.85 < gs < 1.1 nm mm−1, set 2) is shown in Fig. 6. Overall, the spectra broaden until φ < 39° (starting thickness t = 69 nm) and subsequently decrease in bandwidth on both sides of the spectrum. For a thick starting thickness (red curve in Fig. 6), the ZDW is close to λp and λsoliton, limiting the bandwidth at the short-wavelength side because the resulting DW is also created close to λZD. Although the soliton wavelength λsoliton is essential for the DW phase-matching condition, the creation of the first DW is close to the fibre input where the soliton did not experience a red shift, yet. Thus, the starting thickness is solely responsible for the position of the short-wavelength edge of the spectrum, making both short- and long-wavelength edges independent. For thinner starting layers, the ZDW linearly moves towards shorter wavelengths with the short-wavelength DW following accordingly23. The corresponding conversion efficiency decreases simultaneously owing to the increasing spectral distance between λsoliton and λZD36. Owing to the NFG, more secondary DWs are created by the same soliton at longer wavelengths between the first DW and ZDW. With the first DW vanishing for starting thicknesses ≤ 63 nm (φ > 39°), secondary DWs define the short-wavelength edge of the spectra. Eventually for thinner starting thicknesses, the second DW is created at the same thick nanofilms thickness that is suitable for potential shortest primary DWs near λ = 1.1 μm (69 nm starting thickness). However, this occurs at longer propagation lengths within the fibre, where the pulse already suffered from optical losses, temporal broadening, and the soliton is already red-shifted. Therefore, the creation of primary and secondary DWs at the same nanofilm thickness is not equivalent with respect to the DW wavelength, leading to a reduction of the bandwidth on the short wavelength side in case primary DWs are lost in this way (see pulse propagation simulation in the Supplementary Information, Fig. S2c).
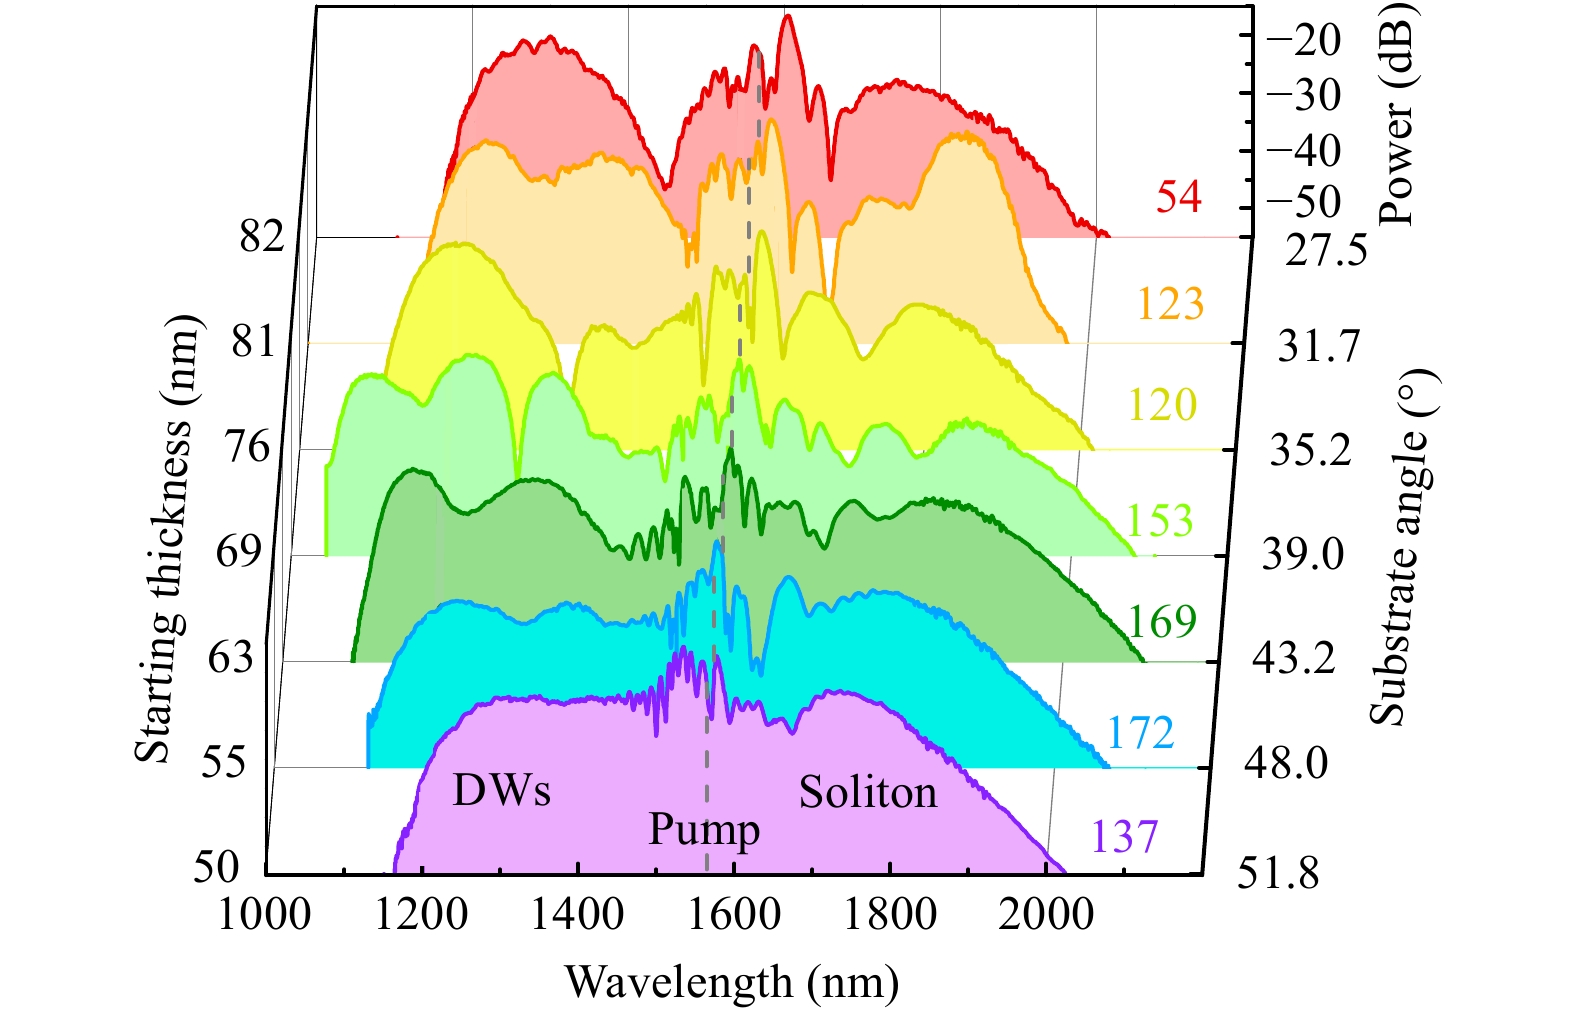
Fig. 6 Spectral broadening for samples of different starting thicknesses including similar gs (sample set 2).
Every spectrum can be improved in uniformity by tuning the chirp, power, or polarisation of the input pulse. For the fibres with large gs in the second series (set 2) where broadband spectra were not possible (Fig. 6 blue to purple curves), the focus was set to improve the spectral flatness. However, this is accompanied by a reduction in the bandwidth on both sides of the spectrum and the output power. Spectra with a maximum variation of 5 dB from 1180 to 1505 nm (starting thickness 55 nm, φ = 48°, σ = 1.4 dB) and 1.5 dB from 1270 to 1460 nm (starting thickness 50 nm, φ = 51.8°, σ = 0.4 dB) were created with solitons up to 1750 and 1700 nm, respectively, with similar power levels compared to the DW.
-
The employment of high-RI nanofilms is essential for the dispersion tuning concept discussed here, because nanofilms with equal or lower RI compared to the core material (here silica) do not induce a resonance in the system. Instead, the layers only increase the effective core size and have the same effect as geometric dimension tuning, primarily changing the long-wavelength ZDW35.
With respect to the efficiency of the nonlinear frequency conversion processes, the gradual nanofilm thickness tuning approach makes it possible to obtain spectrally flat spectra at input energies (0.4 nJ in-fibre) that are much lower compared to other that employ soliton fission15 or modulation instability8,9. The use of such low power, that is, low soliton numbers, intuitively suggests a high pulse-to-pulse stability, which is essential for various types of applications46,47 and has been confirmed by coherence simulations (Supplementary Information, Fig. S7).
Independent of the two sample sets, the long-wavelength bandwidth edge is fixed by the soliton and limited by its Raman-induced frequency shift. The red shift of a fundamental soliton is determined by the fibre and pulse parameters at the local soliton wavelength, as described by Gordon’s formula, with corrections for self-steepening and dispersion slope48. As shown here, assisting the red-shifting soliton by a co-moving ZDW keeps the GVD at the soliton wavelength small, increasing the red shift and extending the spectra towards longer wavelengths.
The long-wavelength edge is strongly affected by losses, as shown by the preliminary simulations. Varying solely losses in simulations can shift the −10 dB long wavelength edge from 2180 nm without any losses to 1920 nm at 1 dB cm−1 (for the φ = 26.5° fibre, see Supplementary Information, Fig. S5b), stressing the importance of reducing the loss to an absolute minimum. The wavelength-independent losses were kept as a variable in the nonlinear simulations to match the experimental and simulated spectra and were varied between 0.1 and 1.0 dB cm−1. Using cutback measurements on ECFs with constant layer thicknesses of 73 nm and 115 nm, losses of ~1 dB cm−1 and 0.5–3 dB cm−1 could be verified, respectively (see Supplementary Information, Fig. S5a). The loss can be dominantly attributed to the scattering at the rough surface of the nanofilm and its defects inside the layer. Pure stoichiometric Ta2O5 has little material losses37 and bare ECFs without layers feature only < 0.1 dB cm−1 losses. A loss peak was observed for bare (λ = 1398 nm) and coated (λ ≈ 1420 nm) fibres, which are attributed to the adsorbed water on the core/layer surface and water vapour in air interacting with the evanescent field, as shown in Fig. 5c, d. In addition to the absorption feature near λ = 1420 nm, the next water absorption band starting from λ ≈ 1 900 nm is visible as the transmitted optical power in experiments drops significantly compared to the simulations. Additionally, the OH groups in silica and tantalum oxide contribute to losses in these spectral regions49. Simulations suggest that potentially increasing the input power (not possible with our laser) or reducing the losses will enhance the overall Raman shift. The scattering losses could be potentially reduced by implementing a surfactant sputtering technique50, improving stoichiometry51, using annealing52, or increasing layer quality by optimising the deposition procedure to avoid the formation of larger particles (see Supplementary Information, Fig. S1c).
The nonlinear thickness distribution of the nanofilm can principally be achieved in future experiments by bending the fibres during deposition. Additionally, coating layers in multiple subsequent steps with different fixed masks or a moving slit mask are options to further increase the variety of possible nanofilm shapes and the resulting spectral power distributions, potentially improving uniformity and bandwidth even further. It should be noted that reaching a periodic arrangement of the nanofilm may enable sophisticated nonlinear frequency conversion processes such as quasi-phase-matched DW generation53 or cascaded DW formation11. With realistically achievable grating periods of 120 μm to several mm on the fibre core, the formation of additional spectral features towards both the long and short wavelengths outside the presented bandwidth of this work is possible. By improving the nanofilm implementation approach through more deposited samples, the use of an advanced sample holder and refined deposition model allows for the precise prediction of the properties of the nanofilm beyond the graded thickness distribution. This overall shifts the fabrication challenge for achieving specific, on-application-focused nonlinear frequency conversion from precise fibre drawing to nanofilm deposition, which is available in many institutions and companies worldwide. Owing to its flexibility, the presented nanofilm implementation approach is neither restricted to dielectric materials nor to fibres, allowing application in numerous areas beyond nonlinear frequency conversion; these applications include fine-tuning of evanescent fields in bioanalytics54 or tailoring modal properties to study sophisticated optical phenomena such as PT phase transitions55.
-
Nonlinear frequency conversion represents one pathway to unlock new physical phenomena and implement light sources with tailored properties. A particular challenge demanded by the increasing number of applications is the establishment of spectrally flat output spectra across defined spectral domains, which is particularly challenging in the context of soliton-based spectral broadening.
In this work, we introduced the concept of controlling nonlinear frequency conversion by longitudinally varying resonances, creating sophisticated dispersion landscapes that allow shaping soliton dynamics and achieving broadband spectra with substantially improved spectral flatness. The varying resonance condition was realised by nanofilms with gradually changing thicknesses that were directly located on the core of a small core microstructured fibre. Specific and well-controlled nanofilm profiles were established through tilted deposition, representing an innovative nano-fabrication approach for the functionalisation of optical waveguides with exposed cores. The nanofilms were designed to induce a well-controlled waveguide resonance in the system, with its dispersion anti-crossing with that of the core mode, leading to a strong and tailored modulation, particularly of the group velocity dispersion along the fibre length. Remarkably, the introduced resonance dominantly impacts the short-wavelength ZDW, which is in contrast with the typical tuning schemes in which the second ZDW is modified primarily. The impact of the starting thickness and gradient strength on dispersive wave generation was examined both experimentally and from simulation perspectives, showing improved bandwidth and spectral flatness via multiple dispersive wave generation and dispersion-assisted soliton Raman shifts, emphasised by an appropriate FoM.
Tailoring soliton dynamics via longitudinally varying waveguide resonances defines a novel concept within nonlinear frequency conversion that facilitates obtaining flat output spectra at low powers even without soliton fission or modulation instability, retaining coherence and pulse-to-pulse stability. Therefore, the proposed approach has the potential to observe novel nonlinear dynamics and realise novel types of nonlinear light sources with tailored properties, whereas the concept itself could be broadly applicable to other structures such as planar waveguides and other materials.
-
Nonlinear pulse propagation simulations were performed by solving a GNLSE using a code based on Dudley and Taylor5. This approach includes the effects of the Raman shift with a purely silica fractional contribution of 0.18 (ref. 56), optical shock, and an added correction for effective mode area dispersion at the pump wavelength57. The mode area is calculated based on the electric field of the fundamental mode58 and depends on the nanofilm thickness, as analysed in the Supplementary Information (Fig. S6). The losses were kept constant within one simulation and adapted for each fibre to match the experiments. Moreover, the full fibre dispersion calculated via Finite-Element modelling (COMSOL Multiphysics) was considered, using the imported fibre cross section of an SEM image within the vicinity of the core (Supplementary Information, Fig. S1a). Numerically differentiating the effective index in 10 nm step sizes gives access to the group velocity and GVD. The material dispersion for silica was taken from Malitson59. For the Ta2O5 layer, the dispersion was measured in-house using an ellipsometer (SE850, Sentech Instruments GmbH), and the results were fitted by the Sellmeier formula n2 = 1 + 3.2289/ (1 − 33929 nm2 λ−2). Although it varies with the deposition geometry, layer thickness, and angle, as well as the fitting method (Δn = ±0.06), the resulting model falls within the range of values reported previously37,60. As nonlinear material parameters, we inserted n2, silica, 1 550nm = 2.8 × 10⁻²⁰ m2W−1 (ref. 61) and
$\rm{ n}_{2,Ta_2O_5} $ = 6.2 × 10⁻¹⁹m2W−1 (ref. 62). The wavelength- and layer-thickness-dependent nonlinear parameter of the fibre is calculated based on the model presented in ref. 63 and updated along the pulse propagation fibre position according to the shifted soliton wavelength and local layer thickness. This soliton tracking feature is disabled in the top right corner of Fig. 3c because of the absence of a clear soliton, which is the reason a slight edge in the FoM can be observed at gs < 1 nm mm−1 and starting thicknesses ≤ 67 nm. NFGs are approximated by discretising all parameters on an integer layer thickness grid and simulating consecutive constant-thickness segments to form a fine step-like thickness profile. All segment lengths can be adapted arbitrarily to effectively simulate nonlinear thickness gradients, and the NFG shape for the simulations is taken from the fitted curves of Fig. 4b. The maximum simulated layer thickness was set to 140 nm. Although the functionalised ECF evaluated here supports multiple modes, the simulations solely consider the fundamental mode operation without any cross-modal or cross-polarization energy transfer. This assumption was experimentally confirmed by mode pictures acquired at different wavelengths for the DW, pump, and soliton, revealing the fundamental mode operation in all circumstances. -
For most fibres, the input coupling and horizontal polarisation direction were optimised to reach strong DW at the shortest wavelength possible. For set 1, the pump laser parameters (such as compressor fine tuning) were kept at a similar best value to obtain comparable conditions. In contrast, for set 2, it was handled more freely and exploited to optimise for a compromise between the broadest and flattest spectrum for each fibre individually64. Because the out-coupling always features chromatic aberrations, the presented spectra are stitched together from multiple measurements. For Fig. 5, three spectral datasets were involved. The first spectrum was optimised for the DW wavelength measured with the short-wavelength OSA (AQ6315A, Ando Corp.) up to 1750 nm, and the second was recorded with a longer wavelength OSA (AQ6375, Yokogawa Corp.) starting from 1200 nm with identical coupling conditions. This makes it possible to calculate the offset of both spectrometers. Finally, the last spectrum is measured with the latter OSA, which is now optimised for the soliton wavelength. Both spectra from the different coupling conditions are stitched together at a wavelength where the spectral powers coincide, leading to a final spectrum that is corrected for short- and long-wavelength spectral power but exhibits a slightly underrepresented central region. For the input power sweeping measurements shown in Fig. 5b−d, the measurement time should be minimised, and the coupling conditions should be comparable to obtain consistent results. Therefore, only the long-wavelength OSA was utilised at coupling conditions optimised for the soliton wavelength. Having no protection against second-order grating effects, the part of the spectra with λ < 1200 nm could be reconstructed from the wavelength range of 2200–2400 nm. One measurement at the maximum input power, also optimised for the DW wavelength, was analysed to extract a correction function to counter chromatic aberration effects that were applied to all other spectra at a lower input power.
Having transmitted powers of 10 to 25 mW and including losses, coupling efficiencies of ~20% (25% for an uncoated fibre) were estimated. No damage to the layers could be observed with our fs laser, even at the highest input power level.
All fibres exhibited strong and tuneable third-harmonic generation, which has already been previously reported33 and is ignored in this work.
-
The authors thank A. Dellith for providing the SEM and AFM images, K. Schaarschmidt for the simulation code template, and helpful discussions. We acknowledge the support of the German Science Foundation via the Projects SCHM2655/9-1, SCHM2655/11-1, and SCHM2655/12-1. This work was performed in part at the Optofab node of the Australian National Fabrication Facility (ANFF) utilising Commonwealth and South Australian State Government Funding. T.L. acknowledges support from the German Science Foundation DFG, IRTG 2101. H.E. and E.S. acknowledge support from the ARC Centre of Excellence for Nanoscale Biophotonics (CE140100003).
Longitudinally thickness-controlled nanofilms on exposed core fibres enabling spectrally flattened supercontinuum generation
-
Tilman A. K. Lühder1,
 ,
, - Henrik Schneidewind1,
- Erik P. Schartner2,
- Heike Ebendorff-Heidepriem2,
-
Markus A. Schmidt1, 3, 4, *, ,
- Light: Advanced Manufacturing 2, Article number: (2021)
- Received: 22 April 2021
- Revised: 28 July 2021
- Accepted: 06 August 2021 Published online: 27 September 2021
doi: https://doi.org/10.37188/lam.2021.021
Abstract: Nonlinear frequency conversion is a pathway to unlock undiscovered physics and implement tailored light sources for spectroscopy or medicine. A key challenge is the establishment of spectrally flat outputs, which is particularly demanding in the context of soliton-based light conversion at low pump energy. Here, we introduce the concept of controlling nonlinear frequency conversion by longitudinally varying resonances, allowing the shaping of soliton dynamics and achieving broadband spectra with substantial spectral flatness. Longitudinally varying resonances are realised by nanofilms with gradually changing thicknesses located on the core of an advanced microstructured fibre. Nanofilms with engineered thickness profiles are fabricated by tilted deposition, representing a waveguide-compatible approach to nano-fabrication, and inducing well-controlled resonances into the system, allowing unique dispersion control along the fibre length. Key features and dependencies are examined experimentally, showing improved bandwidth and spectral flatness via multiple dispersive wave generation and dispersion-assisted soliton Raman shifts while maintaining excellent pulse-to-pulse stability and coherence in simulations, suggesting the relevance of our findings for basic science as well as tailored light sources.
Research Summary
Supercontinuum generation: Spectral flattening by longitudinally varying resonances in fibres
Depositing nanofilms with a thickness gradient on the core of optical fibres enhances the spectral properties of supercontinuum light sources at low input power. A German-Australian research collaboration, led by Markus A. Schmidt from the Leibniz Institute of Photonic Technology (Leibniz-IPHT), Jena, proposed a tilted nanofilm deposition concept to create fibres with a longitudinally varying dispersion. The team optimised the geometrical nanofilm properties and investigated the underlying nonlinear dynamics. Their approach improves the spectral uniformity of the resulting nonlinearly broadened spectrum and extends the total realised bandwidth towards the infrared compared to fibres without the thickness gradient. In combination with the excellent spectral stability and coherence, the achieved properties make this class of light sources attractive for applications in medical diagnostics, biophotonics, environmental sciences, and metrology.


Rights and permissions
Open Access This article is licensed under a Creative Commons Attribution 4.0 International License, which permits use, sharing, adaptation, distribution and reproduction in any medium or format, as long as you give appropriate credit to the original author(s) and the source, provide a link to the Creative Commons license, and indicate if changes were made. The images or other third party material in this article are included in the article′s Creative Commons license, unless indicated otherwise in a credit line to the material. If material is not included in the article′s Creative Commons license and your intended use is not permitted by statutory regulation or exceeds the permitted use, you will need to obtain permission directly from the copyright holder. To view a copy of this license, visit http://creativecommons.org/licenses/by/4.0/.

 DownLoad: