


-
A grainy pattern formed in space when a laser beam strikes an object is called a speckle pattern. These patterns were considered a bane of holographers because the images reconstructed from the holograms were grainy. Several methods were investigated to reduce this deleterious effect. During the late 1960s, it was discovered that the speckle pattern carries information about the object and hence can be used for measurement1. The field of speckle metrology thus came into existence. Both speckle photography and speckle interferometry were investigated to measure the displacement and deformation of the objects. Unlike holographic interferometry, speckle interferometry can be configured to measure the components of the deformation vector. Early recordings were made on photo-emulsions (photographic plates or films) and the technique came to be known as speckle pattern interferometry2. Since it was possible to control the size of the speckles in the speckle pattern, electronic recording using a vidicon tube was attempted successfully and the technique was renamed as electronic speckle pattern interferometry (ESPI)3. When speckle patterns are recorded on a charge-coupled device (CCD) or a complementary metal-oxide-semiconductor (CMOS) sensor and manipulated digitally, the technique is known as digital speckle pattern interferometry (DSPI)3. Using ESPI/DSPI along with phase shifting, the deformation map of an object subjected to an external agency is obtained almost in real time. The technique is whole-field, extremely sensitive, and can be configured to obtain either in-plane components or out-of-plane component, or all the three components of the deformation vector simultaneously2,3,5−7. It has also been applied to the study of vibrating objects in both time-averaged and stroboscopic modes.
Material scientists, stress analysts, quality assurance personnel, product developers, and many others are interested not only in deformation but also in strain values. Strain measurements are the basis for predicting how long an object will perform without failure when subjected to certain external influences. There are several techniques for strain measurement, of which some are point-wise, and some are whole-field techniques. Shearography is a whole-field optical technique that has evolved both for qualitative and quantitative strain (difference quotient) measurements. When shear interferometry features are included in speckle pattern interferometry, the technique is known as speckle pattern shear interferometry (SPSI) or speckle shear interferometry (SSI) or simply shearography.
Shearography is a displacement gradient sensitive, full-field optical technique that is resilient to environmental disturbances and vibrations. It does not respond to rigid body translations. Because shearography is an almost common-path technique, the temporal coherence requirement is considerably relaxed. The experimental setup is simple and offers reduced sensitivity to fill the gap between DSPI and moiré techniques4. The first paper on shearography was written by Leendertz and Butters8, who validated the theoretical framework of shearography by comparing twist contours of a plate with those generated as moiré fringes from the holographically obtained displacement pattern and its shifted version. For shearing, a Michelson interferometric arrangement was used. This work was followed by publications on the visualization of strain fields and slopes, the use of different shearing methods, and some theoretical aspects of the technique9−47. Recordings were done on photo-emulsions and the information was extracted by Fourier filtering9,23,55. In 1980, Nakadate et al.20 reported the use of a video camera to record the slope contours of static and vibrating objects. In 1988, some publications reported the recording of object images on an electronic detector48−50. Thereafter, researchers continued with strain field visualizations, slope contours, and even curvature using both electronic and non-electronic detectors51−87. The importance of shearography as a tool for measurement and inspection inspired the organization of several conferences on this topic from 1987 to 2006. These conferences have attracted many researchers to present works demonstrating manifold applications such as nondestructive testing and evaluation (NDT&E), examination of large structures, particularly in aeronautics, and nondestructive testing (NDT) of art and cultural heritage objects. At the same time, there were many publications on theoretical aspects and applications of the technique88−279. The first application of phase stepping to obtain quantitative strain was reported by Steinchen et al.97. Many researchers have described the measurement of strain in their publications. In reality, shearography measures not the displacement derivative, but the difference quotient – an approximation to a derivative. If the shear is made very small for the difference quotient to approximate a derivative, the sensitivity decreases; for a vanishingly small shear there is no sensitivity. Several mobile and compact shearographic systems have been developed to perform NDT activities in an industrial environment127,182,202,210,214,215. After 2005, activity on this topic slowed, perhaps due to the fact that it had evolved as an inspection and NDT technique with several systems on the market. In spite of the maturity, some theoretical aspects continue to be explored, new applications have been developed such as NDT of micro-objects, and research on phase evaluation methods continues280−379. Several review articles226,265,314,360, review-like articles127,188,211,227,258,288,308 and two books237,353 have been published on shearography. It is interesting to note that there is renewed interest in developing shearography systems with and without multiplexing capabilities325,346,349−351,354,361−365,370−372,377−382,384−393.
As the technique evolved, it went through various names. The most common usage has been shearography, with some prefixes to it like digital shearography, TV-shearography, electronic shearography, laser shearography, and digital speckle shearography. In the beginning, shearography was called speckle-shearing interferometry and speckle-shear interferometry. However, some authors have called it electronic speckle pattern shearing interferometry152−154,157,163,220,255,269, digital speckle pattern shearing interferometry20,132,155,176, electronic speckle-shearing pattern interferometry57,140,194,196,251, digital shearing speckle pattern interferometry177,341,358, and digital speckle shearing interferometry116,145,149,167,186.
-
A typical experimental setup for shearography is shown in Fig. 1. It consists of a light source, typically a laser, an imaging system, a shear device placed either between the object and the lens or between the lens and the recording medium, and a recording medium such as photo-emulsion or a CCD/CMOS imager. The object is illuminated by a laser beam, and its image is formed on the detector via the shear device. Shearing causes a point on the object to be imaged as two points. Alternatively, two points on the object are imaged as a single point. A wave from one point acts as a reference wave to the wave from the second point; hence, there is no need for a reference wave. Between exposures, the object is subjected to an external loading that deforms the object.
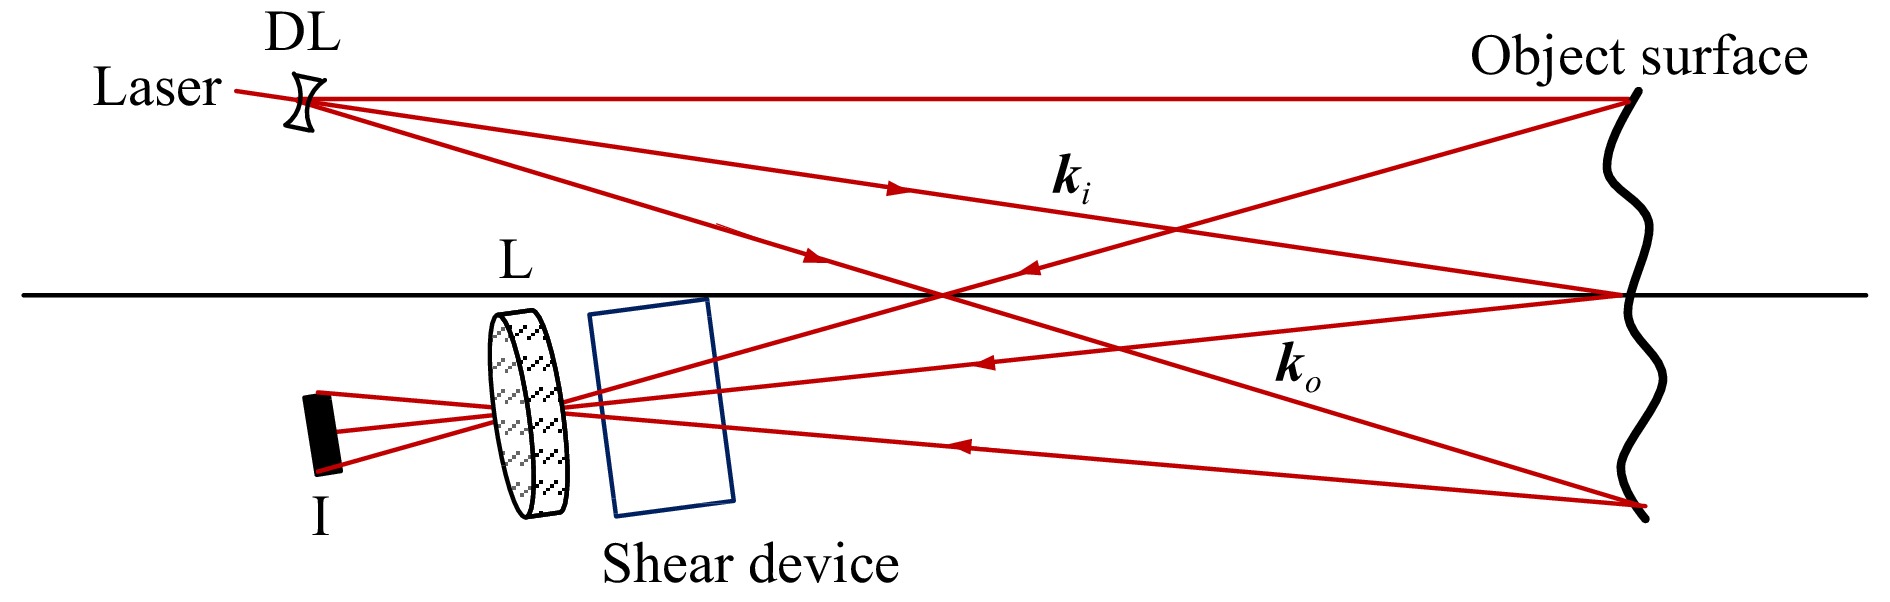
Fig. 1 Schematic of a speckle pattern shear interferometer: DL-diverging lens; L-imaging lens; I-image sensor.
The theoretical framework of shearography is based on the same phase difference equation that is valid for both holographic interferometry and speckle pattern interferometry2,3. The optical phase difference equation is given by7:
$$ \phi =\left({\boldsymbol{k}}_{o}-{\boldsymbol{k}}_{i}\right) \cdot {\boldsymbol{L}}={\boldsymbol{k}} \cdot {\boldsymbol{L}} $$ (1) where ko and ki are the propagation vectors in the directions of observation and illumination, respectively, and L is the deformation vector at a point on the object. The vector k [=
$ \left({\boldsymbol{k}}_{o}-{\boldsymbol{k}}_{i}\right) $ ] is called the sensitivity vector. The deformation vector is expressed as$ {\boldsymbol{L}}=u\hat{\boldsymbol{i}}+v\hat{\boldsymbol{j}}+w\hat{\boldsymbol{k}} $ with components u, v, and w along the x-, y-, and z-axes.In shearography, there are two points on the object under consideration: a point P and its sheared counterpart Q. On loading the object, these two points undergo different displacements, as shown in Fig. 2. The point
$ P\left(x,y,z\right) $ is on the undeformed surface, and the point$ Q\left(x+\Delta x,y,z\right) $ is on the sheared surface. These are very close to each other on the two surfaces with a lateral shear$ \Delta x $ along the x-axis. When the object is deformed, these points are displaced to their new locations$ P'\left(x+u,y+v,z+w\right) $ and$ Q'(x+\Delta x+ $ $ u+\Delta u,y+v+\Delta v,z+w+\Delta w) $ . Point P undergoes a displacement$ {\boldsymbol{L}}=u\hat{\boldsymbol{i}}+v\hat{\boldsymbol{j}}+w\hat{\boldsymbol{k}} $ and point Q undergoes a displacement$ {{\boldsymbol{L}}}'=\left(u+\Delta u\right)\hat{\boldsymbol{i}}+\left(v+\Delta v\right)\hat{\boldsymbol{j}}+\left(w+\Delta w\right)\hat{\boldsymbol{k}} $ . Therefore,$ \Delta {\boldsymbol{L}} $ , the change in the displacement vector, is given by$ \Delta {\boldsymbol{L}}={{\boldsymbol{L}}}'-{\boldsymbol{L}}=\Delta u\hat{\boldsymbol{i}}+\Delta v\hat{\boldsymbol{j}}+\Delta w\hat{\boldsymbol{k}} $ .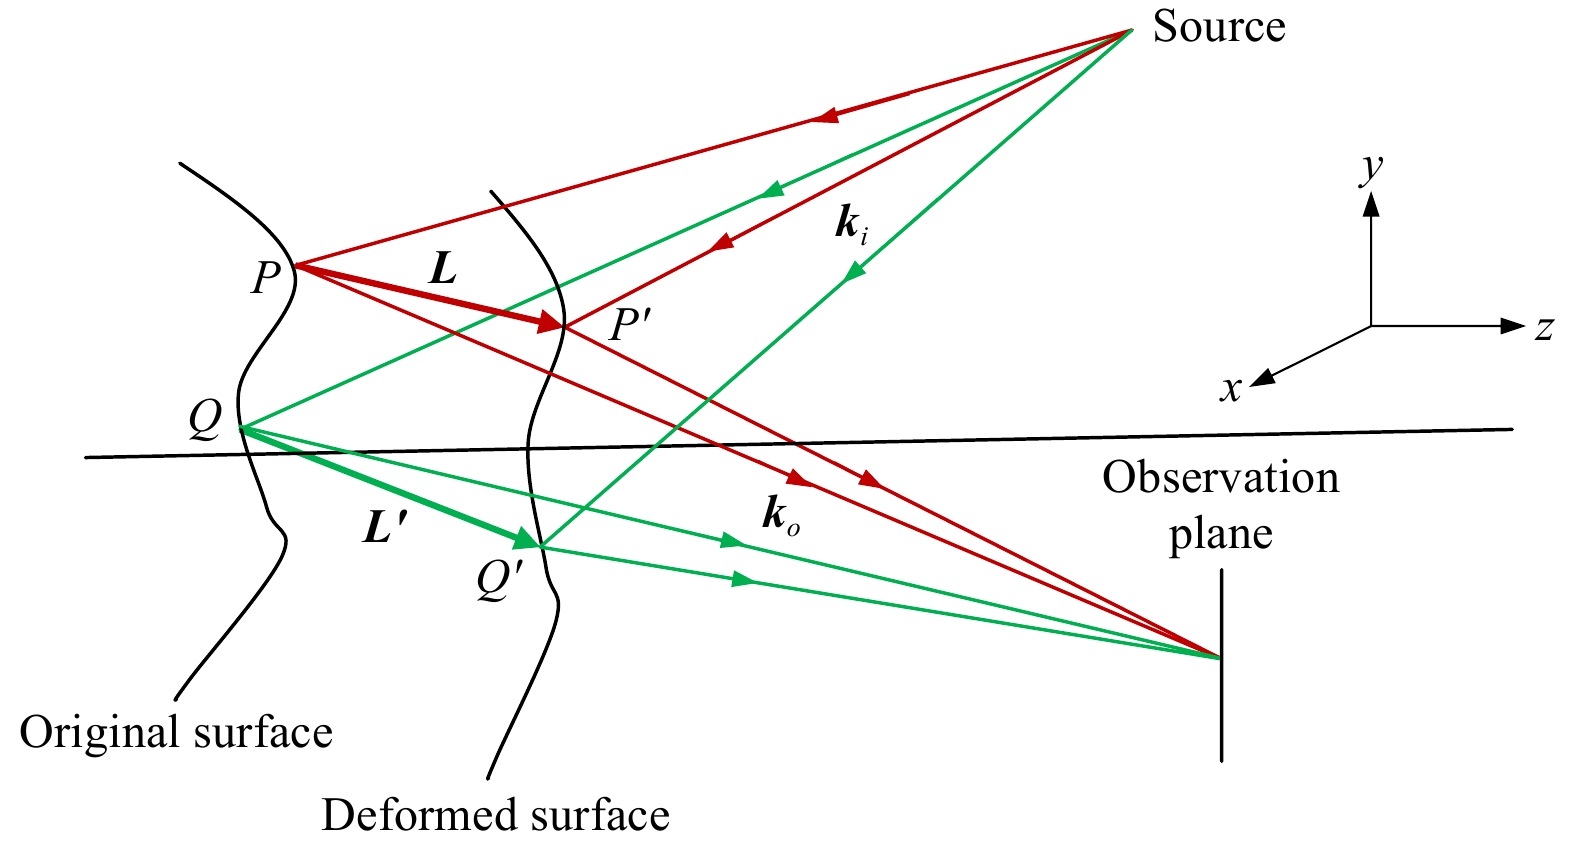
Fig. 2 Original and deformed states of the object showing the location of sheared points on deformation: P is a point on the surface and Q is its sheared counterpart.
On loading, these points displace to P' and Q'. Deformation is very small and hence sensitivity vectors remain unchanged.Following Eq. 1, the phase difference
$ {\phi }_{P} $ between the waves reaching any point on the detector plane when point P displaces to point P' is given by$$ {\phi }_{P}=\left({\boldsymbol{k}}_{o}-{\boldsymbol{k}}_{i}\right) \cdot \left(u\hat{\boldsymbol{i}}+v\hat{\boldsymbol{j}}+w\hat{k}\right)={k}_{x}u+{k}_{y}v+{k}_{z}w $$ (2) where kx, ky, and kz are the components of the vector
$ {\boldsymbol{k}}=\left({\boldsymbol{k}}_{o}-{\boldsymbol{k}}_{i}\right) $ , i.e.,$ {\boldsymbol{k}}={k}_{x}\hat{\boldsymbol{i}}+{k}_{y}\hat{\boldsymbol{j}}+{k}_{z}\hat{\boldsymbol{k}} $ .Similarly, the phase difference between the waves reaching the same point on the detector plane when point Q moves to point Q' is given by
$$ \begin{split}{\phi }_{Q}=&{\boldsymbol{k}} \cdot \left[\left(u+\Delta u\right)\hat{\boldsymbol{i}}+\left(v+\Delta v\right)\hat{\boldsymbol{j}}+\left(w+\Delta w\right)\hat{k}\right]\\=&{k}_{x}\left(u+\Delta u\right)+{k}_{y}\left(v+\Delta v\right)+{k}_{z}\left(w+\Delta w\right) \end{split}$$ (3) Calculations of the phases
$ {\phi }_{P} $ and$ {\phi }_{Q} $ in terms of the coordinates of the source and a point on the detector, and their respective distances, can be found in books237,353 and in several references19,265,314.Because the wave from the sheared point acts as a reference wave to the one from the other point on the surface or vice-versa, there is no need for a reference wave. These two waves produce an interference pattern. Indeed, waves from the scattering points within the resolution element around points P and Q interfere, producing a speckle at the image point. When the entire object is considered, its image is a speckle pattern. A record of the speckle pattern is called a shearogram. Let the amplitude of the waves from point P and point Q at a point
$ \left({x}_{i},{y}_{i}\right) $ at the image plane be$$ {a}_{P}\left({x}_{i},{y}_{i}\right)\propto {a}_{0}\left(x,y\right){e}^{i{\theta }_{P}} $$ $$ {a}_{Q}\left({x}_{i},{y}_{i}\right)\propto {a}_{0}\left(x+\Delta x,y\right){e}^{i{\theta }_{Q}} $$ Both the amplitudes [
$ {a}_{0}\left(x,y\right) $ and$ {a}_{0}\left(x+\Delta x,y\right)] $ and phases [$ {\theta }_{P} $ and$ {\theta }_{Q} $ ] are random variables. The irradiance distribution at the image point can be expressed as$$ \begin{split} &I\left({x}_{i},{y}_{i}\right)\propto {\left|{a}_{0}\left(x,y\right)\right|}^{2}+{\left|{a}_{0}\left(x+\Delta x,y\right)\right|}^{2}+\\&2{a}_{0}\left(x,y\right){a}_{0}\left(x+\Delta x,y\right) \cos\phi ;\phi =\left({\theta }_{Q}-{\theta }_{P}\right) \\I(x_i,y_i)=& {\cal{I}}_{1}\left({x}_{i},{y}_{i}\right)+{\cal{I}}_{2}\left({x}_{i},{y}_{i}\right)+2\sqrt{{\cal{I}}_{1}\left({x}_{i},{y}_{i}\right){\cal{I}}_{2}\left({x}_{i},{y}_{i}\right)} \cos\phi \\ =&{I}_{0}\left(1+\gamma \cos\phi \right) \\[-10pt]\end{split} $$ (4) where
$ {\cal{I}}_{1}\left({x}_{i},{y}_{i}\right) $ and$ {\cal{I}}_{2}\left({x}_{i},{y}_{i}\right) $ are the irradiances of the waves from points P and Q at the image point$ \left({x}_{i},{y}_{i}\right) $ , I0 is the total irradiance (sum of irradiances of both waves), and$ \gamma $ is the modulation. Because the two points P and Q are very close to each other, the amplitudes of the waves from these points can be assumed to be equal. In this case, the irradiance distribution can be expressed as$$ I\left({x}_{i},{y}_{i}\right)={I}_{0}\left(1+ \cos\phi \right) $$ Usually, two exposures are made in shearography: the first exposure when the object is in its undeformed state and the second exposure after the application of load, that is, when the object is in its deformed state.
The irradiance distribution in the first exposure can be expressed as
$$ {I}_{1}\left({x}_{i},{y}_{i}\right)={I}_{0}\left(1+ \cos\phi \right) $$ (5) On loading, the surface deforms, and points P and Q respectively move to points P' and Q'. The waves from points P' and Q' acquire additional phases
$ {\phi }_{P} $ and$ {\phi }_{Q} $ respectively.The irradiance distribution recorded now is given by
$$\begin{split} {I}_{2}\left({x}_{i},{y}_{i}\right)=&2{a}_{0}^{2}\left[1+ \cos\left\{\left({\theta }_{Q}+{\phi }_{Q}\right)-\left({\theta }_{P}+{\phi }_{P}\right)\right\}\right]\\=&{I}_{0}\left[1+ \cos\left(\phi +{\Delta \phi }_{QP}\right)\right]\end{split}$$ (6) where
$ {\Delta \phi }_{QP}=\left({\phi }_{Q}-{\phi }_{P}\right) $ is the phase difference between the two waves from points Q and P at a point on the recording plane. By rewriting the phase difference$ {\Delta \phi }_{QP} $ , we obtain$$\begin{split}& {k}_{x}\left(u+\Delta u\right)+{k}_{y}\left(v+\Delta v\right)+{k}_{z}\left(w+\Delta w\right)-\\&({k}_{x}u+{k}_{y}v+{k}_{z}w)={k}_{x}\Delta u+{k}_{y}\Delta v+{k}_{z}\Delta w \end{split}$$ (7) Assuming that the magnitude of the shear is very small, the phase difference can be expressed as
$$ \begin{split}{\Delta \phi }_{QP}=&\left({\phi }_{Q}-{\phi }_{P}\right)=\left({k}_{x}\frac{\partial u}{\partial x}+{k}_{y}\frac{\partial v}{\partial x}+{k}_{z}\frac{\partial w}{\partial x}\right)\Delta x\\=&\left({\boldsymbol{k}}_{o}-{\boldsymbol{k}}_{i}\right) \cdot \frac{\partial {\boldsymbol{L}}}{\partial x}\Delta x={\boldsymbol{k}} \cdot \frac{\partial {\boldsymbol{L}}}{\partial x}\Delta x \end{split}$$ (8) For a very small shear,
$ {\Delta {\boldsymbol{L}}}/{\Delta x} $ is expressed as$ {\partial {\boldsymbol{L}}}/{\partial x} $ . The phase difference depends on the derivatives of the components of the deformation vector if an exceedingly small lateral shear is used. In practice, the difference quotient is measured rather than the derivative. If the magnitude of the shear is made very small such that it approximates a derivative, the deformation phase$ {\Delta \phi }_{QP} $ tends to become very small, and hence the sensitivity of the technique becomes poor. It is possible to employ other shear types, e.g., radial shear and theta shear, and obtain the radial derivative$ \left({\partial w}/{\partial r}\right) $ 28,29 and the theta derivative$ \left({\partial w}/{\partial \theta }\right) $ 28,29.Although almost all publications discuss the theory of shearography along with other aspects, including applications, several papers are devoted only to the theoretical aspects of the technique70,71,76,166,168,224.
-
In photographic recording, the irradiance distributions I1(xi, yi) and I2(xi, yi) are recorded sequentially over a time period T. The recorded exposure E is expressed as
$$ E={E}_{1}+{E}_{2}=2{I}_{0}T\left[1+ \cos\left(\varnothing +\frac{{\Delta \phi }_{QP}}{2}\right) \cos\left(\frac{{\Delta \phi }_{QP}}{2}\right)\right] $$ (9) where T is the time of exposure. Thus, the record contains a speckle pattern modulated by
$ \cos\left({{\Delta \phi }_{QP}}/{2}\right) $ . The term$ \cos\left({{\Delta \phi }_{QP}}/{2}\right) $ carries the information of the derivative of the deformation vector that an object has suffered due to loading. This information, which is in the form of a fringe pattern, is extracted by Fourier filtering9,23,55. Usually, laser light is used for Fourier filtering, but in some cases, filtering can also be performed with white light55. The fringe pattern is speckled, and the fringes have a low contrast with a cos2-type distribution. The fringes can be sharpened by multiple exposures or by making use of the nonlinearity of the recording process31,33,36,48. The contrast of the fringes is improved using apertures in front of the lens, albeit at the expense of loss of light13,29,34,36.If the shearogram corresponding to the undeformed state of an object recorded on photo-emulsion is repositioned exactly after development, the deformation derivatives can be observed in real time as the object is deformed74,93. The theoretical framework of real-time shearography is similar to that of real-time holographic interferometry: there is a phase change of
$ \pi $ in the fringe pattern as compared to double-exposure shearography168. Real-time shearography has been used to determine fractional fringe order by the translation of a wedge plate110. Instead of recording a shearogram on a photographic plate, the use of photorefractive crystals is suggested for real-time shearography282. To extract information pertaining to$ {\Delta \phi }_{QP} $ , a doubly exposed shearogram is Fourier filtered9,13, resulting in a fringe pattern. These fringes can be sharpened by making multiple exposures or by making use of the nonlinearity of the recording process. -
In electronic recording, the two exposures corresponding to I1(xi, yi) and I2(xi, yi) are handled independently. In one processing method, the exposure corresponding to I2(xi, yi) is subtracted pixel-by-pixel from I1(xi, yi). The voltage output of the detector is proportional to [I1(xi, yi)-I2(xi, yi)]. The brightness on the monitor is proportional to the voltage output of the detector, and therefore it can be expressed as
$$\begin{split} B\propto \left[{I}_{1}\left({x}_{i},{y}_{i}\right)-{I}_{2}\left({x}_{i},{y}_{i}\right)\right]=&{I}_{0}\left[ \cos\phi - \cos\left(\phi +{\Delta \phi }_{QP}\right)\right]\\=&2{I}_{0} \sin \left(\phi +\frac{\Delta {\phi }_{QP}}{2}\right) \sin \frac{{\Delta \phi }_{QP}}{2}\end{split} $$ (10) For negative values of
$ \sin {{\Delta \phi }_{QP}}/{2} $ , the brightness on the monitor will be zero. To avoid this loss of signal, the output signal is squared before being displayed, and therefore the brightness B on the display monitor is expressed as$$ B\propto 4\;{I}_{0}^{2}{ \sin }^{2}\left(\phi +\frac{{\Delta \phi }_{QP}}{2}\right){ \sin }^{2}\left(\frac{{\Delta \phi }_{QP}}{2}\right) $$ (11) The term
$ { \sin }^{2}\left(\phi +{{\Delta \phi }_{QP}}/{2}\right) $ contains the random phase, and therefore it represents the speckled portion of the brightness distribution on the monitor, which is modulated by the term$ { \sin }^{2}\left({{\Delta \phi }_{QP}}/{2}\right) $ . There would be dark regions, called fringes, wherever$ {{\phi }_{QP}}/{2}=m\pi $ for integer values of m. Substituting for$ \Delta {\phi }_{QP} $ , we obtain the condition for the formation of dark fringes as$$ \begin{split}\Delta {\phi }_{QP}=&\left({k}_{x}\frac{\partial u}{\partial x}+{k}_{y}\frac{\partial v}{\partial x}+{k}_{z}\frac{\partial w}{\partial x}\right)\Delta x\\=&\left({\boldsymbol{k}}_{o}-{\boldsymbol{k}}_{i}\right) \cdot \frac{\partial {\boldsymbol{L}}}{\partial x}\Delta x={\boldsymbol{k}} \cdot \frac{\partial {\boldsymbol{L}}}{\partial x}\Delta x=2m\pi \end{split}$$ (12) The fringe pattern arises because of the gradient of the deformation vector. The fringe visibility depends on the correlation between the two interfering waves20,61,256.
It can be seen from Eq. 10 that the DC term is eliminated by the subtraction process. In another recording scheme, two speckle patterns with a phase difference of
$ \pi /2 $ are obtained simultaneously using polarized beam illumination for the deformed and undeformed states of the object122. Because the phase difference is fixed, a fast Fourier transform (FFT) can be used to eliminate the DC terms of the speckle patterns. In the early 1980s, TV cameras were used to record shearograms, but were followed by CCD and CMOS cameras. Ng and Chau examined the noise-related performance of CCD cameras used for shearography84. Osten et al.232 demonstrated that CMOS cameras produce better shearograms than CCD cameras, even for non-cooperative surfaces under examination. -
Let an object be vibrating sinusoidally with frequency
$ \omega $ and amplitude w. The average irradiance distribution Iav recorded over a period much longer than the period of vibration is expressed as9,63,123,155,226,265,348,366$$ {I}_{av}\left({x}_{i},{y}_{i}\right)={I}_{0}\left(1+\gamma \cos\phi {J}_{0}\left(\mathrm{\Omega }\right)\right) $$ (13) where
$ \mathrm{\Omega }=({4\pi }/{\lambda })({\partial w}/{\partial x})\Delta x $ when the observation and illumination directions are anti-parallel and the object is illuminated normally,$ \Delta x $ is the shear, and J0(x) is the Bessel function of zero order. The output from the CCD camera will be proportional to the irradiance distribution, and therefore the fringe pattern on the monitor will have a strong speckle background. Furthermore, the zero-order Bessel function causes only a few fringes to be observed. However, stroboscopic illumination circumvents this problem: the fringes are now cosinusoidal and the background can be removed by subtraction, as is done in the static case117,123,183. With stroboscopic illumination, the shearogram can be frozen at any instant of illumination by short stroboscopic pulses synchronized with the frequency of the vibrating object, and the phase-shift technique can be applied to obtain the derivative of the vibration amplitude155,197,251. Shearography with stroboscopic illumination and a large shear is used to measure small out-of-plane vibration amplitudes over a large range251. To measure transient vibrations, Hung et al.125 used a high-speed camera, and the images were stored in the memory of the high speed acquisition system.In another method to improve the visibility of time-averaged fringes, time-averaged shearograms are captured sequentially. The processor outputs a signal that produces the brightness on the monitor, which is proportional to86,120,162,226,314
$$ B\left(x,y\right)\propto {J}_{0}^{2}\left(\mathrm{\Omega }\right)\propto {J}_{0}^{2}\left(\frac{4\pi }{\lambda }\frac{\partial w\left(x,y\right)}{\partial x}\Delta x\right) $$ (14) The visibility of the fringes will be maximum where
$ {\partial w\left(x,y\right)}/{\partial x}=0 $ and will decrease rapidly as$ {\partial w\left(x,y\right)}/{\partial x} $ increases. Hence, a zero-order Bessel fringe will occur where the amplitude is maximum. The zero-order Bessel fringe can be shifted if one of the mirrors of the shearing Michelson interferometer is excited with the same frequency as that of the object86 or by using the scheme suggested by Valera and Jones120, Valera et al.124, and Chatters et al.107. The zero-order Bessel fringe can also be shifted by wavelength modulation135,162,314. However, this requires an unbalanced Michelson interferometer for shearing. It has been shown that a single Bessel fringe pattern obtained under subtraction operation could be sufficient to calculate the phase using a phase recovery method, based on genetic algorithms280. Methods for improving the visibility of fringes were described by Chen et al.226. For the study of transient vibrations such as those arising from impact, the use of a double-pulse laser is suggested185,220. Steichen et al.185 also mention the use of a double-flash CCD camera that may record two shearograms separated in the range of 100 ns to 50 ms. Procedures to use single-pulse shearography and double-pulse shearography for the study of vibrating objects were described by Spooren et al.80. Another study reported the use of a double-pulse laser for shearographic recording in which a carrier frequency is generated by changing the curvature of the illumination beam between the impact stressing of the metallic plates194,196,220. A procedure to measure damping using shearography was described by Wong and Chan195. A method that produces binary phase patterns where the phase changes are related to the zeros of the Bessel function is presented for estimating the vibration amplitudes from the shearographic fringe patterns366. -
As pointed out in the introduction, a speckle pattern interferometer can be configured to be sensitive either to an in-plane displacement component or an out-of-plane displacement component. The same is true for a speckle pattern shear interferometer, i.e., it can be configured to yield fringes pertaining either to the in-plane derivative (strain) or out-of-plane derivative (slope).
-
There are two distinct possibilities, as shown in Fig. 3a, 3b. In one arrangement, the object is illuminated by collimated beams lying either in the y-z plane or x-z plane, which are symmetric to the normal at a point on the object surface, and the observation can be along any direction but preferably along the normal to the surface.
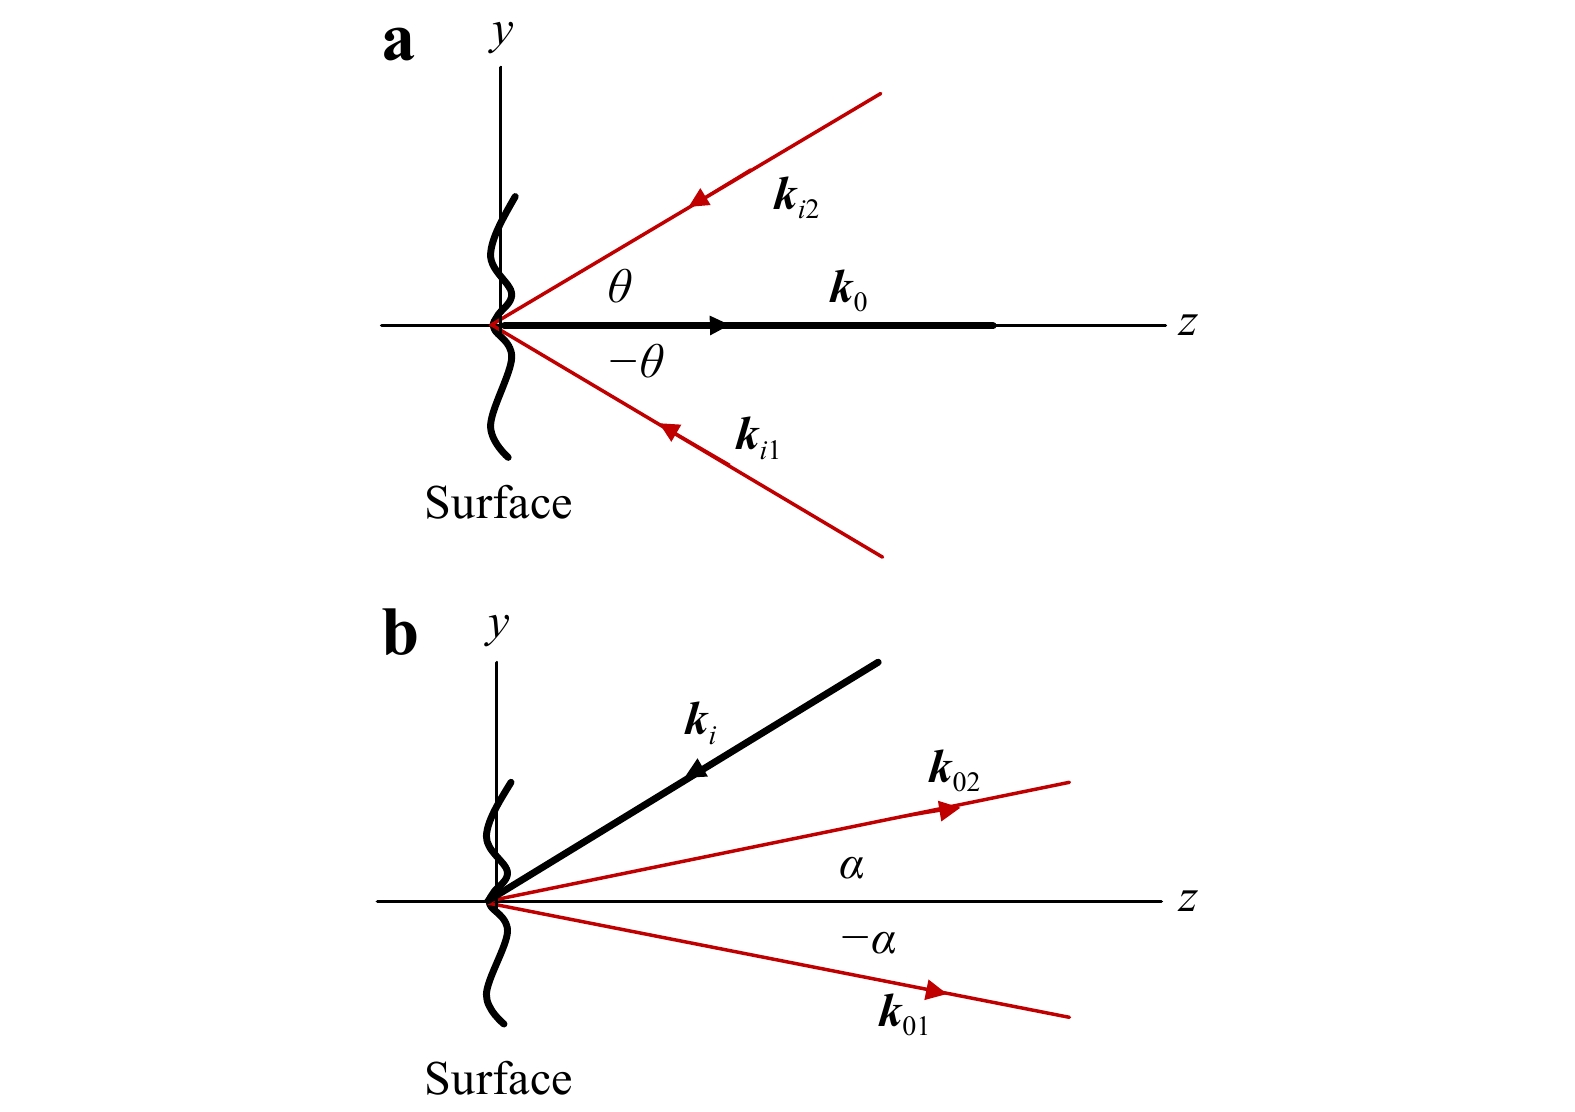
Fig. 3
a symmetric illumination directions, b symmetric observation directions.The formation of dark fringes in digital shearography is described by Eq. 12, which has been rewritten as
$$ \left({\boldsymbol{k}}_{o}-{\boldsymbol{k}}_{i}\right) \cdot \frac{\partial {\boldsymbol{L}}}{\partial x}\Delta x=2m\pi $$ (15) When two symmetric directions of illumination are used, as shown in Fig. 3a, the fringe formation is governed by
$$ \left({\boldsymbol{k}}_{o}-{\boldsymbol{k}}_{i2}\right) \cdot \frac{\partial {\boldsymbol{L}}}{\partial x}\Delta x-\left({\boldsymbol{k}}_{o}-{\boldsymbol{k}}_{i1}\right) \cdot \frac{\partial {\boldsymbol{L}}}{\partial x}\Delta x=2{m}_{1}\pi -2{m}_{2}\pi =2m'\pi $$ $$ \left({\boldsymbol{k}}_{i1}-{\boldsymbol{k}}_{i2}\right) \cdot \frac{\partial {\boldsymbol{L}}}{\partial x}\Delta x=2m'\pi $$ (16) where m' is an integer that takes values 0, ±1, ±2, ±3, ···. Assuming that the beams lie in the x-z plane and make an angle of
$ \pm \theta $ with the surface normal, then$ {\boldsymbol{k}}_{i1}={2\pi }/{\lambda } $ $ \left( \sin \theta \hat{\boldsymbol{i}}- \cos\theta \hat{\boldsymbol{k}}\right) $ and$ {\boldsymbol{k}}_{i2}={2\pi }/{\lambda }\left(- \sin \theta \hat{\boldsymbol{i}}- \cos\theta \hat{\boldsymbol{k}}\right) $ . Hence,$$\begin{split} \left({\boldsymbol{k}}_{i1}-{\boldsymbol{k}}_{i2}\right) \cdot \frac{\partial {\boldsymbol{L}}}{\partial x}\Delta x=&\frac{4\pi }{\lambda } \sin \theta \frac{\partial u}{\partial x}\Delta x=2m'\pi \to \to\\ \frac{\partial u}{\partial x}=&\frac{m'\lambda }{2 \sin \theta \Delta x}=\frac{\lambda {\Delta \phi }_{QP}}{4\pi \sin \theta \Delta x}\end{split} $$ (17) The sensitivity of the principal strain fringe pattern depends on both the magnitude of the shear and the angle of illumination. This method has been implemented experimentally in several ways, including using a Michelson interferometer136,152,164,187,206,236,345,351, a birefringent crystal133,211,265, a birefringent wedge160, and a Wollaston prism379 for shearing. When a wedge plate covers half the aperture of an imaging lens or when a two-aperture or multi-aperture mask with wedges is placed in front of an imaging lens, the recording contains information about the in-plane component along with the derivatives of the displacement. This has been studied by Ng and Chau75, Mohan et al.91, Mohan and Sirohi166, and Wang et al.224.
Similarly, if for a given direction of illumination, two directions symmetric to the surface normal are used for observation, the configuration is in-plane gradient sensitive. Assuming that the directions of observation lie in the x-z plane and make an angle of
$ \pm \alpha $ with the local normal, the fringe formation is governed by$$\begin{split} \left({\boldsymbol{k}}_{01}-{\boldsymbol{k}}_{02}\right) \cdot \frac{\partial {\boldsymbol{L}}}{\partial x}\Delta x=&\frac{4\pi }{\lambda } \sin \alpha \frac{\partial u}{\partial x}\Delta x=2m\pi \to \to \\\frac{\partial u}{\partial x}=&\frac{m\lambda }{2 \sin \alpha \Delta x}=\frac{\lambda {\Delta \phi }_{QP}}{4\pi \sin \alpha \Delta x} \end{split}$$ (18) In practice,
$ \theta $ can take values approaching 900, but the angle$ \alpha $ usually takes much smaller values limited by the lens aperture. However, the experimental arrangement can be configured so that angle$ \alpha $ can also take large values169,379,392.When the shear is along the y-direction and the beams are confined to the y-z plane, the y-gradient of the in-plane component under these configurations is given by
$$ \frac{\partial v}{\partial y}=\frac{m\lambda }{2 \sin \theta \Delta y}=\frac{\lambda {\Delta \phi }_{QP}}{4\pi \sin \theta \Delta y} $$ (19) and
$$ \frac{\partial v}{\partial y}=\frac{m\lambda }{2 \sin \alpha \Delta y}=\frac{\lambda {\Delta \phi }_{QP}}{4\pi \sin \alpha \Delta y} $$ (20) where
$ \Delta y $ is the shear. To realize this experimentally, an opaque plate consisting of several openings is placed before the imaging lens. Each opening carries either a shear plate, or a ground glass plate, or just a plate for compensation27,32,34,39,169. This arrangement generates the carrier frequency and is well adopted for Fourier filtering whether the recording is photographic or electronic. A three-aperture arrangement with one aperture carrying a wedge plate produces an in-plane fringe pattern and a combination of in-plane and derivative fringes166. The influence of in-plane displacement on slope fringes was examined by Mohan et al.91,166. It has also been pointed out that a single illumination direction will also give the in-plane derivative when loading is such that there is no out-of-plane deformation or there is a sequential illumination from two directions163. It has been mentioned that an in-plane sensitive configuration can be devised that yields all four in-plane strains independent of out-of-plane strains163. -
It is obvious from the phase difference Eq. 12 that the configuration will be sensitive to the gradient of out-of-plane deformation if the directions of illumination and observation are anti-parallel
$ \left({\boldsymbol{k}}_{i}=-{\boldsymbol{k}}_{o}\right) $ and are along the normal to the surface. In that situation,$$ \left({\boldsymbol{k}}_{o}-{\boldsymbol{k}}_{i}\right) \cdot \frac{\partial {\boldsymbol{L}}}{\partial x}\Delta x=\frac{4\pi }{\lambda }\hat{\boldsymbol{k}} \cdot \frac{\partial {\boldsymbol{L}}}{\partial x}\Delta x=\frac{4\pi }{\lambda }\frac{\partial w}{\partial x}\Delta x $$ (21) Hence
$$ \frac{\partial w}{\partial x}=\frac{m\lambda }{2 \Delta x}=\frac{\lambda {\Delta \phi }_{QP}}{4\pi \Delta x} $$ (22) When the shear is along the y-direction, we have
$$ \frac{\partial w}{\partial y}=\frac{m\lambda }{2 \Delta y}=\frac{\lambda {\Delta \phi }_{QP}}{4\pi \Delta y} $$ (23) Orthogonal slopes, or a slope with double the sensitivity and curvature, can be obtained using a four-aperture arrangement in which two wedges are appropriately placed at the two opposite apertures and compensating plates on the remaining apertures34. Sirohi and Mohan170 described a two-aperture configuration that is insensitive to in-plane deformation. This configuration is used to obtain the slope fringes. Using a similar configuration, the sensitivity to slope change was increased two-fold by coating the object with a retro-reflective paint181. It was shown that the visibility of the correlation fringes increases when the object surface is covered by a microsphere of 10.2μm mean diameter230. Using two CCD cameras in a Michelson interferometer for shearing, both
$ {\partial w}/{\partial x} $ and$ {\partial w}/{\partial y} $ are obtained for the same load on the object188. -
As shown in Section on optical configurations, we obtain the x-derivative of the displacement when the shear is along the x-direction and the object is illuminated symmetrically by beams lying in the x-z plane, and the y-derivative of the displacement when shear is along the y-direction with illuminating beams in the y-z plane. For a general direction of illumination and shear, e.g., along the x-direction, the phase difference contains information of all three x-derivatives of the displacement. However, if three different directions of illumination are used, it is possible to separate the three derivatives50,164,204,206,314. The same is true if three different directions of observation are used. Similarly, using a single direction of illumination and four directions of observation, and a single CCD camera, all three x- or y-gradients of the deformation vector can be obtained245. A speckle pattern shearing interferometer has been reported that uses three diode lasers of different wavelengths along with three CCD cameras for the determination of two-dimensional strain distributions201. Using three directions of shear, simultaneous measurement of derivatives of displacement in three different directions with phase-shift using Fourier processing has been demonstrated372. This method is cumbersome and uses six cube beam splitters. Correto and Perlo100 suggested the use of multiple laser diodes to illuminate the object surface uniformly, while Kalms and Osten239 used two mutually incoherent laser sources for illumination. More information about multicomponent configurations is provided in the section on multiplexing.
Thus far, the analysis has assumed well-defined directions for illumination and observation and a flat object. In practice, a real object is far from being a plane surface, and the illumination is usually divergent to cover a larger area for examination. These issues lead to errors in the measured values of deformation derivatives. The effect of divergence was examined by Abdullah and Petzing264. There are other factors such as the magnitude of shear, the sensitivity vector, the errors in phase-shifting and the rigid body motion that influence the measurement accuracy of the derivatives of deformation187. Many studies have considered these aspects in their theoretical works269,315. The creep of the PZT actuator on which the shearing mirror is mounted can change the magnitude of shear during the measurement, leading to an error332. A calibration procedure is described that accounts for the local variability of the magnitude of shearing and compensates for variability of the sensitivity vector344. Although shearography is said to be immune to rigid body translation, there is a decorrelation resulting in a decrease in the modulation of fringes. The effect of rigid body translation can be compensated with sandwich shearography, which combines shearography and sandwich holography54, and by flexible mirrors42. The in-plane rigid body translation is compensated by using a combination of speckle photography and shearography256. The shifting of the sensor by an appropriate amount, and digital shifting of the image, have been suggested to alleviate the effect of rigid body translation158. Furthermore, shearography itself has been used to obtain the deformation. To extract deformation from its gradient, the effect of doubling the image must be reduced137,138. When the phase distribution is spatially limited, it can be extracted from a single-sheared phase distribution287. In this study, out-of-plane deformation and its gradient were captured using ESPI and shearography, respectively. From the shearographic data, the out-of-plane deformation was reconstructed, and matched well with the deformation measured by ESPI. A shearography system was described that measures the orthogonal slope maps from which the deflection profile is generated343. A 2D deconvolution technique for images generated by a phase-stepped shearography system was described, which enables the extraction of quantitative displacement data from shearography phase change images161. Rosso et al.299 used holography to record an object on a photorefractive crystal, and the holographically reconstructed image was used as an object in a shearography setup for strain measurement. The technique of simultaneous coherent imaging and strain measurement by coupling photorefractive holography and shearography seems to have potential for depth-resolved strain measurement inside optically diffusing biological tissue.
Some researchers have examined the fringe formation due to static as well as vibratory load on an object with holography vs. shearography21,67,78,108,240,389, ESPI vs. shearography68,99,241,250, TV holography vs. shearography115,131,134,165,360, and digital shearography vs. electronic shearography281 when these techniques are used for non-destructive testing. Both the holographic interferometry and ESPI respond to deformation and show flaw-induced displacement anomalies in the fringe pattern, whereas shearography shows flaw-induced strain anomalies in the fringe pattern. Because their sensitivities are very different, they can be used sequentially.
-
The most commonly used arrangement for shearing is a balanced Michelson interferometer8,10,78,80,81,97,99,106,152,164,182,206,232,241,251,303,317,339. The object is imaged via two paths, and the shear is achieved by tilting one of the mirrors, thereby producing two images. The amount of shear is controlled by the angle of the tilt. Parker and Salter214 described a shearographic system in which a face of the cube beam splitter is mirrored, and a PZT-mounted mirror is used for shearing and phase-shifting. Thus, the system uses an unbalanced Michelson arrangement. They also described the limitations of this system. Instead of a Michelson interferometer, some researchers have used a Mach-Zehnder interferometer for shearing194,246,301,323,380,386,391. Many researchers have used a wedge plate17,19,27,32,34,41,58,60−62,93,97,170,181, a biprism20,71,75,76,90,111,171,280, parallel plates9,11, a plane parallel plate in reflection130,382, a wedge plate in reflection249, and Dove prisms24,25,28 in front of the imaging lens. A wedge plate in reflection provides both the shear and the carrier fringes for spatial phase-shifting. A plate with four openings at the corners of a square placed in front of the imaging lens results in sheared images at a defocused plane13,16,18. A single grating15,30,38,100,132, a Ronchi grating146,147, a cross-grating43, and a pair of gratings12,153,318 have also been used for shearing.
A holographically recorded lens has been used for both imaging and shearing37,331. A Savart plate14,143,202,321, a birefringent wedge plate160, a birefringent crystal68,133,139, a Wollaston prism122,148,177,179,262,341,358,369, and a single or double circular polarization grating329 along with the polarizers have also been used as shear devices. A right-angle prism with its diagonal face coated to separate the TE and TM polarizations along with a glass plate attached to it with an index-matching liquid followed by a liquid crystal phase modulator and a polarizer provides both the shear and the phase-shift295,299. A polarization-based shearing device results in an almost common-path speckle pattern shearing interferometer. A split lens obtained by cutting an imaging lens into two halves, one half of which can be shifted laterally or longitudinally, has been used for lateral shear as well as for radial shear22,23,28,29,33,57,58. The split lens provided laterally shifted images when one half was translated in its plane, and radially sheared images when translated longitudinally along the optical axis. A multi-segment lens was used to record the out-of-plane derivatives for different loadings26,33. However, split lenses or multi-segment lenses have not been used in practice because they are not commercially available. Instead, sheared images were obtained by placing a wedge plate over half the aperture of the lens19. In many cases, an opaque screen with two or several openings was placed before the imaging lens, and the shearing elements were placed appropriately over these openings17,24,27,34,39,181. By judicious choice, it was possible to obtain the slope and principal strains along the x- and y-directions from the same double-exposure shearogram. Details of various shearing arrangements are given by Sirohi et al.193. Radial shear was also achieved in a cyclic shear interferometer275. Several authors have used the 4f arrangement in a shearography setup to increase the field of view317,325,340,345,360,378,359,360. Falldorf et al.342 used an air wedge in a 4f configuration that provided variable shear. Zhao and Chung273 used a grating realized by an electrically addressable liquid crystal SLM.
Ganesan et al.49 described a shearing arrangement comprising two right-angle prisms instead of two mirrors in a Michelson configuration that can be used to introduce all five shear types. A microprism array placed in front of the camera lens was also used for shearing225. The amount of shearing was adjusted by changing the distance between the camera lens and the array. This arrangement was claimed to be light-efficient. Wong234 described a simpler shearing arrangement consisting of a mirror and a beam splitter. The arrangement suffered from magnification error but had the advantage that it can be turned into an ESPI set up by rotating the mirror. Mohanty et al.24 used a pair of Dove prisms in front of the lens to introduce rotational shear. Debrus14 employed a Savart plate between a pair of polarizers to obtain lateral shear. Joenathan and Buerkle121,153 employed a holographic grating followed by a ground glass for shearing, as did Mihaylova et al.247,274. Murty's130,382 plane parallel plate is a convenient shear element that can be used in reflection. The magnitude of the shear depends on the thickness, refractive index of the plate, and the angle of incidence; therefore, the shear is very difficult to modify. A convenient method in which an air parallel plate was created by two glass plates whose separation can be varied easily was adopted by Mihaylova et al.255,307 for shearing.
-
To study the response of an object, it is subjected to an external agency. As mentioned previously, the initial state (undeformed state) of the object is compared with the deformed state caused by loading. The objective of loading is to generate surface displacement gradients in the region where the subsurface flaws are to be detected. The response of an object to an applied load depends on several factors: the material, the size and location of the fault, the stiffness of the construction, and the type of load. However, the only free parameter in the experiment is the load. Consequently, its type and amount should be selected carefully207. A number of loading methods have been applied to study object response105,127,142,139,176,281,387. These are briefly described below.
-
This is the most commonly used method to obtain strain data as a function of stress, or to study the failure or fatigue response of a particular system under load. It has been applied to visualize strains, slopes, and twist, as well as for the quantitative measurement of strain, slope, twist, and crack detection8,11,23,40,145.
-
The object is placed in a chamber that is slowly evacuated, thereby creating a partial vacuum. It is suggested that the vacuum should be applied first to the sample, and a reference frame should be captured. Vacuum is then slowly bled off to create a pressure difference, and then successive frames/images are captured81. Vacuum stressing is the most effective method for detecting unbonds109 and impact damage on aluminum honeycomb structures104,182. Using vacuum stressing, the presence of debonds and delamination in composite and glass fiber reinforced plastic (GRP) laminates is easily visualized59,67,81,90,108,156,265. Self-adhesive vacuum stressing is used to test aircraft components and aircraft bodies210,232,233.
-
This is used to detect wall thickness defects and cracks in pressure vessels, pipes, etc. The object is subjected to internal pressure between the exposures or frames/images. Steinchen et al.118,176 used this method to detect and characterize microcracks in GRP pipes. It is also used to locate disbonds in GRP pipes112. This method has also been used to inspect power plant piping for corrosion defects90 and to detect programmed flaws in steel pipes149.
-
This is used to test laminated structures, honeycomb structures, and reinforced structures, and to locate skin-to-core debonds and cracks176. Heating is usually provided with infra-red lamps134,283,329, a hair blower61,182, or a heat gun151. Laser heating is used to test flat-bottomed hole specimens106 and a thin aluminum plate with a scratch at the back249. Impulsive thermal loading is used for crack detection in metal plates and pipes310, and purely thermal loading with a hair dryer is used to detect cracks on a composite turbine blade265. A thermal pad has also been employed for thermal stressing369.
-
Microwave heating is a special form of thermal loading that can easily detect the presence of water vapor trapped inside the object of study142. Microwave excitation causes moisture in the materials to heat up and thus induces highly localized deformation detectable by shearography. This mode of stressing is only applicable to nonmetallic composites.
-
Induction current or eddy current, which is produced by changing magnetic field, is used to heat materials and is currently being used for defect detection in NDT387.
-
Vibratory loading, in addition to studying the modes of an object, has been applied to test welded joints, debonds, and delamination. The object is excited either by a piezo-electric device107, a shaker85, or a vibration generator such as a loudspeaker339. Generally, the excitation frequencies are much higher than the resonance frequency for visualizing cracks, delamination, or disbands. Directed acoustical waves from a transducer appear to be promising for detecting fatigue cracks in metal plates368.
-
A transient load is applied with an electro-dynamic hammer (firing pin). The shock waves thus produced excite the defects246.
-
Phase shifting, either temporal or spatial, is employed when quantitative data are required about the strain field or defects. In many cases, phase maps are presented even for the visualization of gradients of the deformation vector. Temporal phase-shifting was first introduced in shearography by Owner-Petersen61, followed by Kadono et al.62. Present-day shearographic instruments are equipped with phase shifting. To obtain the phase values at each pixel a minimum of three irradiance values are required, with different phase values in a
$ 0\;{\rm{to}}\;2\pi $ interval. Some algorithms use more than three irradiance values. In temporal phase shifting, these irradiance values are captured sequentially by changing the phase difference between the interfering waves. If three phase steps are used in the interval$ 0\;{\rm{to}}\;2\pi $ such that the phase is stepped by$ 2\pi /3 $ , that is, the irradiance distribution in the interference pattern is captured at 0,$ 2\pi /3 $ and$ 4\pi /3 $ , then the phase$ \phi $ at each pixel is obtained from62,97,112,141,248,281,324$$ \phi ={\tan}^{-1}\frac{\sqrt{3}\left({I}_{3}-{I}_{2}\right)}{\left({2I}_{1}-{I}_{2}-{I}_{3}\right)} $$ (24) where I1, I2, and I3 are the irradiance distributions captured at the 0,
$ 2\pi /3 $ and$ 4\pi /3 $ phase steps, respectively. When four phase steps are used in the interval$ 0\;{\rm{to}}\;2\pi $ with a phase step of$ \pi /2 $ , the phase$ \phi $ at each pixel is obtained from61,105,179,197,202,265$$ \phi ={\tan}^{-1}\frac{\left({I}_{4}-{I}_{2}\right)}{\left({I}_{1}-{I}_{3}\right)} $$ (25) where I1, I2, I3, and I4 are the irradiance distributions captured at the 0,
$ \pi /2,\;\pi $ and$ 3\pi /2 $ phase steps, respectively. The phase$ \phi $ is a wrapped phase and must be unwrapped. Unwrapping poses no problem when the shear is small. However, there are situations in which variable shear is required to obtain a derivative map. Brug198,202 presented a method to obtain derivatives in real time using a Michelson interferometer for shearing and two CCD cameras, where shear varies with time.The five-step algorithm is also used because it is robust to noise and insensitive to calibration errors214. Wu et al.320 described a method of in situ calibration of phase shift by employing an additional optical element in the Michelson interferometer. Common phase-shift algorithms used in digital shearography were enumerated by Zhao et al.360.
The phase steps can be obtained by translating a PZT-mounted mirror97,111,176,338,339, or using a polarization-based phase-shifter160,202,209,275,284,295,305, or a liquid crystal cell62,265,273, or a Wollaston prism along with a liquid crystal cell305, or a Wollaston prism along with HiBi fiber wrapped around a PZT cylinder96,120,124,162,179, or a combination of a quarter-wave and a rotating half-wave plate275, or by translation of a diffractive optical element146,361 or by source wavelength modulation141,152,223. A lateral shift of the source with a PZT provides a phase shift that has been incorporated in phase-shift algorithms149. It has been shown that rotation of an object introduces an additional phase that varies linearly with the angle of rotation262. The rotation of the object has been used for phase shifting.
The temporal phase-shift method is susceptible to external disturbances, such as vibration, temperature fluctuation, or rapid motion of the test object itself. The spatial phase shifting (SPS) technique is a simple method to eliminate external disturbances. In spatial phase shifting (SPS), a carrier frequency is introduced such that there are three or four pixels between the fringes depending on whether a three-step or four-step phase-shift algorithm is used150,271,283. In one publication, a four-step error-compensating algorithm was used to generate the phase map271. Alternately, the Fourier transform method can be applied to obtain the phase difference between the undeformed and deformed states of an object325,326,345,351,372,377,380,382. It is desirable that the zeroth order and the desired first-order spectra should be separated. This determines the spatial frequency of carrier fringes. A shearographic setup in which a Michelson interferometer is embedded for shearing usually employs temporal phase shifting. However, it can be used for spatial phase shifting if a CCD camera with a sufficiently large number of pixels is employed325.
A study of the mode shapes of a turbine blade excited by a piezoelectric shaker at different frequencies was carried out by DSPI at a wavelength of 10.6 μm and by shearography at a wavelength of 532 nm to assess which of the two techniques could be used in an industrial environment348. Some interesting results were presented in this paper348. Measurements of the modal rotation fields of an engineering object, e.g., a beam with single and multiple damages, are obtained with shearography, and an optimal sampling technique is used to improve damage localization330,352,374. Because the sensitivity of shearography depends on the magnitude of shear, a numerical study of damage localization as a function of shear has also been reported355. A new method for structural damage identification using cubic spline interpolation has been described376. The method is based on the interpolation of modal rotations measured using speckle shearography. The signal-to-noise ratio (SNR) in shearography as a function of the magnitude of shear on the modal rotation fields has also been investigated356.
To study time-dependent deformations, it is better to capture information in a single frame. For this reason, the Fourier transform method for processing data is preferred. However, it requires a carrier frequency, so that various Fourier spectra are separated. Several methods have been proposed to provide carrier frequency in the shearogram47,53,82,126,194,196,222,301,330,370,372,382. Carrier frequency fringes are generated by changing the curvature of the illuminating beam before the second exposure or the second frame47,167,221 or by a small rotation of the object171. When a Mach-Zehnder interferometer is used as a shearing device, a parallel shift of the mirror introduces shear, and the rotation of the mirror produces the carrier frequency246,330. The use of multi-aperture with wedge plates in front of the imaging lens automatically creates a carrier frequency. Bhaduri et al.291,294 employed three-aperture shearography with two wedge plates to obtain a curvature phase map, and with a single wedge plate both the displacement and the displacement gradient using the Fourier transform method. Carrier frequency fringes have also been used for data reduction44,53, to locate and size the debonds in GRP plates69, to obtain surface coordinates and slopes73,159, to obtain flexural strains40, and to determine the order of a fringe47.
Joenathan et al.190 developed a method in which the object is deformed continuously, and a large number of sheared images of the object deformation are acquired using a high-speed CCD camera. The derivative of the object deformation is then retrieved from this large set of data using Fourier transformation190,272. This method is capable of obtaining information for object displacements over 500 μm. In another study, a continuous wavelet transform was applied to extract the phase change from a series of shearograms276. In addition to the Fourier transform and the windowed-Fourier transform methods of phase recovery from a shearogram, some researchers have demonstrated other methods such as the curvelet transform for edge detection328, Hilbert-Huang transform340, and wavelet transform358. A heterodyne shearographic system in which orthogonally polarized beams are frequency shifted by
$ \pm {\omega }_{s} $ is described for obtaining derivative information in real time341,358. Frequency-shifted beams illuminate the object, which is imaged through a Wollaston prism sandwiched between two polarizers on the CCD camera. The output of the CCD is a heterodyne signal over which the difference phase rides. The difference phase information is extracted using wavelet transformation and a proper filter. Andhee et al.260 carried out a comparative study of conventional and phase-stepped shearography. Conventional shearography is good for making qualitative observations in real time, while phase-stepped shearography delivers quantitative information161. A procedure to maintain sub-pixel alignment between shearograms obtained with a single camera in a polarization-based phase-stepped two-bucket shearing interferometer has been described267. The procedure was based on cross-correlating the two shearograms. A more recent paper discusses an improvement of the two-bucket shearing interferometer when dealing with the unfavorable polarization states that arise when a rough metallic surface is illuminated with a linearly polarized light284. Recently, a theory of surface phase-resolved shearography has been presented that considers speckle statistics and delivers less noisy specklegrams373. -
Separation of the in-plane and out-of-plane gradient components of the deformation of an object surface generally requires illumination of the object from three different directions or observation from three different directions. In spatial-division multiplexing (SDM), the object is illuminated from a single direction, and viewed simultaneously from three different directions through three shearing interferometers. The first attempt to obtain all three displacement derivatives was made by Hung and Durelli18. Sharma et al.32,41 used a three-aperture arrangement to obtain slope, curvature, and deformation. A similar arrangement was used by Bhaduri et al.294 using the Fourier transform method. They used the (1, N) spatial phase-shifting method to obtain derivative phase maps283. Filtering from the ±1 order halo from a doubly exposed shearogram, recorded with a holographic grating as a shear element, yields the slope and curvature fringes, and filtering from the ±2 order halo yields the slope fringes with double the sensitivity38. Speckle interferometry and speckle shear interferometry have been combined in a simple setup that uses four apertures39. Deformation, slope, and curvature fringes can be obtained by filtering from the appropriate halos. Iwahashi et al.43 used a cross grating to obtain three slope distributions simultaneously. Joenathan et al.26,33 extracted three out-of-plane derivatives from the same shearogram using a multi-segment lens for imaging. Barrera et al.365 used an aperture-based spatial phase-shift multi-shearing direction system to acquire information in three different shearing directions simultaneously. They used wedge plates appropriately oriented on the apertures; therefore, both the shear and the carrier frequency were not variable. Dymny et al.154 demonstrated a configuration that displays x- and y- derivatives simultaneously using two Michelson interferometers and two CCD cameras. The use of two CCD cameras and two shearing units to simultaneously obtain x- and y- derivatives is also recommended by Steinchen et al.176. Siebert and Schmitz203 used two CCDs to measure two orthogonal gradients simultaneously in a temporal phase-shift digital shearography system using two orthogonal polarization states. They also suggested that the two orthogonal gradients can be recorded sequentially on a single CCD camera using a liquid crystal cell as a fast polarizer.
Mohan et al.131 combined TV holography and shearography into a single setup such that the deformation map and the derivative map are displayed simultaneously, one above the other, on the monitor. This setup can be used to obtain the deformation and derivative maps for both static and vibratory objects. James and Tatam204 used sequential illumination of the object from three directions and a single CCD camera. The illumination was synchronized with the frame rate of the CCD camera. Each frame contains an image of an object when illuminated from one of the illumination directions. Kästle et al.201 used wavelength-division multiplexing (WDM) to determine two-dimensional strain distributions. They used three diode lasers to illuminate the object simultaneously with three different wavelengths, and the sheared object images in each wavelength were recorded by three CCD cameras. It was shown that using three directions of illumination and two orthogonal shears, all six derivative components can be measured164. A compact system based on this has been reported206. Groves et al.209,223 described a shearography system to measure two orthogonal slopes quasi-simultaneously using polarization multiplexing. They used an unbalanced polarization-sensitive Michelson interferometer to produce sheared images in orthogonal polarizations. They also described a multi-directional viewing configuration with one direction of illumination and a single CCD camera242,244. The images were transported by coherent fiber bundles to the CCD via a balanced Michelson interferometer. The quality of correlation fringes was very poor owing to decorrelation of the speckle patterns due to the influence of environmental variables on the fiber bundles. These authors reported another multi-component shearography system that can fully characterize the surface strain using time-division multiplexing of the measurement channels245. An application of this system to measure strains near a weld joint in a hydrostatically loaded pipe was presented. Francis et al.285,300,302 used a similar pulsed laser shearographic system to measure the surface strains on static and rotating objects. Groves et al.228,279 have also described a multi-directional illumination and single-direction observation system to fully measure surface strain. This system was used to measure crack length and surface strain.
A shearography system was described that employed colinear beams from three different lasers for illumination, a dichroic mirror in the Michelson interferometer, and a single CCD camera350. This provided shears along the x- and y-directions simultaneously and was used to obtain shearograms of the x- and y-derivatives of out-of-plane displacement simultaneously. Xie et al.354 described a polarization-based digital shearography system containing two Mach–Zehnder interferometers to record shearograms in two orthogonal directions simultaneously, and applied it for the NDT of honeycomb structures. Gao et al.380 described a shearography setup that employs a Mach–Zehnder interferometer for shear and spatial frequency generation for the simultaneous measurement of out-of-plane deformation and its first derivative. In a recent paper, Zhao et al.378 described a combined DSPI and shearography system that yields both the deformation and the slope phase maps simultaneously using Fourier transform processing. In the same paper, a system is described that uses three different lasers (blue, green, and red) to illuminate the object in three different directions, and a CCD with three chips responding to each color that yields 3D deformation and derivative phase maps using the Fourier transform processing. They also described another multiplexed system, similar to that described earlier380, which uses a Mach-Zehnder interferometer for shear and spatial frequency generation and a single CCD camera to yield the deformation and the derivative phase maps391. Instead of a spatial frequency carrier for generating the phase map from a single frame, a pixelated sensor was used381. A large number of shearograms were captured when the object underwent deformation. The spatiotemporal filtering algorithm in the complex domain was applied to these shearograms, and phase maps were obtained from the adjacent shearograms. Sun et al.375 described a system that uses a spatial light modulator (SLM) for both shear and phase shift. Another system used two apertures to generate the spatial frequency, and an SLM for shear385. The out-of-plane deformation and its derivatives were obtained using Fourier processing. Zhong et al.386 used two Mach-Zehnder interferometers in tandem to obtain gradients of deformation in two orthogonal directions along with a twist. Zhang et al.390 described a shearography system in which one of the mirrors of a Michelson interferometer is replaced by an SLM, which provides both shear and phase shift. It should be noted that SDM, WDM, and polarization multiplexing allow the capture of information of the derivatives and the deformation simultaneously, while TDM accomplishes this sequentially.
An optical arrangement is described in which an ESPI system can be converted to a digital shearography system by rotating one mirror of a Michelson interferometer by 45 degrees270. Thus, both the displacement and its derivative can be obtained sequentially. Another arrangement that uses a two-aperture screen in front of the imaging lens has been used to measure the out-of-plane displacement and slope sequentially271. Because of the two apertures, a carrier frequency is generated, and therefore Fourier processing is used to obtain the phase map. Several researchers have combined the ESPI/DSPI system and the shearography system into a single unit that can measure the deformation and its derivatives either simultaneously or sequentially99,134,175,270,326,339,378,391,392. A single-axis system that comprises a shearography system and a speckle photography system is described that measures two out-of-plane displacement gradients and four in-plane displacement gradients to fully characterize the surface strain268. The in-plane displacement component gradients are obtained by numerical differentiation of the in-plane components measured by the speckle photography system. Wang et al.370 described an optical configuration that uses a Wollaston prism for shear and can yield x- and y- slopes or x-slope and a radial slope simultaneously. The carrier frequency is provided by the tilt of a mirror, and Fourier transform processing is used to generate phase maps. Simultaneous measurement of deformation and its first derivative was demonstrated using the spatial phase shift method followed by Fourier processing326.
A common-path shearography setup was described for the simultaneous measurement of the in-plane and out-of-plane strain components under dynamic loading377, using two laser beams with different wavelengths that symmetrically illuminate the test object, a plane parallel plate for the shear, and a single CMOS camera. The phase was recovered from a single frame using Fourier processing. Another method to separate the in-plane and out-of-plane strains is to use a symmetric illumination configuration with a Wollaston prism as a shear element in which sequential recordings are made379. A recent paper describes the design and development of a high-speed shearography system and the measurement of surface strain during a high-speed impact on aluminum and composite samples393. This study also compares the performance of shearographic systems based on the Michelson and Mach-Zehnder interferometers.
-
The temporal coherence requirement for shearography is not stringent because polarization-based shearographic systems are nearly common-path and the path difference in a balanced Michelson or Mach-Zehnder interferometer is very small. A source of adequate temporal coherence is required only when an unbalanced Michelson or Mach-Zehnder interferometer is employed for shearing, and wavelength modulation is used for phase stepping. In general, a light source with adequate brightness, spatial coherence, and limited temporal coherence is needed for shearography to visualize the deformation gradients232. In an earlier study, it was demonstrated that the shearographic fringes were formed on the object even when the coherence length was only 5 mm80. Falldorf et al.238 employed a mercury arc lamp to study the deformation of an alloy strip that was mechanically loaded using a four-step phase stepping method. Wang and Tieu254 also described the use of a low-coherence source in shearography. A mercury lamp was used to measure the out-of-plane displacement derivative of a centrally loaded flat plate. In another study, two laser diodes without temperature stabilization were used in a shearographic system186. It is easier to integrate laser diodes in compact shearographic systems175. Further, for the examination of large surface area of an object and to overcome non-uniform illumination due to the Gaussian nature of the laser beam, the use of two or more mutually incoherent laser beams has been suggested239,357. The importance of using mutually incoherent sources is obvious from the photographs taken with illumination from two mutually incoherent sources and two mutually coherent sources, as shown in Fig. 4.
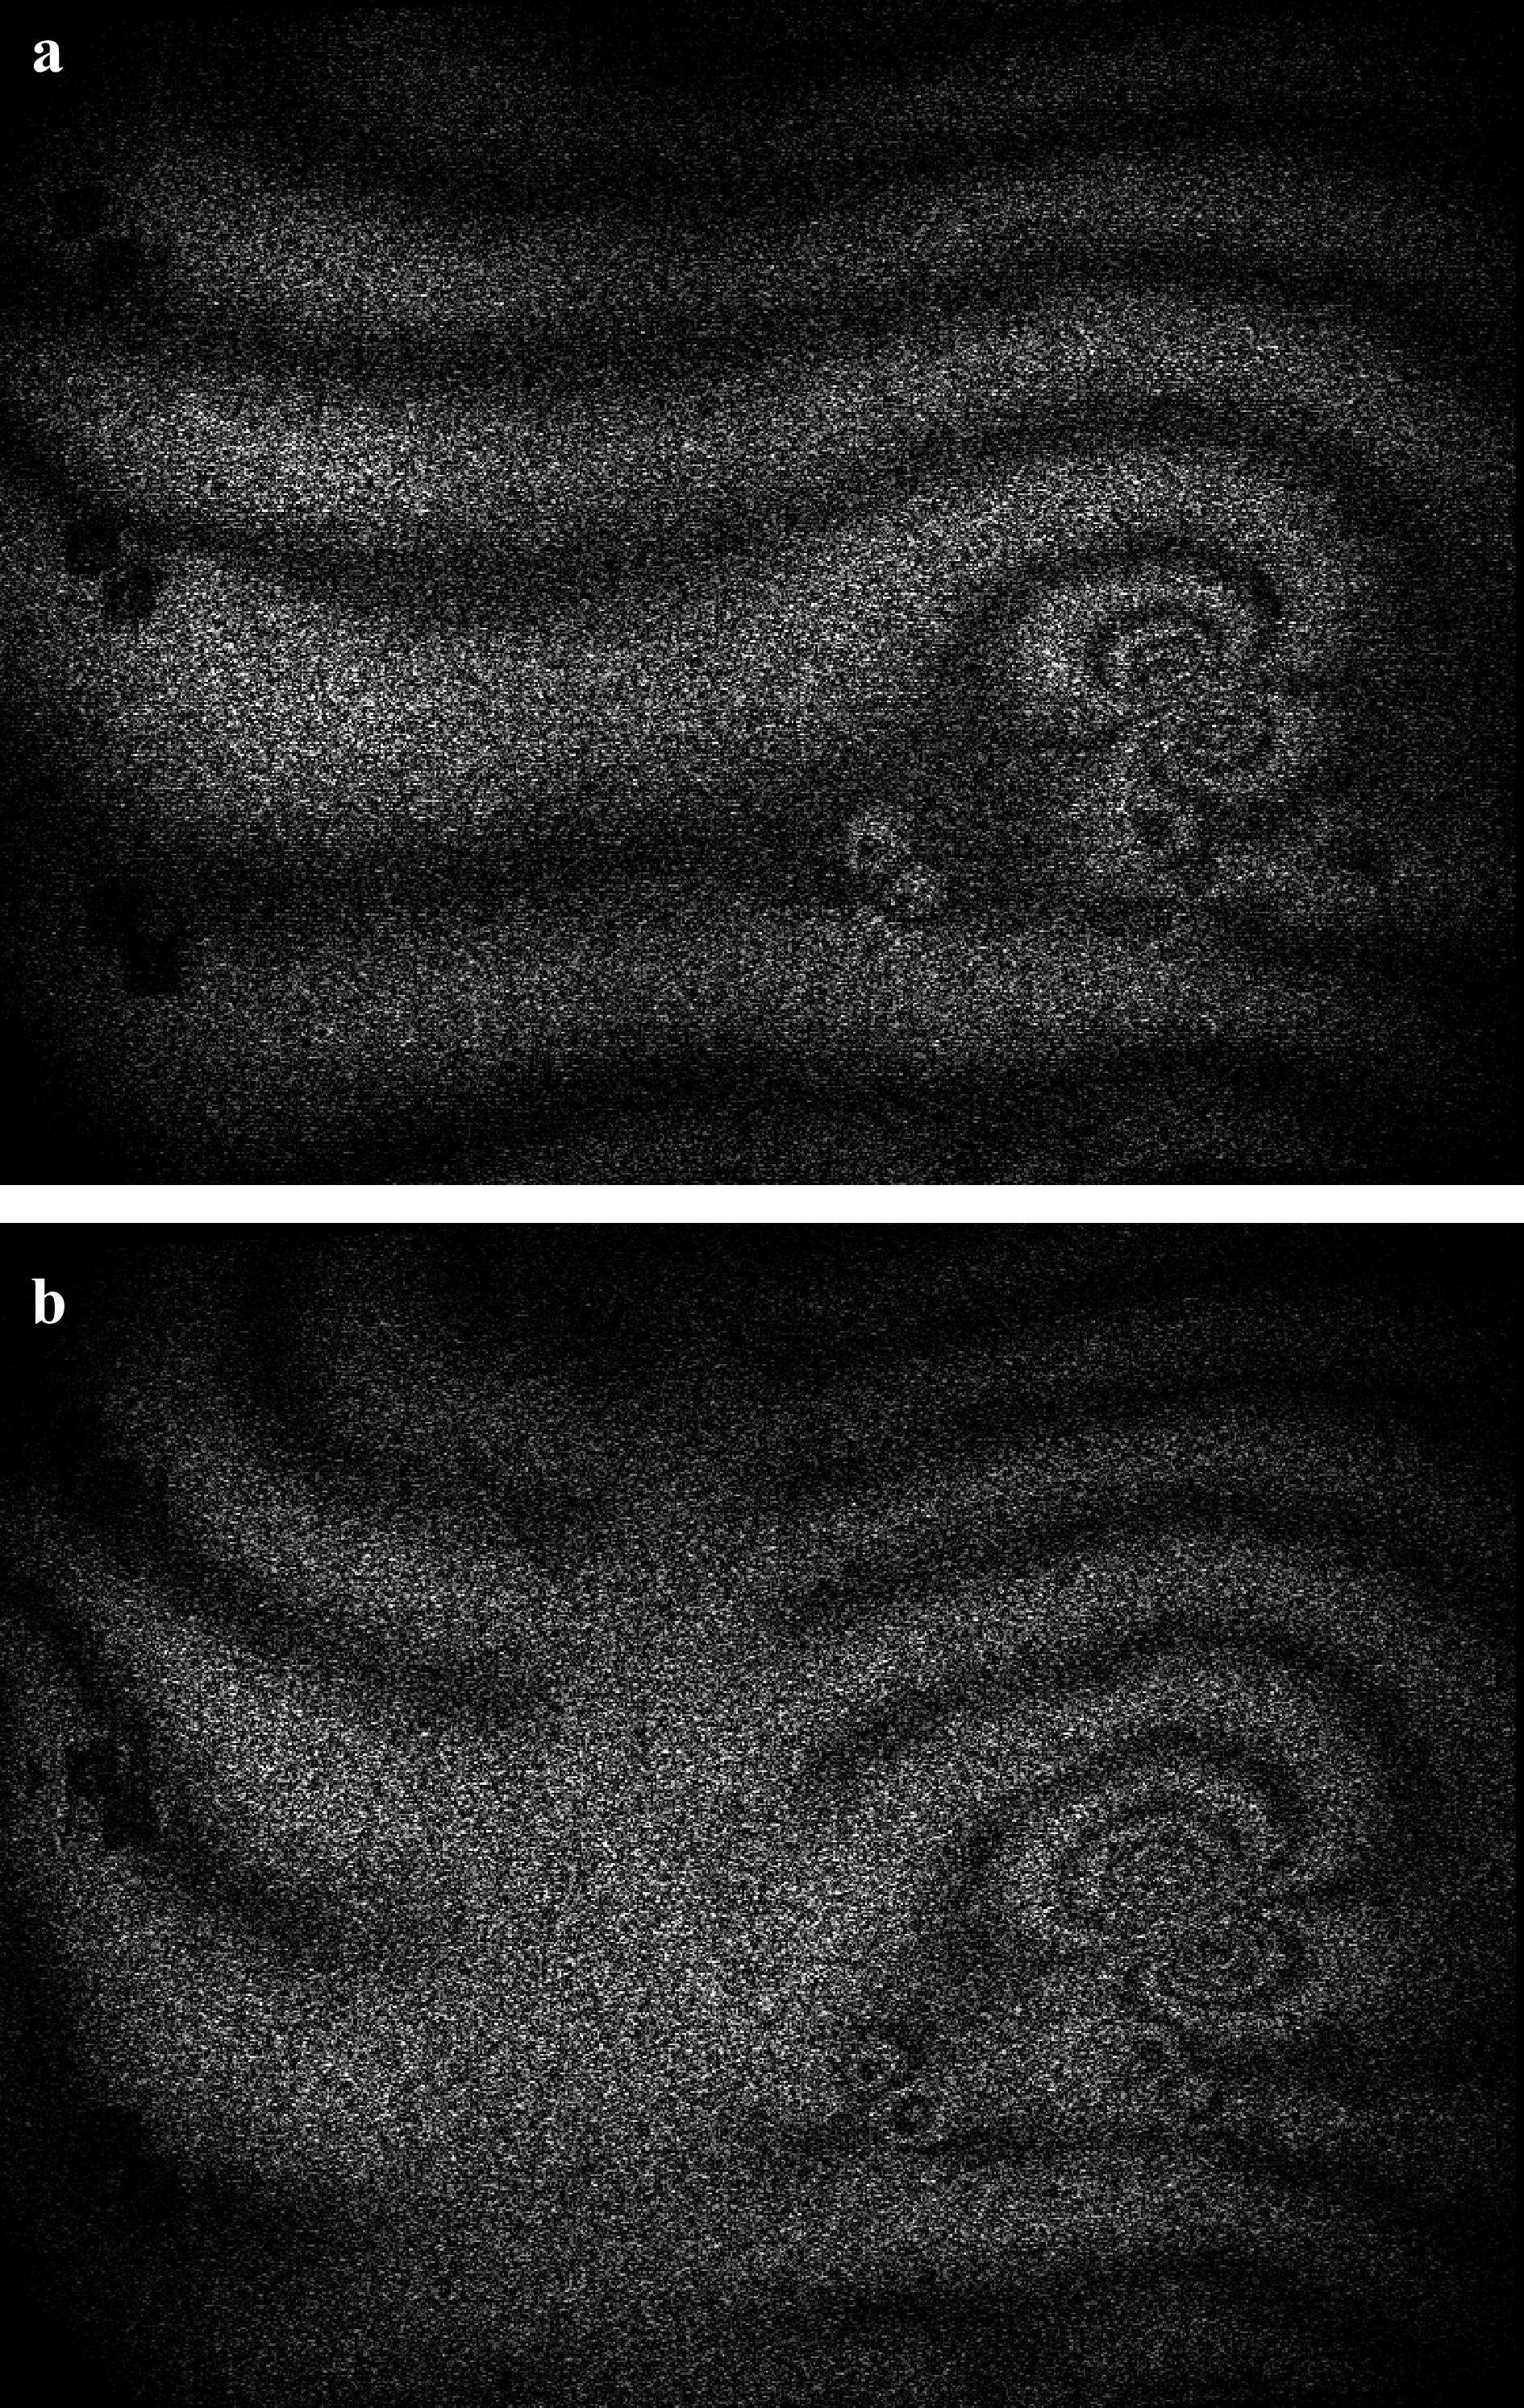
Fig. 4 Shearogram of a part of an Airbus A310 rudder side panel (1 m × 1.5 m), made with a two mutually incoherent sources, b two mutually coherent sources (Courtesy Prof. Osten).
-
Shearography is a non-destructive, full-field, non-contact inspection technique that is widely used as a qualitative tool for structural health monitoring, location, and identification of damage and defect sites. It has also been used to obtain quantitative data on strain fields and the location and size of defects. Some well-known applications of shearography are presented in this section.
-
Early work on shearography was to visualize twist contours8, derivatives of surface displacement9,10, in-plane strains13,164, slope contours11−17,20,22−29,32,34,36,40,153,160,169,170,181,191,361,365, slope of modal amplitude of vibration9,16,117, and curvature15,19,32,35,36,38,79 in plates, beams, and other objects. Slope contours are also obtained by (i) shifting the illumination source60,94,114,144, (ii) changing the wavelength113,174, (iii) changing the refractive index of the medium around the object17, and (iv) rotation of the object128,156,169,200 between exposures. These methods were reviewed by Shang et al.218. It has been pointed out that the generation of slope contours by the shift of the source is quite a complex procedure248. Another study showed the dependence of slope and shape determination on the direction of illumination286. Owner-Petersen61 used digital speckle pattern shear interferometry (DSPSI) for both qualitative and quantitative strain evaluation. It was commented that DSPSI is not useful for quantitative evaluation unless the space-bandwidth product is increased. It should be noted that the visualization of strain and slope continued even after photographic recording was replaced by video detection105.
With photographic recording, curvature fringes are obtained as a moiré of the slope patterns obtained with a three-aperture shearographic setup in which two outer apertures carry wedge plates32,34,35,41,119,235. In such a configuration, the displacement and its first derivative influence the curvature fringes235. Rastogi140 obtained the curvature and twist fringes by configuring an experimental setup using four mirrors. Murukeshan et al.205,229 used two Michelson interferometers in tandem to generate two overlapping slope patterns, thereby producing curvature fringes. In contrast to multiple imaging using a three-aperture shearographic setup, four exposures are sequentially made with the object laterally shifted after two exposures, thereby recording two shifted slope patterns that produce curvature fringes due to the moiré phenomenon95. A similar result would be obtained if the photographic plate was shifted in its plane after two exposures. It is shown that the curvature fringes can be sharpened by multiple exposures31,36,48,219.
-
Quantitative measurement of strain, slope, curvature, and twist requires the measurement of shear in addition to the phase measurement. Methods to obtain the magnitude of shear have been described by Ng116, Andersson et al.216, and Khaleghi et al.338. Steinchen et al.97,111,136,188 measured the in-plane strains and slopes of a cranked bar and a disc under compression using a four-step phase-shift algorithm and obtained values that closely matched the theoretical values. They also obtained time-averaged shearograms of a disc vibrating at different frequencies. Winther50 measured the strain in a pipe clamp. He et al.200 measured the slopes of various objects by rotating them between frames. Steinchen et al.97 described a method to obtain pure in-plane strain and pure out-of-plane gradient using a single direction of illumination. They also described another method using two independent directions of illumination111,212,236. A method to measure the derivative of the vibration amplitude was described by Valera et al.124,162 using a fiber-based speckle shear interferometer. The out-of-plane strain in a sandwich plate with full-potted inserts was measured using shearography and compared with analytically obtained results292,304. The greatest strains occurred in the vicinity of the boundary edge, but not at the edge.
Bhaduri et al.291 used a three-aperture arrangement along with Fourier transform processing to obtain curvature contours. Tay et al.263 obtained the first derivative of displacement by applying a temporal wavelet transform, and the second derivatives, curvature and twist, were extracted by applying a continuous Haar wavelet transform to a series of speckle patterns. Fu et al.322 captured a large number of frames of a continuously deforming object with a high-speed CCD camera and extracted the curvature and twist contours at any instant using Fourier and windowed-Fourier transforms. Balakrishnan et al.349 used a derivative-based phase tracker to retrieve the curvature and twist maps directly from a single shearography fringe pattern. The deflection, slope, and curvature contours of bent plates were generated computationally from the speckle patterns recorded in front of the plates before and after deformation383. Bhaduri et al.313 demonstrated a method to determine the curvature and twist of an object quantitatively using two-channel double-aperture digital shearography. The double-aperture mask produces spatial carrier fringes inside the speckle, and two channels of the system produce two sets of slope phase maps that are shifted to obtain the curvature and twist data. To measure the in-plane strains in orthogonal directions, a shearography setup uses two Michelson interferometers to create two shearograms, one in the x shearing direction and the other in the y shearing direction, which are recorded by a single CCD camera351. Two lasers with different wavelengths are used for illumination, and the windowed-Fourier transform is used to obtain the phase maps. For measuring the in-plane strains under dynamic loading, the same shearography setup was used, but with two CCD cameras345. A speckle strain gauge was developed with a gauge length of approximately a millimeter that was used to measure the biaxial strain and Poisson’s ratio of vinyl tape, polyvinylidene fluoride sheet, and rubber51,66. It was also used to measure the thermal expansion coefficients of several metals and non-metals.
-
Shearography is accepted as a powerful non-destructive testing technique, owing to its several unique features such as whole-field observation, resiliency to environmental disturbances and vibrations, low coherence requirement, simple optical setup, readiness for shop-floor applications, and ability to examine larger structures, albeit with tricky illumination. However, there are some critical issues to be considered when applying shearography for non-destructive testing83,134. An appropriate stressing method must be chosen so that the desired defect or flaw appears. The field of view and resolution are equally important for testing throughput. The sensitivity of shearography depends on the magnitude of shear. However, too large a shear results in speckle decorrelation because the technique does not remain common-path. Conversely, if a large shear is used, the derivatives become the relative displacements between two neighboring points on the object separated by a distance equal to the amount of shearing. The actual relationship between resolution and field of view is application-specific because it depends on the geometry of the test structure, the condition of the test surface, and the available laser power81,83. A method to detect flaws by measuring the first derivative and numerically obtaining the second derivative was proposed and demonstrated along with the influence of the magnitude of shear on flaw detection334. Theoretical and experimental investigations have been reported regarding the relationship between shear distance and performance issues, such as the immeasurable zone in the target with discontinuity, signal-to-noise ratio, sensitivity, and shear distortion303. Furthermore, it has been mentioned that by using a Wollaston prism for shear and 4f optical configuration, the shear can be varied over a large range384.
The first application of shearography to NDT appears to be credited to Hung21,240, who applied it to detect cracks in a pressure vessel, and ply separation in a truck tire. There are several publications on this topic originating from him and his research group, dealing with different aspects of non-destructive testing21,45,52,72,105,142,139,158,165,173,178,180,211,217,240,258,265,288,308,310. NDT has been applied for defect detection in plates and diaphragms23,27−29. It was observed that the theta shear vividly brings out defects when the deflection profile due to loading is circularly symmetric28. It has been shown that NDT of difficult-to-reach objects can be conducted by transmitting the sheared images through a coherent fiber bundle to the detector58,252. Kim et al.241 used it to detect internal cracks in pressure pipelines by applying pressure loading. When the magnitude of the shear was smaller than the crack length, shearography predicted its length correctly. When the shear was larger than the crack length, shearography overestimated the length. In contrast to the detection of disbonds, shearography offers less promise for locating and sizing fatigue cracks in riveted aluminum aircraft skins81. Shearography is used to estimate the size and depth of disbands in GRP plates59,67 and helicopter rotor blades184,243 using vacuum stressing. Time-averaged shearography is used to estimate the size of flaws in 2-ply and 4-ply beams63. Shearography offers identical inspection capabilities for aircraft both in production and in the field103,109,127,202,210,215,239. It is used to detect cracks and disbands in skins77,81,104, debonds in lap joints77, debonds in fan cases109, disbands in skin panels85, corrosion in aluminum and composite honeycombs107 and poor or improper repairs, and impact damage to epoxy graphite or thermoplastic aircraft structures103,127,189. Inspection of test panels that simulated Boeing 727 and 737 fuselage construction was carried out using shearography77,103. The panels contained defects that represented problems specific to aircraft aging. Principal component analysis (PCA) is incorporated into shearography in which a series of phase maps of a sandwich structure with defects at various depths are obtained as the temperature decreases336. PCA improves the defect detection capability of shearography. A good description of the use of shearography to conduct NDT of composites is provided by Newman363.
Several groups have used compact and mobile shearographic systems for the inspection of aircraft structures64,103,127,189,202,210,214,215,239,243,250,261,293. A tripod mounted system is used to inspect (i) honeycomb structures, (ii) monolithic FRP structures, and (iii) metallic structures using 3-step and 4-step phase-shifting, and all known methods of stressing127. Another mobile shearography system using two CCD cameras with Savart plates in front of them and phase-shifting by a PZT-activated mirror is described, which captures 25 frames per second143. This system and its improved version are used for defect detection in aircraft materials202. It records the phase-stepped images simultaneously and performs better in a hostile environment than a system that is sequentially phase-stepped. A shearography system was developed for comprehensive testing of aircraft structures and was used to inspect the rudder of Airbus aircraft for delamination and debonding using vacuum stressing210,215,239. The sensing system is tripod mounted, and uses a Nd:YAG laser at 532 nm which is also tripod mounted. Fig. 5a shows a rudder shell from an Airbus A310, constructed from CFRP-Honeycomb, with marked fault regions that were tested by shearography. Fig. 5b is the shearogram obtained with thermal loading, and Fig. 5c is the demodulated phase map.
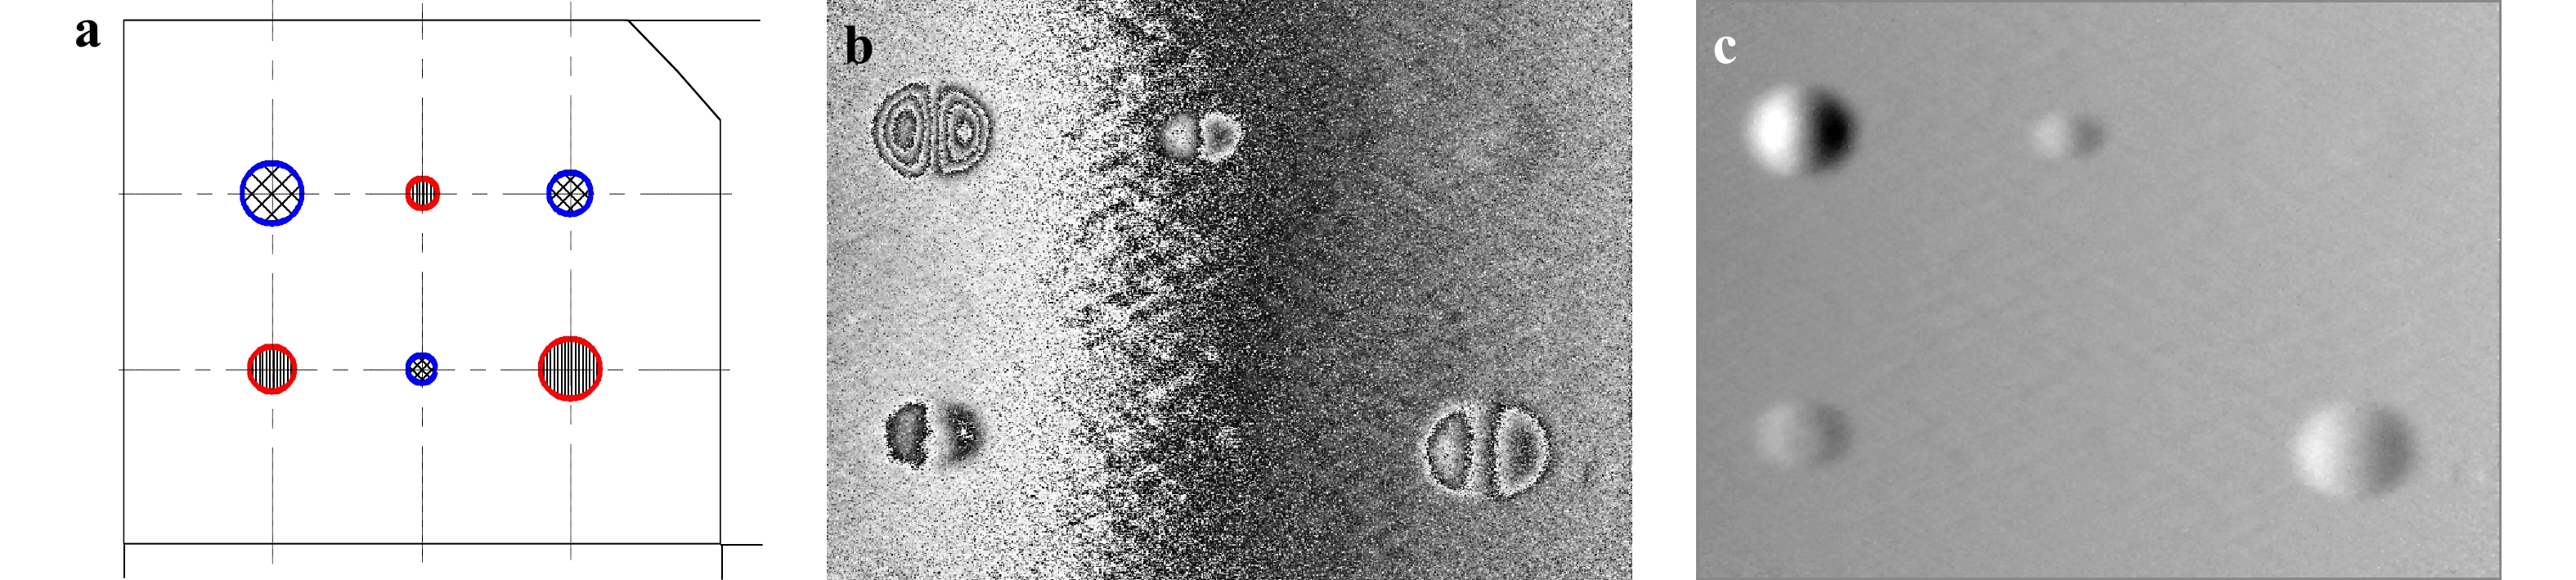
Fig. 5 Shearographic testing of an aircraft panel (500 mm × 500 mm) using thermal load
a A310 rudder shell, CFRP-Honeycomb, with marked fault regions, b shearogram after thermal loading, and c demodulated phase map (Courtesy Prof. Osten).Surfaces with non-optimal reflectivity are referred to as non-cooperating surfaces. In most cases, they can be treated with paint. However, when any such treatment is forbidden, other optical solutions are employed, such as the use of diffusers and multiple laser diodes215,333. The important features of the shearography system are its ability to deal with non-cooperating surfaces and the fringe processing system that outputs excellent final results215. The shearography system is used on the shop floor to test aircraft components and whole aircraft at a maintenance facility215,232,233,239, and for testing automobile components such as CFRP cross bars for internal imperfections232,239. For testing large objects, the use of two mutually incoherent lasers or two mutually incoherent beams derived from the same laser is suggested239. Comparison with ultrasonics and thermography favors shearography as a versatile inspection technique in industrial settings due to its full-field access, robust mode of operation, and fast delivery of results. The design details of a lightweight mobile shearography system that uses a diode laser for illumination along with its applications for the inspection of aircraft components and systems are given by Kalms and Jüptner261 and by Kalms293. In another comparative study, shearography was found to be the preferred technique for reliable detection of manufacturing or in-service defects such as disbands and impact damage of aircraft structures278. Shearography was applied for surface strain measurements of a hydrostatically loaded ABS pipe, and the values obtained were compared with those obtained by Bragg gratings and resistance gauges289. In a very specific study to detect defects in thin mirrors, shearography was compared with deflectometry335. It was observed that the deflectometry delivered better results. In another study, a specular reflecting surface was illuminated with scattered light illumination, and shearograms with good contrast were recorded371. This work advanced the application of shearography for NDT of non-cooperating objects.
Shearography has been used to detect microcracks in poly methyl methacrylate (PMMA)148, foam-adhesive bonded metal laminates108, GRP pipes176,281, internal cracks in pressure pipelines241, and fatigue cracks in titanium Ti-10-2-3 alloy279. Inspection of horizontal stabilizer and aileron for delamination with vacuum stressing, radome for delamination, and rotor blades for debonds with thermal stressing has been reported182. It has also been shown that post-processing of the shearogram presents flaw details better against a fringe-free background. A helicopter rotor blade with induced defects at different depths was inspected with shearography using an infrared lamp250,297,298. It was observed that the number of fringes in the characteristic bulls-eye pattern decreased with the depth of the defect. Another interesting observation was that the fringe pattern in the shearogram of two partially overlapping identical disbonds was visually similar to that from a single disbond288. A comparative study of NDT of composite materials with shearography and thermography has been reported151,180,288,319. Shearography is employed to inspect power plant pipes for defects arising from corrosion90, pipes in the chemical industry145, automobile dashboards, and some components used in aircraft and helicopters90. It has been used to test for debonds on external tanks and rocket boosters of space shuttles at the Kennedy Space Center98,102.
Defect detection using TV-holography and shearography can be very fast, but the depth and size of the defect are difficult to determine accurately. Conversely, ultrasonic techniques can characterize the defects in detail, including both the shape and depth, but they are slow. This observation is based on NDT carried out on a glass-reinforced plastic plate with programmed voids134. Assuming thinning of thickness of an aluminum plate as a diaphragm on a rigid boundary, shearography is applied to characterize this193,199. Shearography provides a rapid method to check the hermetic seals of microelectronics packages for leaks178. It has also been used to measure strains in electronic power devices under normal operating conditions221. Indeed, it is a versatile technique for quantitative measurement of vibration amplitudes and for non-destructive testing257.
Hung173,211 carried out testing and evaluation of composites using shearography. Hung et al.217,240 evaluated the soundness of bonding in laminated composite structures using vacuum and vibratory stressing and carried out NDT of an adhesively laminated plate using vacuum stressing. Shearography can be used either in a fringe mode or a phase map mode for non-destructive testing in real time324. The phase map mode is more sensitive than the fringe mode for defect detection. Several algorithms for obtaining phase maps have been demonstrated for real-time NDT. An endoscopic shearography system to inspect the inside of cylindrical surfaces for defects was recently reported362. This system with radial sensitivity is used for the inner inspection of adhesion faults in composite material pipes. A novel shearographic system in which the image is transmitted through a rigid endoscope is used for NDT of a turbine blade in an automobile turbo-charger, and also of laminates252. Recently, shearography has been used to inspect metallic parts reinforced by GRP387, and to detect the shape and size of defects on metallic substrates under composite repairs388.
-
For the measurement of residual stress, stress relief is achieved either by drilling a blind hole or by making a micro-indentation on the object surface. The change in stress will result in a change in the in-plane and out-of-plane displacements, which is detected by shearography129. This technique has been used to measure residual stress in plastic and reinforced materials65,208, concrete88, and composites208. For almost real-time presentation of the results, the recording was performed on a thermoplastic material and the stress was relieved by indentation56. A large shear arrangement has been used in the determination of residual stresses using ball indentation46,142,171,172,211,265 and shallow blind hole-drilling65,88,172,208. Viotti et al. described a portable shearographic system to measure residual stresses by means of a hole drilling technique based on a compact in-plane interferometer with only one symmetrical dual-beam illumination277.
-
A shearography system developed by Kalms et al.210 and Osten et al.215 was used to explore the structural robustness of XVII century Byzantine icons231. In another program, a shearography sensor was developed along with an impact assessment procedure (IAP)290. The sensor was used to detect defects in wooden panel paintings and canvas paintings using thermal stressing. A tripod-mounted system was used to examine paintings in the Benaki Museum, Greece233. Extended dynamic range (EDR) imaging technology has been implemented in a shearography system296. EDR imaging in shearography offers several benefits such as low noise in phase maps, less effort in aligning the illumination beam, and the use of multiple camera shutter speeds. EDR imaging shearography is also used to detect defects in wooden panel paintings and canvas paintings using thermal stressing. In another study, terahertz technology was combined with shearography with thermal loading for defect detection in wooden panel paintings306,311. To gain an understanding of the appearance and classification of faults in complex anisotropic objects such as artwork, finite element method (FEM) simulations along with shearographic measurements are carried out367. By comparing the simulations (different parameters) with the measurements, the depth and width of the faults can be determined with an accuracy of approximately 200 μm and 1,000 μm respectively. The shearography sensor provides surface and sub-surface information about the artwork, and the terahertz imaging sensor provides information about the bulk of the sample. The work on art conservation is further enhanced by incorporating virtual reality in shearography so that a user can remotely interact with the artwork312. Researchers have demonstrated that the false height in virtual reality can be used to display shearography displacement gradient maps. This technique allows the user to view both the displacement gradient measurements and the original colors of the painting.
The effect of environmental variables such as temperature and humidity on oil-on-canvas paintings has been studied continuously over a period of 30 hours in a museum; significant activity was observed when the temperature varied from 73.5 0F to 75.9 0F and humidity from 46.6% to 49.8%338. Using a combined DSPI and shearography system, the restored art objects were examined with acoustic loading over a range of frequencies to detect delamination and defects339. An important factor in detecting delamination, cracks, and holes in artworks, particularly paintings, is the type of loading employed. For example, thermal loading reveals trapped humidity, trapped air, and delamination. Acoustic loading has been used to detect delamination. A detailed description of various types of loading techniques, such as pressure, temperature, humidity, and vibration, and their influence on the sensitivity of flaw detection on wooden and canvas paintings, was provided by Buchta et al.346. Fig. 6 shows a painting on canvas of size 290 mm × 250 mm with a narrow wooden frame. It is illuminated with a green laser beam and the double-exposure shearogram is displayed on the monitor, showing a defect in the center. Thermal stressing using infrared lamps was used as a method of excitation.
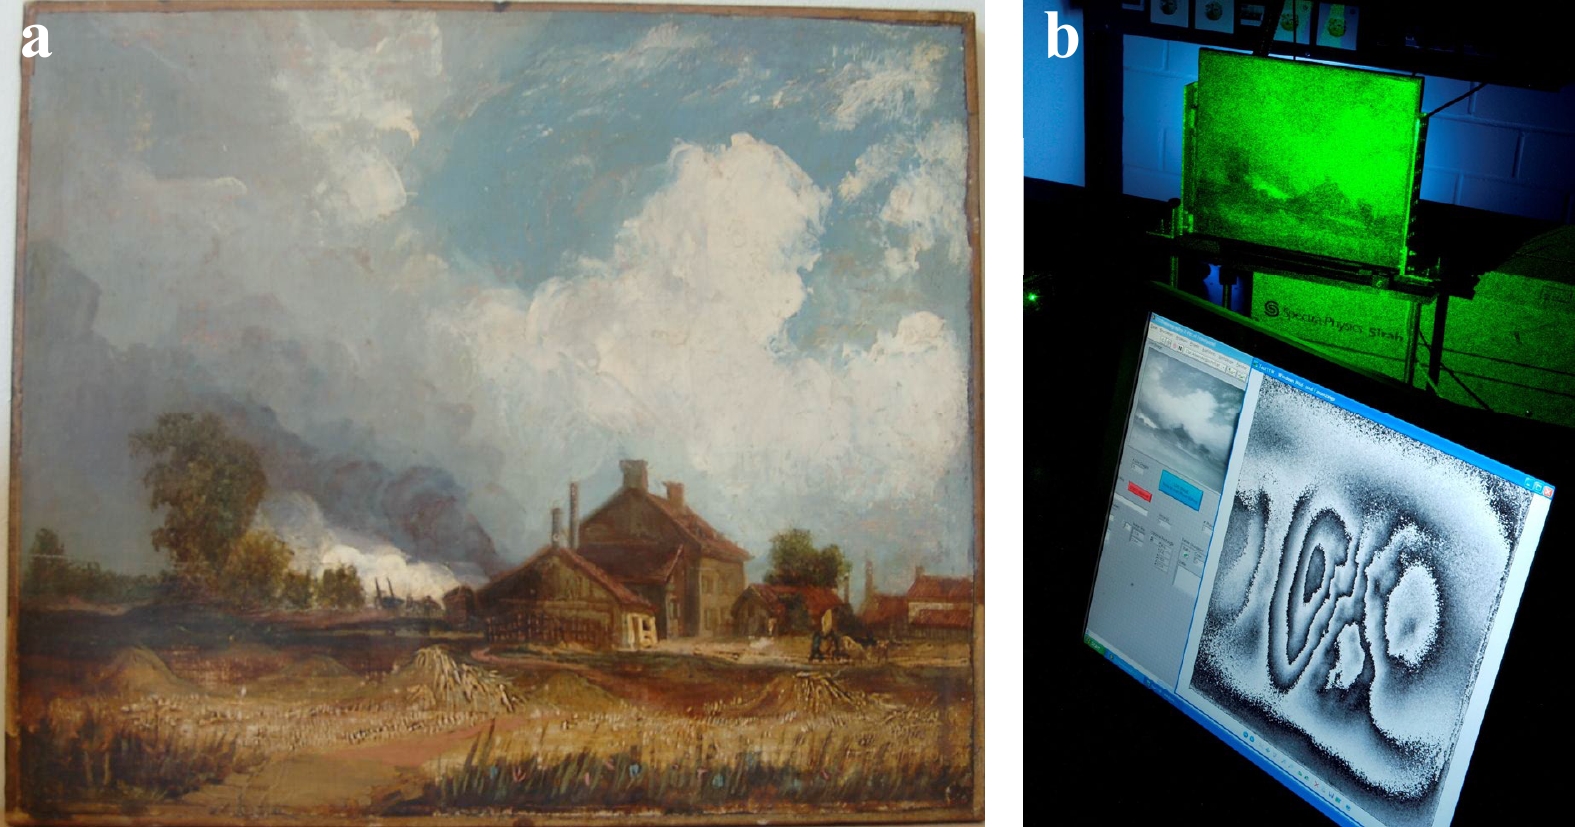
Fig. 6
a A painting on canvas, b illuminated painting along with its double exposure shearogram (with permission from Ref. 290). -
It has been demonstrated that theta shear can be used to measure the tilt of planar rough surfaces with good accuracy, which depends inversely on the magnitude of the theta shear24,25. Stroboscopic shearography has been used to effectively measure ultrasonic waves propagating through aluminum bars183. The effect of the direction and magnitude of shear on the propagation direction of ultrasonic waves was also investigated. Shearography has also been used to obtain the flexural strain in a turbine blade197. Another application has been to examine large objects such as metal cabinets 337. It has been demonstrated that stroboscopic shearography not only identifies defects but can also quantify them388. A feasibility study to examine bridge response by shearography has been reported89,101. Unfortunately, no shearograms were presented in this study.
Quantitative whole-field density measurements have been shown to be possible using shearography in a hostile industrial environment130. Essentially, shearography maps the refractive index in the flow, which is then related to the density. Both density and temperature have been mapped in a flow field177. Shearography was also applied to measure the temperature distribution in a liquid petroleum gas flame92. Shearography is applied to the experimental analysis of high-power ultrasonic machining components using a pulse laser157.
An interesting application of shearography is the measurement of distance167. A fringe pattern is created by the motion of the source, in which the fringe width is related to the distance. Interestingly, this can also be used to measure velocity192. A shearographic setup using a Savart plate for shearing generates a fringe pattern in which the fringe width is proportional to the depth of the object, thus turning it into a profilometer that provides absolute distance measurements of rough surfaces in the sub-micrometric range321.
A conceptual approach to apply shearography to detect abnormal growth in biological cavities was presented by conducting experiments on a half-cylindrical tissue phantom specimen253. Features that resemble abnormal growth in body cavities, such as polyps in different parts of the gastrointestinal path, especially in the large intestine, are introduced in different layers of the phantom. It was possible to detect these abnormalities using shearography. Recently, Buchta et al.364 simulated tumor-like tissue in a silicone phantom and applied shearography to detect regions of different stiffness with pressure loading. Fig. 7a shows a sketch of the silicone sample (with dimensions in mm) in which hard silicone spheres of different sizes are embedded at different depths. Two different types of silicone exhibiting different stiffness properties were chosen: hard silicone representing the cancerous tissue and a softer texture representing normal tissue. Fig. 7b is a photograph of the transilluminated sample. Fig. 7c shows the strain map of a 10 mm sphere obtained with 1.2 mm shear and a 4 mbar pressure change. Shearography was able to discriminate between two types of silicone. However, it was not possible to provide correct information about the size and depth of hard silicone spheres. Nevertheless, this technique may prove to be important for guidance and discrimination during minimally invasive surgery.
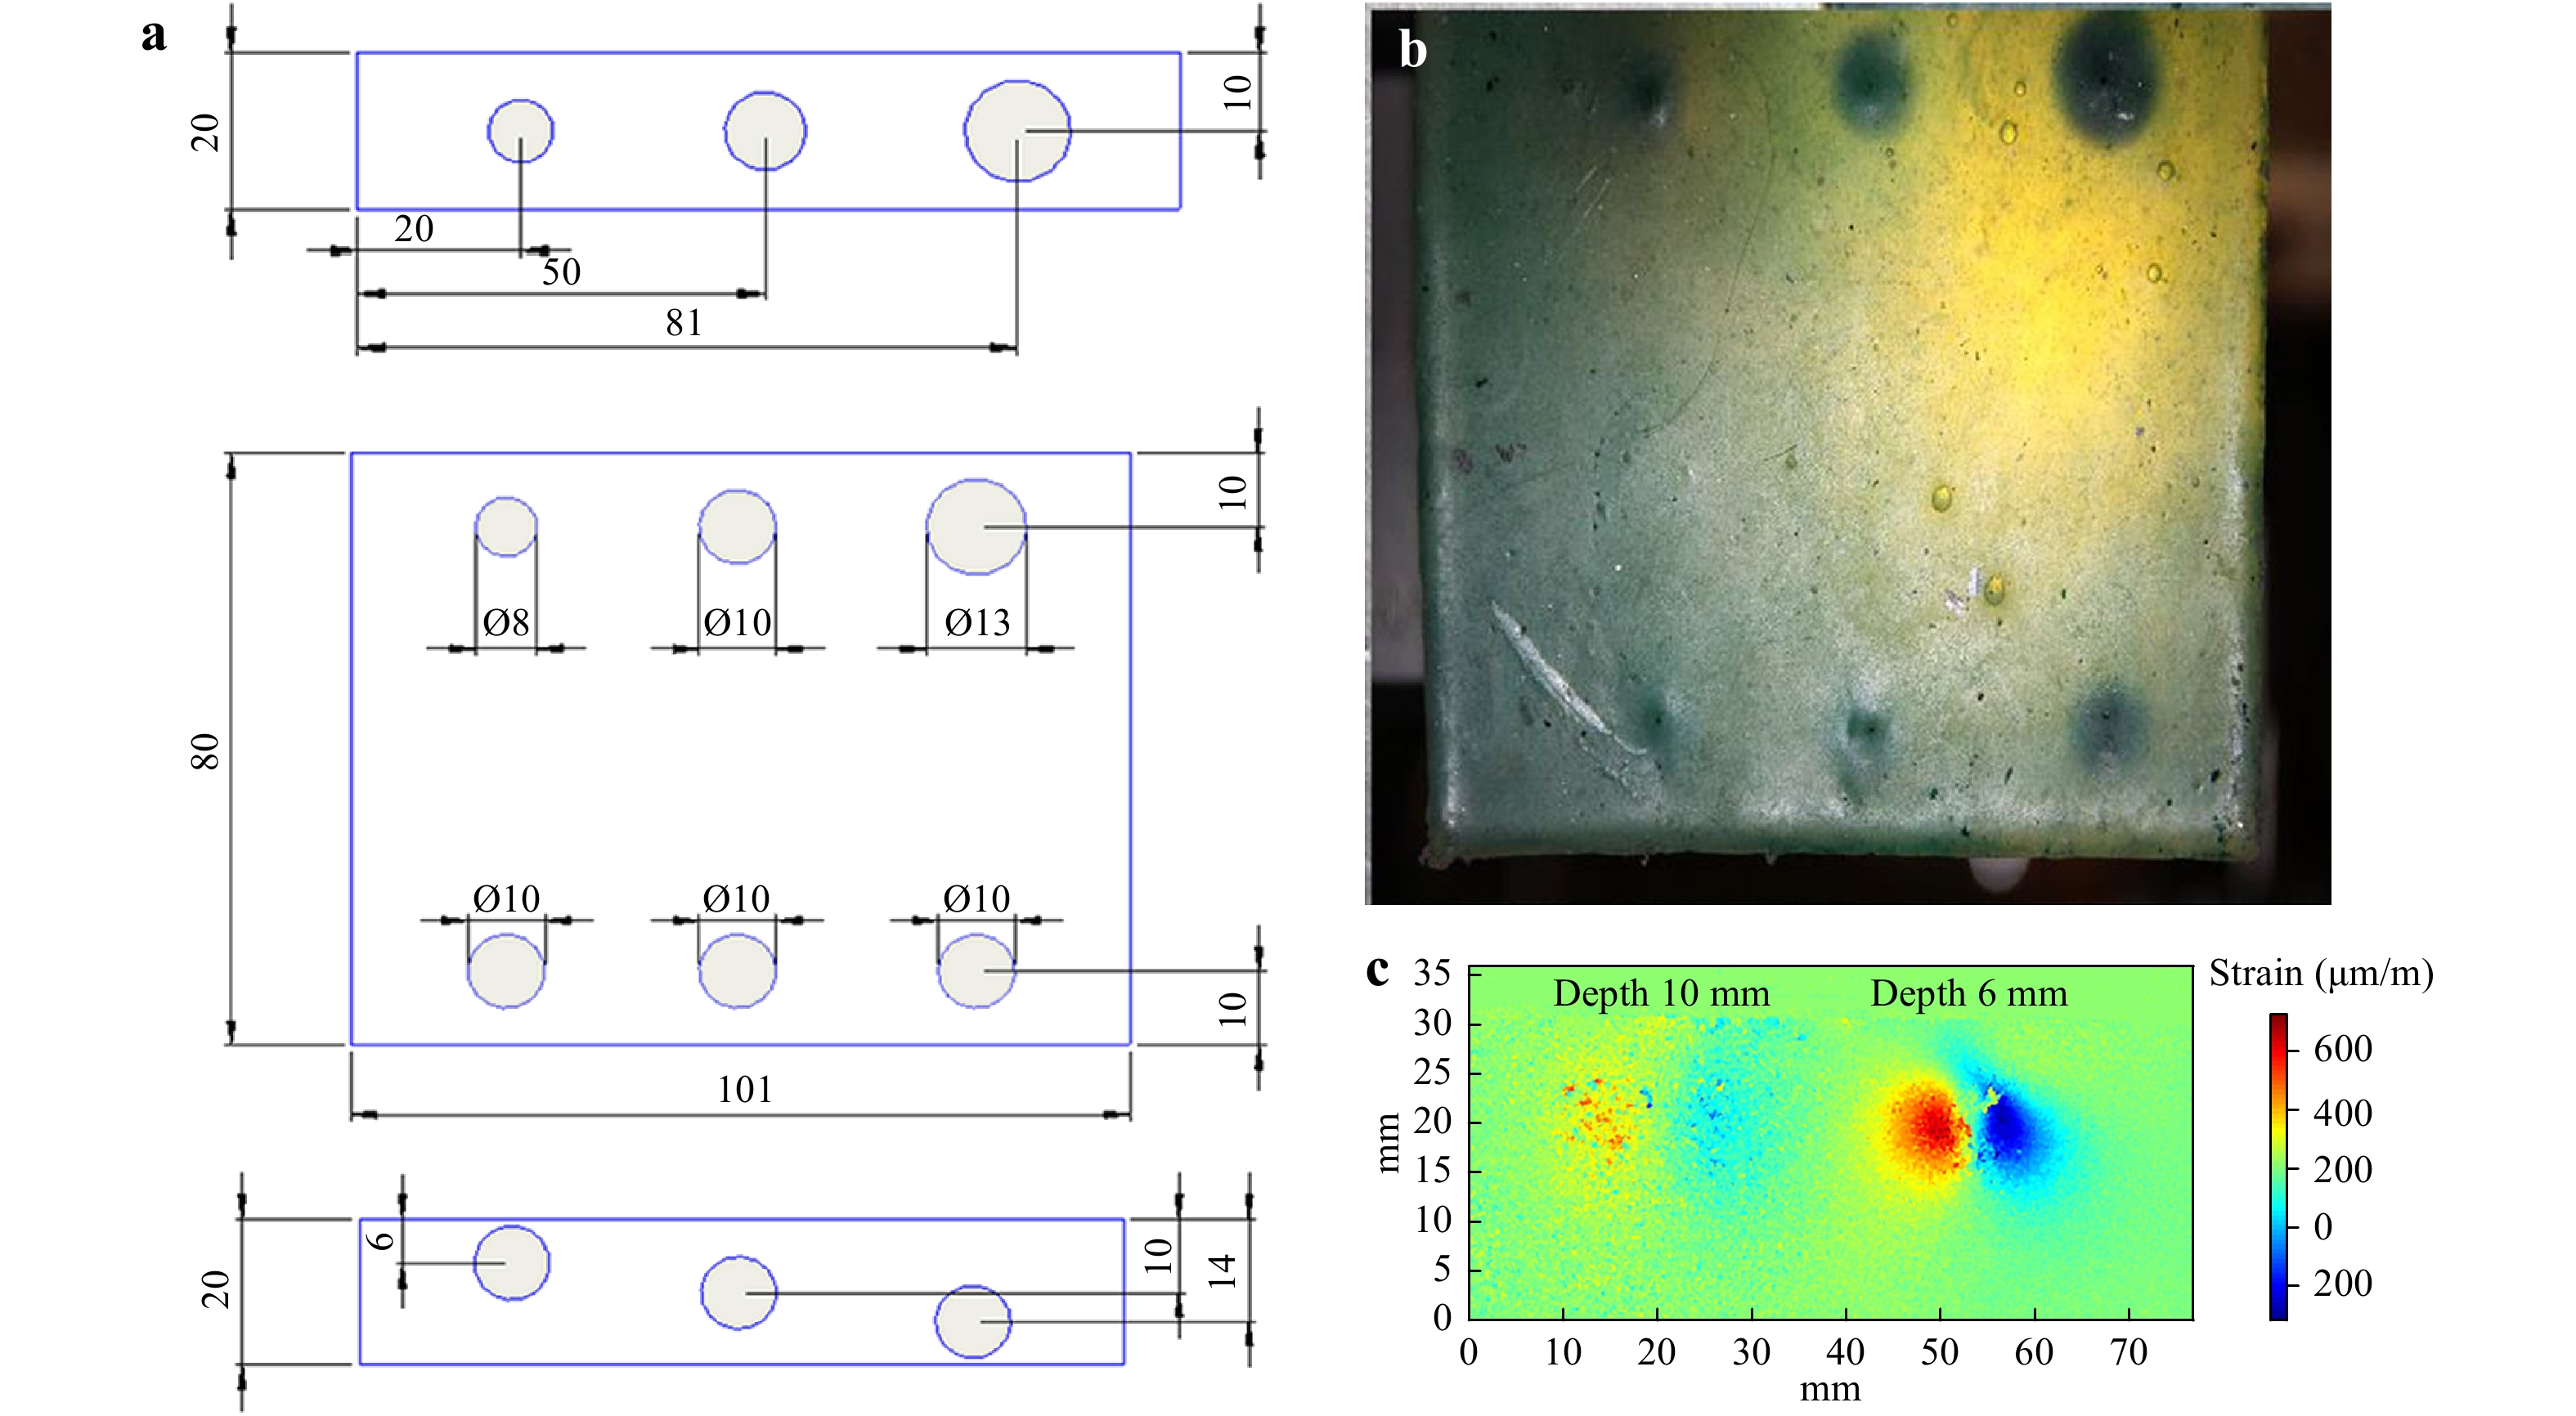
Fig. 7
a Sketch of the silicone sample (dimensions in mm), b photograph of the transilluminated sample, and c processed shearography data for two hard-silicone spheres (with permission from Ref. 364).Shearography can be configured for the study and testing of small objects if the conventional imaging lens is replaced by a long-focus microscope objective307,309. In one study, a pair of parallel plates separated by a distance acted as a shearing device as well as a phase-shifter307. A pressure sensor diaphragm (with a size of 1.5 mm × 1.5 mm and thickness of 25 μm) etched in a silicon substrate of size 3 mm × 3 mm and approximately 1 mm thick was studied using a low magnification zoom lens with a longer working distance309. It used a conventional Michelson interferometer for shearing and phase-shifting. Udupa et al.259 investigated a 200 mm Si wafer for defects by thermally loading the wafer with an infrared lamp. Shearography was able to successfully detect defects in the mm range.
Piezo-electrically, laser- and impact-generated Lamb waves in CFRP have been studied using pulse laser shearography employing a Mach-Zehnder interferometer as a shear device; this system was also used to generate carrier fringes for spatial phase shifting301. Shearography has been employed to evaluate the thermo-mechanical behavior of various coatings on different substrates, and for the determination of thermal stress and strain as a function of temperature266,316. Owing to its low temporal coherence requirement, shearography is able to measure the axial positions of phosphors embedded in a medium347. Phosphors embedded in a medium were illuminated by a structured beam from the excitation laser. The phase of the fluorescent wave from the phosphor was measured by shearography using a balanced Michelson interferometer for shearing. The axial position was reconstructed from the measured phase. A combination of fluorescent microscopy and shearography can provide the axial depth of phosphor placed several hundred micrometers in a highly scattering medium with good resolution.
There are several publications that describe the measurement of the shape of an object with shearography114,227,248,286. In all of these publications, the slope was integrated to obtain the shape. However, shearography can provide the form of an object. The basic framework of the procedure was provided by Elster and Weingärtner213. By applying several shears in the x- and y-directions, several x- and y-derivatives can be measured. The form of the object can be reconstructed by integrating the x- and y-derivatives.
-
Since its birth in 1973, shearography has evolved as a technique for visualizing and measuring displacement derivatives. Essentially, it measures the difference quotient that approximates a derivative when the shear is small. However, the sensitivity of shearography is linearly dependent on the magnitude of the shear. Because the shearographic configurations are nearly common-path, the requirement for temporal coherence is relaxed, and hence shearography can be performed with low-coherence sources such as a mercury source or an LED. Waves from the object can be transported using imaging fiber optic cables, and therefore inaccessible objects can be examined. Furthermore, the sensitivity also depends on the angle between the local surface normal and the illumination or observation beam, and maximum sensitivity is observed with respect to the derivative of the out-of-plane displacement (slope). Shearography has been accepted as an NDT technique for examining a variety of objects. Several mobile and non-mobile systems have been developed by researchers for their own use and by companies for commercialization. The first commercial 3D-shearographic system was offered by Ettemeyer in the early 1990s through his company. Another system using an air-cooled argon ion laser was developed in 1994. Some of the companies that offer shearography systems are (i) Dantec Dynamics A/S, Denmark; (ii) Optonor, Norway; (iii) isi-sys GmbH, Germany; (iv) Laser Technology, Inc., USA; (v) Laser Optical Engineering Ltd, UK; (vi) Carl Zeiss, Germany.
-
It is my pleasure to thank Prof. Wolfgang Osten for inviting me to prepare this article. Special thanks are to Prof. Jayant Sirohi, who painstakingly went over the manuscript and made critiques that improved the paper considerably. I would like to acknowledge the support provided by the Department of Physics, Alabama A&M University, Huntsville, Alabama, USA. I would also like to thank the reviewers of the manuscript for their constructive suggestions and for bringing out some of the references to my attention.
Shearography and its applications – a chronological review
- Light: Advanced Manufacturing 3, Article number: (2022)
- Received: 16 July 2021
- Revised: 21 December 2021
- Accepted: 25 December 2021 Published online: 14 January 2022
doi: https://doi.org/10.37188/lam.2022.001
Abstract: This paper presents the activities in the field of shearography in chronological order and highlights the great potential of this holographic measurement technology. After a brief introduction, the basic theory of shearography is presented. Shear devices, phase-shift arrangements, and multiplexed shearography systems are described. Finally, the application areas where shearography has been accepted and successfully used as a tool are presented.
Research Summary
Shearography: A technique for non-destructive testing
Shearography is a displacement gradient sensitive, full-field optical technique that is resilient to environmental disturbances and vibrations and is capable to examine large structures. It can be used on shopfloor as well in field. The major application of the technique is the non-destructive inspection of laminates. It has been applied to examine components and systems in aerospace and automobile industries, and to inspect art objects like paintings for conservation. The review article presents the evolution of the technique, various optical configurations, recording procedures, and applications.


Rights and permissions
Open Access This article is licensed under a Creative Commons Attribution 4.0 International License, which permits use, sharing, adaptation, distribution and reproduction in any medium or format, as long as you give appropriate credit to the original author(s) and the source, provide a link to the Creative Commons license, and indicate if changes were made. The images or other third party material in this article are included in the article′s Creative Commons license, unless indicated otherwise in a credit line to the material. If material is not included in the article′s Creative Commons license and your intended use is not permitted by statutory regulation or exceeds the permitted use, you will need to obtain permission directly from the copyright holder. To view a copy of this license, visit http://creativecommons.org/licenses/by/4.0/.

 DownLoad: