


-
In 1965, Karl Stetson and his colleague Robert Powell discovered the potential of holography for interferometry1, 2. In contrast to classical interferometry, the holographic principle of wavefront storage and reconstruction made it possible to investigate objects with rough surfaces. The following years were filled with the implementation of various techniques such as the real-time technique, the double-exposure technique, the time-average and stroboscopic technique3. An impressive overview about the early progress in implementation and application of principles of holographic nondestructive testing was given in 1974 by Robert K. Erf4. Shortly after the discovery of holographic interferometry, the speckle noise, originally considered a blemish for the quality of the holograms, was recognized as a further powerful tool for non-destructive testing5. Y.Y. Hung’s combination of shearing interferometry with speckle correlation opened the door for coherent metrology to step out of the laboratory and to bring its big potential to the factory floor6-8. Another book from Robert K. Erf reports in 1978 also about the great potential of speckle metrology9. The holographic tire test10, which has long served as the most representative industrial application for HNDT, has now been supplemented by numerous other applications with high practical relevance. Early examples are Niels Abramsons holographic study of the deformation of two milling machines during their operation11, the optimization of the car body with respect to vibration excitation using pulsed laser holography by Armin Felske and Alfons Happe12, the vibration study of a railway bridge excited by a running train by Hans Steinbichler13, and the diagnostics of paintings with holographic methods by Salvatore Amadesi et al14. Further early applications such as the measurement of material parameters, residual stress measurement, vibration analysis, plasma diagonstics, shape measurement, and fault detection can be found in4, 9, 15-17.
Methods of holographic non-destructive testing, experimental stress analysis and shape measurement have all the advantages provided by optical principles: the non-contact and high speed interaction with the object under test, the scalability of the dimension of the probing tool, the high resolution of the data, the simultaneous availability of numerous information channels and the flexible adaptability of the comparative standard – the wavelength. On the other hand the user is still confronted with a number of serious challenges. Two of the biggest challenges that currently attract high attention in both the technical as well as life sciences are: exceeding the physical limits of resolution and improve the precision of the measurement. Therefore, these methods are subject to constant improvement. The characteristics that give rise to improve the performance of the systems are obviously dependent on the purpose of the measurement and the object under test. However, there are also general features that can be used to assess the performance of a measurement system. Here we refer to its spatial and temporal resolution, its area related resolution, the precision and trueness of the achieved measurement data, the robustness of the system against external influences, its degree of automation, and its ability to work as close as possible to the process to be inspected.
In this contribution, we discuss briefly general and application dependent features for the assessment and selection of optical measurement systems. Afterwards, we show several recent applications where holographic principles are applied with advantage and where the sensors are inspired by digital technologies. Finally, we list some challenges for HNDT that are currently matter of investigation.
-
To write about the significance of metrology in our high-tech world would mean to bring owls to Athens. Metrology and quality are two sides of the same coin and high quality standards are a must for the majority of manufacturers in all industrial branches. The well-known slogan “If you can’t measure it, you can’t improve it”, attributed to Lord Kelvin, belongs to the most-important quotes in business and expresses clearly the position that decisions without a reliable data basis are fuzzy. For modern production technologies this phrase can be simply rewritten as following: “You cannot produce anything better as you can measure it”. Many adaptions of this wisdom are circulating meanwhile, such as “If you can’t measure it, you can’t make it” or “If you can’t measure it, you can’t manage it”①. The most pertinent expression for this causality is in our opinion probably the one attributed to the American statistician W. Edwards Deming who famously said:“In God we trust, all others must bring data.” Generating, collecting and interpreting data seems to be more important than ever. In times of all-encompassing digitization, IoT-mania, social networks, and mobile communication, the term Big Data refers mainly to the use of predictive analytics, user behavior analytics, or certain other advanced data analytics methods that extract value from a data system to find new correlations and to spot business trends, prevent diseases, combat crime and so on18, 19. The analysis of this trend is by no means the subject of our article.
Instead, we focus on data acquisition and evaluation in a very limited environment called optical metrology. The situation here is on the one hand quite different as in the social-economic context of the above mentioned Big Data hype. On the other hand there are some similarities which could be of interest for our topic. In both cases a user or customer, respectively, is involved. While in the first case the client is largely passive and the system examines his behavior in the context of a larger community of acting individuals to come up with suggestions and conclusions, the client in our case is the active player who has a concrete problem (mainly to assess the quality of items or processes) and looks for the best way to solve it. In both cases, the generated data are the primary decision-making basis. These decisions are the subject of the analysis of an inverted causality that is aimed to draw conclusions from the achieved results – the measurement data - to their causes (faults, shapes, deformations, strains, …), see Fig. 1. The difficulties of the so-called identification problems are: instability, ambiguity, sensitivity to noise, and lack of independent information20, 21.
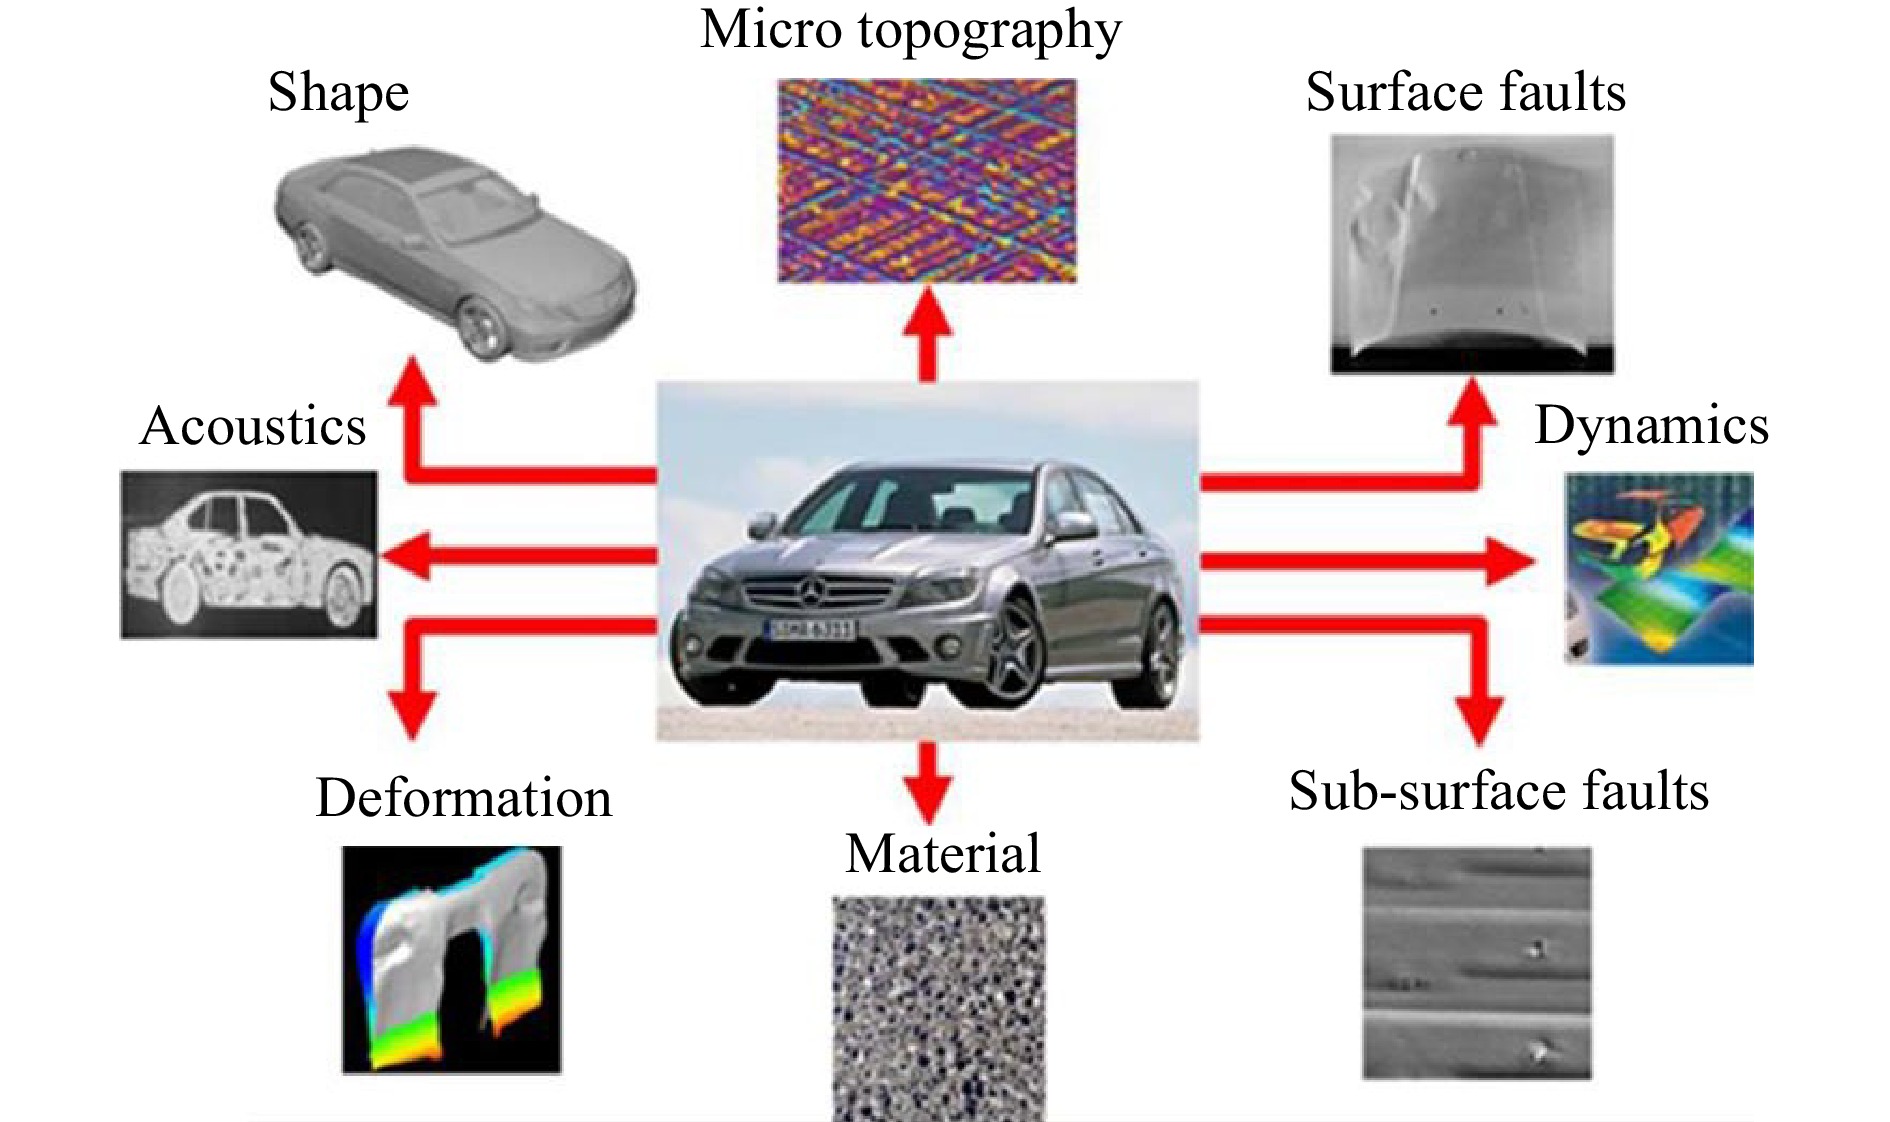
Fig. 1 Critical features and quantities which can be measured effectively by holographic techniques (Reproduced from Ref. 38)
Metrology is not matter of wishful thinking but only matter of facts. This holds especially for optical metrology where we can usually see what we will get. But the belief in pictures is often seductive and the transformation of optical data (intensities, phases, times of flight, ...) into e.g. dimensional data is not even simple due to the mentioned indirect measuring process. Consequently, the discussion of reliable procedures and measures for the evaluation of the performance of measurement systems and the trueness of the derived data may help to improve the trust in optical measurement systems. However, the subject is far from being simple and an exhaustive treatment of that topic needs more substantial investigations and would fill many pages. Several important players, components and procedures are part of the chain from the given object under test and measurement problem to the selection and task-dependent design of a proper measurement system delivering confiding data. Fig. 2 tries to illustrate the strategy of that selection process.
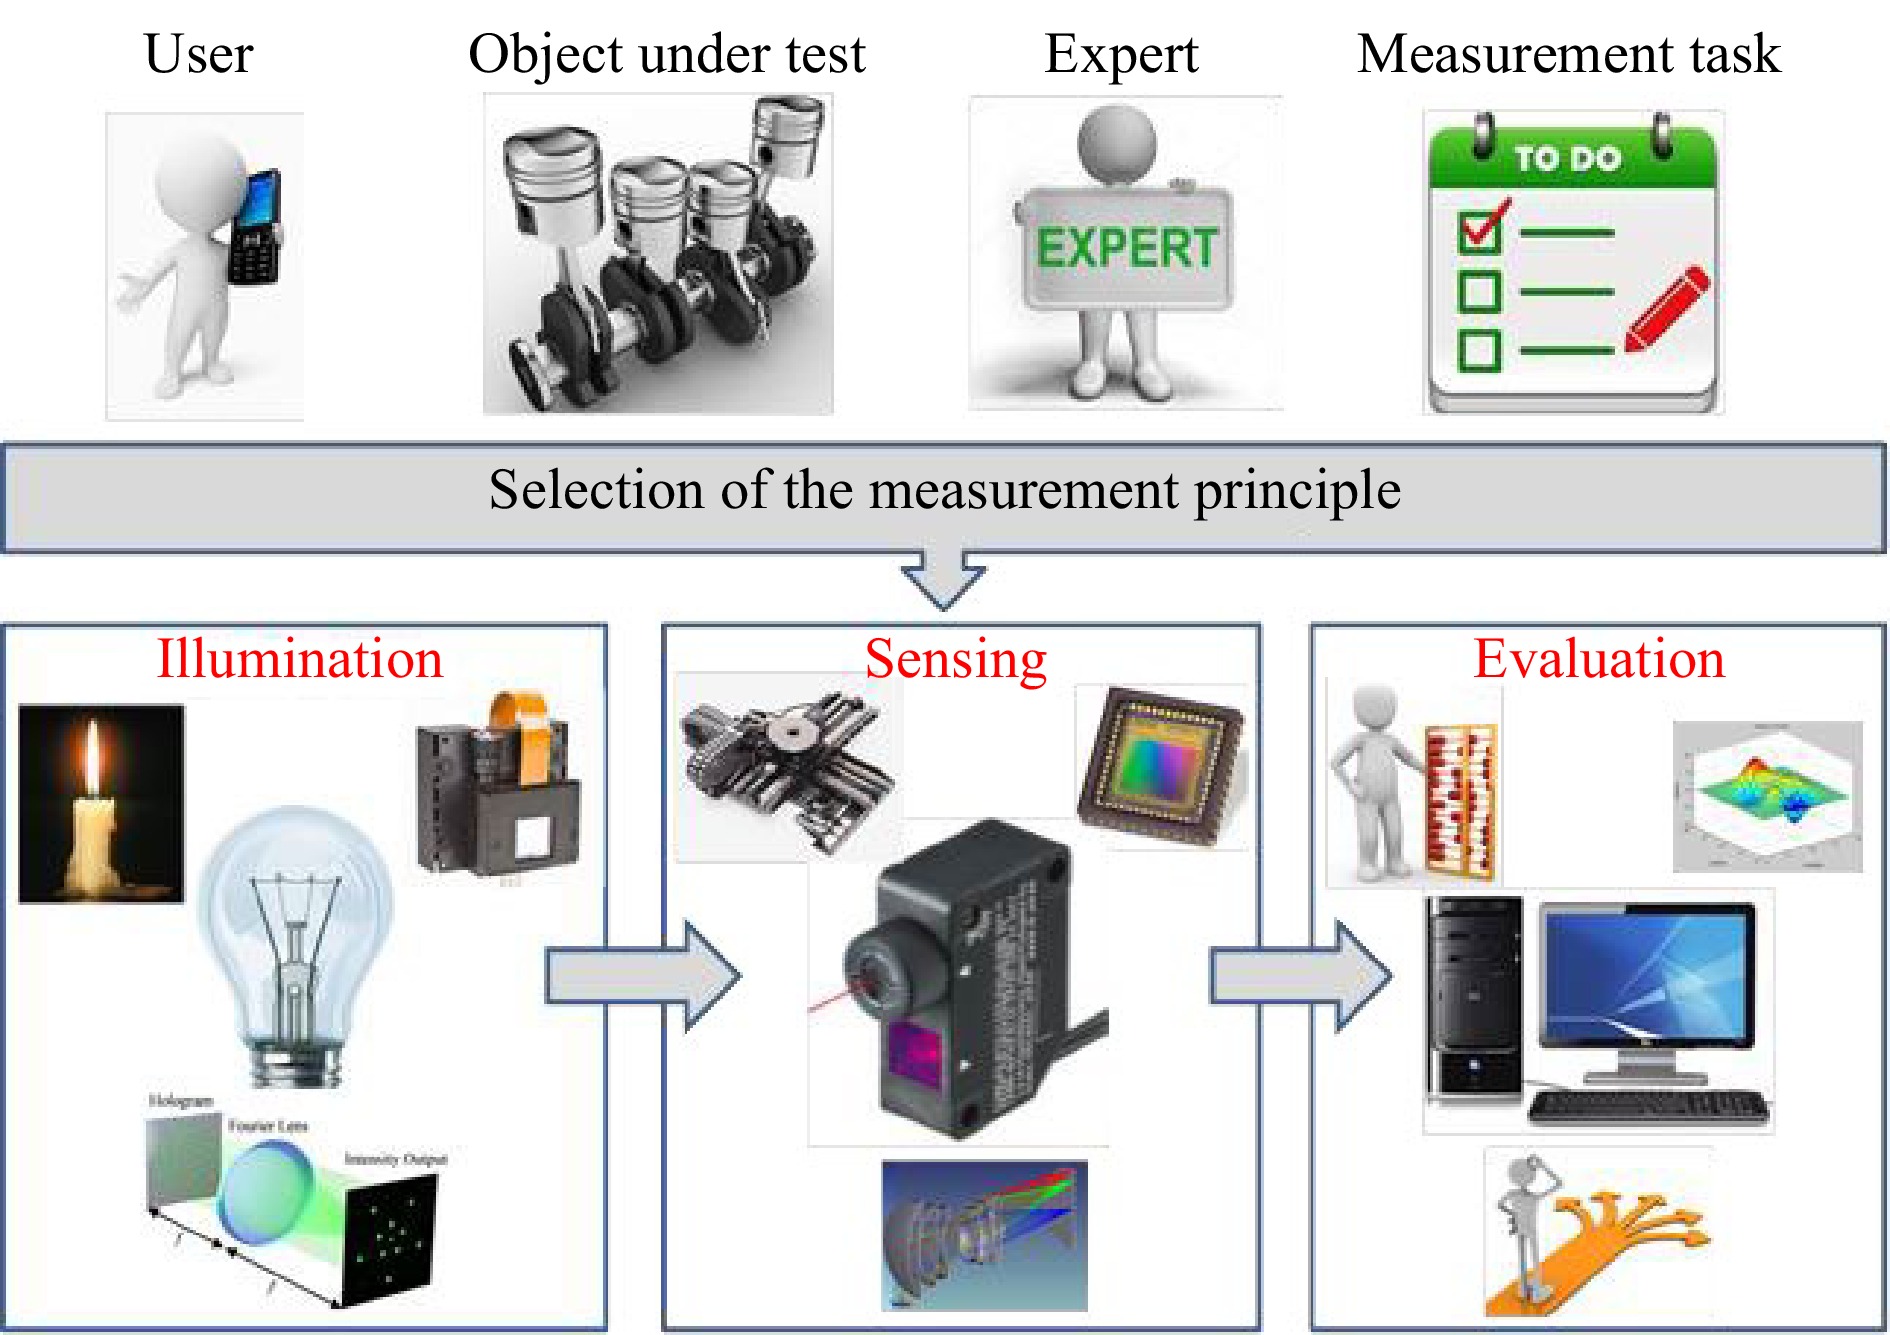
Fig. 2 Players and schematic strategy of the decision process for the task-dependent design of a measurement system: The user has a specific problem concerning the object under test, having a specification sheet he/she consults an expert who is proposing a task dependent system specification and the main components of an optical measurement system: Illumination (light source, beam shaper, light modulator), Sensing (sensor, positioning system, imaging system, detector), Evaluation (analog-digital-conversion, data processing algorithms, software implementation, graphic presentation, decision making) (Reproduced from Ref. 38)
The user or customer has a specific problem where he needs insights about certain properties of the current sample. Usually he discusses that problem with an expert who transforms the global and often fuzzy task into a specification sheet. This specification sheet contains more or less precise information about the data to be measured directly, the principles and devices used for their measurement, the algorithms executing the identification of the best estimate of the desired data – the identification problem which in the epistemological sense represents a question to the causality22, and the methods for the estimation of the reliability of the final results. This is in general a straightforward procedure but strictly dependent from the specific measurement problem. There are many recipes and guidelines for the measurement of any data, and for the calculation, presentation and assessment of the final data which quantify the quality of the object under test as well. See for instance the ISO/BIPM Guide for the Expression of Uncertainty in Measurement23 which is a valuable tool for the estimation of the reliability of the provided data. However, the evaluation of these procedures and guidelines is not the subject of our paper. Our intention is more directed to the discussion of features and measures that can be helpful for the selection and design of a specific measurement system and finally for the estimation and improvement of its performance.
Here we distinguish between general features that can be helpful to characterize the global quality of a measurement system and its 3 main components (see Fig. 2: Illumination, sensing including the selection of the adequate sensors and their path planning24, and the evaluation of the measurement data including their error analysis), and those features that are characteristic for a particular application. For the latter, the following list of specifications should be considered:
− the object under test, its intended use and use conditions as well,
− the quantities or features to be measured, such as dimensional, mechanical, spectral and kinematic quantities, material parameters, material faults, …,
− the measuring environment (cooperative or non-cooperative/harsh environment25),
− the type of interaction with the object, e.g. the appropriate measuring arrangement, the appropriate load of the object and the choice of an appropriate wavelength or sequence of wavelengths26, 27,
− the proper user interface (human-machine-interface28, graphical user interface GUI, and programming language29),
− the process capability of the measurement system (the process capability is a statistical measure that indicates the probability with which the specified goals can be achieved, the so-called statistical process control SPC30),
− the measurement volume and/or the measurement area,
− the surface quality of the object (rough, optically smooth, translucent, …),
− the required measurement speed (e.g. the need to synchronize the measurement with the process timing for in-line measurement processes, or an off-line system decoupled from the process cycle following its own clock rate),
− the required measurement uncertainty31 (this statistical quantity for the estimation of the precision/repeatability of the results is strongly dependent on the measurement conditions and the properties of the measurement object; a rule of thumb says: the accepted uncertainty has to be smaller as a tenths of the tolerances that can be accepted by the system),
− the way of data presentation and subsequent use of data (quantitative, qualitative, lists, graphics, further processing, …).
There is obviously no all-in-one device suitable for every purpose and consequently there is no general rule for the selection and design of a specific measurement system. The variety of objects, measurement conditions and measurement purposes is far too big. Consequently, it is the responsibility of the expert to select the system that is most appropriate for a specific purpose. However, there are several general rules for the design and features for the assessment of optical measurement systems which can be used to objectively judge its performance and to find ways to improve it. Richard Leach et al have proposed 5 general rules for the design of the measurement pipeline in order to achieve better metrological performance, shorter measurement times, and smaller consumption of resources. They call it Information-Rich Manufacturing Metrology (IRM) 32:
− use information on nominal part geometry,
− use information on manufactured part geometry,
− use information from other measurement,
− use information on measurement process,
− use any other source of additional information.
Additional information is always useful to cope with the ill-posedness of the inverse problem33. A successful way for the regularization is the exploitation of the complete information content of a light wave21:
− primary information channels: intensity, frequency, phase, angular spectrum, and polarization,
− angular momentum of light: light spin and light orbital angular momentum,
− time of flight (light in flight),
− correlation properties in the light field: temporal and spatial coherence.
These channels can be processed as individual information carriers such as in interferometry where the phase is reconstructed by several intensity measurements using phase-shifting technologies34, or by a multi-modal data acquisition in the context of a sensor fusion strategy35. For the inspection of extended objects, the limited space bandwidth product of existing sensors is often a handicap for the high-resolution detection of existing faults. A smart combination of various techniques allows the skillful fusion of sequential measurements acquired in different scales and consequently a more effective way to find these faults without a time-consuming scan of the entire object with a single high-resolution method36,37,20.
If one takes into account the big diversity of quantities that can be measured with holographic principles (see Fig. 1) and the always ubiquitous challenge to find the best method suitable for the solution of the concrete problem, then it will be clear that the user needs assistance to make the best possible choice38. The understanding of the features of a measurement system, their origin and influence on the quality of the results is the first step on the way to an objective judgement of the data and finally to a system with outstanding performance. Apparently, there is no universally valid and simple recipe for this. This is because the multiplicity of measurement tasks and objects does not allow a generalized rule. Nevertheless, there are meanwhile some serious attempts to tackle this challenge. Here we would particularly like to highlight the initiative “The Fair Data Sheet”39 and the German research project OptAssyst40. The Fair Data Sheet aims to contribute to more uniformity in definition and use of features for the characterization of the performance of optical measurement devices for surface metrology, to understand data sheets and to allow the user an objective comparison of different devices and measurement technologies. That is a good basis. However, a number of new questions arise, which are directed to the selection and description of the characteristic features and to the design of future systems.
Alongside the “Fair Data Sheet”39 some further valuable seminal work should be mentioned: Häusler and Ettl have published an article entitled “About the clever selection and application of optical sensors”41. The authors list valuable indicators that should be considered for the selection of a particular sensor. To them belong factors that influence the measurement uncertainty, measures to estimate the information content delivered by the special sensor, and requirements for the surface quality of the measurement object. Peter de Groot et al propose to apply the so-called Instrument Transfer Function (ITF)42,43 as an object independent measure to determine the limitations of the optical metrology instruments and extend this concept in44 to the 3D-ITF. They clearly point out that the optical resolution of a surface profiler is in general object-dependent. However, referring to the ITF it is possible to define regimes where its cut-off frequency enables metrics about the capability of a given instrument. In38 we discussed several measures that can be helpful for the estimation of the performance of an optical measurement system and its components. Furthermore, a system can be qualified by its degree of modularity, flexibility, user-friendliness, robustness against environmental influences, multi-modality performance (property to measure data of various modalities, such as dimensional and kinematic data), consumption of resources, ease of integration, and miniaturization. Established parameters for the assessment of the illumination source are their radiometric and coherence properties (spectral bandwidth, spectral power, coherence length, source dimension, noise level…).
-
By keeping an eye on the guidelines for the selection of a proper measurement technology discussed in the previous section, we present here recent applications of holographic techniques for the inspection of aircraft and automotive parts, micro-electro-mechanical systems (MEMS), spray-coating processes, erosion monitoring in harsh environment, and artwork inspection. The quantities that are measured directly with holographic and speckle techniques are intensities and phases, while thereby displacements, strains, residual stresses, material faults and shape data are reconstructed.
-
Carbon fiber technology (CFRP – Carbon Fiber Reinforced Plastics) and other lightweight materials such as GLARE (Glass Laminate Aluminum Reinforced Epoxy) are used more and more for airplane and automotive parts. For instance modern airplanes are already equipped with such components in the body, the vertical and horizontal stabilizer, the rudder, airbrakes and spoilers. However, the application of new materials is also accompanied by new challenges to an optimal dimensioning. The premature detection of possible damages due to material and construction imperfections is therefore inevitable to guarantee the strength and safety in long-term operation. For this reason, the use of adapted inspection equipment and procedures is a must especially in the phase of construction and testing of prototypes.
Shearography6-8,13, is an approved and powerful tool for the non-destructive investigation of technical components with respect to material faults and structural imperfections. It is a robust interferometric technique for the detection of damaged regions by applying an appropriate load to the object. Both material and structural imperfections can be recognized as typical fringe patterns in the shearogram. The method is based on the digital correlation of two speckled wave fronts representing two states of the object under test such as the unloaded and the loaded one. A special quality of shearography is the so-called self-reference of each interferometrically sensitive speckle pattern. By shearing of the wavefronts that are scattered from the illuminated object, one of the wavefronts serves as reference for the other. Consequently, the method is very robust against environmental influences and especially rigid body motions of the object have no influence on the speckle correlation. In contrast to holographic interferometry, speckle shearing allows the use of several mutually incoherent light sources for the illumination of larger areas8.
Considering the system specifications discussed in section 2 and taking into account that large scale technical objects have in general a kind of non-cooperative surface (shiny, curved, varying thickness, changing materials and paints, changing reflectivity, …), then a careful design of the following system components is needed: the shearography sensor, the illumination unit, the loading system and the evaluation software. When developing a mobile and modular system for aircraft and automotive inspection, these components have to be customized with respect to the boundary conditions in these application fields.
The choice of the appropriate load is of crucial importance for the capability of the inspection system to detect faults under the surface up to a depth of several mm. In our system mainly thermal and mechanical loading are applied45. Mechanical loading is performed by changing the pressure within the test environment. To this purpose a self-adhesive vacuum chamber was developed, Fig. 3a. This unit has two pneumatic cycles: one for the load-pressure in the vacuum chamber and the other for a non-destructive grip at the object under test. Furthermore, thermal loading is done with the help of two infrared lamps, Fig. 3b. The connection of that loading devices with the system control of the PC ensures an adaptive variation of the pressure in the vacuum-chamber or the heating of the inspected area by the operator.
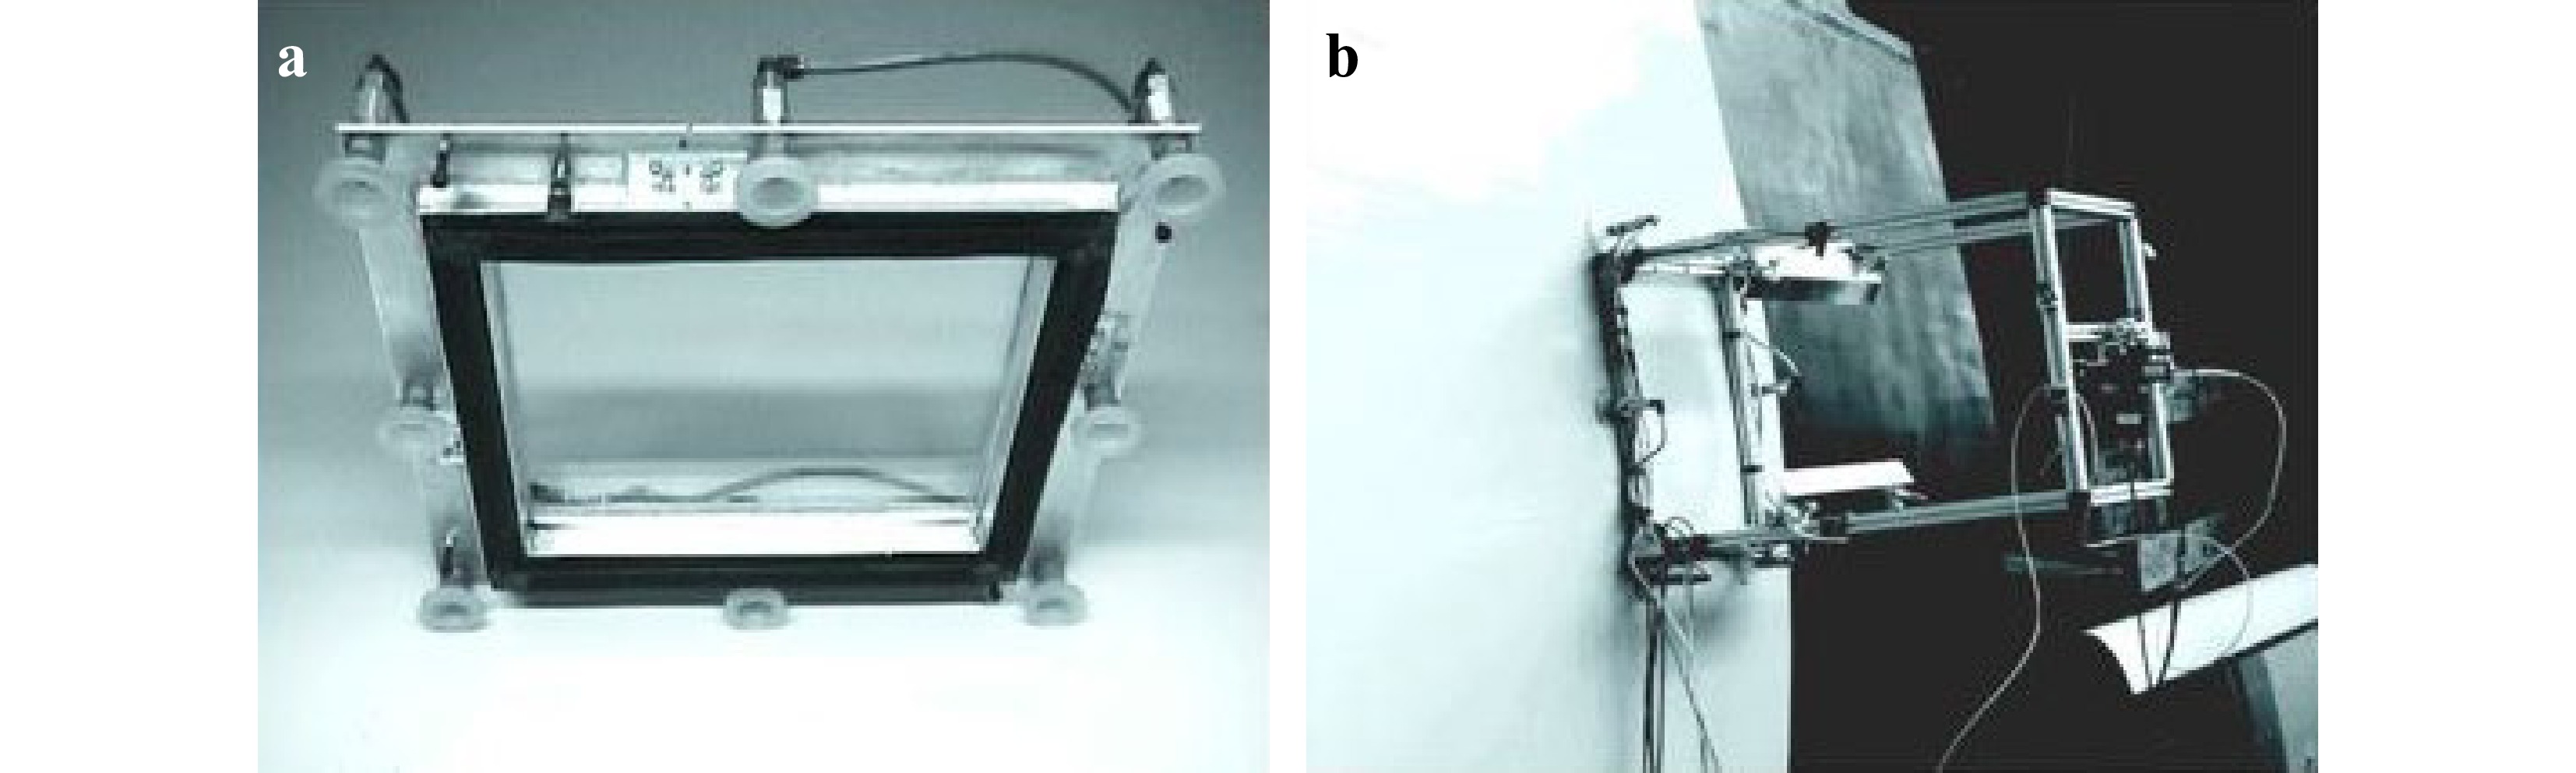
Fig. 3 Loading components of the inspection system for digital speckle shearography. a Self-adhesive vacuum chamber for pressure load b Self-adhesive thermal loading unit (Reproduced from Ref. 8).
The developed system was tested extensively on various aircraft components on the factory floor at Airbus Bremen and in a maintenance facility. A typical test object is the horizontal stabilizer of the Airbus A320, Fig. 4a. The stabilizer was tested having both the rough CFRP-surface and the painted surface. The inspection goal was the detection of separations of adhesive bonded stringers behind the CFRP-skin with a thickness between 3 mm and 8 mm. Fig. 4a, b show a CFRP-composite structure that was reinforced with stringers and ribs. This shell structure was prepared with skin delaminations and stringer debondings of different sizes. The detected delaminations are in the region of 50 mm, 25 mm and 10 mm edge length, Fig. 4b. The stringer separations have a length of 200 mm, 100 mm und 50 mm, Fig. 4c. Fig. 4d shows the inspection result of a repaired part in the region above two stringers. The different layers are clearly observable.
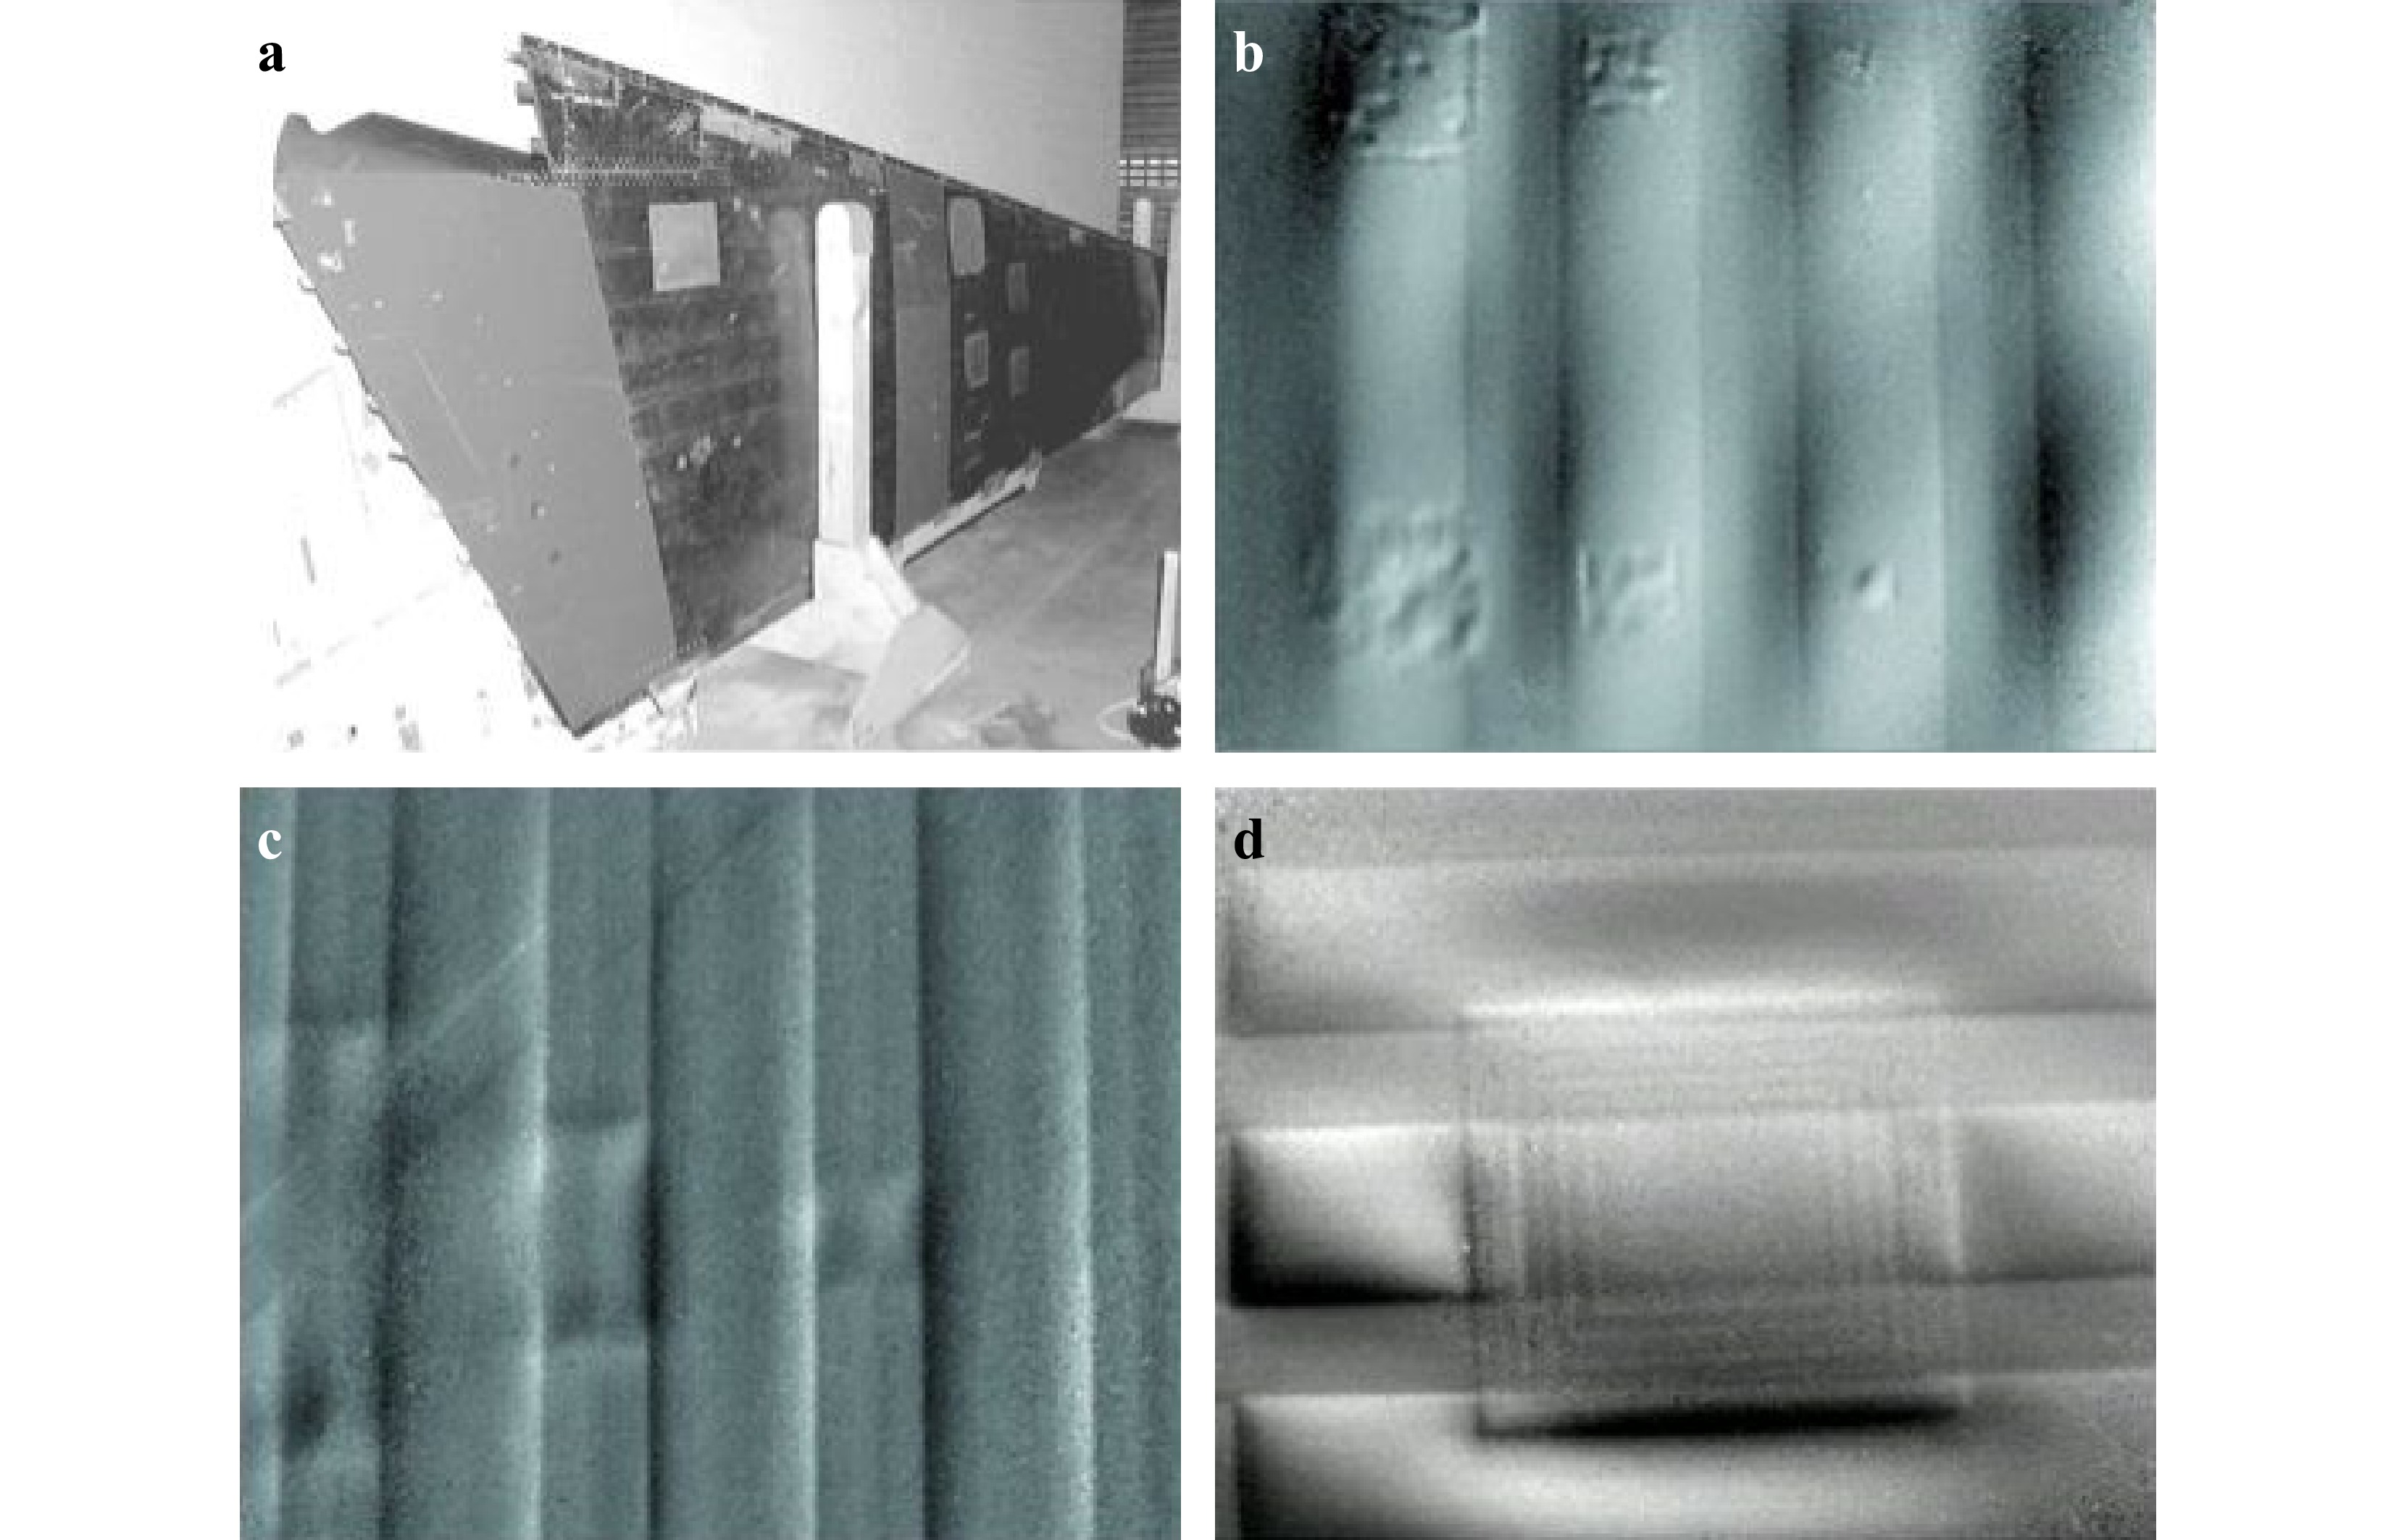
Fig. 4 Part of the inspected Airbus A 320 stabilizer at the Airbus Germany factory in Bremen with some inspection results. (Reproduced from Ref. 8). a Inspected CFRP stabilizer b Delaminations of the skin c Stringer debonding d Repaired region.
The very sensitive detection of the faults and their clear appearance in the delivered final shearography images could be demonstrated by a comparison with two other inspection techniques: ultrasonics and thermography. For the verification of the performance of test procedures, aircraft components are prepared with faults of different size and location. Here the delaminated stringer area in the A320 body was investigated using thermal load. Fig. 5a shows the fault image delivered by ultrasonics and Fig. 5b shows the same fault detected with a thermography system. It is obvious to see that the structure of the fault can be resolved more clearly using shearography, Fig. 5c,d.
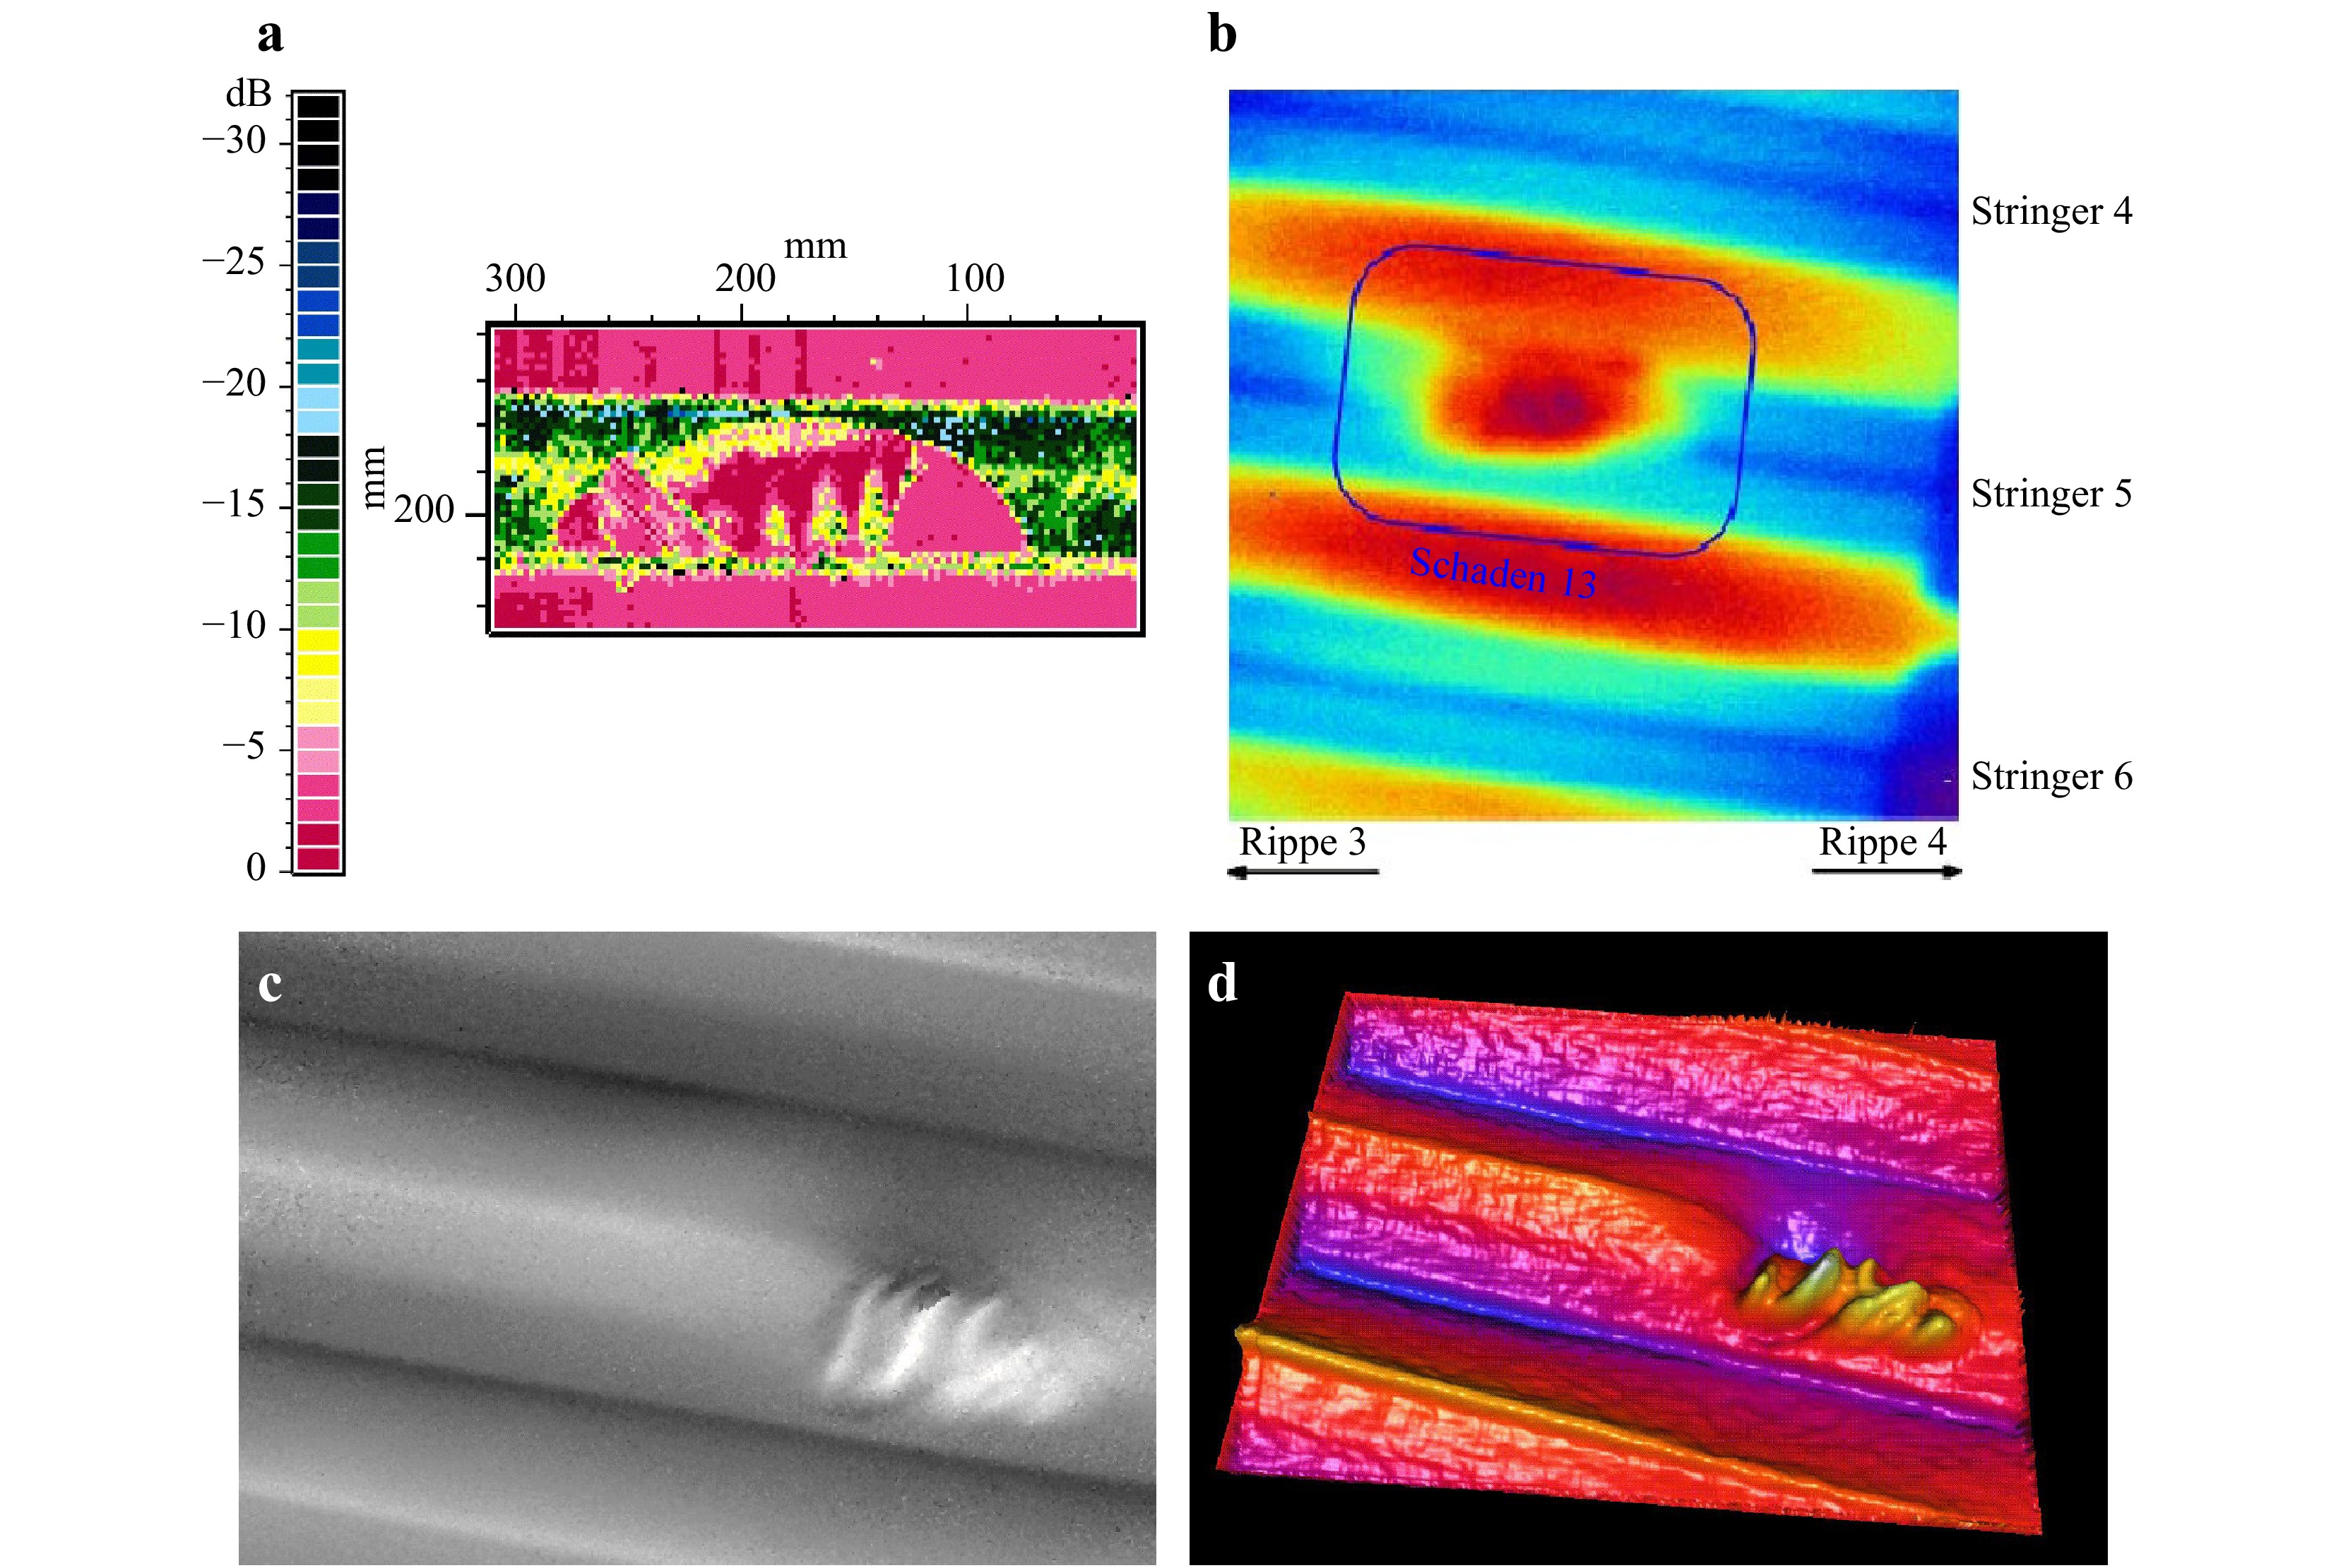
Fig. 5 Inspection of a damage in the test sample of the A320 body by ultrasonics, thermography and shearography. (Reproduced from Ref. 8). a Inspection result made with ultrasonics b Inspection result made with thermography c Inspection result made with the shearography system d VRML presentation of the shearographic result.
One important objective for the design of modern cars is to reduce the fuel consumption drastically. Light weight structures made from CFRP are also here an essential part of a bunch of measures. Fig. 6 shows the results of the inspection of a CFRP cross bar member. The cross member was prepared with some internal imperfections to be identified by shearography. For a sensitive investigation the cross member was loaded thermally with infrared radiation and subdivided into 5 inspection areas. The inspection of a single section only takes few seconds. After evaluation, the results corresponding to the 5 inspection areas were stitched together electronically. Fig. 6 gives a clear impression of all internal imperfections of the cross bar.
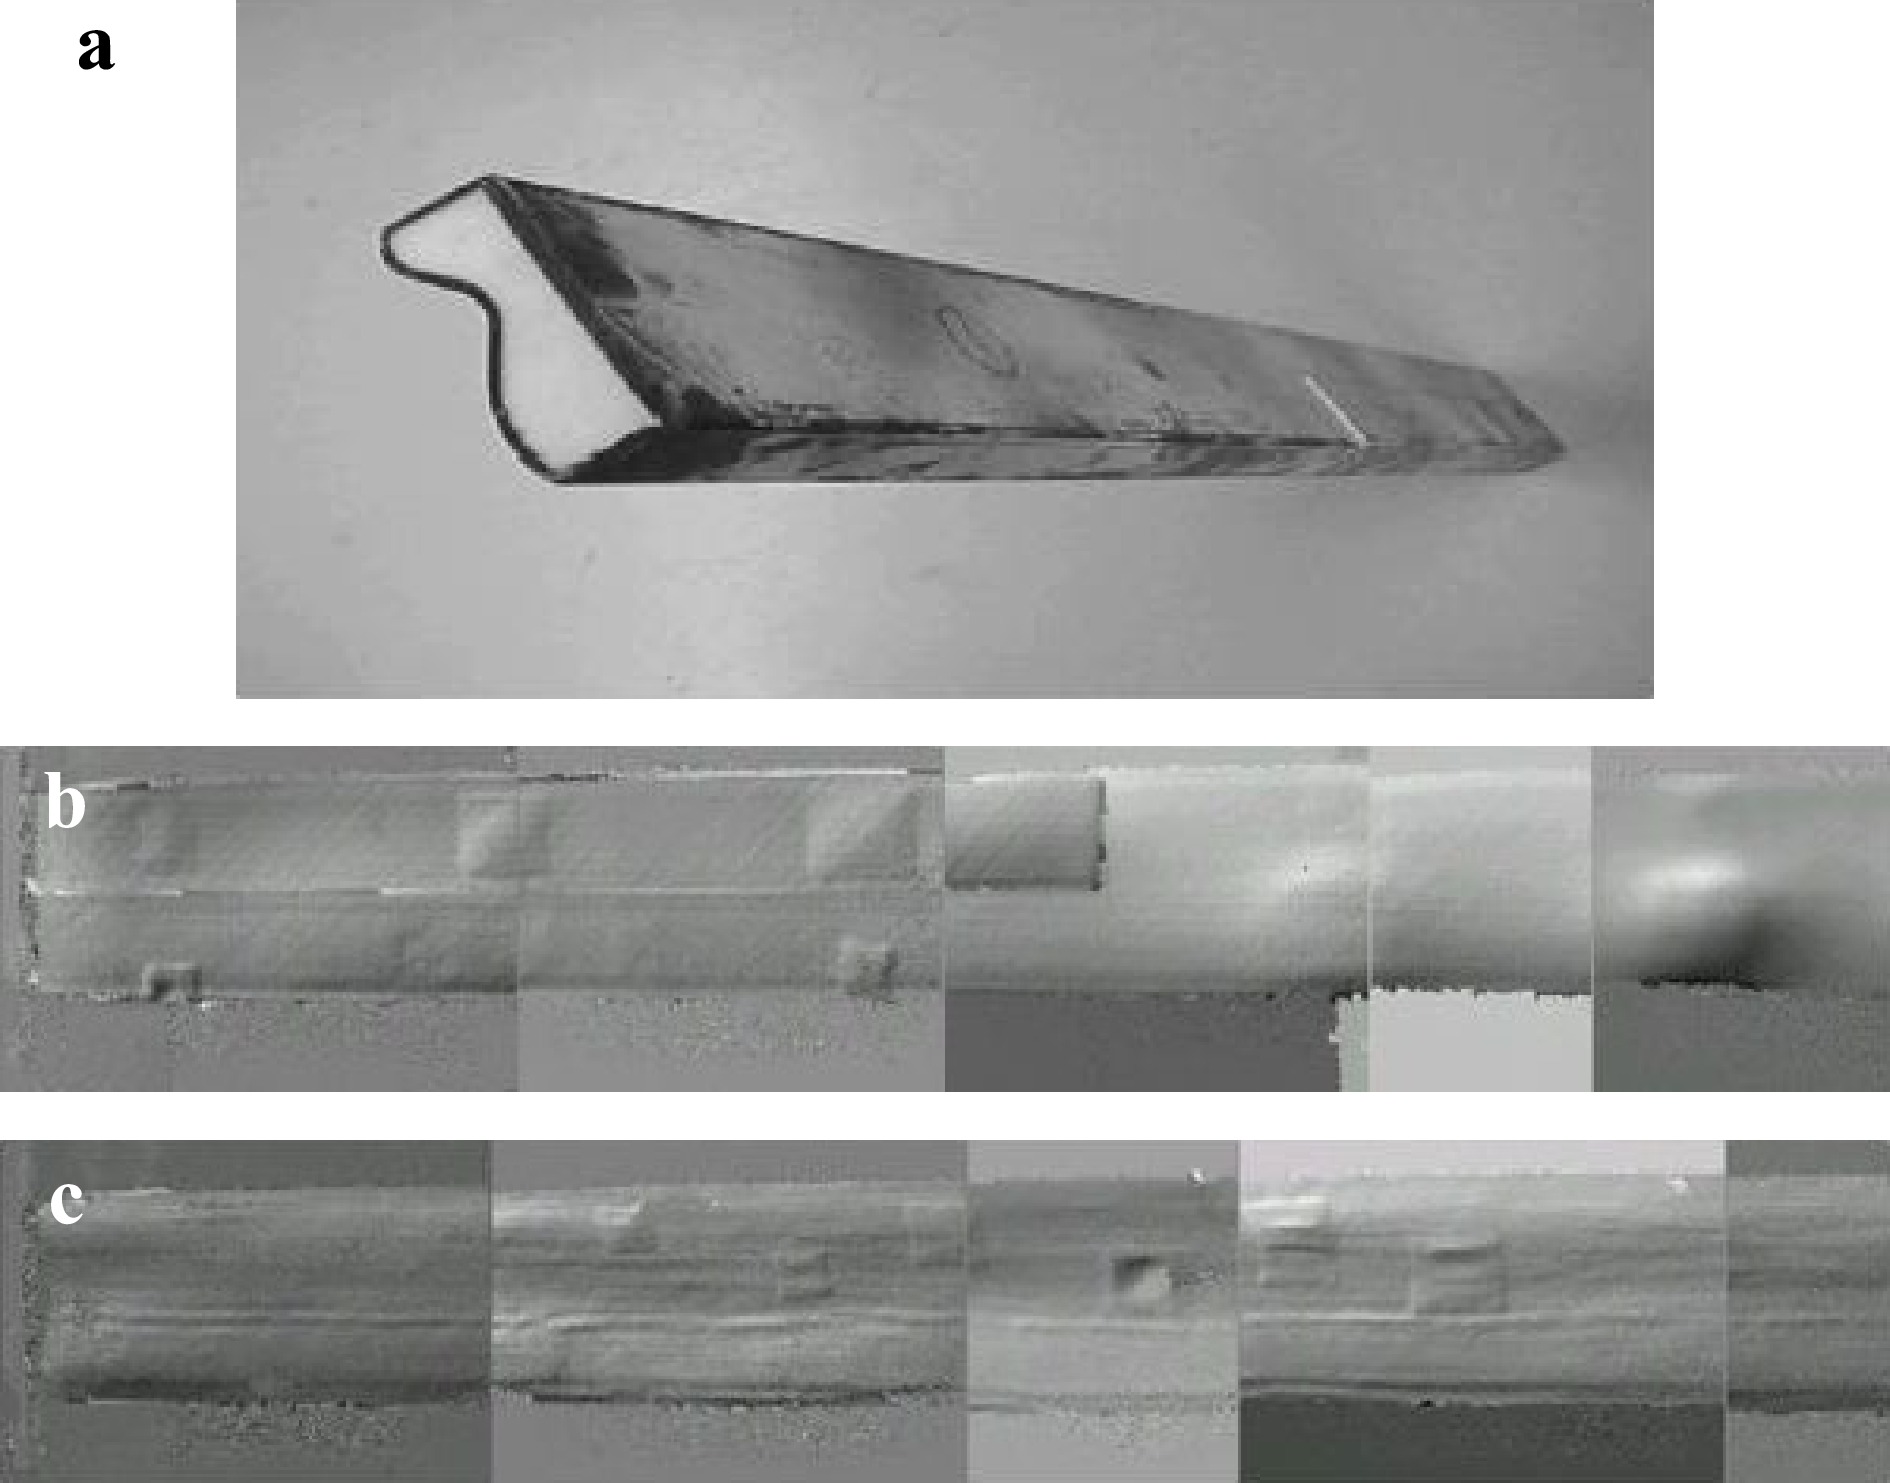
Fig. 6 Inspection of a CFRP automotive cross member (length 100 cm, width 10 cm, depth 4 cm) using shearography (Reproduced from Ref. 8). a Cross member b Inspection result of the front side c Inspection result of the back side.
Taking into account the full-field access, the robust working mode and the fast delivery of the results (the inspection of a 500 mm × 500 mm area takes only a few seconds), shearography recommends itself as powerful industrial inspection technique.
-
Aircrafts and automotive components need usually to be investigated in an in-situ industrial environment with strong vibrations, airflows and high temperatures gradients. These conditions make the measurement difficult in particular when interferometric based methods like digital holography (DH) or electronic speckle pattern interferometry (ESPI) are used for NDT of mechanical structures and dynamic analysis. Shearography (see section 3.1) allows to reduce the sensitivity to the perturbation by using a self-referencing arrangement which measure the gradients of the deformations (translations do not influence the measurements). However, for non-destructive testing, aircraft or automotive components are usually exposed to strong loading producing quite large deformations of the structure (e.g. 100 μm). Therefore for measuring such large deformations, the conventional optical systems using visible light are too sensitive. A way to make the system less sensitive to the harsh environmental condition and at the same time measure large deformations, is to use a longer wavelength (e.g. wavelength of 10 µm). In this case ESPI or DH are less sensitive to the perturbations and may be applied. There are many publications describing results obtained by ESPI and DH using visible light but few using long-wavelength infrared. The reason is that its implementation requires a particular equipment. Lasers with long wavelength and the required coherence are available (e.g. CO2 lasers) but need special care in their use. Infrared detectors with an increasing number of pixels were developed and uncooled micro-bolometer arrays with megapixel format are available. Long wavelengths require optical elements (lenses, beamsplitters) usually made of germanium or zinc selenide. It is expected that the infrared techniques for metrological measurements will develop in the next years since with the growth of the thermal-imaging market, detectors and optical components and detectors can be found in stock at affordable cost. Interferometric NDT systems based on ESPI, DH and shearography were built using the 10.6 μm wavelength emitted by a CO2 laser4647. Fig. 7 shows the ESPI setup using long wavelength, the geometrical configuration is in practice the same as the one used for visible light but the components are for infrared radiation. It includes a CO2 laser and an uncooled micro-bolometer array camera with 640 × 480 pixels. The laser beam is split in two parts, the first one illuminates the object, which scatters light towards the camera. The reference beam is coupled into the camera through an injection setup.
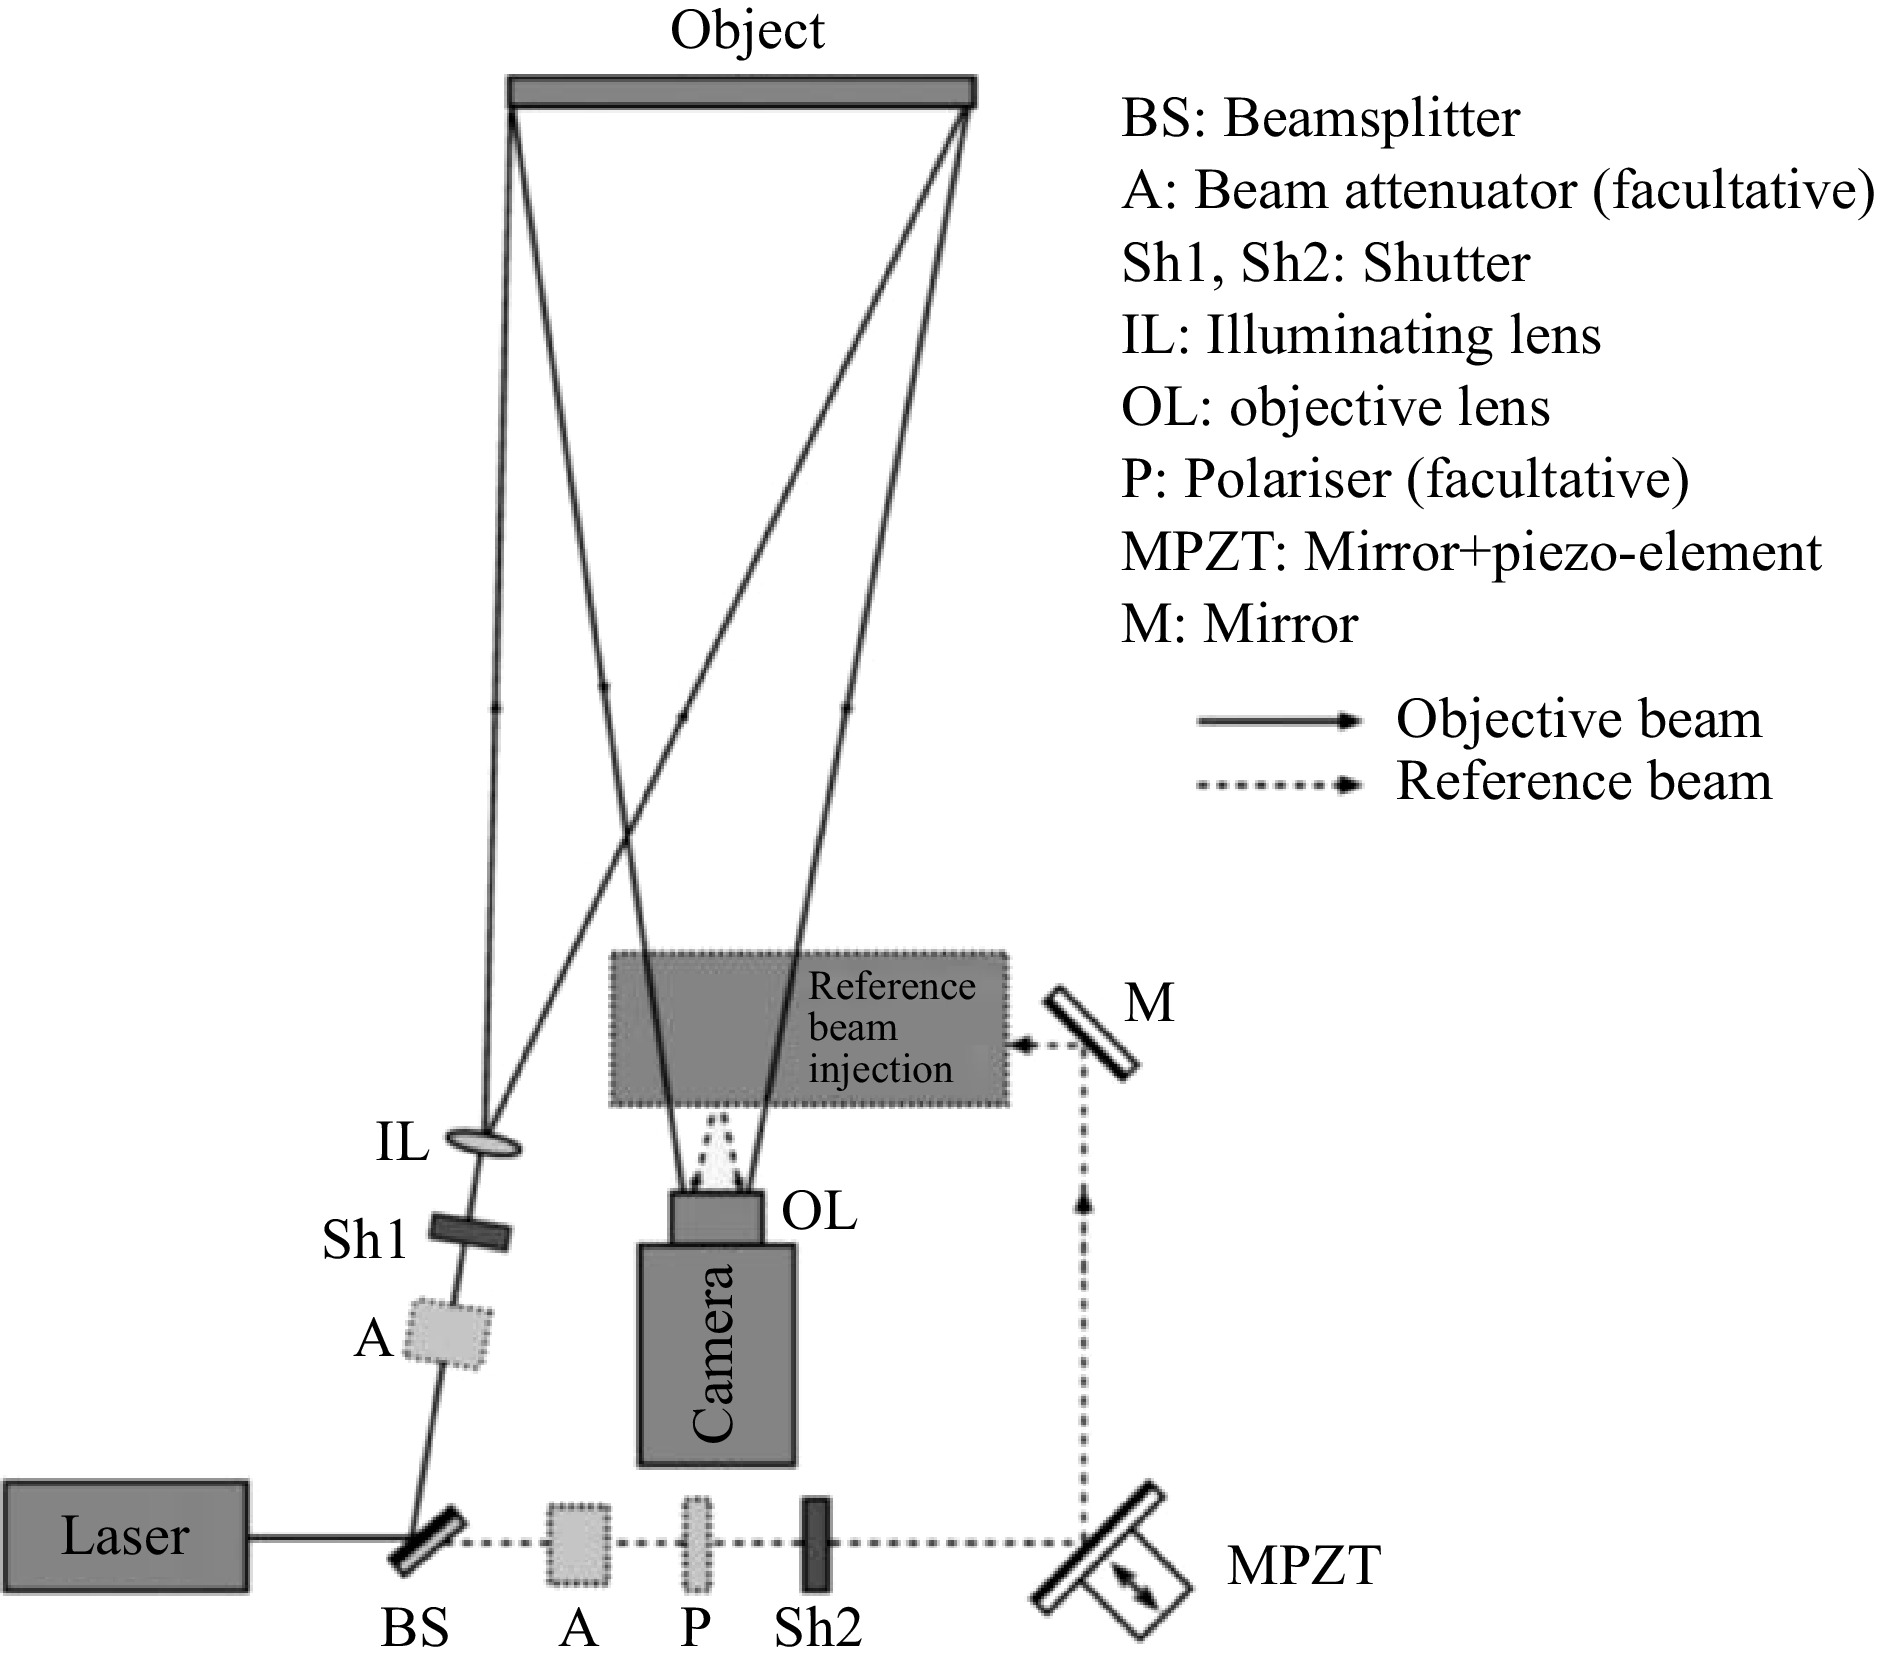
Fig. 7 Scheme of the ESPI setup using long (10.6 μm) wavelength (Reproduced from Ref. 46).
Composite samples (glass-fiber reinforced plastic (GFRP), carbon-fiber-reinforced plastic (CFRP), and Kevlar) with various layers and defects of different natures and depths underneath the surface were investigated with the long wavelength ESPI setup. These are the aeronautical components that usually need to be tested on the production site for the assessment of mechanical behavior (displacement measurement) under loads. Fig. 8a shows one of the samples used for the investigations, it has a size of 36 × 30 cm2 and is composed by a 18 mm thick Rohacell core sandwiched between two Kevlar skins. Defects arranged in four vertical zones with increasing thickness were included between the upper skin and the core. Locations and shapes of the defects are marked on the picture: each zone has debondings (black dots), cracked core (grey dots), and surface cracks (grey lines). The surface roughness of the sample was larger than the wavelength therefore fully developed speckles were produced. Thermal stress using a lamp was applied to the sample and its deformation was measured with the ESPI system shown in Fig. 7. Phase-shifted specklegrams are at first recorded before heating the sample. Then the lamp is switched on for a few tens of seconds. Afterwards new phase-shifted specklegrams were recorded. The phases of the wavefronts recorded before and after loading are calculated from the specklegrams and their differences are computed. Fig. 8b shows the phase map corresponding to the surface deformation. There are circular fringes corresponding to the global deformation of the sample, whereas defects can be seen as local fringe patterns in some places. Fig. 8c shows a result obtained after unwrapping the phase map shown in Fig. 8b, and subtracting the global deformation. The remainder is the contribution of local deformation induced by defects which can be clearly visualized.
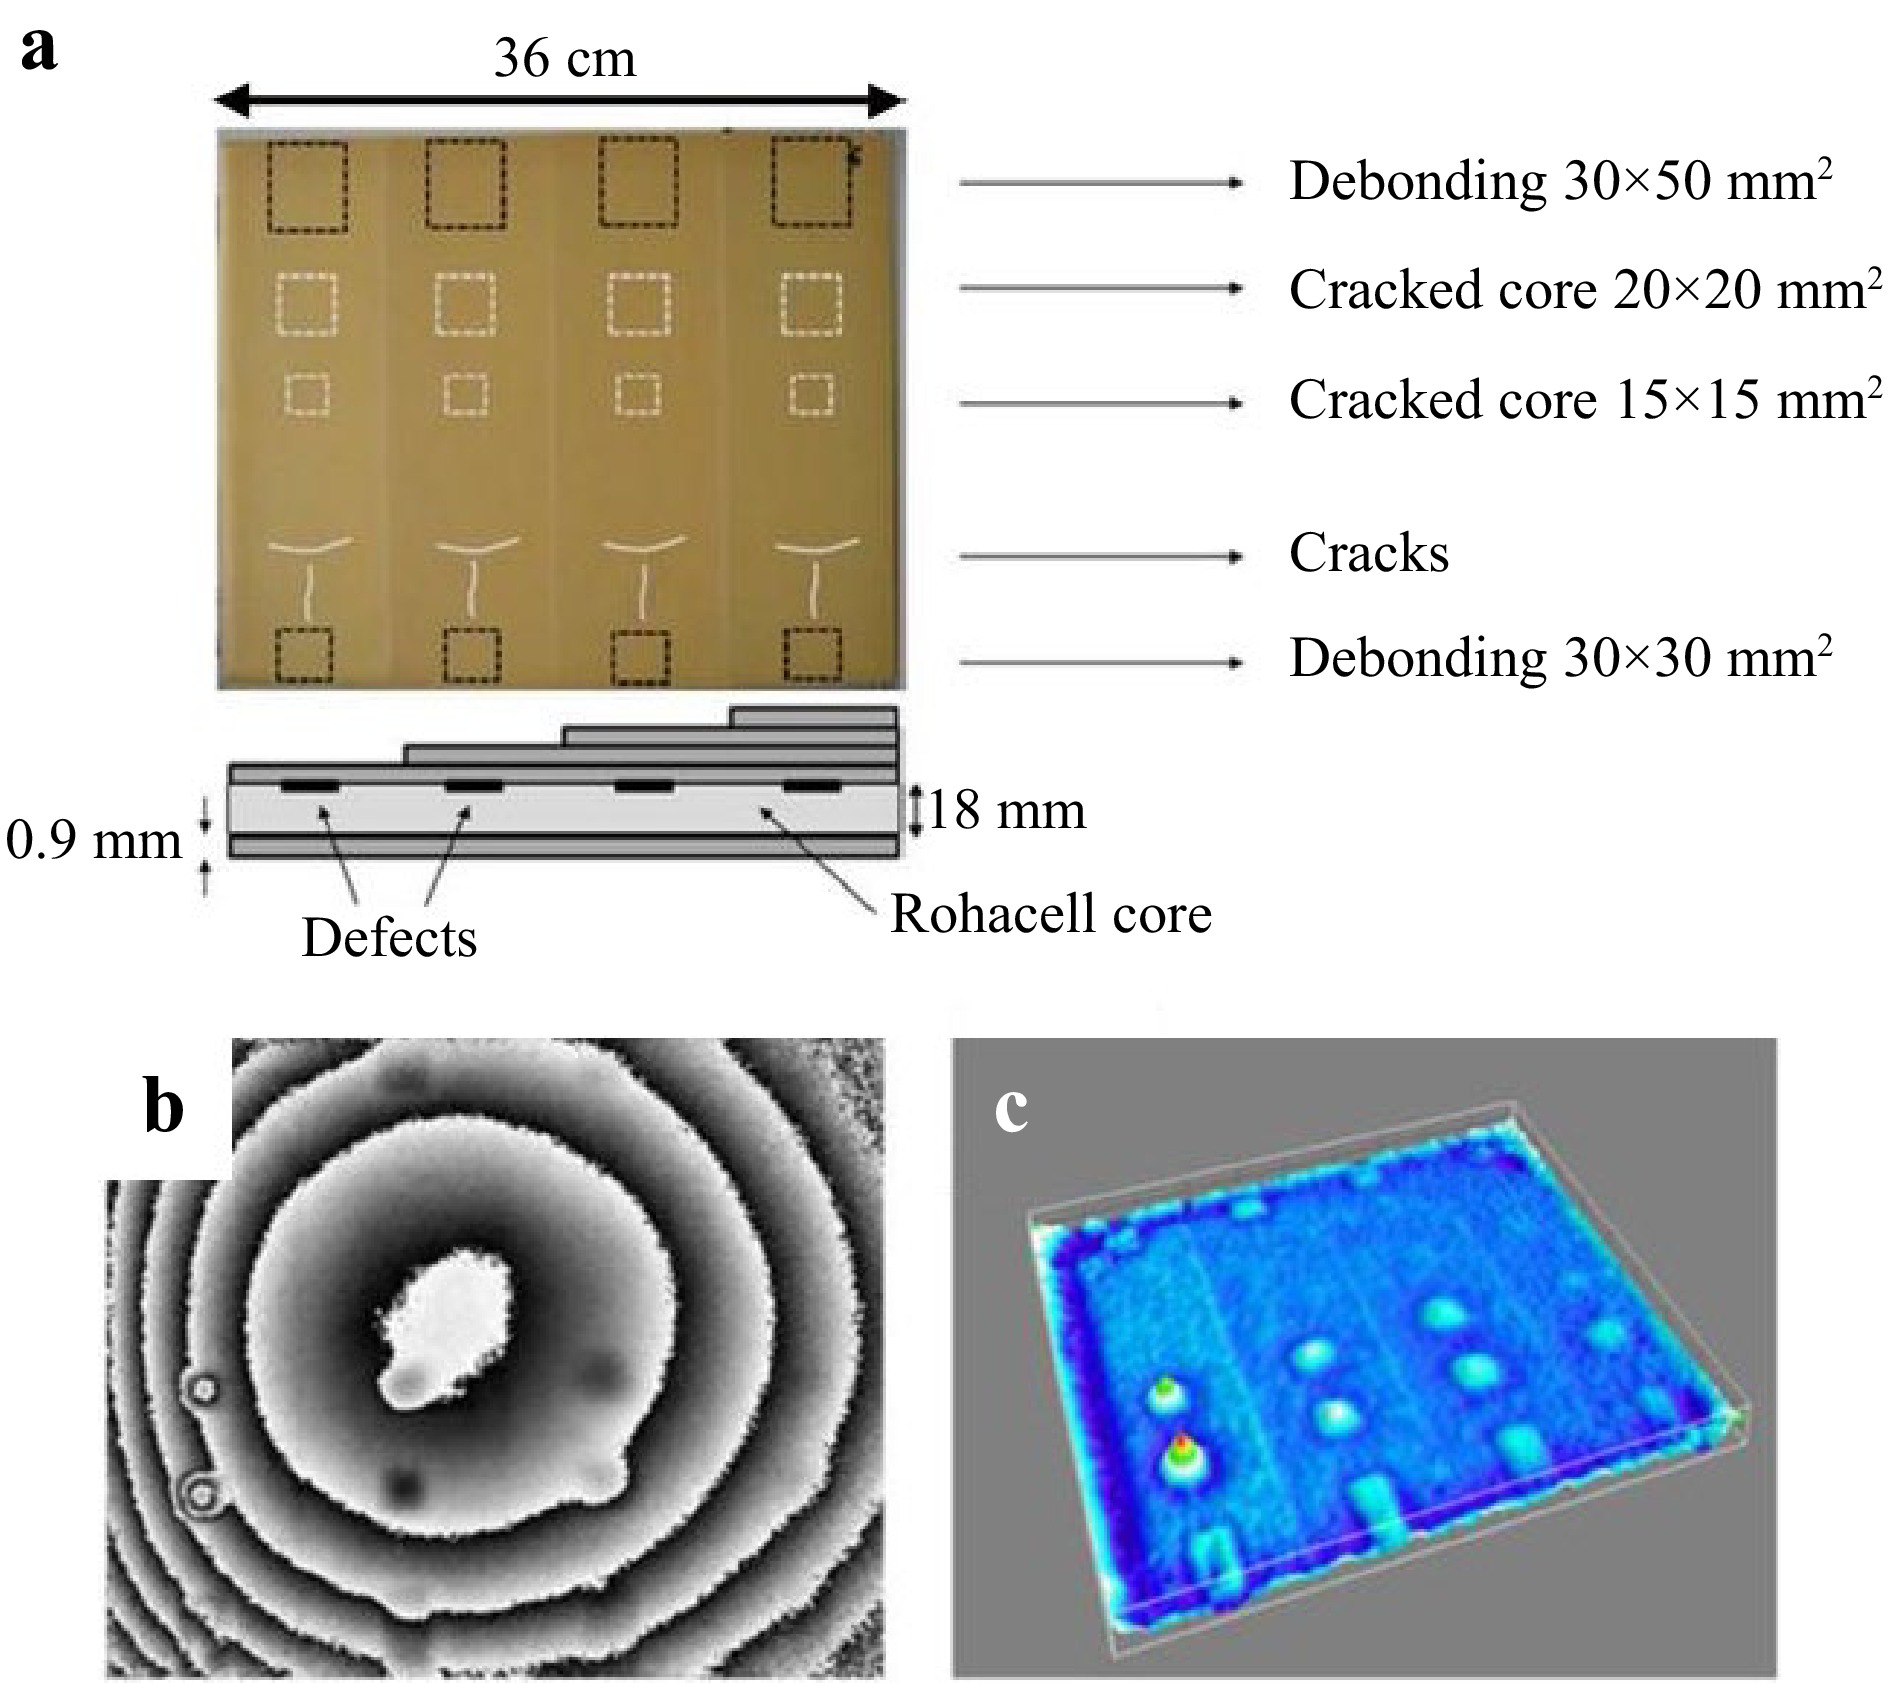
Fig. 8 a Definition of the sample used in the experiment, b Phase map modulo 2π obtained after heating composite samples. c Defect map after postprocessing the phase map (Reproduced from Ref. 46).
-
Ceramic coatings are commonly used to improve the wear or heat resistance of many technical components48, but due to their deposition process, e.g. plasma or high velocity oxygen fuel spraying, rather high residual stresses can build up within the coating and underneath. The reason for that are differences in the coatings and substrates expansion coefficients, inhomogeneous temperature distribution during the process and the quenching of splats. The mechanical hole drilling technique49 can be used for the detection of residual stresses in coatings, which are locally relieved due to the material removal process. This lead to deformations of the surface around the hole which are measured as relaxed strains through strain gauges rosettes. These deformations in combination with appropriate calibration data (separately determined by simulation for the layer composite), allows the quantitative determination of the residual stress depth profile. The disadvantage of the strain gauges is that they can only be used on flat and relatively smooth surfaces, where the rosette is applied.
In Refs.50,51 a method to avoid the mechanical drilling and the application of strain gauges was proposed. A pulsed laser is used for the object machining (ablation process) leading to 3D deformation due to residual stress relaxation which are measured by an optical system based on digital holographic interferometry. The residual stresses at different depth of the coating are calculated from the deformations obtained after incremental loading, the profile (shape, depth) of the machined surface and the material parameters. It was shown in Ref.51 that the technique can be used for determining residual stresses under industrial conditions. The Atmospheric Plasma Spraying (APS) is placed on a robot arm that can move in the space between the optical measuring system and the object to be coated. The distance between the sample and the measuring system is approximately 0.8 m. The APS and the measuring system are inside a cabin that is hermetically closed during the coating process. The robot for coating and the optical systems are shown in Fig. 9. The purple light is due to the high temperature plasma glow. During the coating process the temperature of the object rises up to 400 ℃. The set-up for laser machining and deformation measurement shown in Fig. 9a includes an infrared pulsed laser (wavelength: 1064 nm, pulse length 10 ns, maximal pulse energy 700 mJ) and a digital holographic system using two cw laser (wavelength 532 nm). The sample is illuminated at the same time from two directions and there are also two reference waves. Multiplexing of holograms allows synchronous measurement of in-plane and out-of-plane deformations. Fig. 10 shows residual stresses inside a coating measured with the holographic method (from 30 µm to 130 µm) and the traditional micro hole drilling method (HDM). In spite of the fact that the DHI measurements seem to underestimate the residual stresses measured with the HDM, there is a similar behaviour for the common depth interval. In principle it is possible to use laser ablation and digital holography also for depth of 200 µm or more.
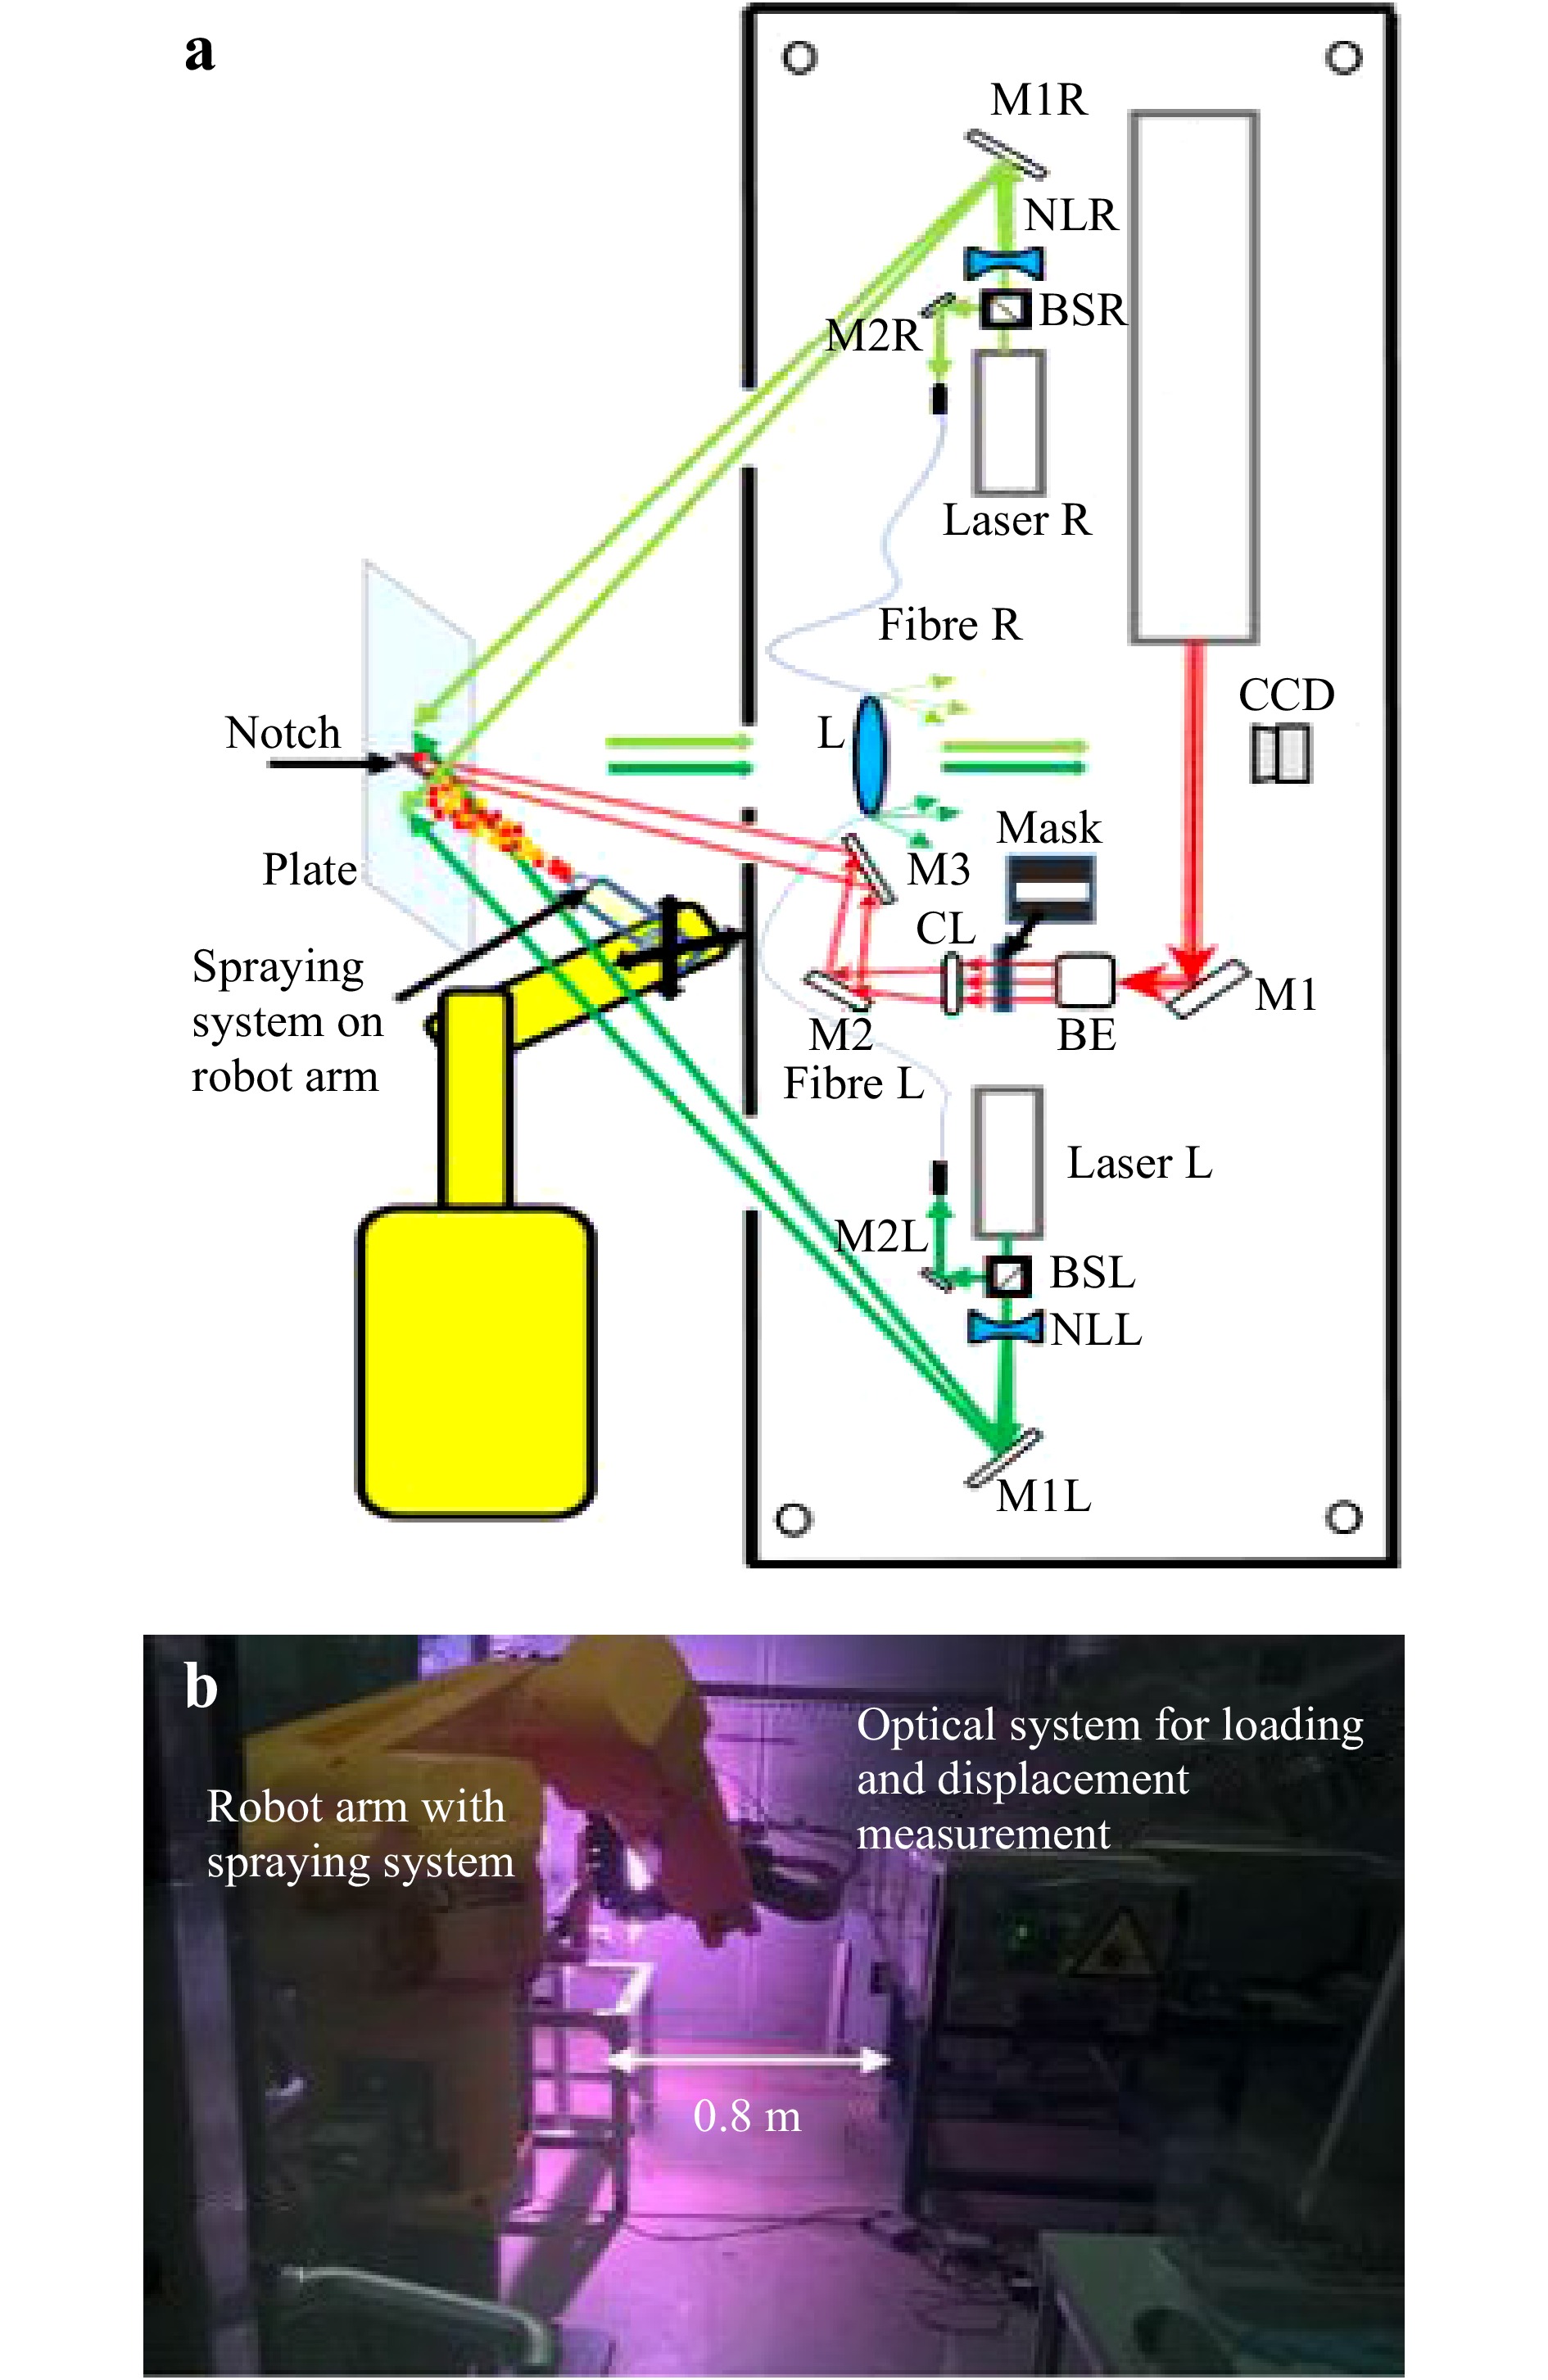
Fig. 9 a Set-up for laser machining and displacement measurement. b Coating system mounted on a robot arm and optical system (Reproduced from Ref. 51).
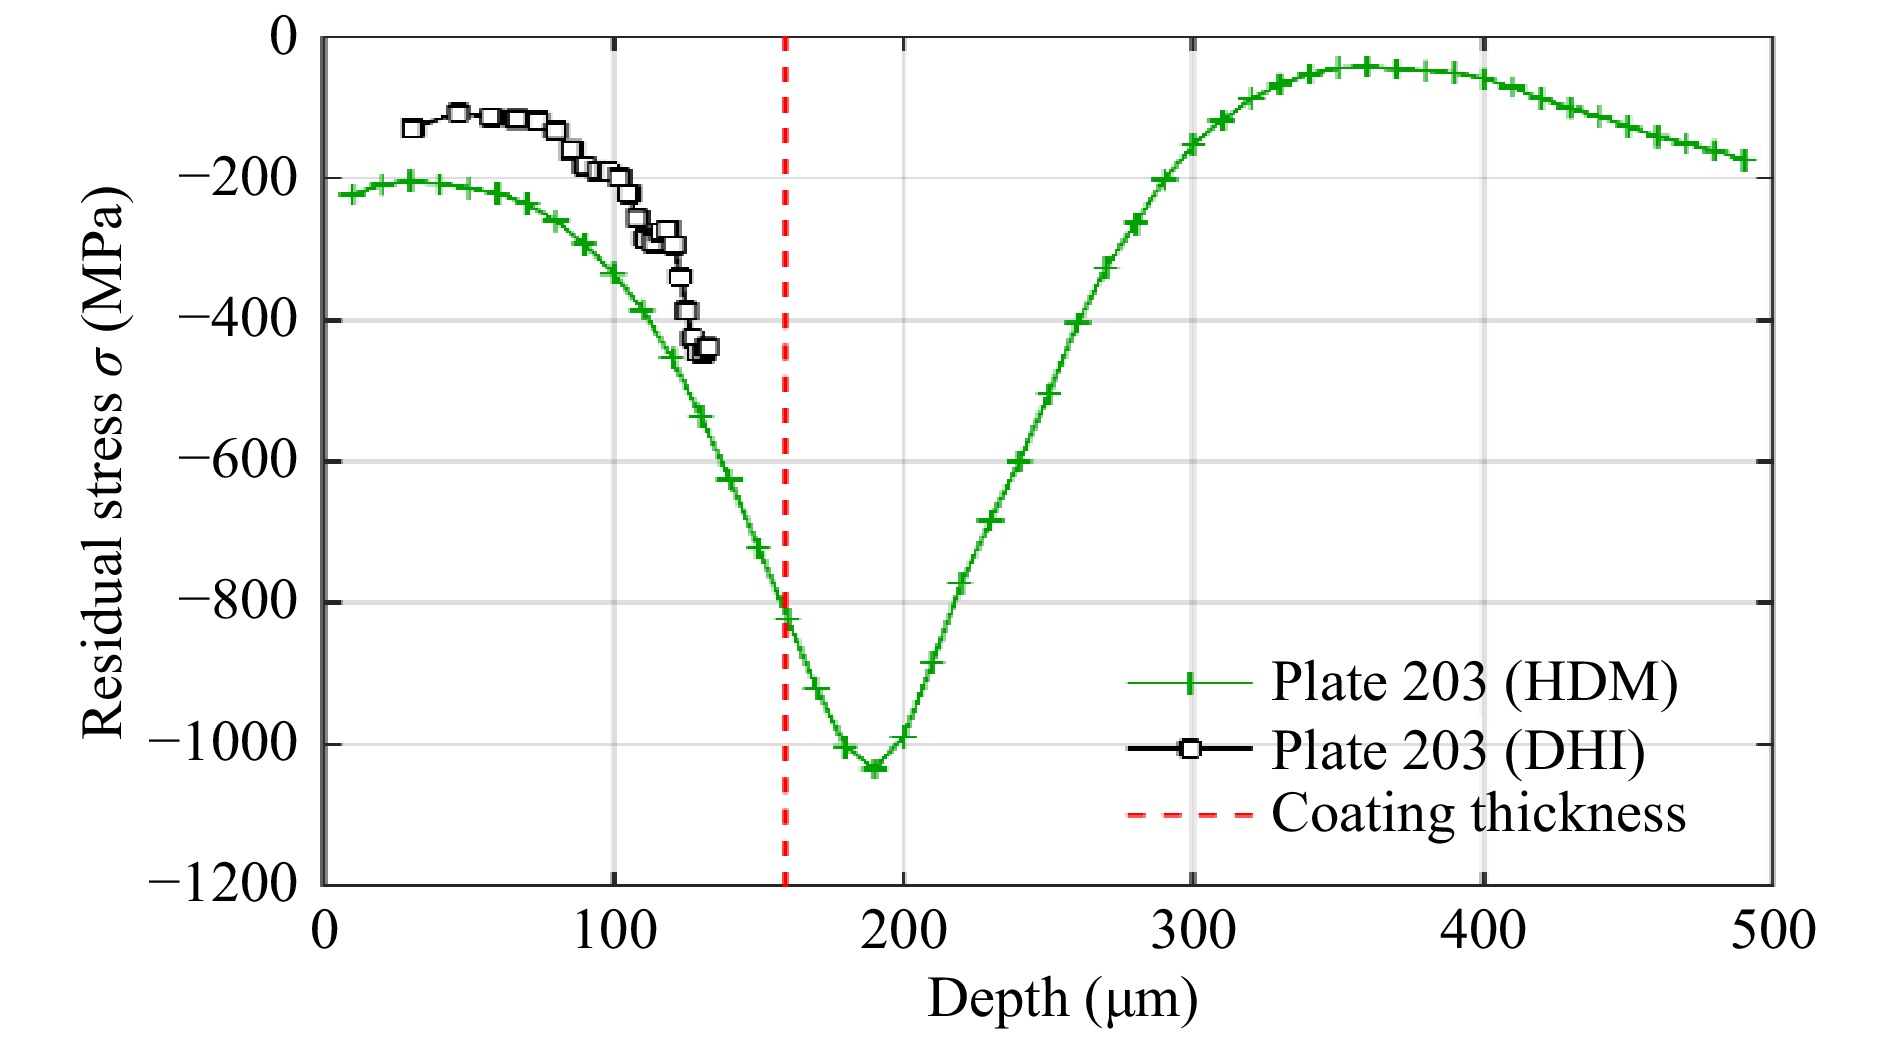
Fig. 10 Residual stresses inside a coating measured by the micro hole drilling method (HDM) and laser ablation combined with digital holographic interferometry (DHI) The coating thickness for this plate is approximately 160 µm (dashed vertical line). Reproduced from Ref. 51.
Fig. 11a shows a phase map (modulo 2π) corresponding to the in-plane displacements produced by laser loading a notch just after coating. The temperature of the surface monitored by a pyrometer was 360 °C. The plate was then cooled down at 215, 98, 24 °C, and phase maps corresponding to displacements produced by application of the same laser loading were determined (see Fig. 11b–d). From the phase maps, it is possible to calculate the in-plane displacements. In Fig. 11a, there are few fringes and, thus, the displacement and the residual stresses are small. The displacement increases (more fringes in the phase maps) when the temperature decreases, thus the residual stresses are produced when the coating cool down. The phase maps recorded at higher temperature have lower quality (more noise). This can be explained by considering that it was not possible to keep the temperature constant during the measurements. These temperature instabilities produce changes of the coating microstructure degrading the quality of the results.
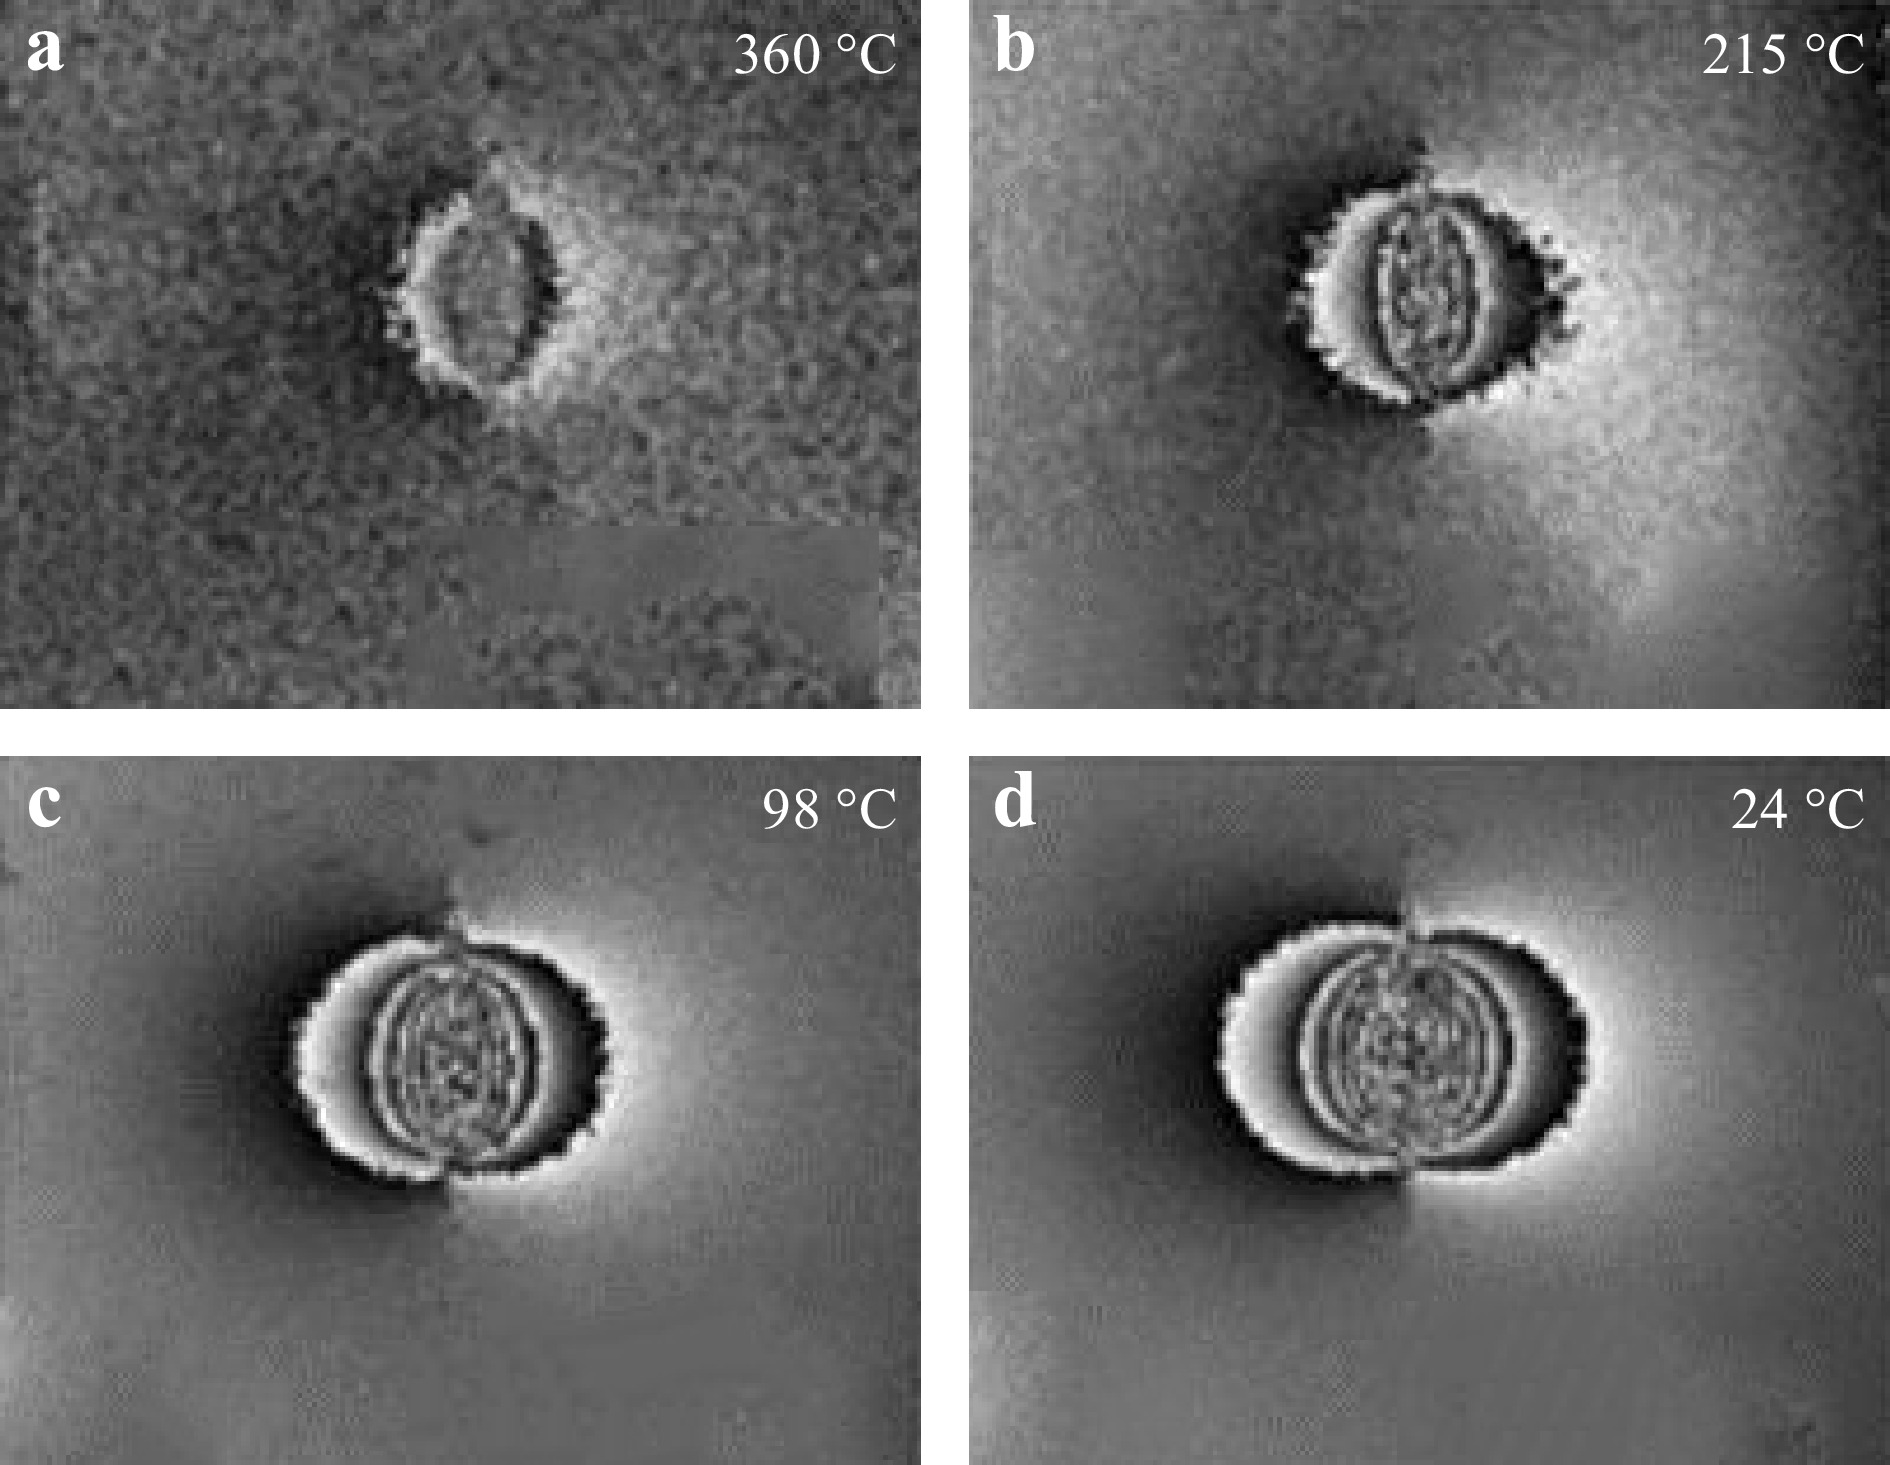
Fig. 11 Phase maps mod (2π) obtained by measurements at different temperatures (Reproduced from Ref. 51).
For obtaining the results shown in Fig. 11, a simple notch was machined in the coating but in Ref.50 it was shown that more complex structures (cross, circles, rings…) may be machined in the coated surface allowing to locally release and detect residual stresses along different directions. For machining complex structures at different positions of the coating, a spatial light modulator (SLM) together with a pulsed laser were used50,52.
-
The trend towards miniaturization of micro-electro-mechanical systems (MEMS) and micro-opto-electro-mechanical systems (MOEMS) continues to lead to more and more compact devices. Advantages lie in the integration with control electronics, lower power dissipation, higher sensitivity and better performance. Applications cover a wide range of fields, from optical telecommunications to medicine. Part of the functionality and reliability of the devices is based on the displacement and deformation of micromechanical parts under mechanical, thermal, magnetic or electrostatic loads. The measurement of the deformation of such systems is thus of great importance for confirming analytical and finite element models, accessing material and device properties, detecting potential defects and determining performance. Since typical structures exhibit dimensions in the order of some micrometers, it is necessary to measure their deformation with accuracies down to the nanometer range. Standardized approaches and calibrated setups are therefore essential for the measurement of displacement and deformations in the static and dynamic cases. Standards and guide lines for the use of different full-field optical techniques in the measurement of out-of-plane and in-plane displacements of microsystems were developed53-55. This process involved:
- Development of micromechanical reference components designed to deform in a reproducible and precise way when submitted to known loads;
- Calibration of the reference devices by means of optical techniques, performed in laboratory controlled conditions;
- Determination of the measurement uncertainties according to the guide of expression of uncertainty in measurement (GUM);
Fig. 12a shows a reference test object designed to have a very accurate out-of-plane displacement produced by applying an electrical voltage to the structure. The displacement was measured by using a method based on digital holography. Figs. 12b–d show 3-D representations of the measured out-of-plane deformations when 15, 30, and 50 V are applied to the MEMS. Fig. 13 shows the deformation of the same MEMS at the center of the moving element as a function of the applied voltage. A very good agreement between expected and measured displacement was found. It was shown that the out-of-plane displacements may be performed with an accuracy of ±1.0 nm.
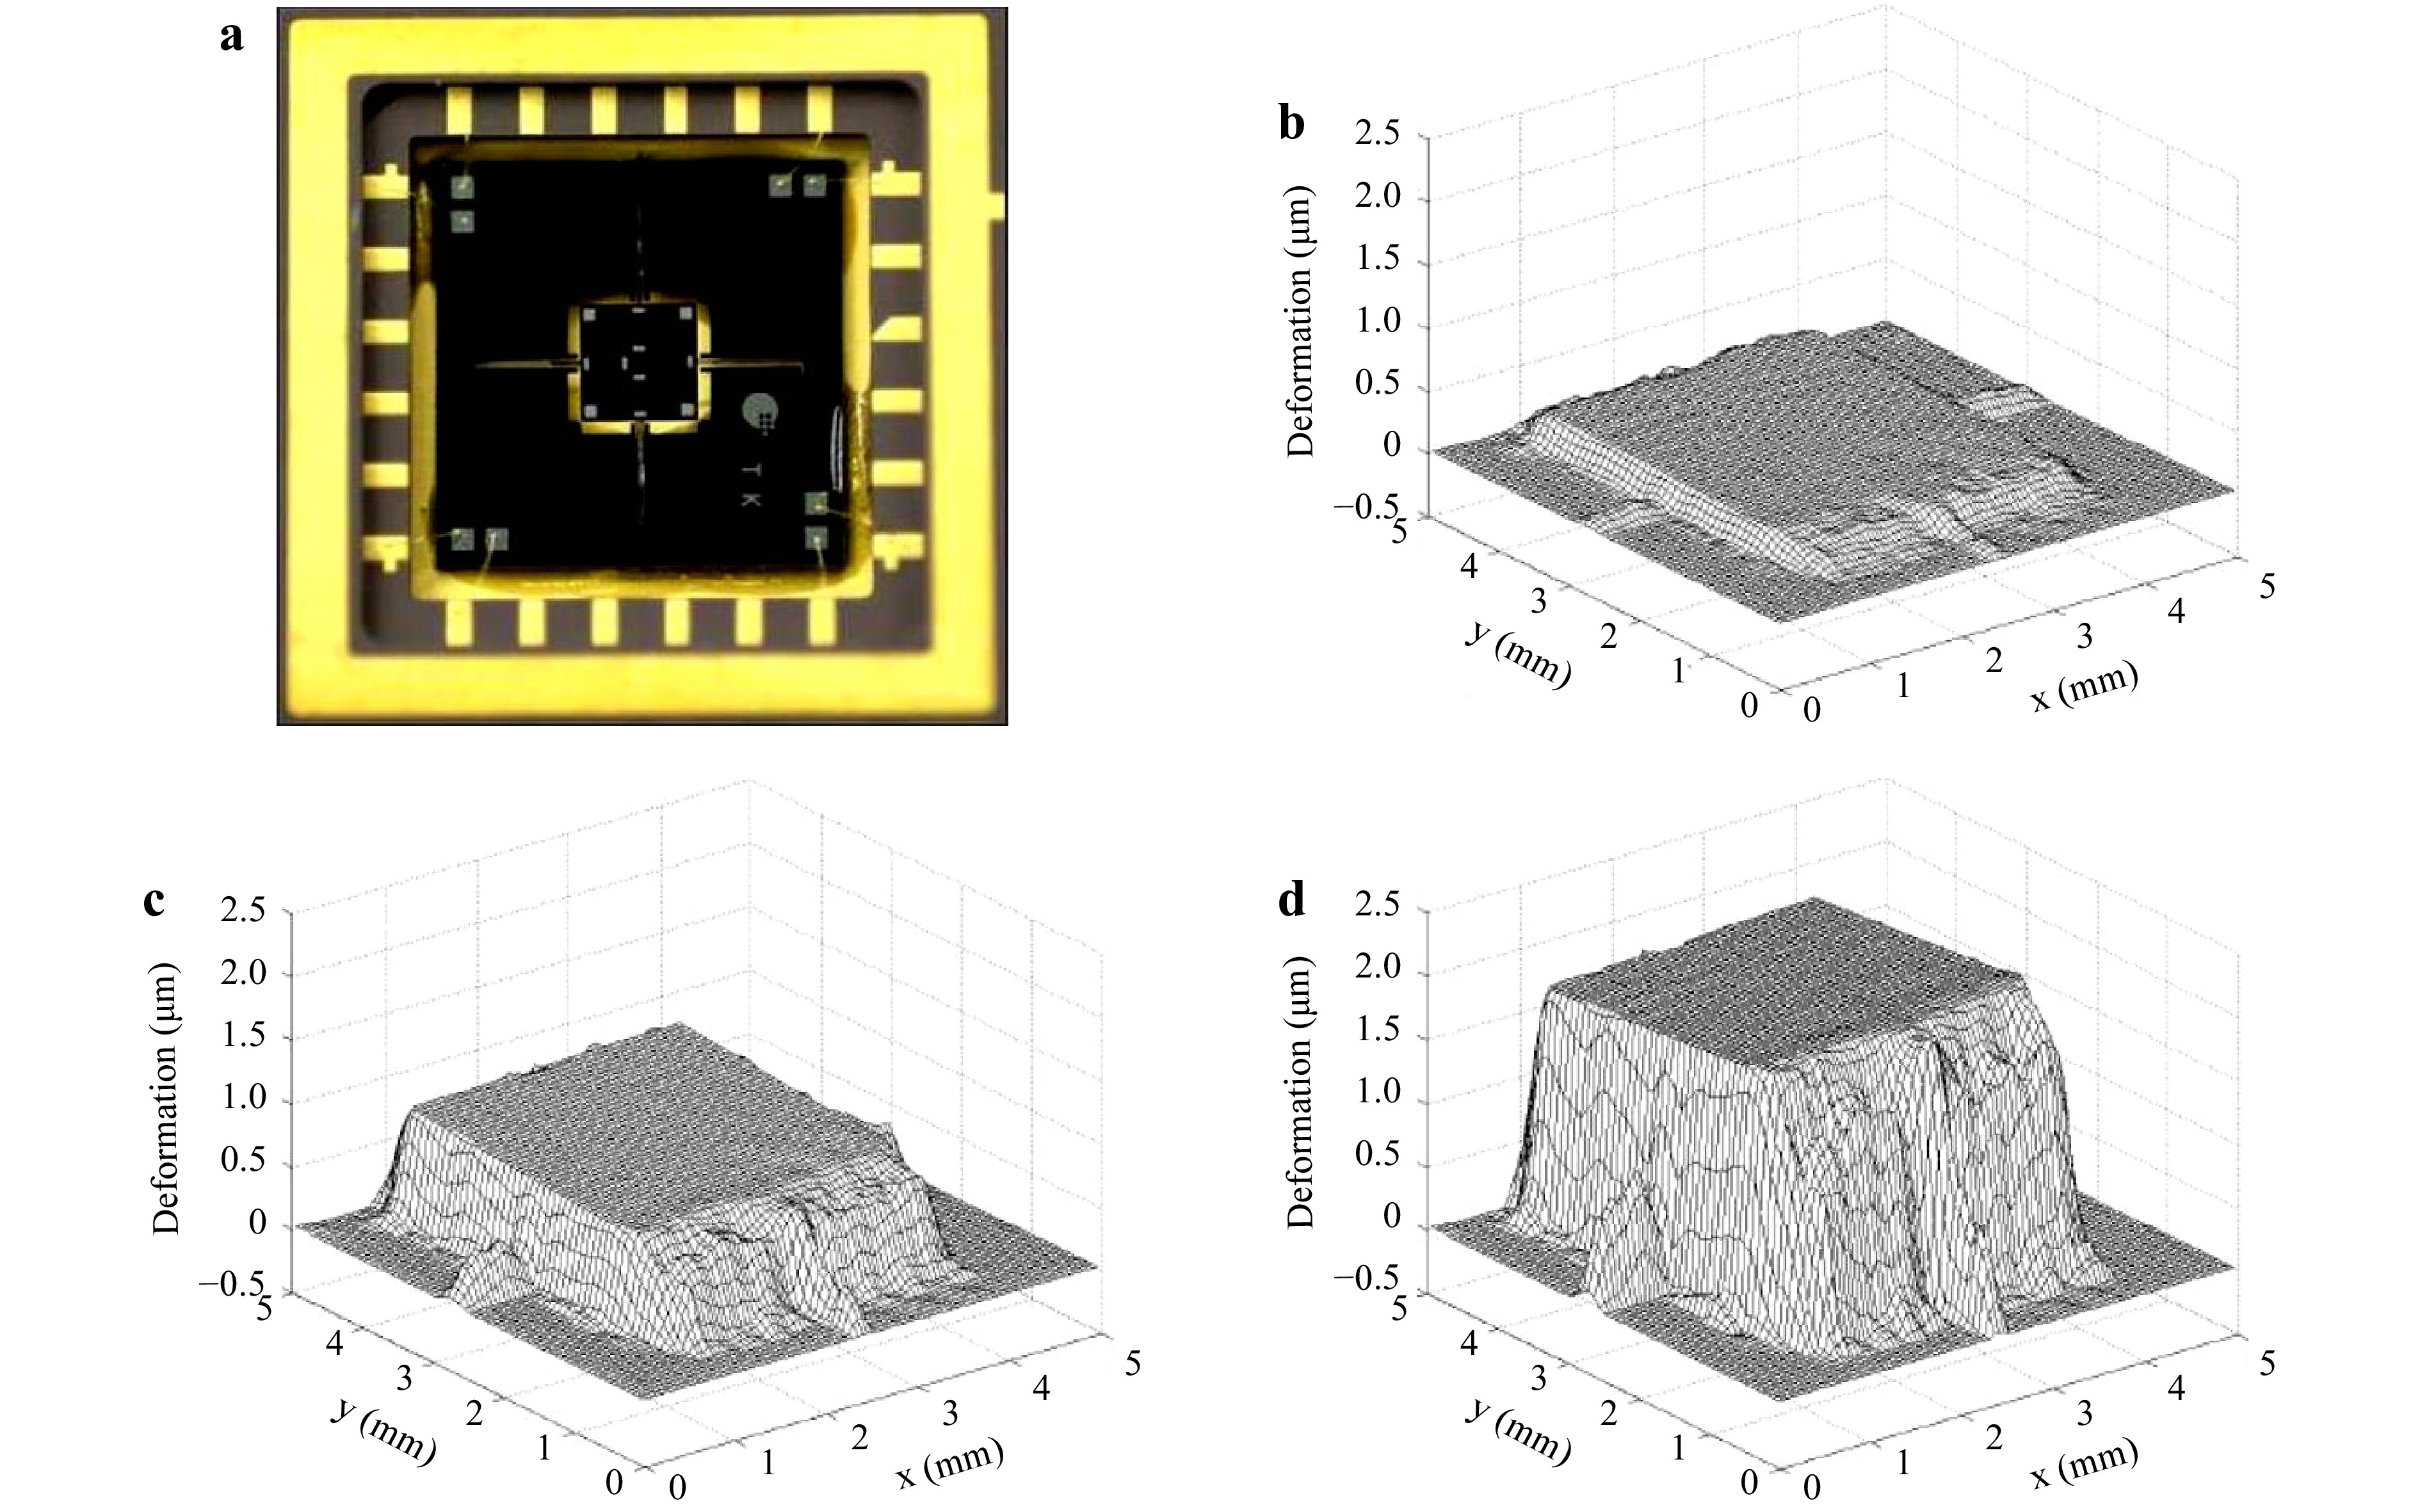
Fig. 12 Photo of the MEMS a. Out-of-plane deformations obtained by applying 15 V b, 30 V c, and 50 V d. Reproduced from Ref 55.
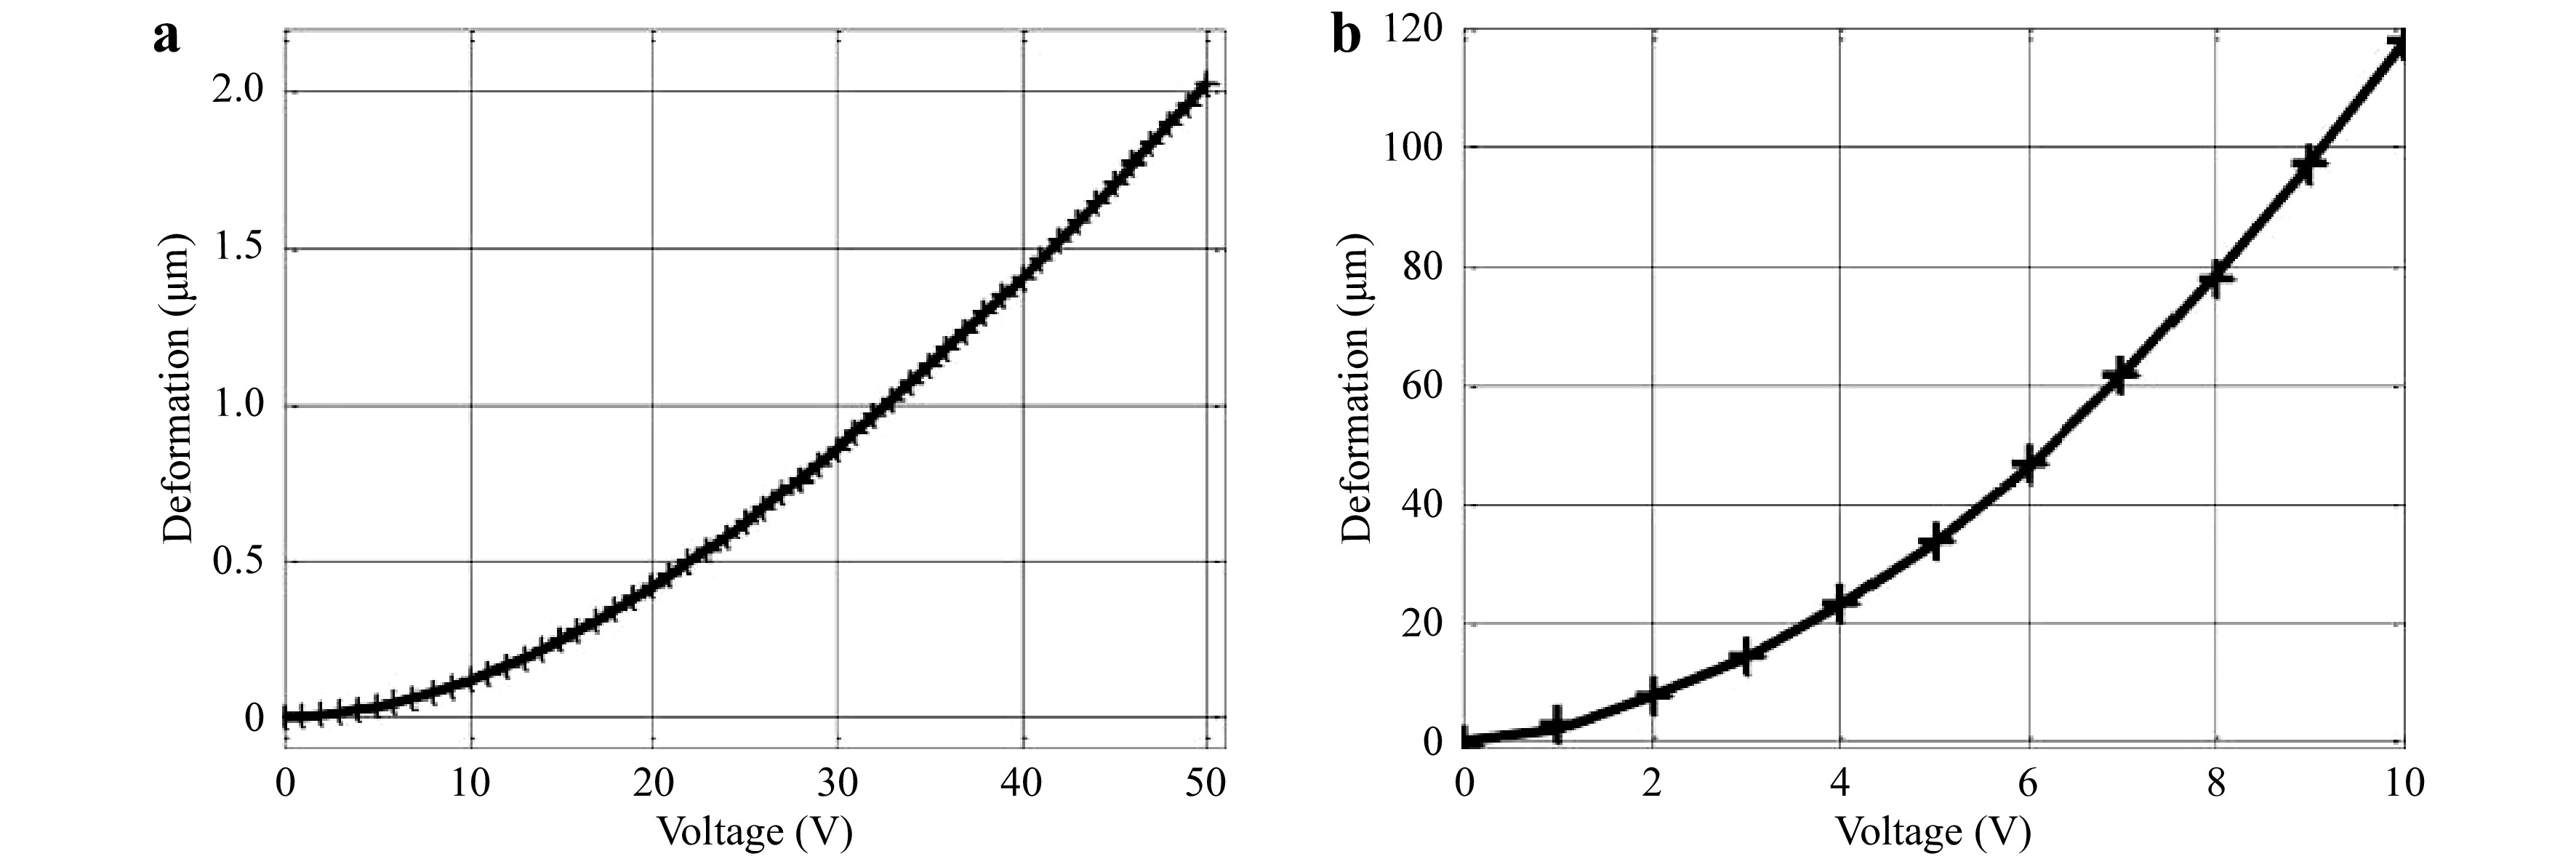
Fig. 13 a Measured (+) and expected (solid line) deformation as a function of the applied voltage, b detail of a. Reproduced from Ref. 55.
Devices having very accurate in-plane movements were also manufactured and tested55. The estimated uncertainty of the in-plane displacement measurements is worse compared with the out-of-plane and depends on the displacement magnitude; it was shown that in-plane displacement measurements in the range of 0–100 nm may be performed with an accuracy of ±5 nm.
-
In Ref. 56 a feasibility study for erosion measurements under extreme environmental conditions inside the ITER Tokamak is described. The ITER project (Fig. 14a) is the next step in the transition from experimental studies of plasma physics to full-scale electricity-producing fusion power stations. It fuses the hydrogen isotopes deuterium and tritium into helium thereby releasing a high energy neutron. In order to start the fusion reaction the temperature has to be about 150 million Kelvin, creating a plasma. Because there is no material that could withstand such high temperatures, the plasma is guided, contactless, by magnetic fields within the vacuum chamber. However, these fields are not fully closed, resulting in partial plasma contact particularly in the divertor region. This leads to wear effects, affecting the overall performance and reliability of the Tokamak and potentially generating metallic dust. Thus, there is a need for the regular measuring of the erosion and deposition at the wall once the Tokamak starts operating. An erosion and deposition monitor able to measure the changes in the surface shape with a depth resolution of 10 µm is planned. The measurement will be done not on the whole internal surface of the Tokamak but on two surfaces of the divertors that endure high rates of erosion and deposition, each of a size of 10 × 30 cm2. Due to the high temperature and radiation it will not be possible to have the measuring system inside the Tokamak, for this reason the measurements will be performed remotely. Hence the opto-electronic instruments (detector, laser, controlling electronics) will be located at a distance of about 40 m from the surface to be measured.
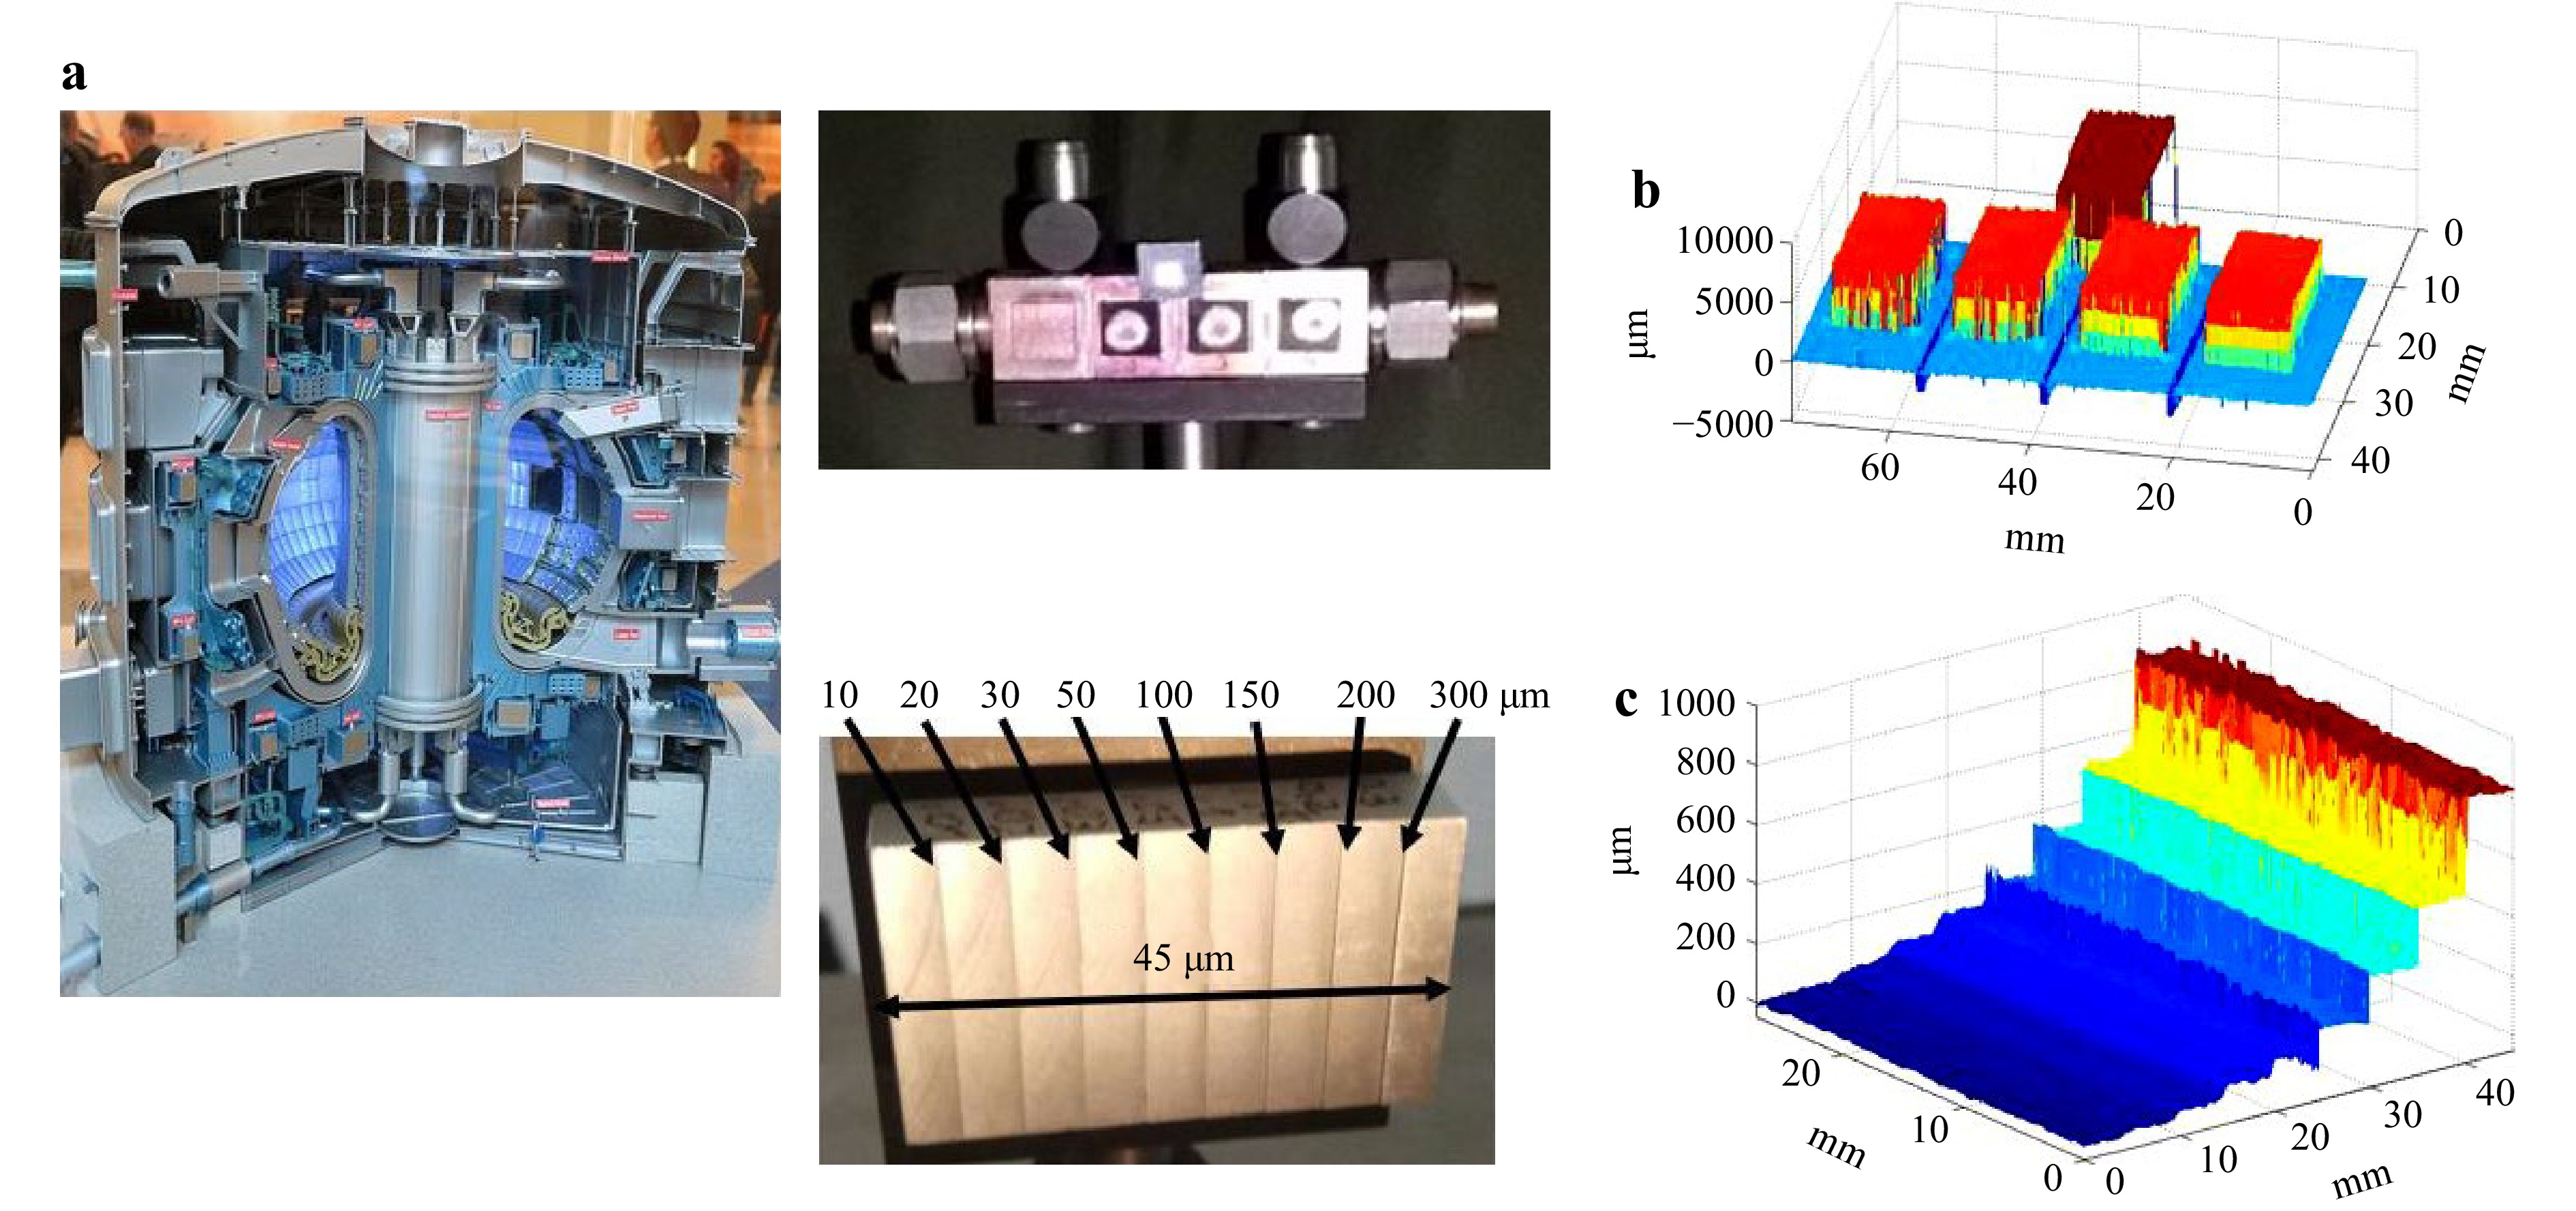
Fig. 14 a CAD model of the Tokamak58. b Shape reconstruction of tungsten sample located at a distance of 23 m from the measuring system. c Shape measurement of a rectangular 45 × 27 mm2 aluminum plate with steps having depths of 10, 20, 30, 50, 100, 150, 200, 300 µm. b and c were reproduced from Ref. 56.
In Ref. 56 it was shown that long distance shape measurements in challenging environmental conditions (vibrations and long distance) can be done by two wavelength digital holography57 and thus this technique could be used for the erosion monitoring inside the Tokamak. Fig. 14b shows the measurement of a tungsten sample located on a non vibration isolated tripod at a distance of 23 m from the measuring system. Fig. 14c shows the measurement of a rectangular 45 × 27 mm2 aluminum plate with steps having depths of 10, 20, 30, 50, 100, 150, 200, 300 µm. In this last case the sample was investigated by using a 14 m endoscopic system.
-
Coherent-optical methods have proven that they are also valuable tools for the testing of artwork with respect to many purposes14,59,60. Especially, when cultural heritage is moved between various locations the precise monitoring of the current state of the artefact is indispensable61. Recently speckle shearography was used for the testing of a famous painting, the Madonna from Stuppach, painted by Matthias Grünwald around 151562, Fig. 15a. The painting was borrowed by the township Stuppach for an exhibition in Dresden in 2011. After the return it was evaluated by speckle shearography63 to help the conservators in the unavoidable process of restoration. Fig. 15 presents some results where the detected sub-surface defects are clearly visible. The large painting (appr. 1.9 m × 1.5 m) was segmented into 16 subareas. Each of them was investigated separately by making a speckle shearogram. A variety of defects such as bubbles, delaminations, cementations, and impacts of timber worms could be recognized immediately. These results are a valuable guidance for the planing of the restoration work to be done by the conservators. Current activities are directed to the design of an adapted loading procedure64 and to an improved classification of the faults by a combination of FEM simulation and shearographic measurement65.
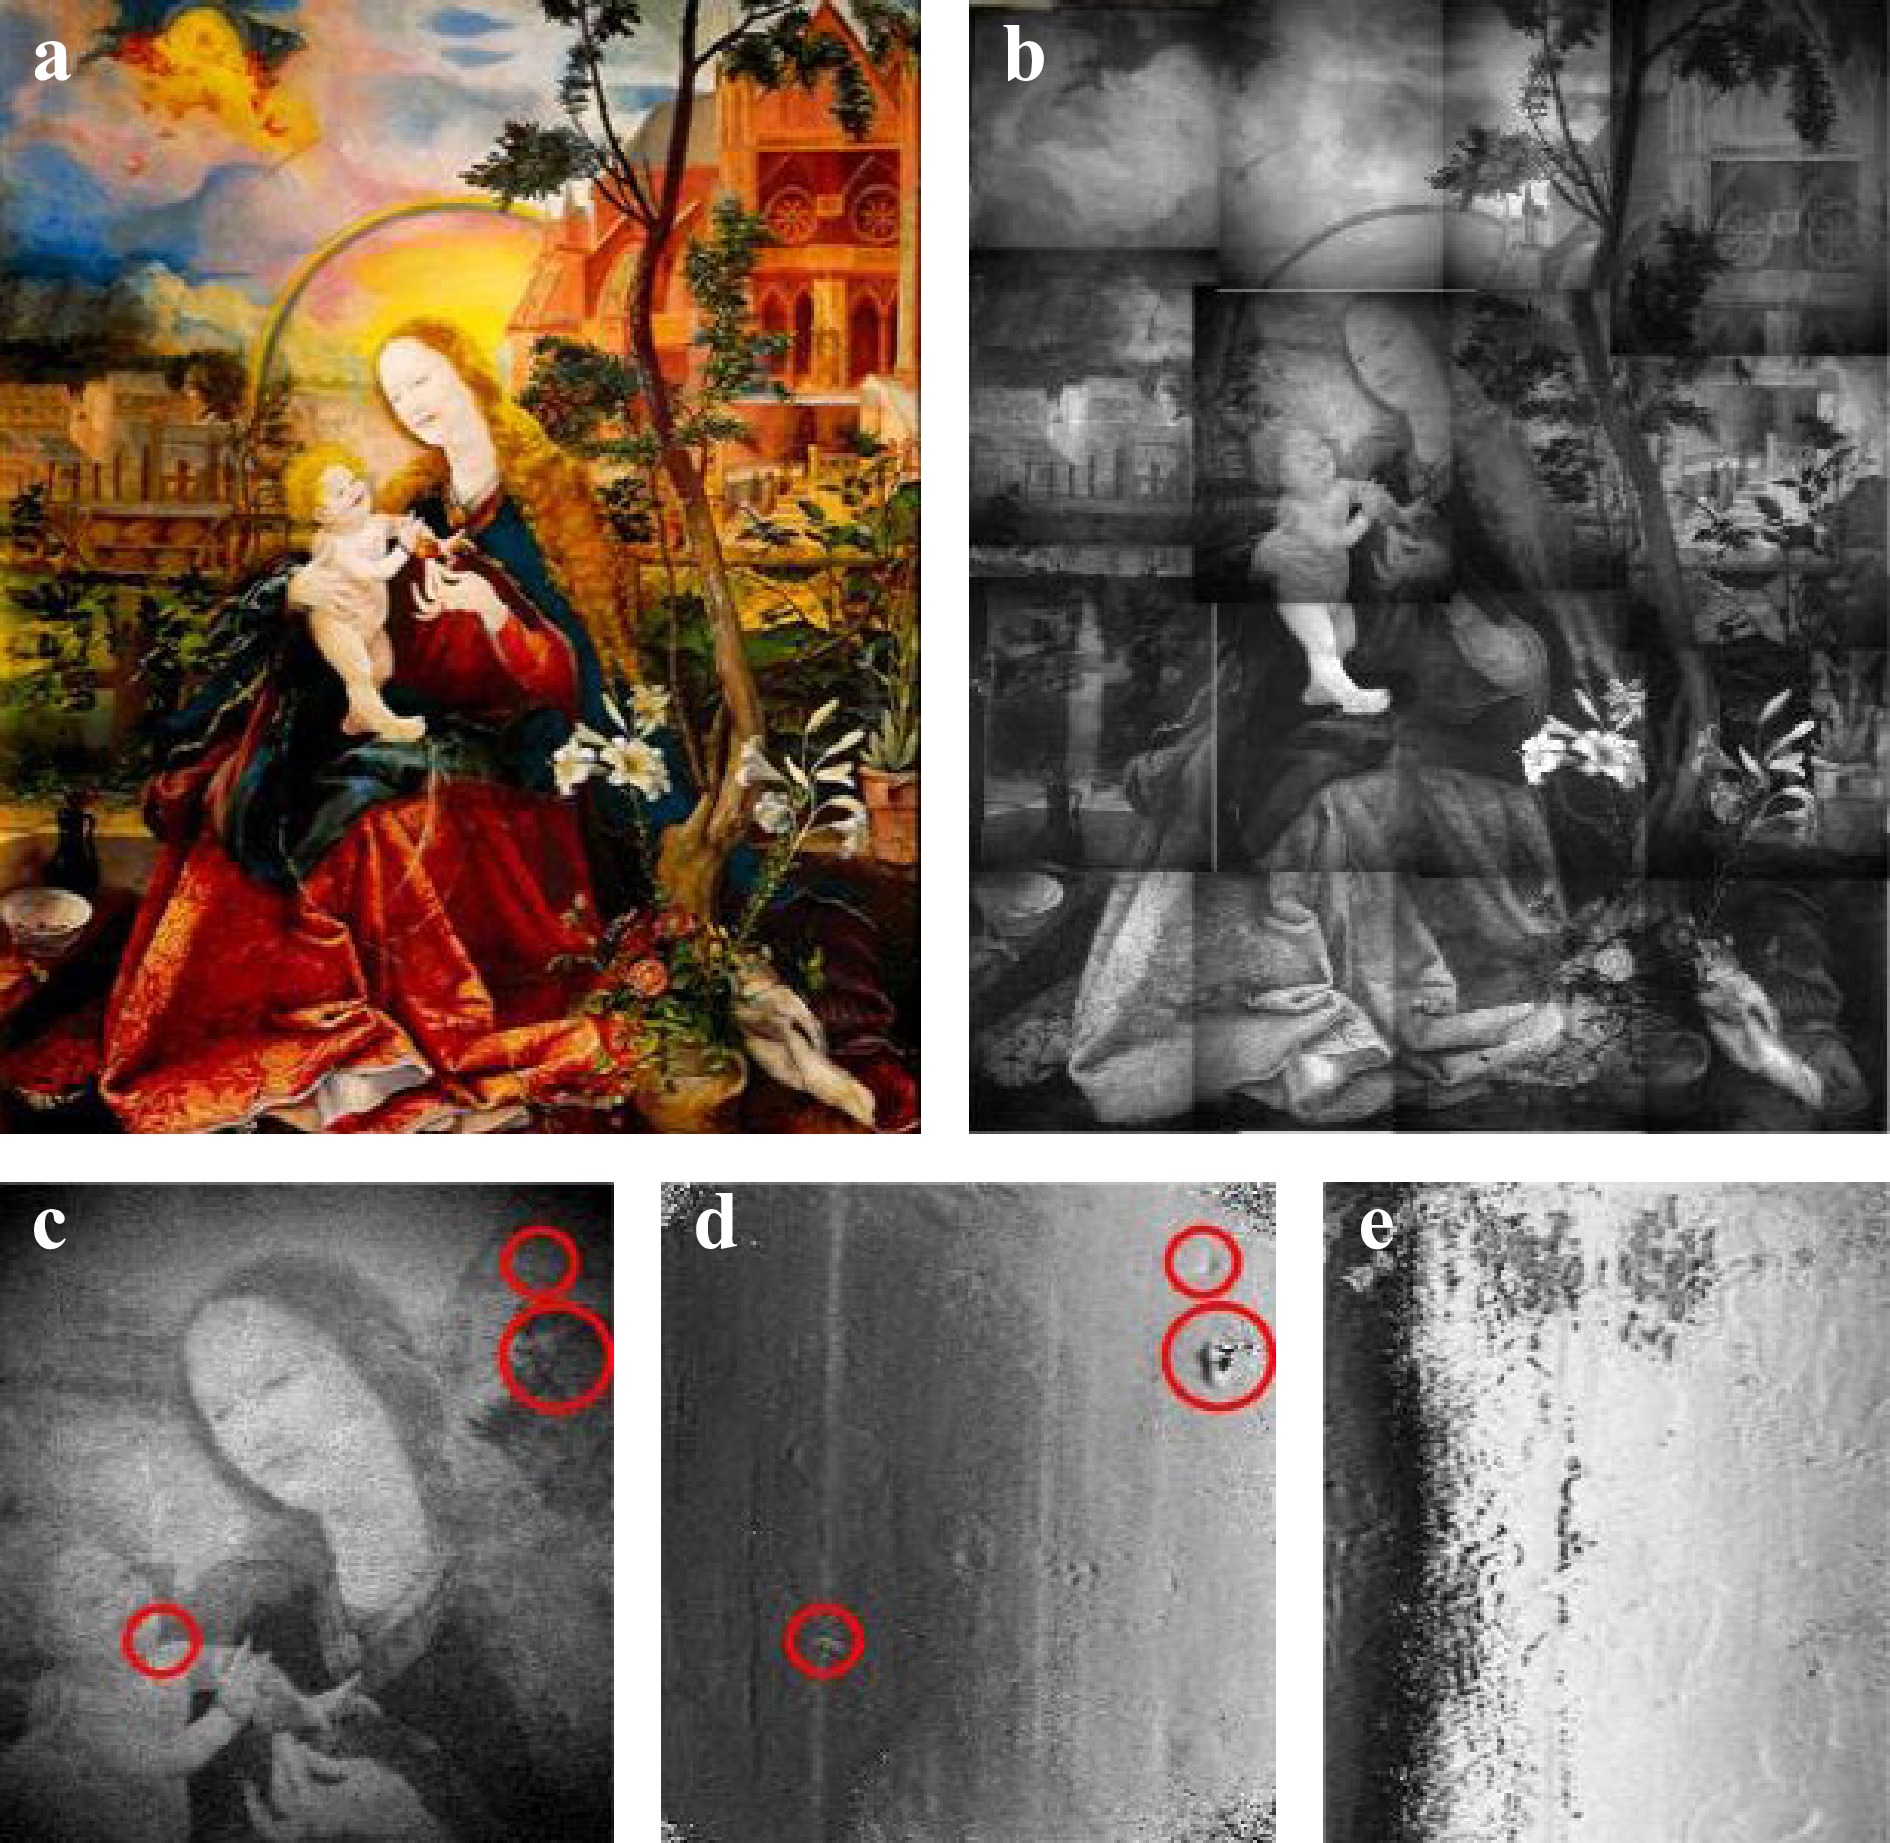
Fig. 15 Investigation of the painting “The Madonna from Stuppach” by digital speckle shearography. a the inspected painting before restoration b the 16 segments for successive inspection c the central segment with marked areas for detected suf-surface defects d the demodulated shearogram with the visible defects (bubbles, delaminations and cementations) e detected subsurface traces of wood worms.
-
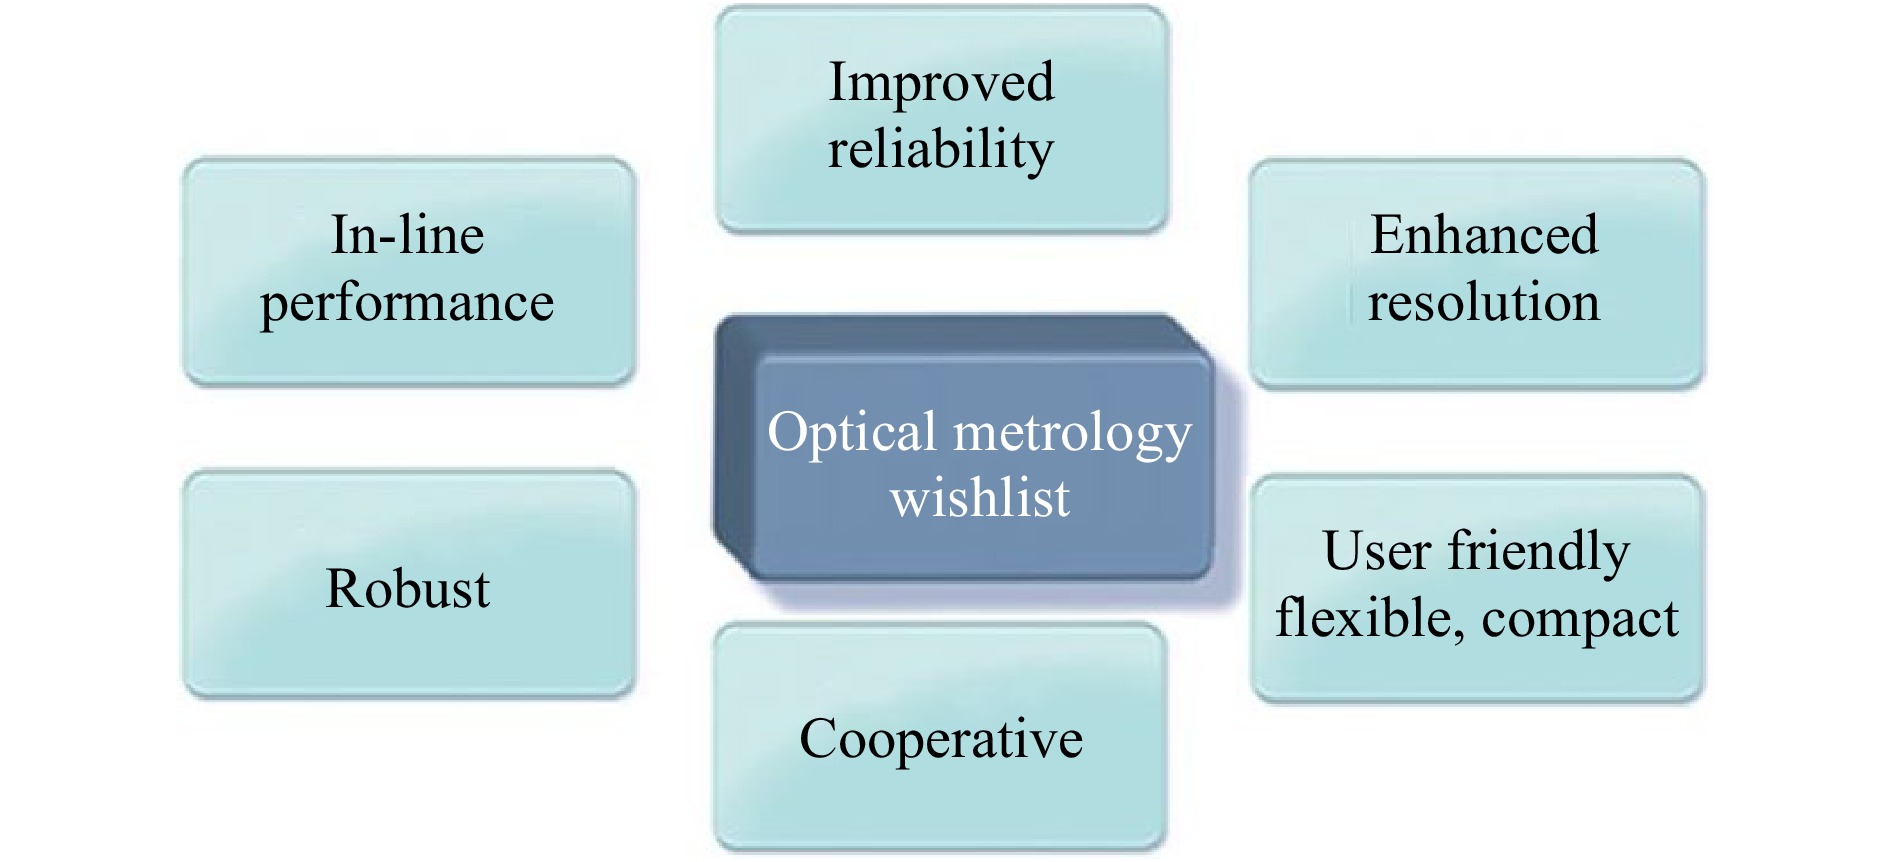
Already in 1981, C.M. Vest published a remarkable study, “Holographic NDE – Status and Future”66, where he formulated several important tasks with respect to the performance increase of holographic measurement techniques. This kind of wish list was circulated to motivate future research in optical metrology and to improve the unsatisfactorily low use of modern coherent inspection technologies in the industrial practice in the late 1970th. The core wishes are shown in Fig. 16: improve reliability, assure in-line performance, enhance resolution, make the tools more user friendly, flexible and compact, improve robustness against harsh environments and make the technology more cooperative for practical use.
40 years now have passed since Vest has published this study. Visible progress could be achieved mainly by applying new brilliant light sources with tunability of the wavelengths, digital cameras with improved space-bandwidth product and spectral sensitivity; spatial light modulators with both the ability for amplitude as well as phase control, and last but not least by making use of the continuously growing computer power with their amazing GPU performance21,67,68.
However, the challenges of measurement technology increase continuously. Modern products are getting more miniaturized, more complex and have an increasing number of functionalities. For instance, the critical dimensions of structures written in silicon are meanwhile considerably smaller than the wavelength of the applied light source and this trend is to be sustained with the consistent application of the extreme UV lithography69. As the feature sizes are decreasing, so the theoretical and practical constraints of making them and ensuring their quality are increasing70. The same holds true for other industrial branches such as optics industry, micro-systems engineering, machine construction and automotive engineering where the surface-quality requirements of critical components and the overall complexity of the products have dramatically grown over the past years. Consequently, modern production and inspection technologies are confronted with a bundle of challenges21.
Therefore, today's manufacturing industry places huge demands on metrology systems. They must have reasonably high resolution (both spatial and temporal) but yet be robust enough to work in an industrial environment. Systems must be able to be integrated into the production line as close as possible to the place of production and without interference with the production cycle. In-line metrology/defectoscopy is a must for future production systems. Only the real-time feedback of the inspection results into the manufacturing process can contribute to a consistent quality assurance in processes with high cost risk such as in semiconductor industry. Systems must be flexible. One current problem is that in many cases they are unique and custom-made. Often special environment conditions need to be assured. However, manufacturers do not want to have a special metrology system for each single product. They want one system to be able to measure and assess a variety of products. By this, we do not mean that one system has to be able to measure everything from an aspheric lens up to a telescope mirror or a car body. However, a system should be able to measure different versions of one product class such as lenses with various shape that cover spherical, aspherical and free forms. Such systems are already on the way71. In contrast to conventional tactile technologies, optical methods do not deliver a direct approach to the quantity of interest such as a tactile stylus that measures a profile height directly. To some extent a certain detour has always to be taken which can make the system tricky and not user-friendly. Thus, only skilled persons are often able to cope with such technologies. Therefore, we discussed in chapter 2 some guidelines that may help the customer to find out the right method and suitable system configuration for solving his or her problem. The mentioned demands are all challenging, but not impossible to achieve. With improved inspection strategies that take advantage of principles of active vision, model-based reconstruction, sensor-fusion with utilizing the full information content of the light field (multi-modal approaches), coherent optical metrology will be able to meet these demands21,72.
-
2021 is a remarkable year for coherent optical metrology. 50 years ago Dennis Gabor presented his famous lecture at the London Imperial College on occasion of the awarding of the Nobel prize for the invention of holography. 5 years before, Karl Stetson and Robert Powell published their groundbreaking article “Hologram Interferometry”1 and opened the door for a whole range of new coherent-optical measurement methods that are widely used meanwhile for non-destructive testing, experimental stress analysis and shape measurement. A first critical review of both the benefits and the problems still to be solved when using holographic principles for metrology was published by Charles Vest 40 years ago. 55 years after Stetsons and Powels article and 40 years after Vests study, we took the opportunity to look back to early days of holographic metrology and honored the inventors of the main principles and pioneering applications. Then we discussed some guidelines for the application dependent selection of a special method and tried to consider these measures for the solution of several exemplary measurement problems. Finally, we listed some challenges for optical measurement methods that are currently matter of investigation.
It still remains to answer our question from the headline. Hopefully we could show, that holographic non-destructive testing is technically mature after 55 years. However, new challenges and more complex boundary conditions require steady improvement and adaptation. Some new approaches where we see great potential, have been discussed. Further progress will certainly be associated with increasing digitization and networking. The Internet of Things (IoT) made it already possible to access remote production and measurement locations as well. The new concepts of remote holographic metrology73 go far beyond the transmission of digital holograms via the Internet. They also provide an opportunity to communicate with and eventually control the physical setup of a remote metrology system. Furthermore, the metrology system can be modeled in the environment of a three-dimensional (3-D) virtual reality using CAD or similar technology providing a more intuitive interface to the physical setup within the virtual world. An engineer or a scientist wishing to access the remote real-world system can log on to the virtual system, moving and manipulating the setup, and take the desired measurements. The sets of data gained in the measurement process are stored and interpreted automatically for appropriate display within the virtual world providing the necessary feedback to the experimenter. Important metadata, including a description of the setup, the objects under investigation and all relevant system parameters, simultaneously generated by the system, can be recorded automatically to support the processing of the data or the future reproduction of the experiment for verification purposes, even by third parties. Such a system opens up many novel opportunities in industrial inspection such as remote master-sample comparison or the virtual assembly of parts that are fabricated at different locations without the need for transportation and actual physical assembly. Moreover, a multitude of new techniques can be envisaged, and among them advanced ways for the documenting processes, the efficient methods for metadata storage, the possibility for remote reviewing of experimental results, the addition of real experiments to publications by allowing remote access to the metadata and to the experimental setup via the Internet, the presentation of complex experiments in classrooms and lecture halls, the sharing of expensive and complex infrastructure within international collaborations, new ways of remote testing of new devices for their maintenance and service, and many more.
-
The authors gratefully acknowledge the financial support of the German Research Foundation, the Germany Ministry for Research and Education and the European Community. All founded projects are named in the cited publications.
55 Years of Holographic Non-Destructive Testing and Experimental Stress Analysis: Is there still Progress to be expected?
- Light: Advanced Manufacturing 3, Article number: (2022)
- Received: 19 September 2021
- Revised: 16 January 2022
- Accepted: 18 January 2022 Published online: 10 March 2022
doi: https://doi.org/10.37188/lam.2022.008
Abstract: Holographic methods for non-destructive testing, shape measurement, and experimental stress analysis have shown to be versatile tools for the solution of many inspection problems. Their main advantages are the non-contact nature, the non-destructive and areal working principle, the fast response, high sensitivity, resolution and precision. In contrast to conventional optical techniques such as classical interferometry, the holographic principle of wavefront storage and reconstruction makes it possible to investigate objects with rough surfaces. Consequently, the response of various classes of products on operational or artificial load can be examined very elegantly. The paper looks back to the history of holographic metrology, honors the inventors of the main principles, discusses criteria for the selection of a proper inspection method, and shows exemplary applications. However, the main focus is on modern developments that are inspired by the rapid technological process in sensing technology and digitization, on current applications and future challenges.
Research Summary
55 Years of Holographic Non-Destructive Testing and Experimental Stress Analysis: Is there still Progress to be expected?
Holographic methods for non-destructive testing, shape measurement, and experimental stress analysis have shown to be versatile tools for the solution of many inspection problems. Their main advantages are the non-contact nature, the non-destructive and areal working principle, the fast response, high sensitivity, resolution and precision. In contrast to conventional optical techniques such as classical interferometry, the holographic principle of wave front storage and reconstruction makes it possible to investigate objects with rough surfaces. The paper looks back to the history of holographic metrology, honors the inventors of the main principles, discusses criteria for the selection of proper inspection methods, and shows exemplary applications. However, the main focus is on modern developments that are inspired by the rapid technological process in sensing technology and digitization, on current applications and future challenges.
Rights and permissions
Open Access This article is licensed under a Creative Commons Attribution 4.0 International License, which permits use, sharing, adaptation, distribution and reproduction in any medium or format, as long as you give appropriate credit to the original author(s) and the source, provide a link to the Creative Commons license, and indicate if changes were made. The images or other third party material in this article are included in the article′s Creative Commons license, unless indicated otherwise in a credit line to the material. If material is not included in the article′s Creative Commons license and your intended use is not permitted by statutory regulation or exceeds the permitted use, you will need to obtain permission directly from the copyright holder. To view a copy of this license, visit http://creativecommons.org/licenses/by/4.0/.

 DownLoad: