


HTML
-
The most important advantage arising from the invention of holography was realized with the development of lasers. The applications of holography has been exploited in many industrial fields as a very sensitive measurement tool, such as aerospace, automotive, energy and cultural heritage, owing to the discovery of holographic interferometry by Powell and Stetson1, 2. In fact, by employing different holographic modalities, such as holographic interferometry, time-average holography, or the so-called TV and/or digital speckle holography, it was possible to develop accurate optical measuring strategies for non-destructive testing systems and experimental mechanics3, 4. The above holography-based measurement systems were applied successfully to guarantee the quality of industrial products (e.g., turbine blades, tires, composite materials, photovoltaic solar panels, automobile components, and electronic circuits). Later, with the microelectronic revolution in the 80s and 90s as well as the surge of capabilities of micro-nanofabrication techniques, holography-based methods were successfully applied by scaling their probing-gauge down to microsystems (i.e., MEMS, MOEMS, and NEMS)5-10. In the past 20 years, the introduction of powerful PCs and high-performance solid-state light sensors has resulted in the achievement of further developments of holographic technology in digital-modality toward biological, biomedical, and industrial applications, which has led to the widespread use of such systems11-16.
Recent progress in bottom-up self-assembly fabrication approaches and direct printing for production processes, especially at the micro and nanoscales, has motivated the development of holographic optical tools for achieving accurate and full-field characterization of systems based on soft matter materials, such as liquids and polymers. These are expected to be the basis of the next revolution in fields of biotechnology and flexible electronics systems, among others. Indeed, the most common imaging modality for such microfabrication techniques is direct optical imaging, which is a video-based method. It enables the monitoring of the dynamic evolution of the processes and measuring features related to the geometrical dimensions of the microstructure17, 18. High-speed and high-resolution cameras were used for the detection of small particles during inkjet printing. Although such imaging systems can be complex, significant information is completely lost as in the case of the detection and measurement of out-of-focus structures and particles. Furthermore, not all of the information related to the phase shift introduced by the samples can be evaluated. Many microstructures are transparent or semi-transparent, and it is critical to measure the phase delay introduced in the light path, as in the case of the evaluation of the optical quality of optical components, such as microlenses and thin-film thickness mapping at high spatial resolution. For these reasons, the inspection of soft matter and related fabrication processes takes advantage of the noteworthy capabilities of DH as a metrology tool. As summarized below, the main attractive features of DH enable the achievement of the necessary capability and flexibility in the measurements:
1) The possibility of numerically managing the complex wavefront scattered or transmitted by the sample under investigation allows the extraction of all of the information (intensity and phase) through a full-digital modality.
2) Flexibility in achieving object imaging well-in-focus (or to obtain good focus of any portion of it) that enables correct DH microscopic measurements to be obtained, even though the object could have a three-dimensional (3D) shape behind the depth of focus of the optical imaging system.
3) Potential to retrieve phase-contrast maps that enable quantitative measurements of the sample in full-field mode and 3D.
4) The possibility to manage and remove aberrations in the optical system using simple and flexible methods, thus simplifying the optical apparatus and measurement operations.
Owing to the above unique features of DH, this paper reviews what are considered the most significant examples to demonstrate the capability of DH to measure soft matter structures and the related fabrication techniques. In particular, we focused on different types of challenging cases.
• thin liquid films and membranes;
• ink-jet printing process for directly printed structures;
• analysis and quantitative measurements of bottom-up self-assembling processes of polymer and/or liquids;
• microfluidic rheology and study of solid-liquid interfaces.
The four different above-mentioned typical cases enable us to demonstrate the aptitude of DH systems in combining metrology and 3D imaging capabilities and by furnishing quantitative measurements in challenging circumstances. We show that 3D dynamic monitoring in real-time or in situ using DH enables quantitative measurements and accurate characterization.
It should be noted that biological matter, both cell populations and tissues, benefits from the above-mentioned characteristics, so DH in recent years has been extensively developed, enabling its incorporation in life sciences19-26. However, we focus on and limit the present review to fabrication topics, thus supplying a complete overview of DH in this area without including cells of biological matter that have different peculiarities.
This review is organized into three sections. The first focuses on the measurement of the thin-film thickness over a wide field of view (FoV). Various experimental configurations are described, and their applicability to different materials is provided. For such applications, the thickness measurement ranges from ~50 nm to ~30 μm, with a resolution at the nanometer scale on a large FoV of a circular area with a radius of ~20 mm. The second section is centered on a specific microfabrication technique based on the exploitation of the pyroelectric effect of ferroelectric crystals, where liquids and polymers can be manipulated by electric fields. This enables us to provide many examples where DH has proven to be a suitable metrological tool not only for transparent solid microstructures but also for the full characterization of dynamic processes such as the self-assembly of liquids for the realization of microstructures. The main results show that high-resolution two-dimensional (2D) and 3D measurements can be achieved by exploiting the quantitative phase content encoded in the digital holograms. The third section presents DH to investigate the rheological properties, monitor stress, and track particles embedded in solution or liquid film. All three sections contain a detailed description of the related state-of-the-art. Different setups and target materials, in addition to diverse observables, are described and discussed in this manuscript.
-
From soap bubbles for children to semiconductors for electronics, thin films have accompanied humankind through countless centuries, and are an important category of soft matter. Over the past century, with the improvement in industrial production technologies, a large number of products related to thin-film materials have been produced, especially in the field of daily chemistry. With the informatization and intelligence of human society, wearable and in-body devices are becoming the general direction of future technology applications. Because of its special physical and chemical properties, film material has become the best carrier to support future devices, and a detailed measurement of its characteristics is highly desirable.
The mapping of the thin-film thickness is an open and long-term challenge27. One of the well-known methods for mapping film thickness is the interferometric approach28, which uses the optical path difference between the beam’s reflection of the upper and lower surfaces of the film to create an interferometric pattern from which the thickness information of the thin film can be determined29, 30. The interferometry method has been used for a long time. However, conventional interferometric measurements have some shortcomings, such as a small measurement FoV, limited measuring range, and non-real-time measurement. To overcome these drawbacks, a series of interferometric techniques has been proposed in recent decades, namely colorimetric interferometry31, 32, multiwavelength interferometry33, phase-shift interferometry34, and scanning interferometry35, etc. However, for the dynamic thickness measurement of a thin liquid film under a large FoV, interferometric methods hardly meet all recording requirements, especially for films with high viscosity coefficients. In 2019, for the first time, Ferraro et al. implemented DH to map the thin-film thickness during the evolution of liquid bubbles36. In 2021, Wong et al. applied DH to measure beer bubble morphology37. The height of the beer bubbles and water surface can be revealed simultaneously by the back-propagation process of DH. In fact, most film materials are good samples for holographic measurements because of their transparent or semi-transparent properties38. However, the existence of micron-level deformation in the film evolution generates scattering and/or refraction for object beam, which significantly affects holographic recording. This problem was solved by introducing a telescope structure before the camera, which could collect the beams and adjust the magnification. As a result, real-time holographic measurements of thin-film thickness were successfully realized. Many thin-film measurement experiments have been conducted using holography in different scenarios. In the following subsections, we systematically introduce the applications of DH in thin-film measurements and explore the feasibility of the technique in the measurement of soft matter.
-
The primary problem faced by DH in thin-film measurement is the limited thickness measurement range in a single shot39. There is a specific measurement range for the holographic recording of laser sources in the visible spectral range. Moreover, owing to the influence of surface tension, the thickness distribution of thin-film materials is usually continuous, enabling numerical holographic phase unwrapping. Considering the real-time requirements of film thickness measurement, the off-axis DH system could be a good candidate for testing14, 40. In preliminary optical geometry, an off-axis Mach-Zehnder recording system was used to measure the dynamic film thickness evolution process36, 41. A telescope structure was set before the camera to adjust the FoV and suppress the influence of film scattering (the setup and experimental results are shown in Fig. 1.
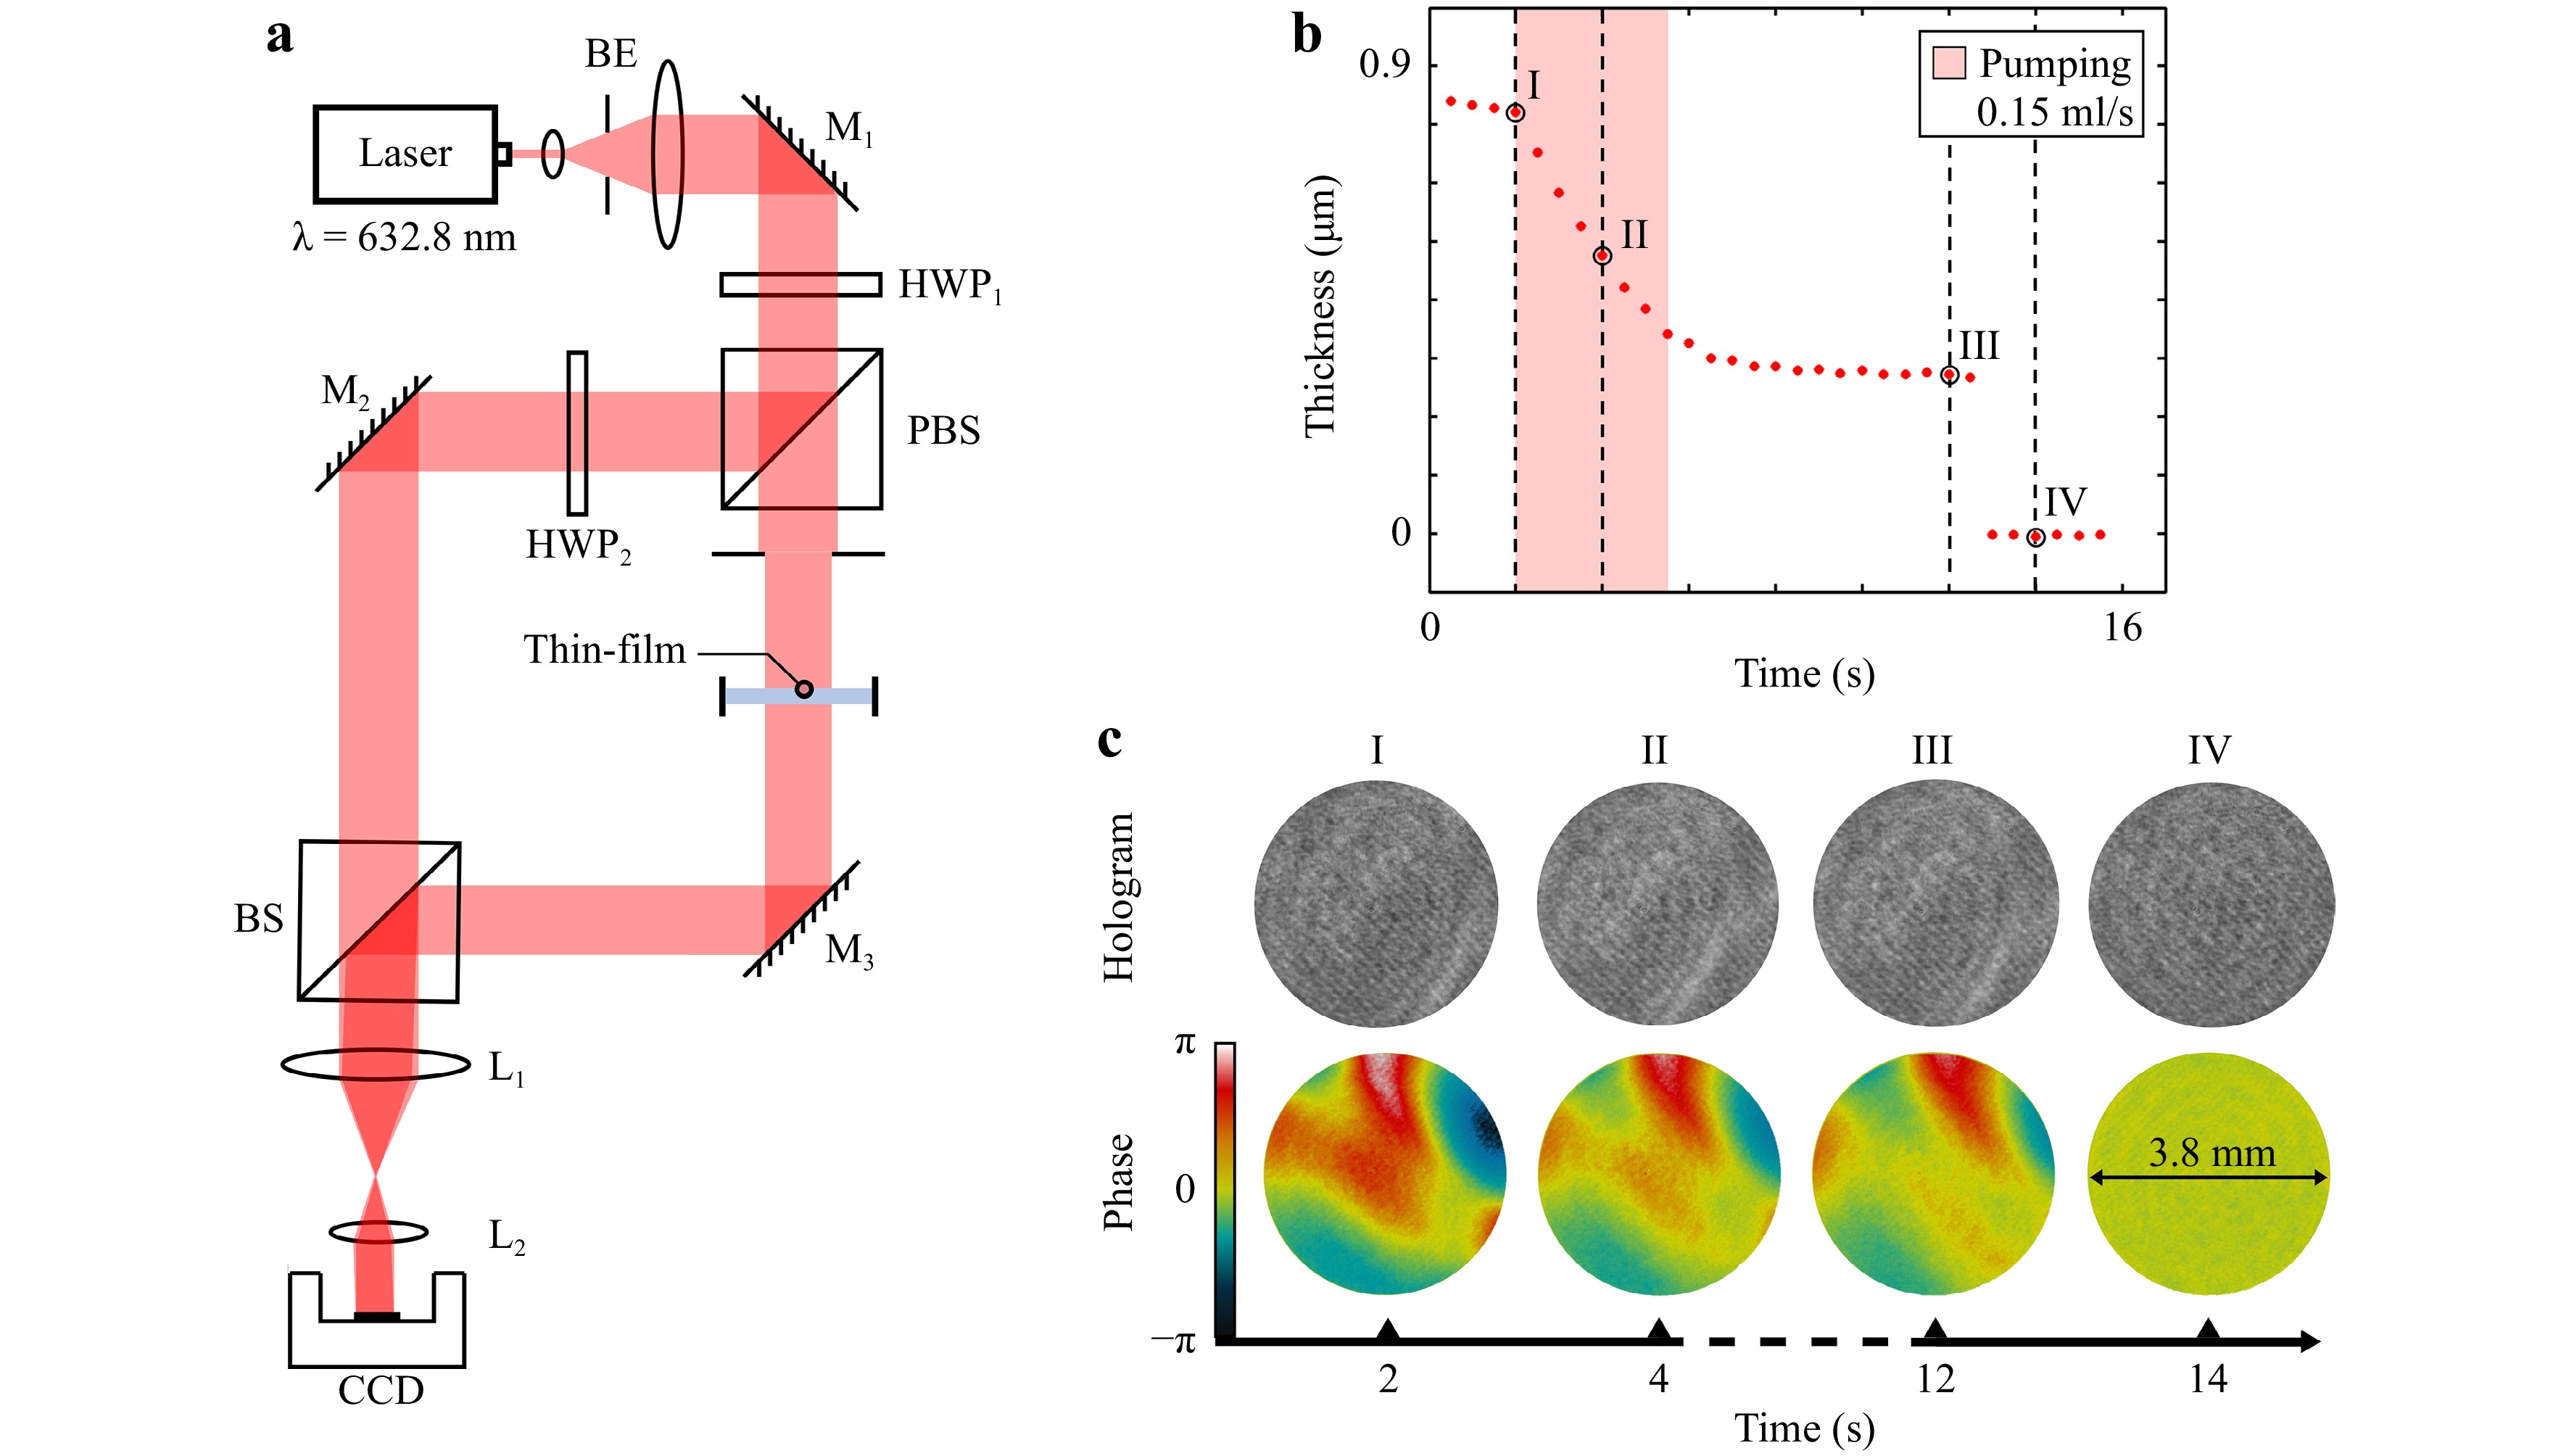
Fig. 1 Conventional holographic thin-film thickness mapping, setup, and preliminary results. a Digital holographic setup based on Mach-Zehnder structure. b Thickness change before and after rupture in the central area of a polymer film. c Full FoV thickness mapping of selected timepoints in b. Reproduced from Ref. 36 © 2021 Springer Nature.
Because thin films represent imaging objects with rich and varied high-frequency information, it is difficult for a lens-less system to collect all information during the recording process. Therefore, a telescope structure (composed of two lenses with different focal lengths) represents a strategy for collecting object information. As shown in Fig. 1a, lenses L1 and L2 (focal length of L1 is longer than that of L2) were set to construct a telescope lens group for zooming out. The light-collecting ability of the 4-Focus lens group allowed the collection of scattered object beams. In other words, this setup allowed the enlargement of the FoV and the simultaneous recording of high-frequency information. In the initial testing, a film close to rupture was selected as the sample. The thickness change in the central area of the film was measured41, as shown in Fig. 1b. It can be seen that for thin-film materials with a known refractive index (RI), DH is a good tool for measuring the thickness of the film, and it does not require other reference images. Generally, in interferometry, it is necessary to clearly observe the appearance of a common black film42 to obtain absolute thickness measurements. However, for holographic measurements, when the thickness of the film is less than twice the recording wavelength, the following phase-thickness conversion formula can be used directly to extract the thickness information from the phase map:
$$ h=\frac{\varphi \lambda }{2\pi n} $$ (1) where h is the thickness, φ is the phase, λ is the recording wavelength, and n is the RI of the film. For the range of thickness measurement in a holographic recording system with a specific laser wavelength, the lower limit depends on the wavelength, whereas the upper limit can be continuously increased owing to the holographic phase unwrapping algorithm. Here, PUMA43 phase unwrapping is a good candidate for extracting film thickness information because of its good phase-unwrapping capabilities for a continuously changing phase. However, in the case of films where the maximum thickness reaches a few micrometric levels or even higher, conventional holographic reconstruction will not be able to implement absolute thickness measurements owing to the limitation of the wrapping phase. To solve this problem, a full life cycle measurement method was proposed36. To do this, the entire thickness evolution process of the film, from the initial formation to the final rupture, needs to be recorded. Once the film is close to rupture, the starting area of the rupture tends to be a common black film, indicating that it has the lowest phase value in the full FoV. Taking advantage of this feature, a time variable can be added to the phase-unwrapping process to deal with the phase jump in all recorded frames, as shown in Fig. 2.
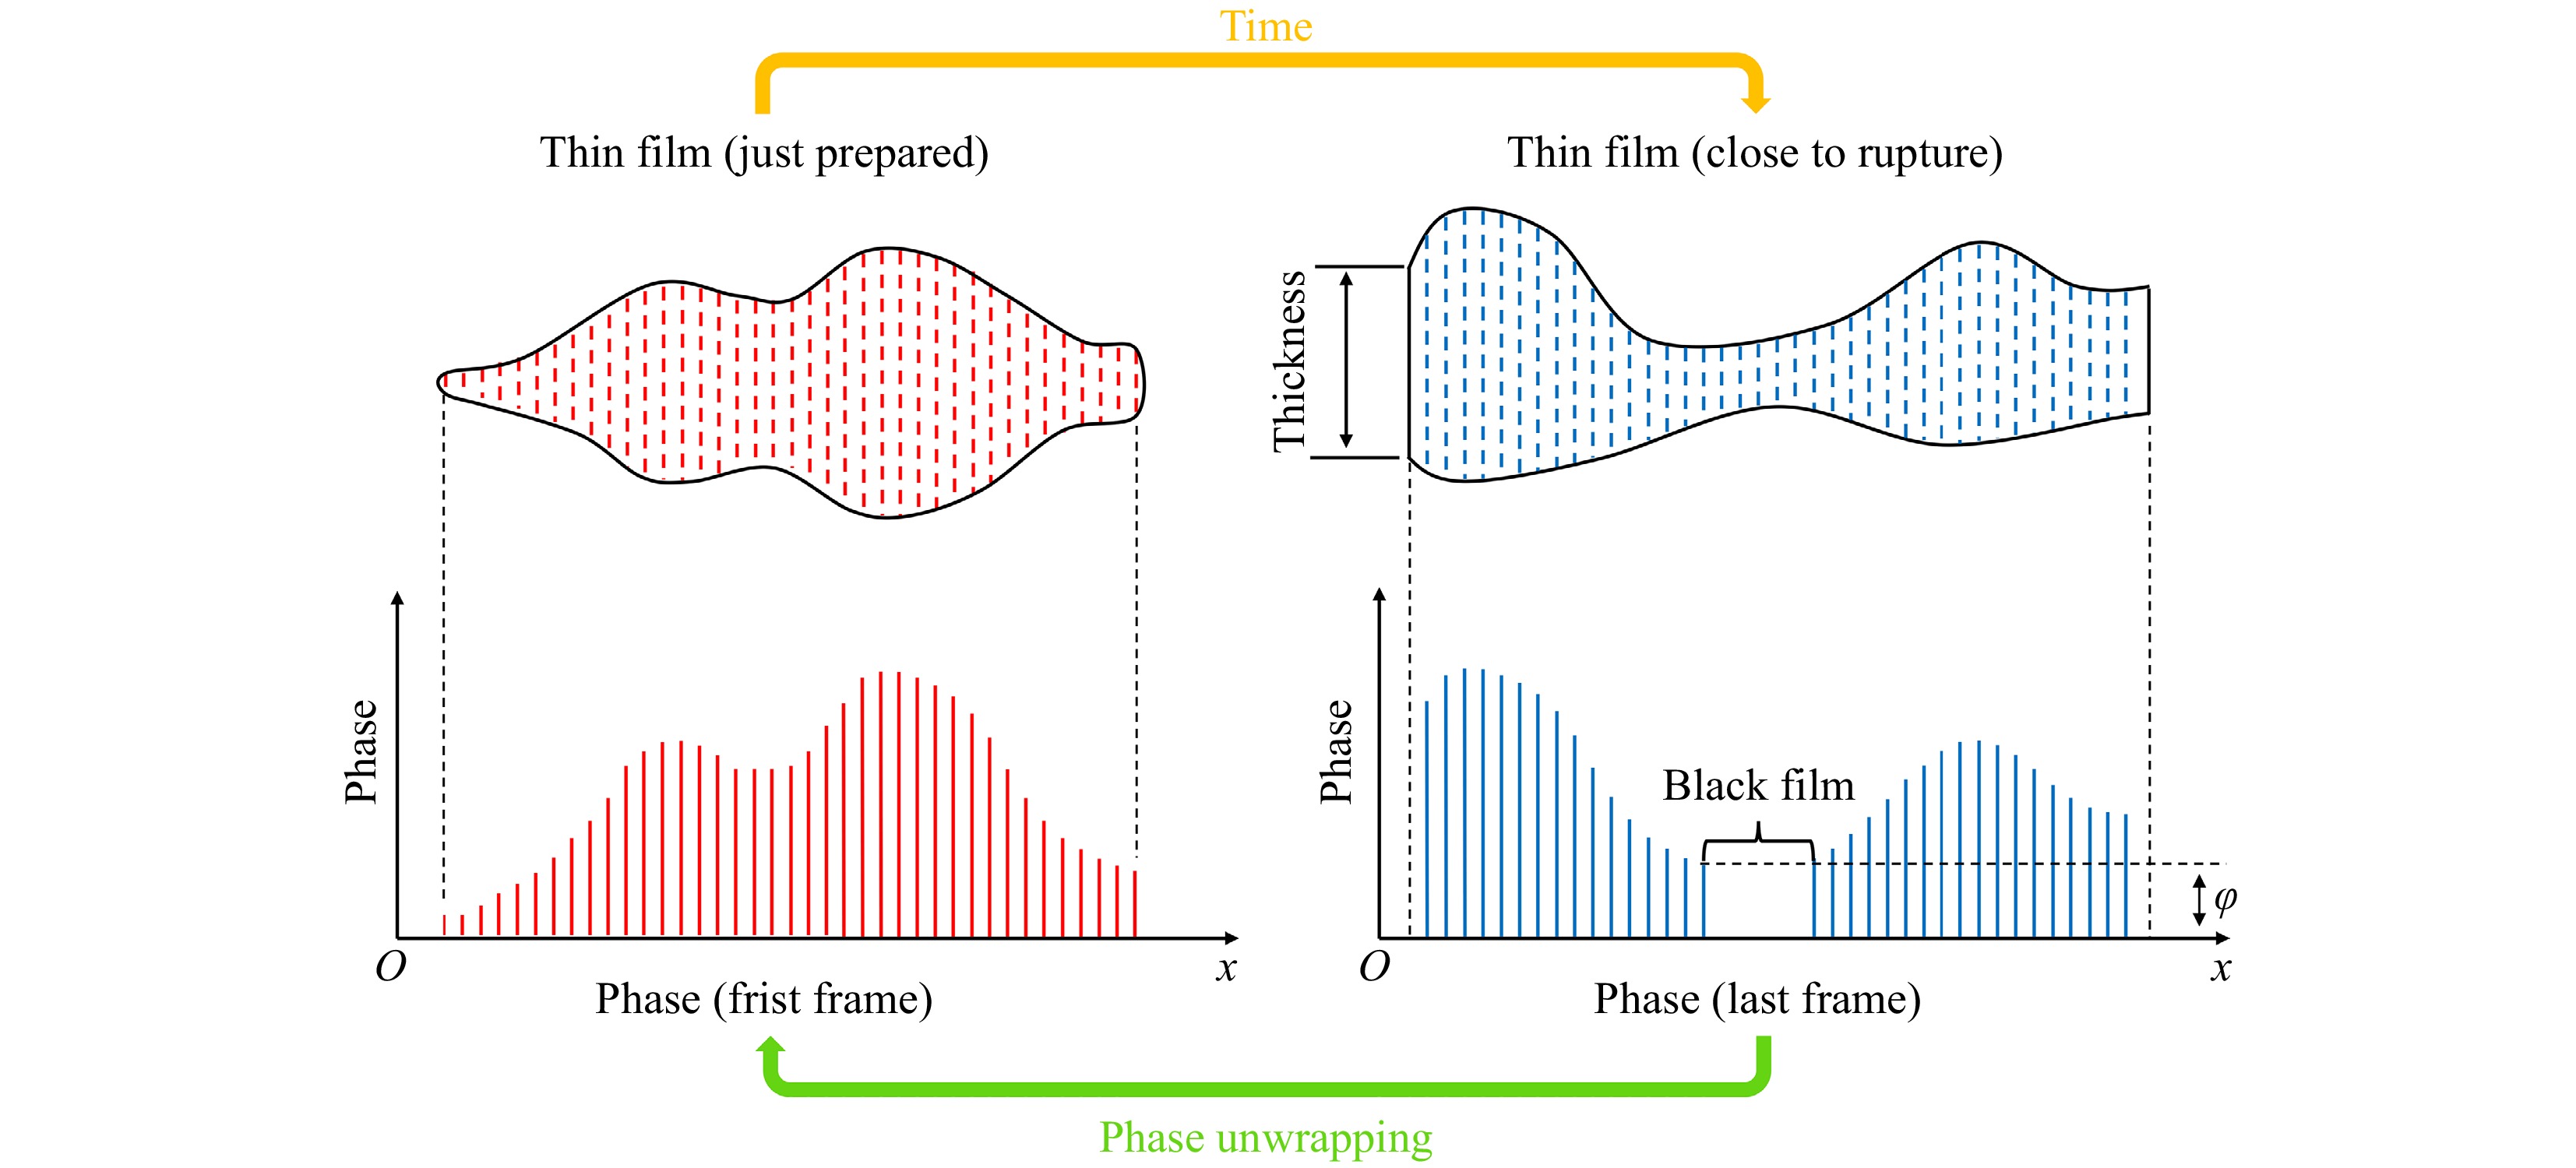
Fig. 2 Schematic diagram of thin-film full life cycle recording phase unwrapping method.
As a film thickness extraction scheme, the full life cycle recording method has certain limitations; in fact, the measured film must have a clear natural rupture process. For most free-standing thin liquid films, the natural rupture process will occur owing to gravitational drainage44, which enables us to use the proposed strategy for extracting film thickness information. Therefore, compared to other existing optical measurement methods, DH offers high precision, a large measurement range, and real-time characteristics, representing a good tool for thin liquid film thickness mapping, as discussed in detail in the following sections.
-
DH is based on the numerical diffraction reconstruction of digitally recorded interference fringes to obtain the spatial information of the recorded object45,46, whereas white-light interferometry (WLI) uses the direct identification of the number and color of interference fringes to obtain thickness information28, 29. These two methods have certain limitations in real-time thin-film thickness mapping, but for some specific materials, both can be used, for example, surfactant film. Thus, the complementary characteristics of WLI and DH enable comparison and fusion. To implement simultaneous recording for one liquid film using the two methods, joint imaging was designed by combining the conventional off-axis DH geometry and WLI geometry. To ensure that the WLI recording did not affect the intensity contrast of the hologram, oblique illumination was implemented47. Owing to the combination of WLI and DH, it is possible to achieve high-precision real-time thickness measurements while expanding the imaging FoV and range48. The experimental setup, which combines the two interferometric geometries, is shown in Fig. 3a.
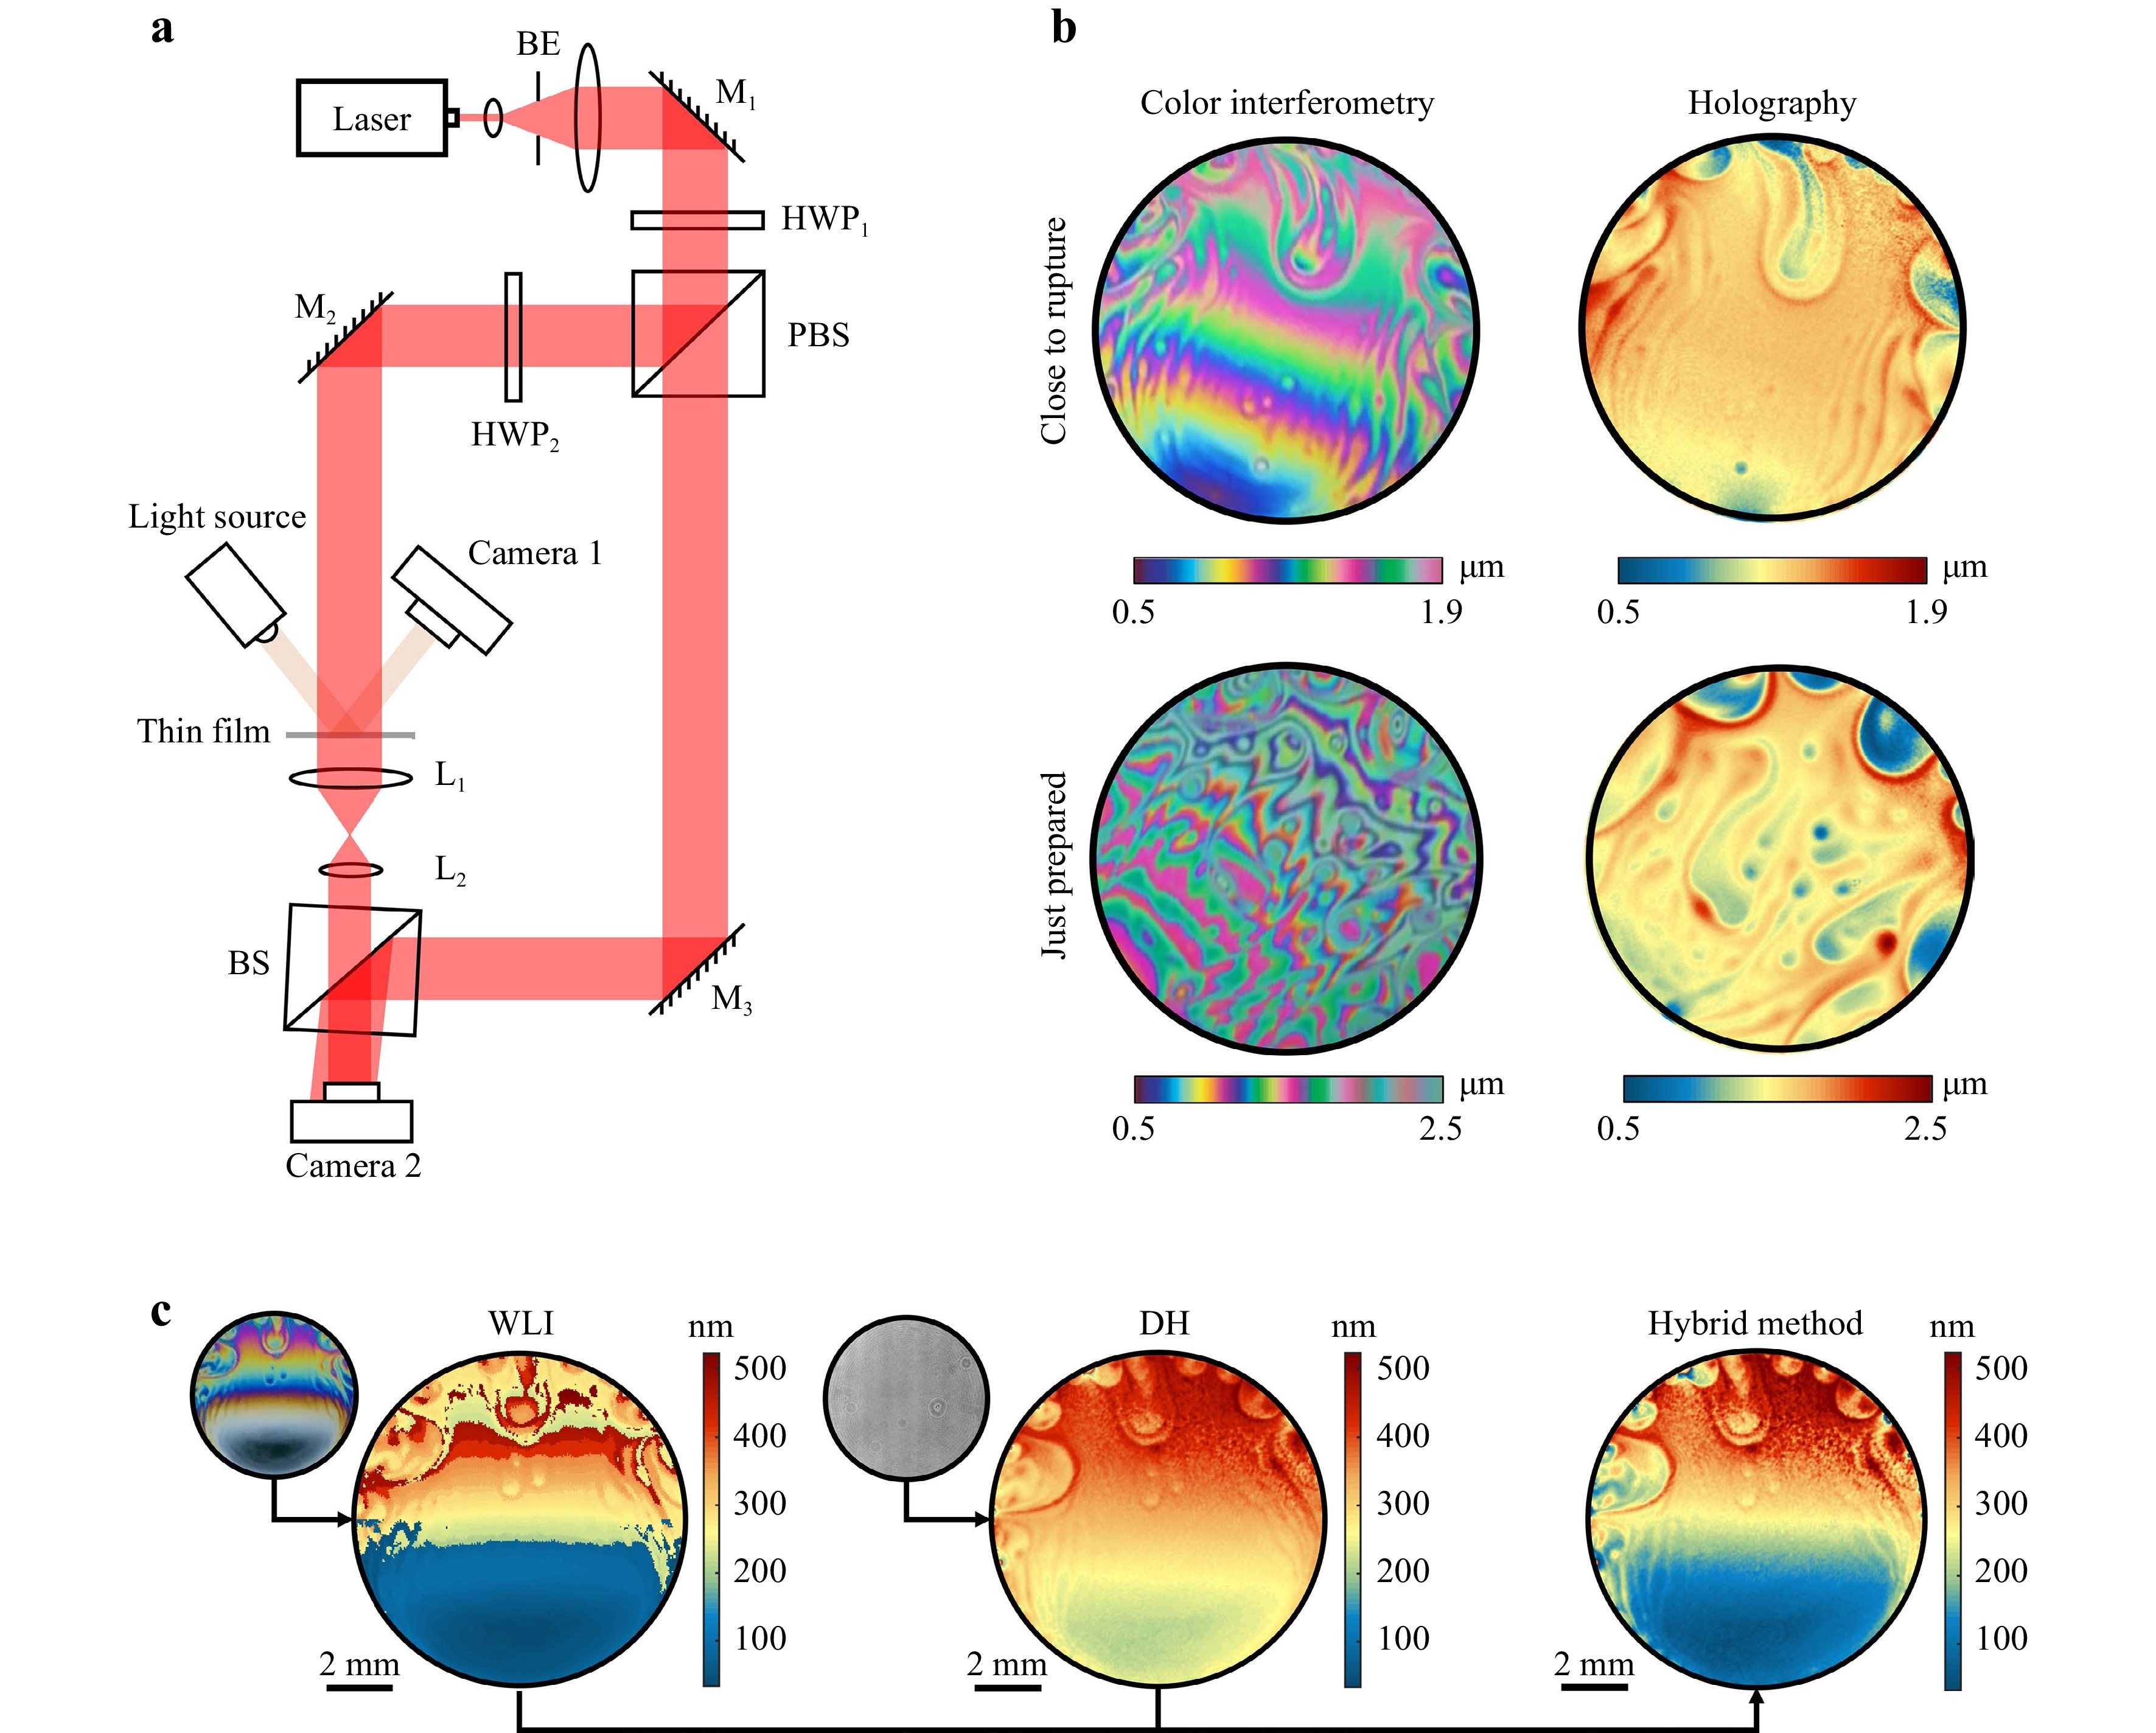
Fig. 3 Optical geometry and results of DH and WLI hybrid imaging. a Experimental setup for simultaneous recording. b Comparison of measurement results at two different time points. c The complementary characteristics of white light interferometry and digital holography will provide high-precision and wide-range thin-film thickness measurement. Adapted with permission from Ref. 48 Copyright 2021 American Chemical Society.
In the experiment reported in Fig. 3b, a surfactant film was selected as the experimental sample, and its RI was determined in a previous study49. Meanwhile, for the WLI measurement, the thickness-color correspondence of the surfactant film is known50. The surfactant film was formed in a fixed metal ring and simultaneously illuminated by white light and a red laser beam. It can be seen from the experimental results in Fig. 3b that when the film was close to rupture, both DH and WLI could map the thickness of the full FoV. Based on the comparison, it can also be found that the measurement results of DH and WLI maintain good consistency in the range below 1 μm. Moreover, for a thickness greater than 1 μm, WLI hardly provides the right thickness value, while DH still works. For the results at the early stage after film formation, the WLI interferogram showed complicated patterns; thus, it was difficult to interpret and retrieve the effective thickness. The colored interference fringes in such a range of film thicknesses were spatially and periodically modulated by the complex film structure, which led to an impossible reading. On the other hand, the thickness distribution information can be clearly identified in the results of DH. This is the greatest advantage of holographic measurement: for films with complex structures, holographic measurement can still provide an accurate thickness distribution. In conclusion, for surfactant films with a maximum thickness of less than 1 μm and a smooth surface structure, both DH and WLI can be used. However, for films with a higher thickness or complex surface structure, DH would be a better choice. Therefore, the reliability of the DH measurements can be verified through WLI experiments.
However, in the case of film with thickness less than half the wavelength, transmission holography has difficulties in providing accurate thickness measurements. Therefore, one strategy that has been effectively adopted is to use the complementary characteristics of WLI and DH for a new hybrid measurement modality48. Thus, phase correction was achieved by comparing the two different measurement results. From the results in Fig. 3c, the deviation in the low-thickness area was significantly improved; essentially, the hybrid recording and reconstruction completed the phase calibration of the film and achieved an accurate thickness distribution. As a tool for improving microscopic resolution, holographic imaging can be easily integrated with other technologies, creating a wider range of possibilities.
-
In the above two sections, conventional imaging setups and methods of DH in thin-film imaging were discussed for the measurement of the thickness level. Furthermore, the difference between the results of WLI and DH for the same film was compared, proving that DH is a reliable measurement method for thin films. In conventional interferometric experiments, the measurement methods and systems are limited because of the need to keep the sample as smooth as possible. In addition, because the distance between the camera and the sample has certain requirements for creating interference fringes, it is difficult to measure the thickness distribution when the film is moving. However, these limitations can be overcome for DH recording. The DH geometry has good flexibility in structural settings; therefore, it can deal with different experimental scenarios51. Meanwhile, thanks to the numerical diffraction propagation process, DH can present real-time thickness mapping for the film in motion. Fig. 4 shows the time-lapse recording results obtained by DH in different film motion modes, including pumping bubble, thin film lifting, and thin film opening. Thickness mapping for these processes appeared to be difficult during interferometric recording, but could be completed in DH recording.
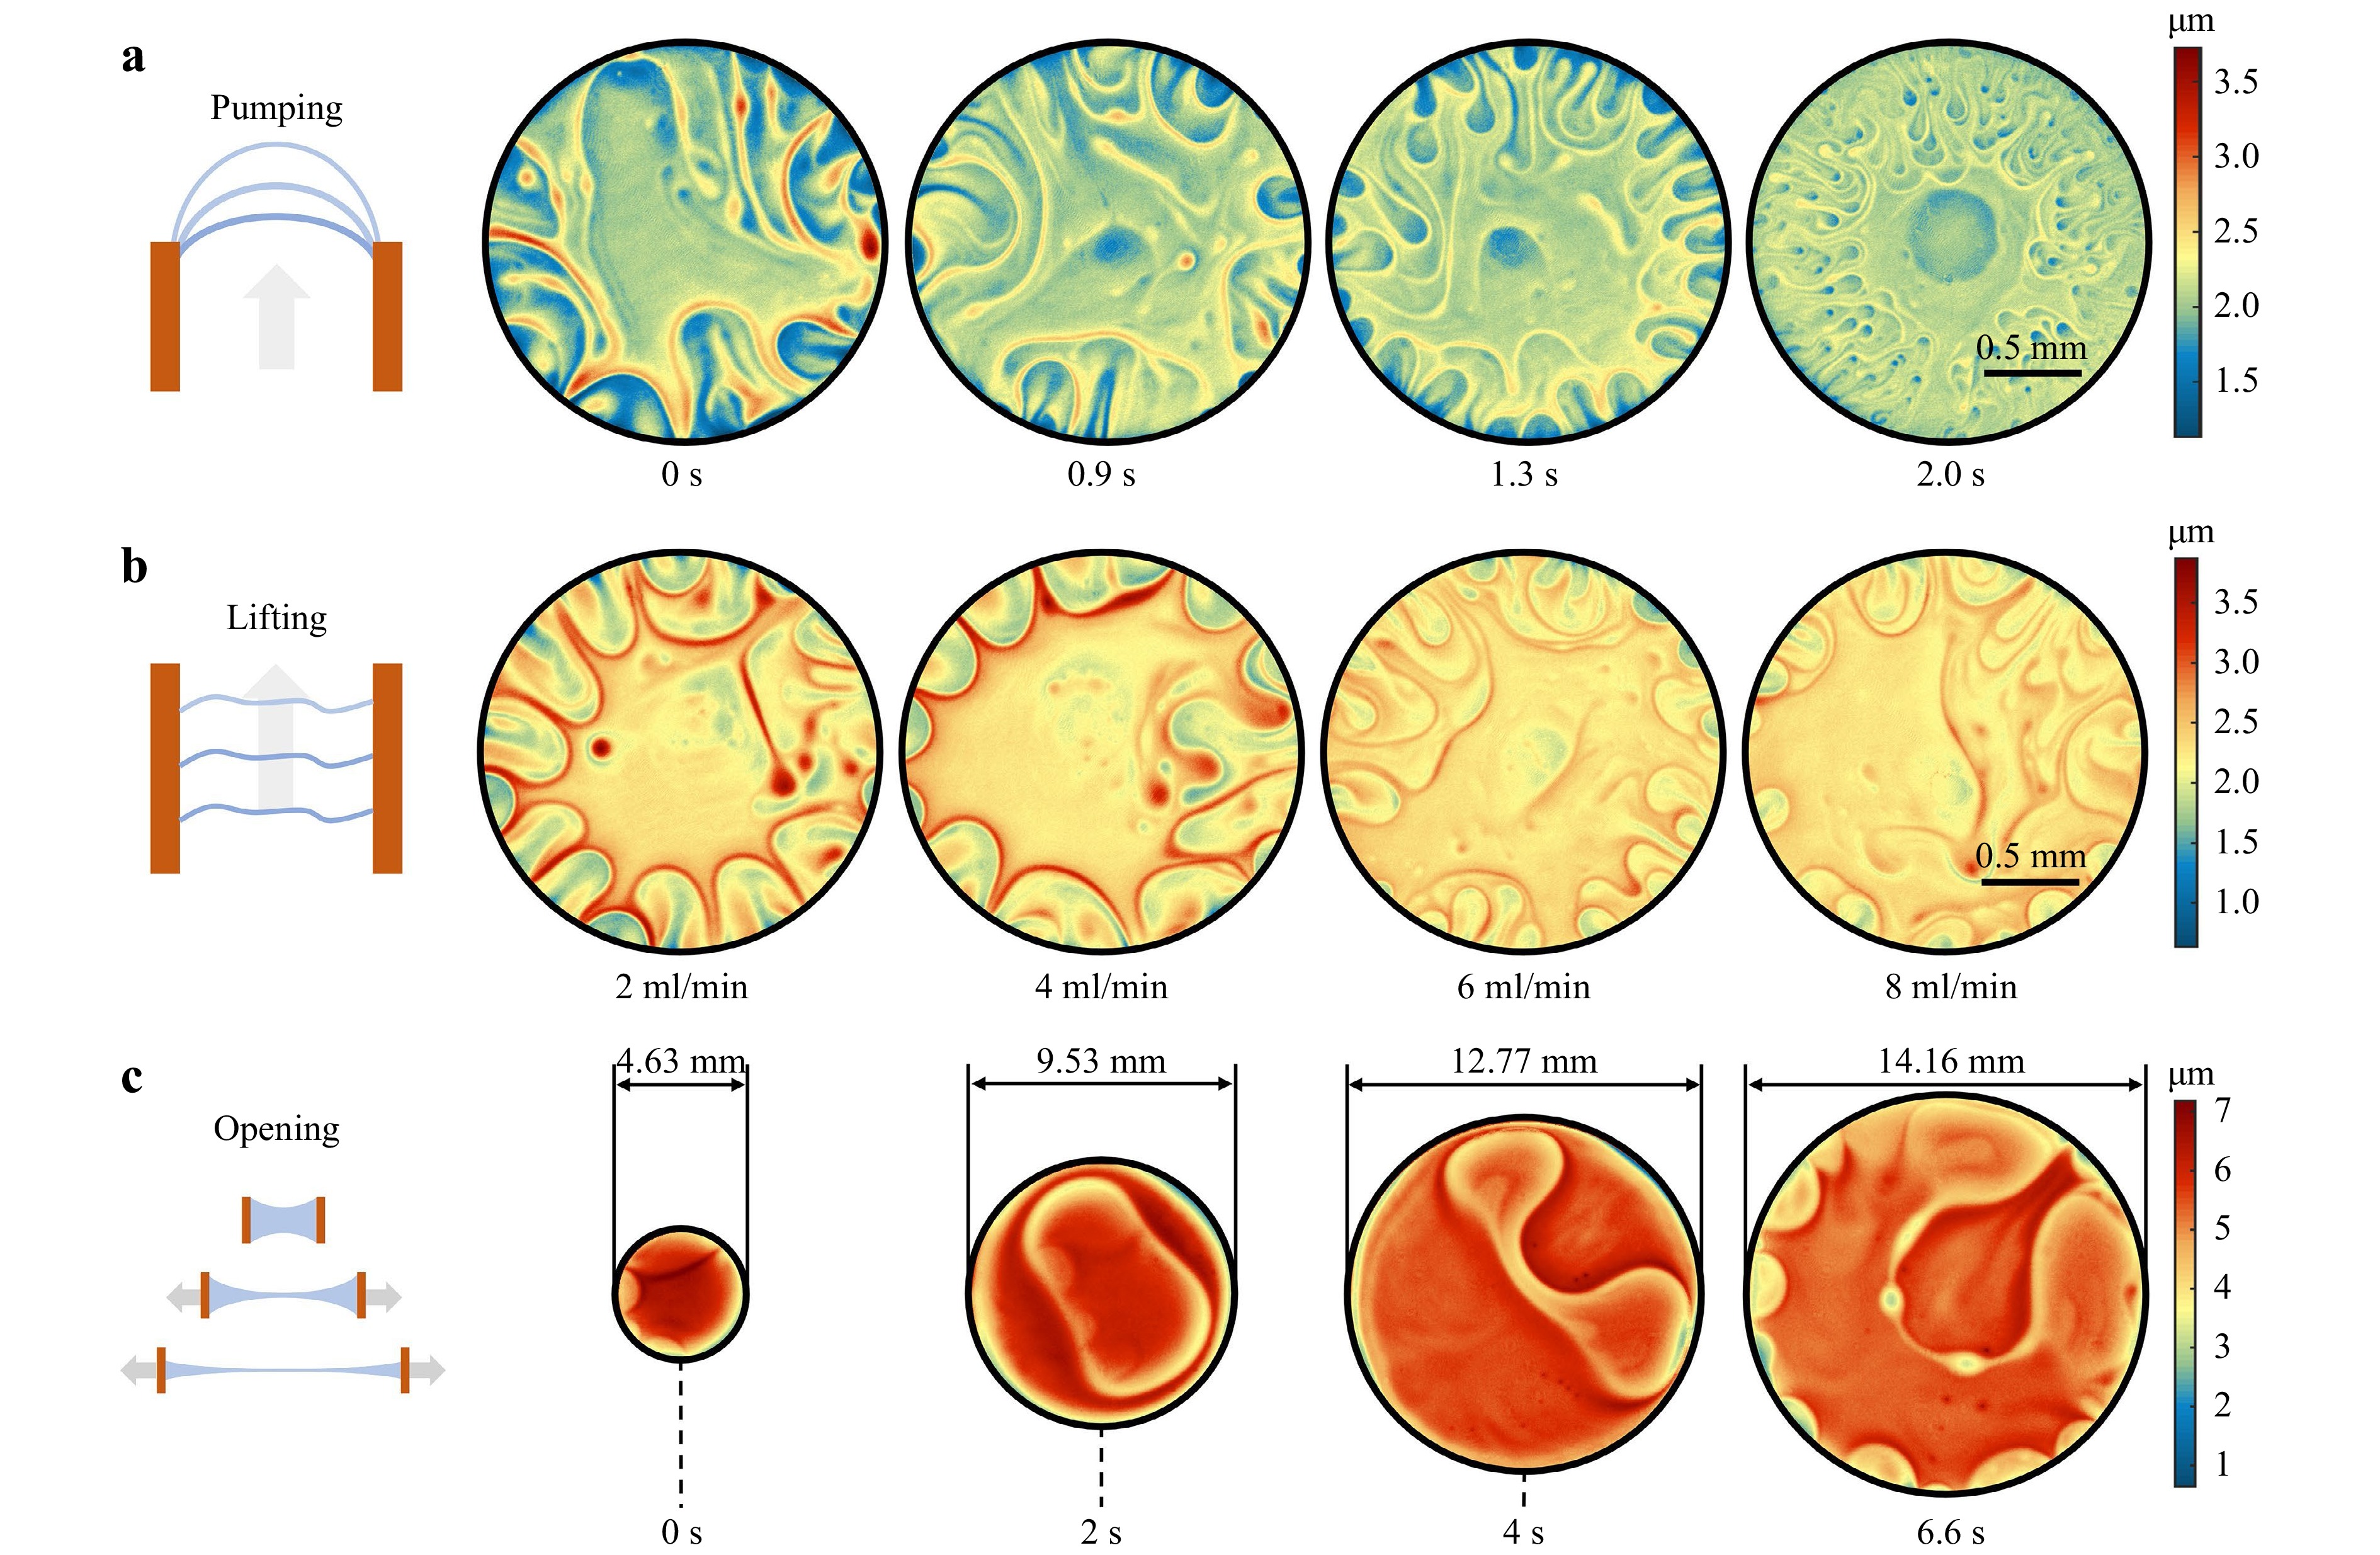
Fig. 4 Digital holography allows thin-film thickness measurements to be produced under different scenarios, breakthrough the limitation for film forming requirement in interferometry. a Measurements for pumping bubble. b Measurements for thin liquid film lifting in tube. c Measurement for film opening.
In an experiment on pumping liquid bubbles, a flat thin film was prepared at one end of a customized tube, and air was pumped into the tube to promote bubble growth. Finally, a semicircular bubble was formed36. The transmissive DH can effectively record the thickness of the bubble during the growth process, and then the thickness information extraction can be completed through numerical refocusing and phase distortion calibration. Fig. 4a shows the measurement results of related experiments. In this experiment, a polyacrylamide (PA) solution was used to create a thin liquid film. For this kind of film, the reconstruction of thickness mapping could be provided using the full life cycle recording method. In addition, owing to the phase distortion calibration, the hemispherical film thickness distribution can be projected as a horizontal mode, which is convenient for researchers to analyze the drainage process. For the lifting thin-film experiment, the film was prepared in the middle of a customized tube and then lifted by pumping air into the tube from the bottom. Because of the centimeter-level movement of the film inside the tube, conventional interferometric methods were unable to provide the thickness distribution during the movement; however, DH could solve this problem. Fig. 4b shows the results of related experiments. The drainage phenomenon in the process of film uplift is related to the velocity of movement, which introduces the potential for controllable drainage. This will help to better study the physical model of the drainage process. The results showed the distribution of the film structure at different moving speeds, and the difference in drainage patterns was revealed. For the film-opening experiments, an optical iris was conceived and manufactured to open the film52. Then, an adjusted telescope structure was used to reach a large FoV (~40 mm diameter), which ensured the recording of the entire film area during the film-opening process. This is also a significant advantage of holographic measurement; the FoV can be changed by adjusting the lens group, thereby realizing continuous holographic recording with a large FoV. The opening process of the film included a potential change in the overall film thickness from high to low. This experimental system ensured that the total amount of solution used to prepare the film remained constant, thereby facilitating the analysis of the hydrodynamic process. Fig. 4c shows the results of related experiments.
In the above three experimental scenarios, holographic measurements showed good thickness measurement capabilities. For most experimental environments, the holographic setup can be easily changed to meet the requirements of recording, enabling its application in the field of fluid mechanics testing.
-
The term “thin film” is ubiquitous in our daily lives, and includes a broad range of materials, from solid to liquid films. In general, under the conditions of interferometric measurements, different configurations are used to complete experiments on different matters. For example, tilted WLI is mainly used for liquid films20, whereas a vertical interferometric system is required for solid films, such as semiconductors of the indium tin oxide (ITO) layer53. In this section, we show the measurement results for films made of different matter to demonstrate the good adaptability of the DH technology in film measurements.
The main problem with conventional interferometric measurements is that it is difficult to realize real-time imaging with a large FoV. In recent years, some methods have been proposed to solve this problem54, but certain restrictions on the RI and film thickness have been added. However, DH recordings are not affected by these limitations. Fig. 5 shows liquid films prepared using three different solutions: surfactants48, polyacrylamide (PA)36, and polydimethylsiloxane (PDMS)52.
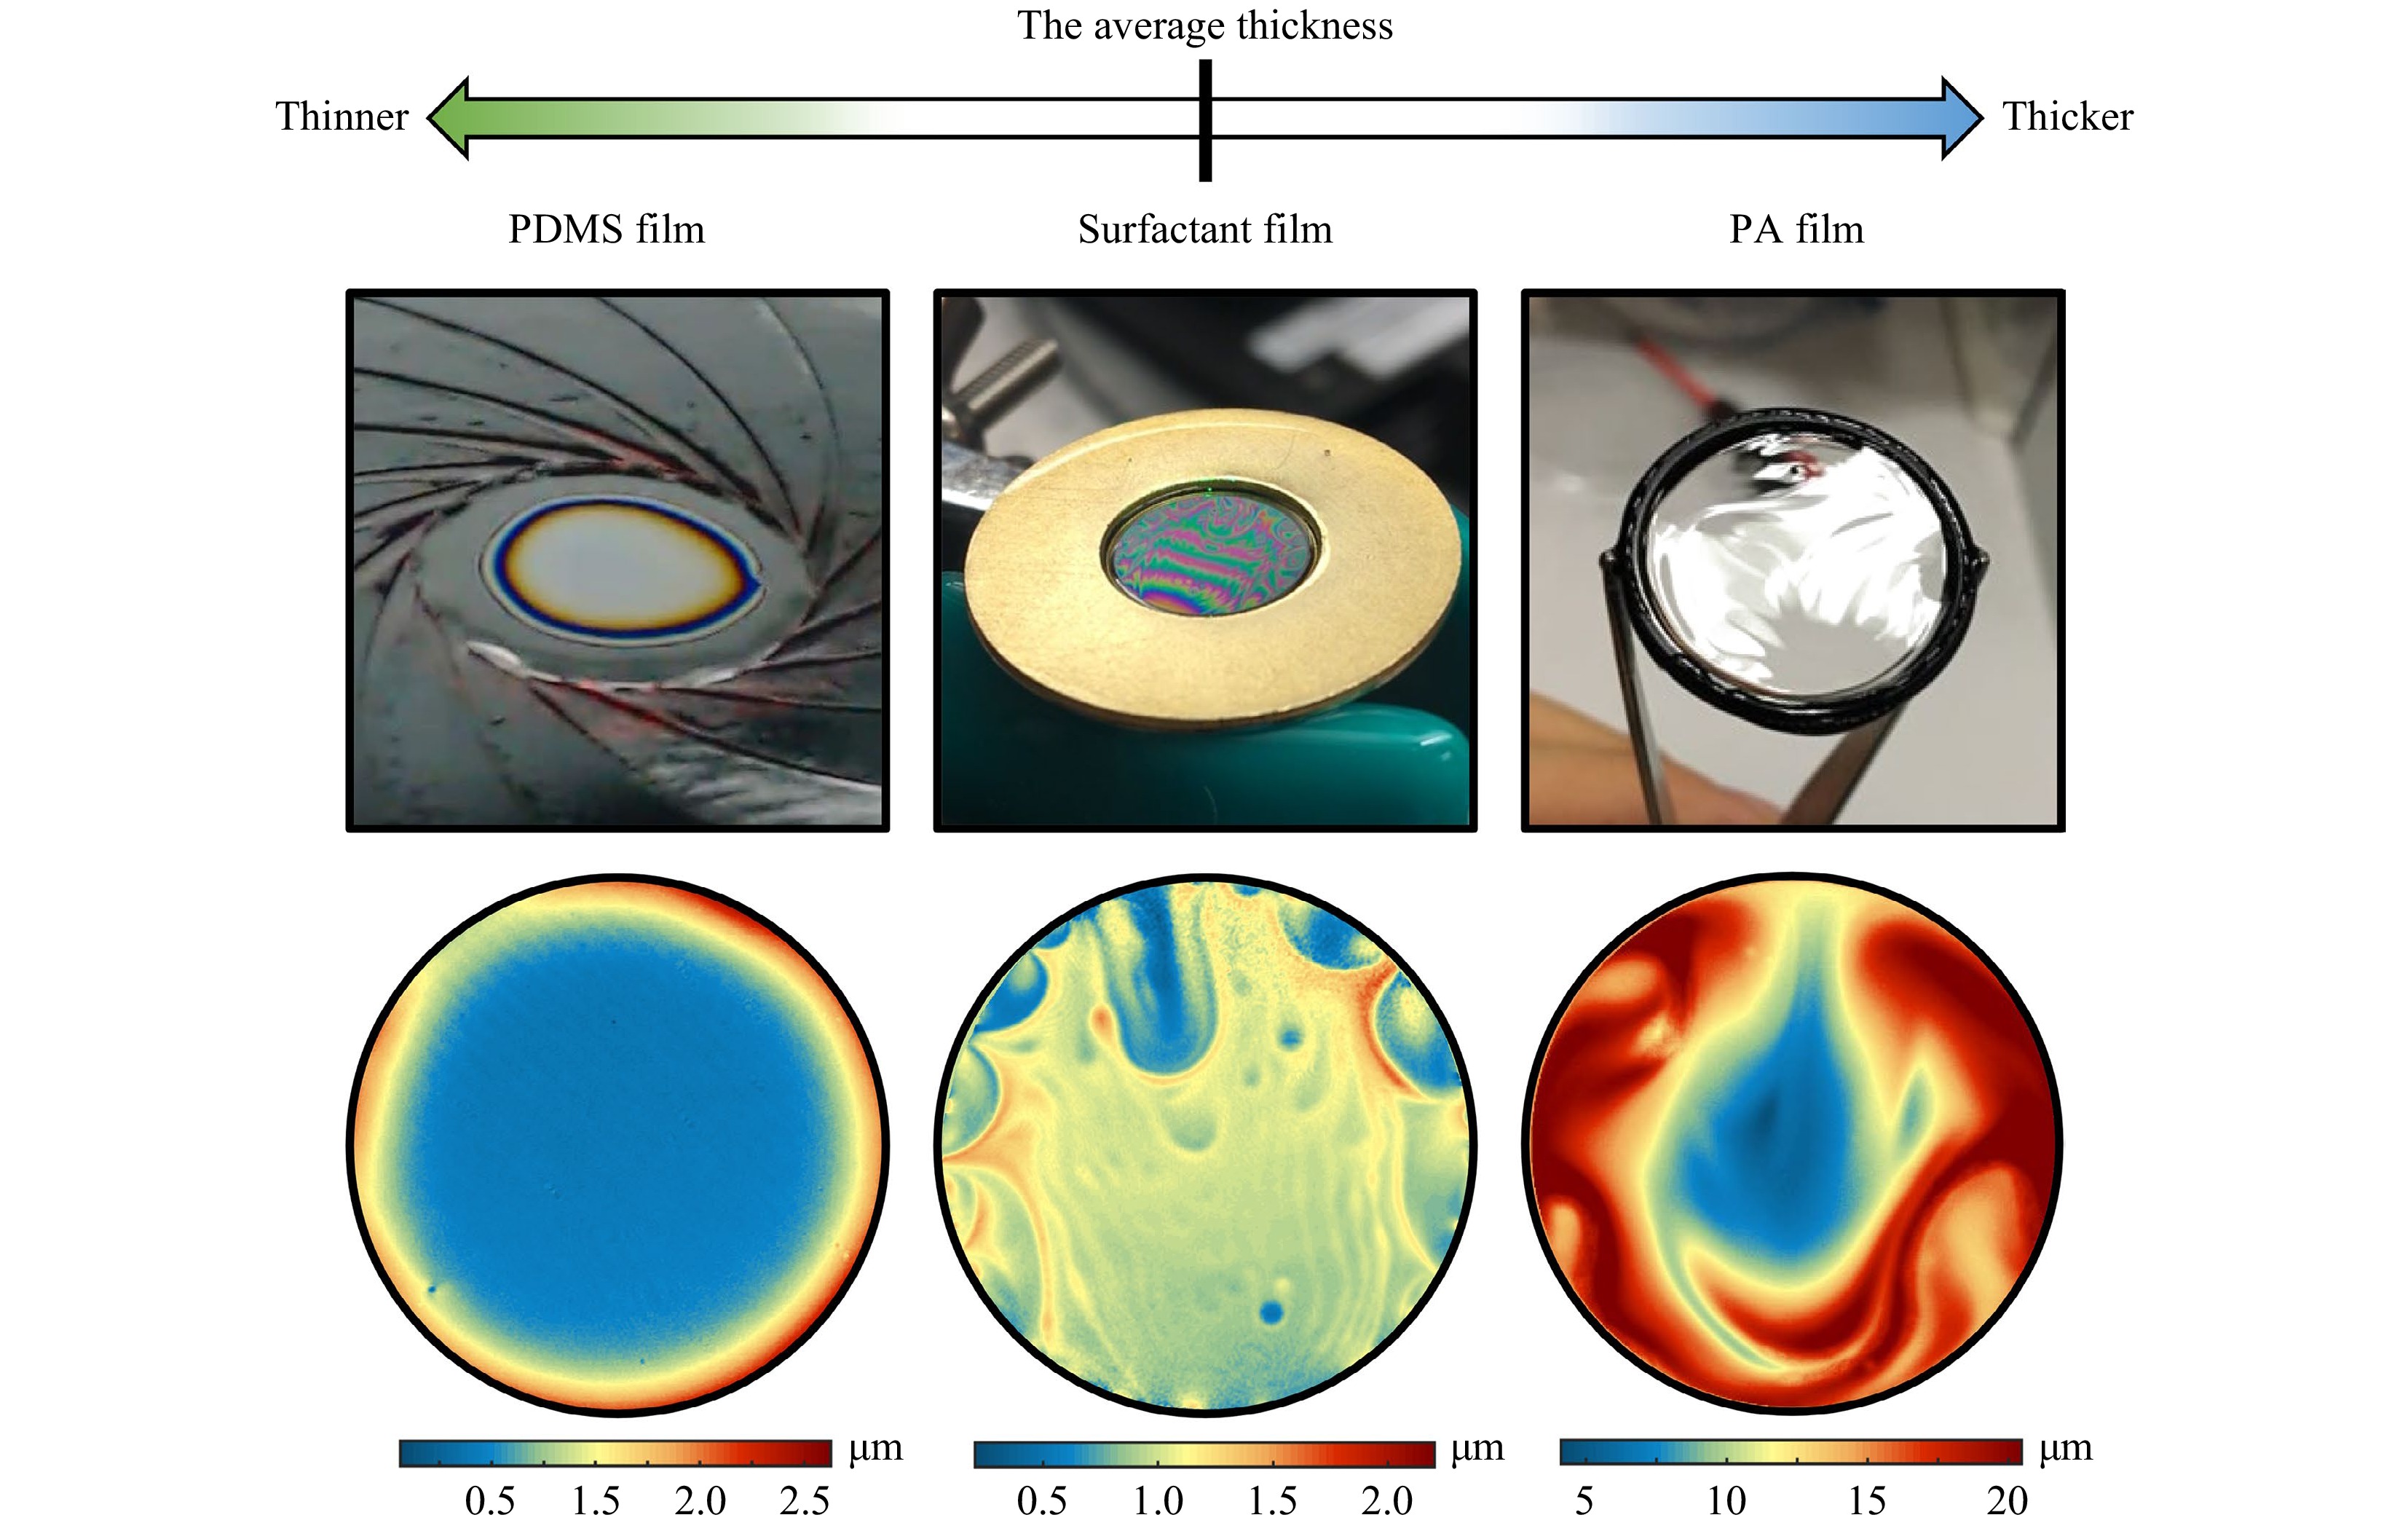
Fig. 5 Digital holography has excellent adaptability to the measurement of transparent thin liquid films with different thickness and surface morphology.
Although we can observe differences in the thickness and morphology of the different films, as shown in Fig. 5, the DH system successfully recorded thickness information. For transmissive holographic recording, light transmittance and polarization of the recording object must be considered. For thin-film materials, most liquid films have good light transmittance, and their polarization effects are so small that they can be ignored. Therefore, holographic measurements can be used for most transparent thin liquid films. Compared with liquid films, solid films are more difficult to image; a main reason is the molecular spacing of the solid films is closer than that of the liquid film, which means that the RI of solid films is generally greater than that of liquid films. Currently, the measurement technology for solid nonuniform thin films remains an unresolved challenge. Many factors limit conventional measurement methods55, although some initial results have been obtained30. From the above experiments, holography has shown excellent measurement capabilities for different materials, is not limited to physical properties, and can successfully provide measurements for most of thin-film materials. This is a very interesting feature that challenges the stringent requirements of interferometry for samples.
-
In the previous sections, the film imaging process at a standard recording speed was discussed. However, for holographic recording systems, owing to the excellent real-time imaging capabilities in off-axis geometry, it is possible to use a high-speed CMOS camera to dynamically follow the thickness evolution. Among these, the rupture process of films is a widely studied issue. For a long time, there has been no reliable measurement technology to capture the edge morphology during film rupture, and DH technology can therefore fill this gap.
The film rupture process can be easily imaged using a conventional off-axis holographic setup with a high-speed camera (980 fps). The related process was modelled to describe the rupture mechanism33. From the time–space model in Fig. 6c, it can be observed that after using the needle to break the film, it resists the rupture process. These results were revealed using holographic technology for the first time. We believe that relevant experimental data will provide important data support for researchers in fluid mechanics. In fact, many microfluidic phenomena occur very quickly and can be analyzed with the help of DH.
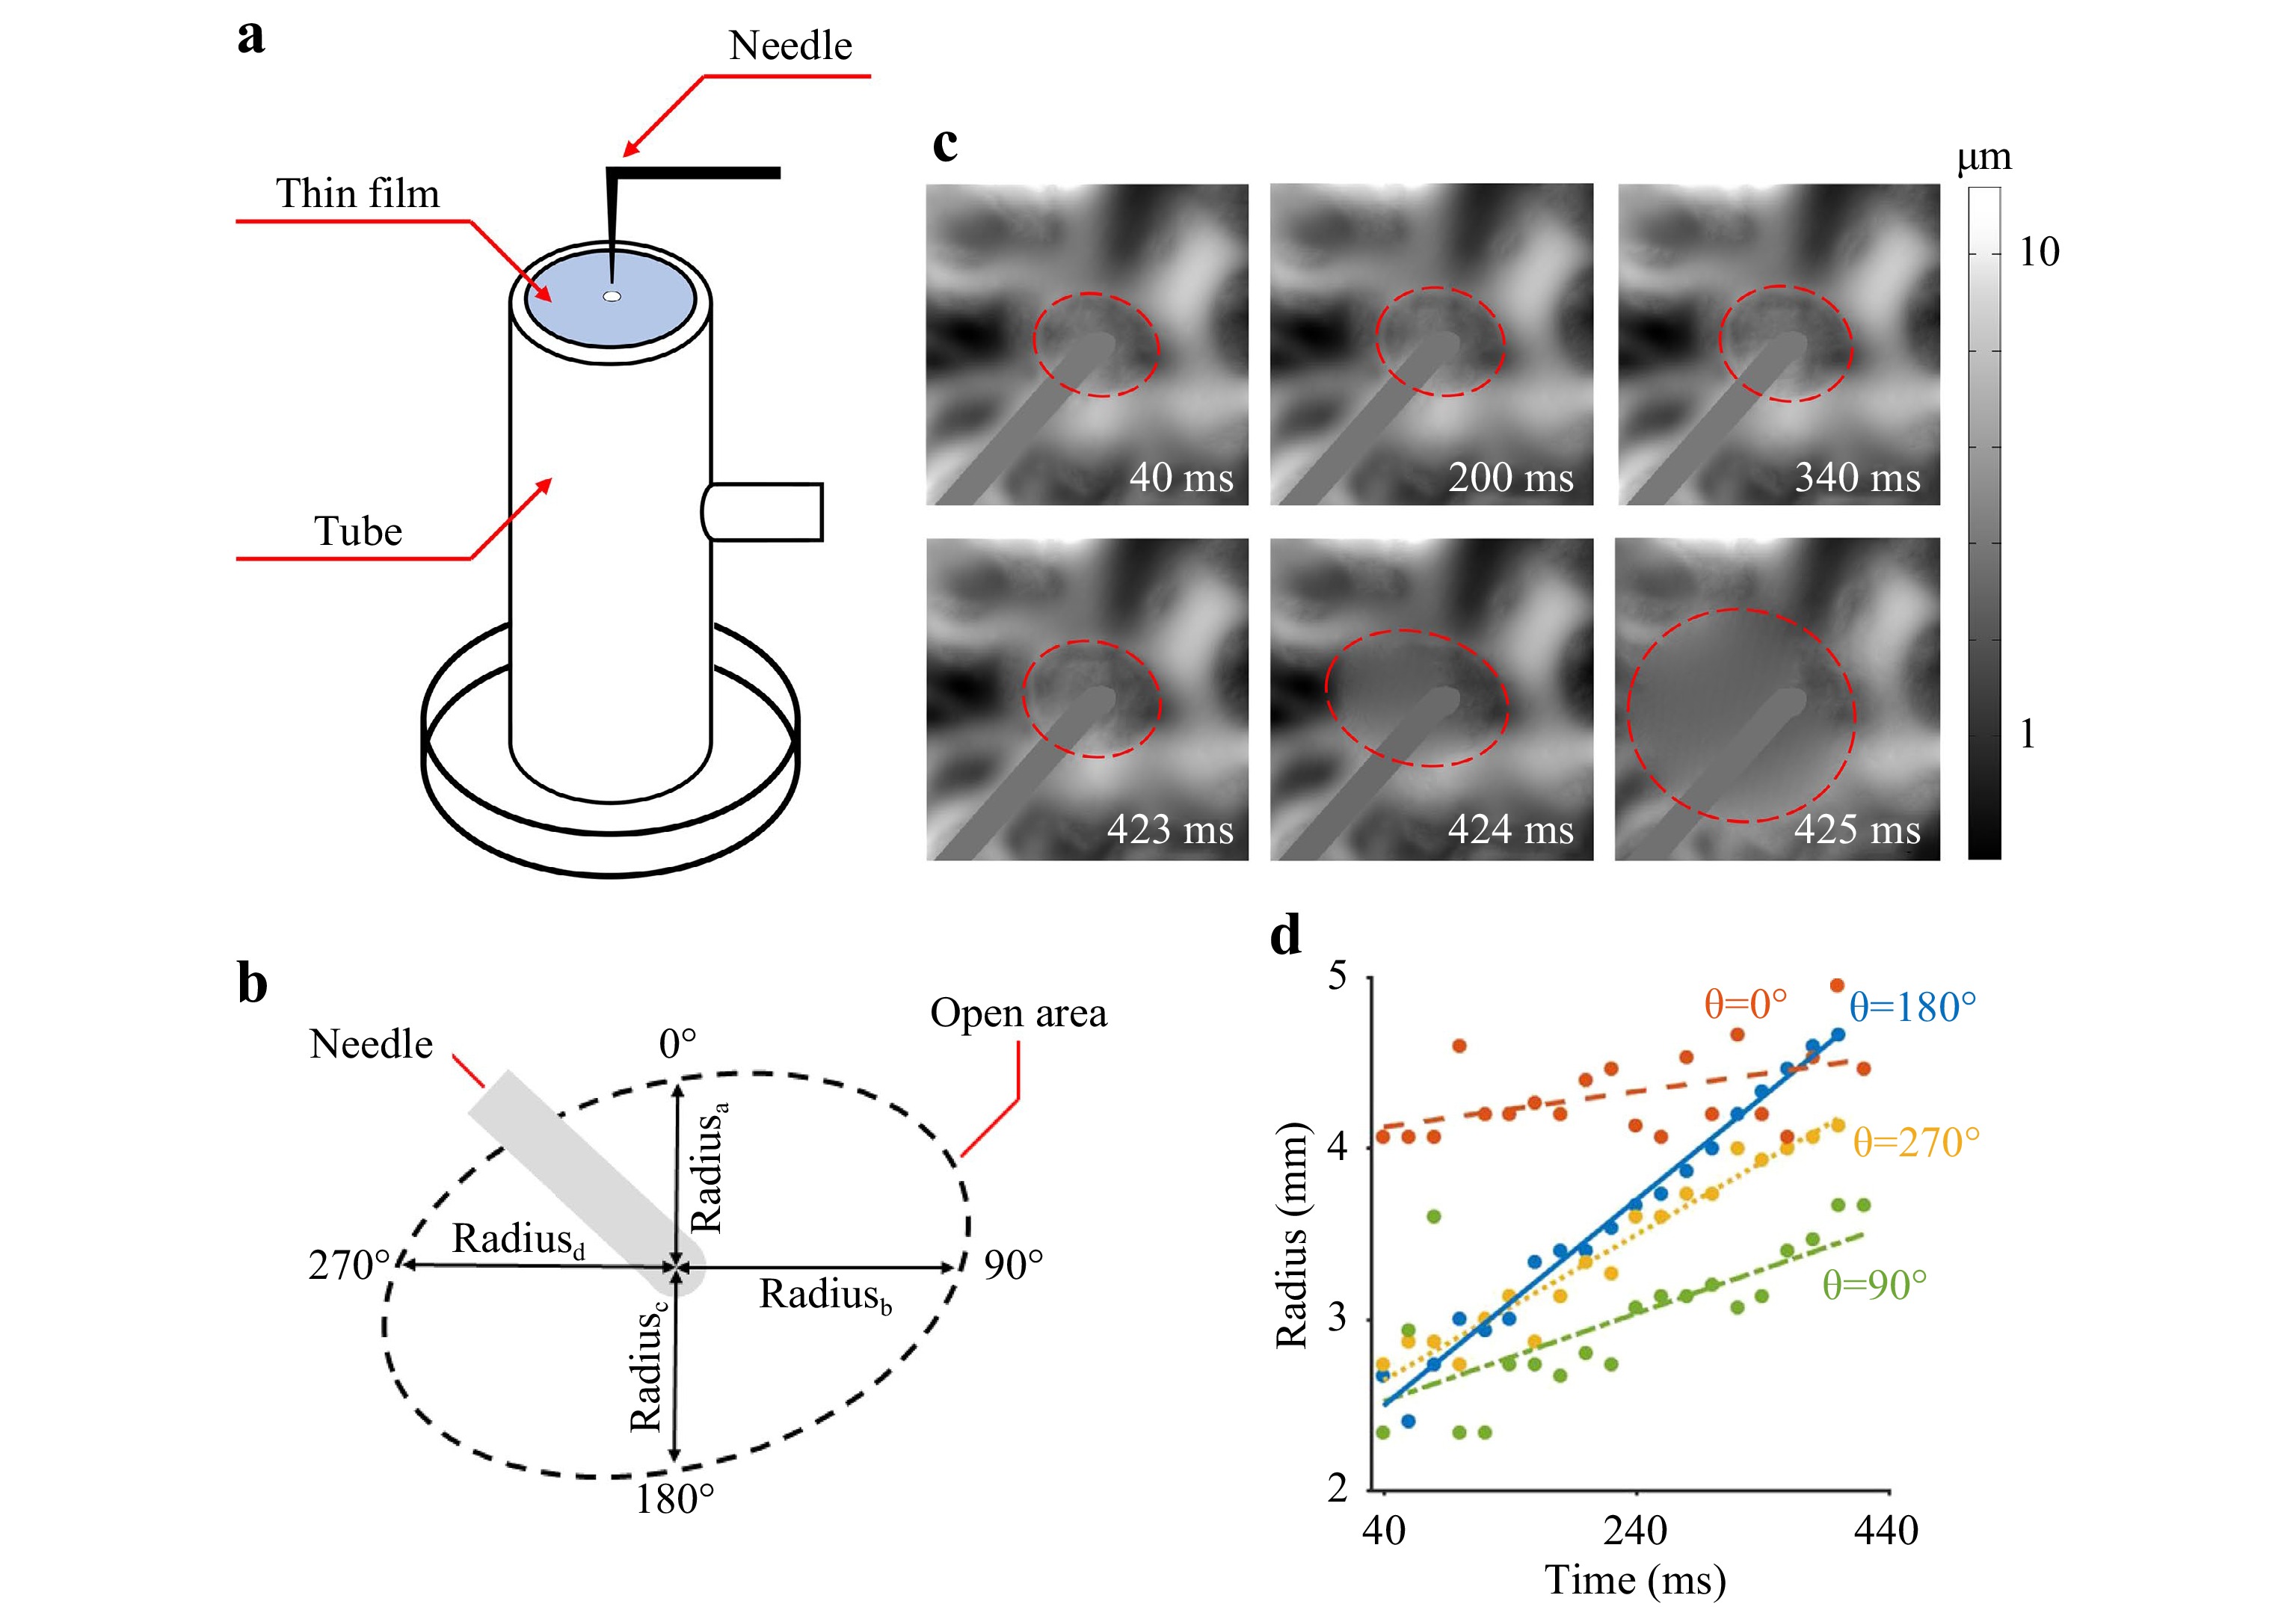
Fig. 6 Digital holographic high-speed imaging for recording thin-film rupture process, experimental scenarios, results, and modeling. a Implementation of the film rupture process. b Description of parameters of rupture area. c Holographic thickness reconstruction of the fracture process. d Modeling the process of film resistance to rupture. Reproduced from Ref. 36 © 2021 Springer Nature.
-
The electrohydrodynamic (EHD) manipulation of liquids is becoming an increasingly popular topic owing to its application in physical, chemical, biological, and engineering research areas, such as microdetectors, the micro-dispensing of small sub-nanoliter volumes of fluids for sensors, flat panel displays, and biochips56. EHD inkjet printing relies on the generation of droplets at or near a nozzle aperture, followed by noncontact deposition on a substrate with high spatial control. Recently, an interesting approach based on the use of a virtual nozzle on the pyroelectric forces has been introduced and applied for the manipulation and dispensing of liquid inks ranging from low to high viscosity. The pyroelectric effect involves the delivery of materials to surfaces at micrometer and nanometer length scales without nozzles or electrodes. The local heating induced on pyroelectric substrates, such as lithium niobate (LN), generates an electric field through the well-known pyroelectric effect57-60. Beyond a threshold electric potential, this field pulls ink from the free liquid surface of the reservoir to form a conical jet similar to the Taylor cone. Controlling the translation of an additional substrate inserted between the LN and the opposing substrate with a liquid reservoir allows additive patterning of the ink materials. The use of pyroelectric effects has provided new capabilities that have been demonstrated in different application contexts, from high-resolution printing and patterning to the fabrication of customized polymeric microstructures61-64. Pyro-inkjet and EHD-printing in general have an interesting physical mechanism leading to diverse jetting behaviors according to the operating conditions and physicochemical properties of the liquid, such as surface tension, viscosity, electric conductivity, and relative permittivity65. Considering that EHD may be applied to different fields according to various ejection conditions, the visualization and understanding of the printing mode would result in better control of the entire fabrication process. Commonly, most of these modes are observed using only one camera, which is only appropriate for stable symmetric modes such as dripping, microdripping, and cone-jet modes, and not for other unstable asymmetric modes. In the case of unstable trajectories, such as the multispindle mode, oscillating-jet mode, precession, and multijet mode66, 67, 3D visualization is necessary to follow the trajectory and exact locations of the ejected droplets. To address this limitation, a 3D tomographic technique was proposed to study the unstable ejection phenomena of droplets68. In addition, the shadowgraphic tomography technique was implemented to reconstruct jetting three-dimensionally69-71. Recently, a numerical method for reconstructing the 3D phenomena was proposed to solve the problem of the invisible area by multiplicative line-of-sight (MLOS) and ellipse estimation; however, the experimental procedures are still long-lasting and complicated69. Even if good results have been obtained by non-intrusive measurement tomography, the setup required for the measurement is still very expensive, requiring more than two cameras, optical components, and dedicated software. In fact, to reconstruct acceptable results from limited projection data, different tomographic algebraic algorithms have been combined, which require time and computational resources70, 71. Recently, quantitative phase microscopy (QPM) has been demonstrated to be a valid tool for the evaluation of liquid and polymer droplet characteristics. In Ref.72, the authors reported on real-time quantitative phase imaging for measuring the evaporation dynamics of sessile microdroplets. The surface wetting properties were retrieved by 3D topographic profiles with nanometer accuracy. QPM has also been used to demonstrate the ability to observe nanosized, semi-transparent, structured coatings involving two materials by combining high-resolution maps of optical path differences and electrical impedance variations73. In this framework, DH microscopy was used to investigate the wetting properties of ink dots obtained by direct writing on a glass plate74. Even though the proposed method could track the temporal evolution of the height, volume, and contact angle of the printed ink dots of approximately 200 mm from gelation to solidification, no report exists that explains the quantitative visualization of 3D viscous polymers, which usually have a high aspect ratio and a trajectory that could span long distances in the FoV75. The quantification of polymeric objects, which rely heavily on manual operations, is labor-intensive and lacks accuracy. In the literature, we found some experiments involving simple cases such as needle and fiber entities, in which the fiber is straight and the tilted angle of the fiber is known76. A point cloud method, where a low gray-scale threshold was used to retrieve the focused part of the objects, was demonstrated; however, this method is applicable only to straight objects77. Recently, an alternative method based on DH was used to automatically characterize an irregular 3D polymeric object. Holograms of a stringy object were recorded using a high-speed DH system. A depth-of-field extended image (DEI) was first obtained by applying an image-fusion algorithm to reconstructed images at different depths78. The edge and skeleton of an object are extracted in 2D space79. The object was divided into small sections along the skeleton, and a hybrid method80 was applied to measure the size and 3D location of each section. All sections were stitched together to retrieve the entire object. DH can simplify the 3D visualization of the manipulation process and simultaneously improve the understanding of unstable and asymmetric physical phenomena. Controlling the jetting of liquids and the manipulation of polymers by DH microscopy would extend the potential of direct writing technologies in different fields where high accuracy is required for fabrication procedures.
-
The manipulation of polymeric fibers is at the base of an innovative 3D printing fabrication technique, in which the pyroelectric effect is used for direct writing and the fabrication of overprinted scaffolds at the microscale. The printing process was activated directly from a reservoir polymeric drop, avoiding the use of nozzles and external voltages. Under the activation of the tethered pyro-electrospinning (TPES) process, the droplet started to deform, creating an elongated tip from which the fibers were drawn81, 82. It is very important to follow the 3D movement of the polymeric fiber during the elongation process to achieve high precision in deposition and final resolution of the structure. The DH tool can be improved for 3D tracking, even in the case of polymer elongation. The results reported below refer to the activation of a polymeric drop of PDMS under the action of the pyroelectric effect. Drop activation can be described by three main steps: drop deformation, cone formation, and cone elongation. During the final step, the polymer fiber could be unstable, and the movement of the final part with the tip could be synchronized with the upper activation zone. Using a conventional visualization line made of a light source, camera, and objective, it would be difficult to follow the evolution in time and space of the polymeric cone. In fact, the cone can move along the vertical axis from the focus of the visualization. Eventually, a tracking technique could enable the reconstruction of more complex and dynamic structures. In particular, under the instability of the pyroelectric effect used for the manipulation of the material, it is possible to observe the activation of Rayleigh instability. Under this condition, beads-on-a-string (BOAS) are generated and can flow over the polymeric fiber. As investigated in our previous work, the elongation, deformation, and eventually the final breakup of viscoelastic filaments pass through the formation of temporary pearls interconnected by a thin thread, the so-called BOAS structures83, 84. The evolution in time and space, together with the continuous movement of the fiber and beads flowing on it makes very difficult to observe this process and its characterization.
In this study, a transmissive off-axis holographic recording setup was used to track the movement of polymeric fibers. Owing to the refocusing process of DH, the nonlinear motion process of polymeric fibers can be effectively tracked. Fig. 7 shows the fiber tracking results for 25 frames. Under the action of the pyroelectric effect, PDMS forms fibers that can be recorded, which are so thin that the laser light can pass through them to achieve an effective holographic recording. This significantly improves the accuracy of 3D positioning. However, the numerical diffraction propagation for the entire FoV was difficult to obtain because the fiber showed an increasing trend in the z-axis direction, its top was far away from the recording plane, and its bottom was close to the recording plane. Therefore, we divided the fiber into 17 sub-strips and performed separate holographic reconstruction and Tamura auto-focusing on each strip to determine the best z-axis position. In Fig. 7b, we report the result of frame 4653 as an example, where the blue dots indicate the focal position of each band. The feature correlation recognition method was used to track the x-axis position of the fiber. Here, the y-axis position of the fiber is the absolute position, and the x- and z-axes are the measurement positions. Therefore, the spatial coordinate distribution has a certain discrete type under an overall uniform trend. To facilitate the identification, we fitted the 3D discrete fiber position identification points with a straight line for all steps of fiber movement, as shown in Fig. 7c.
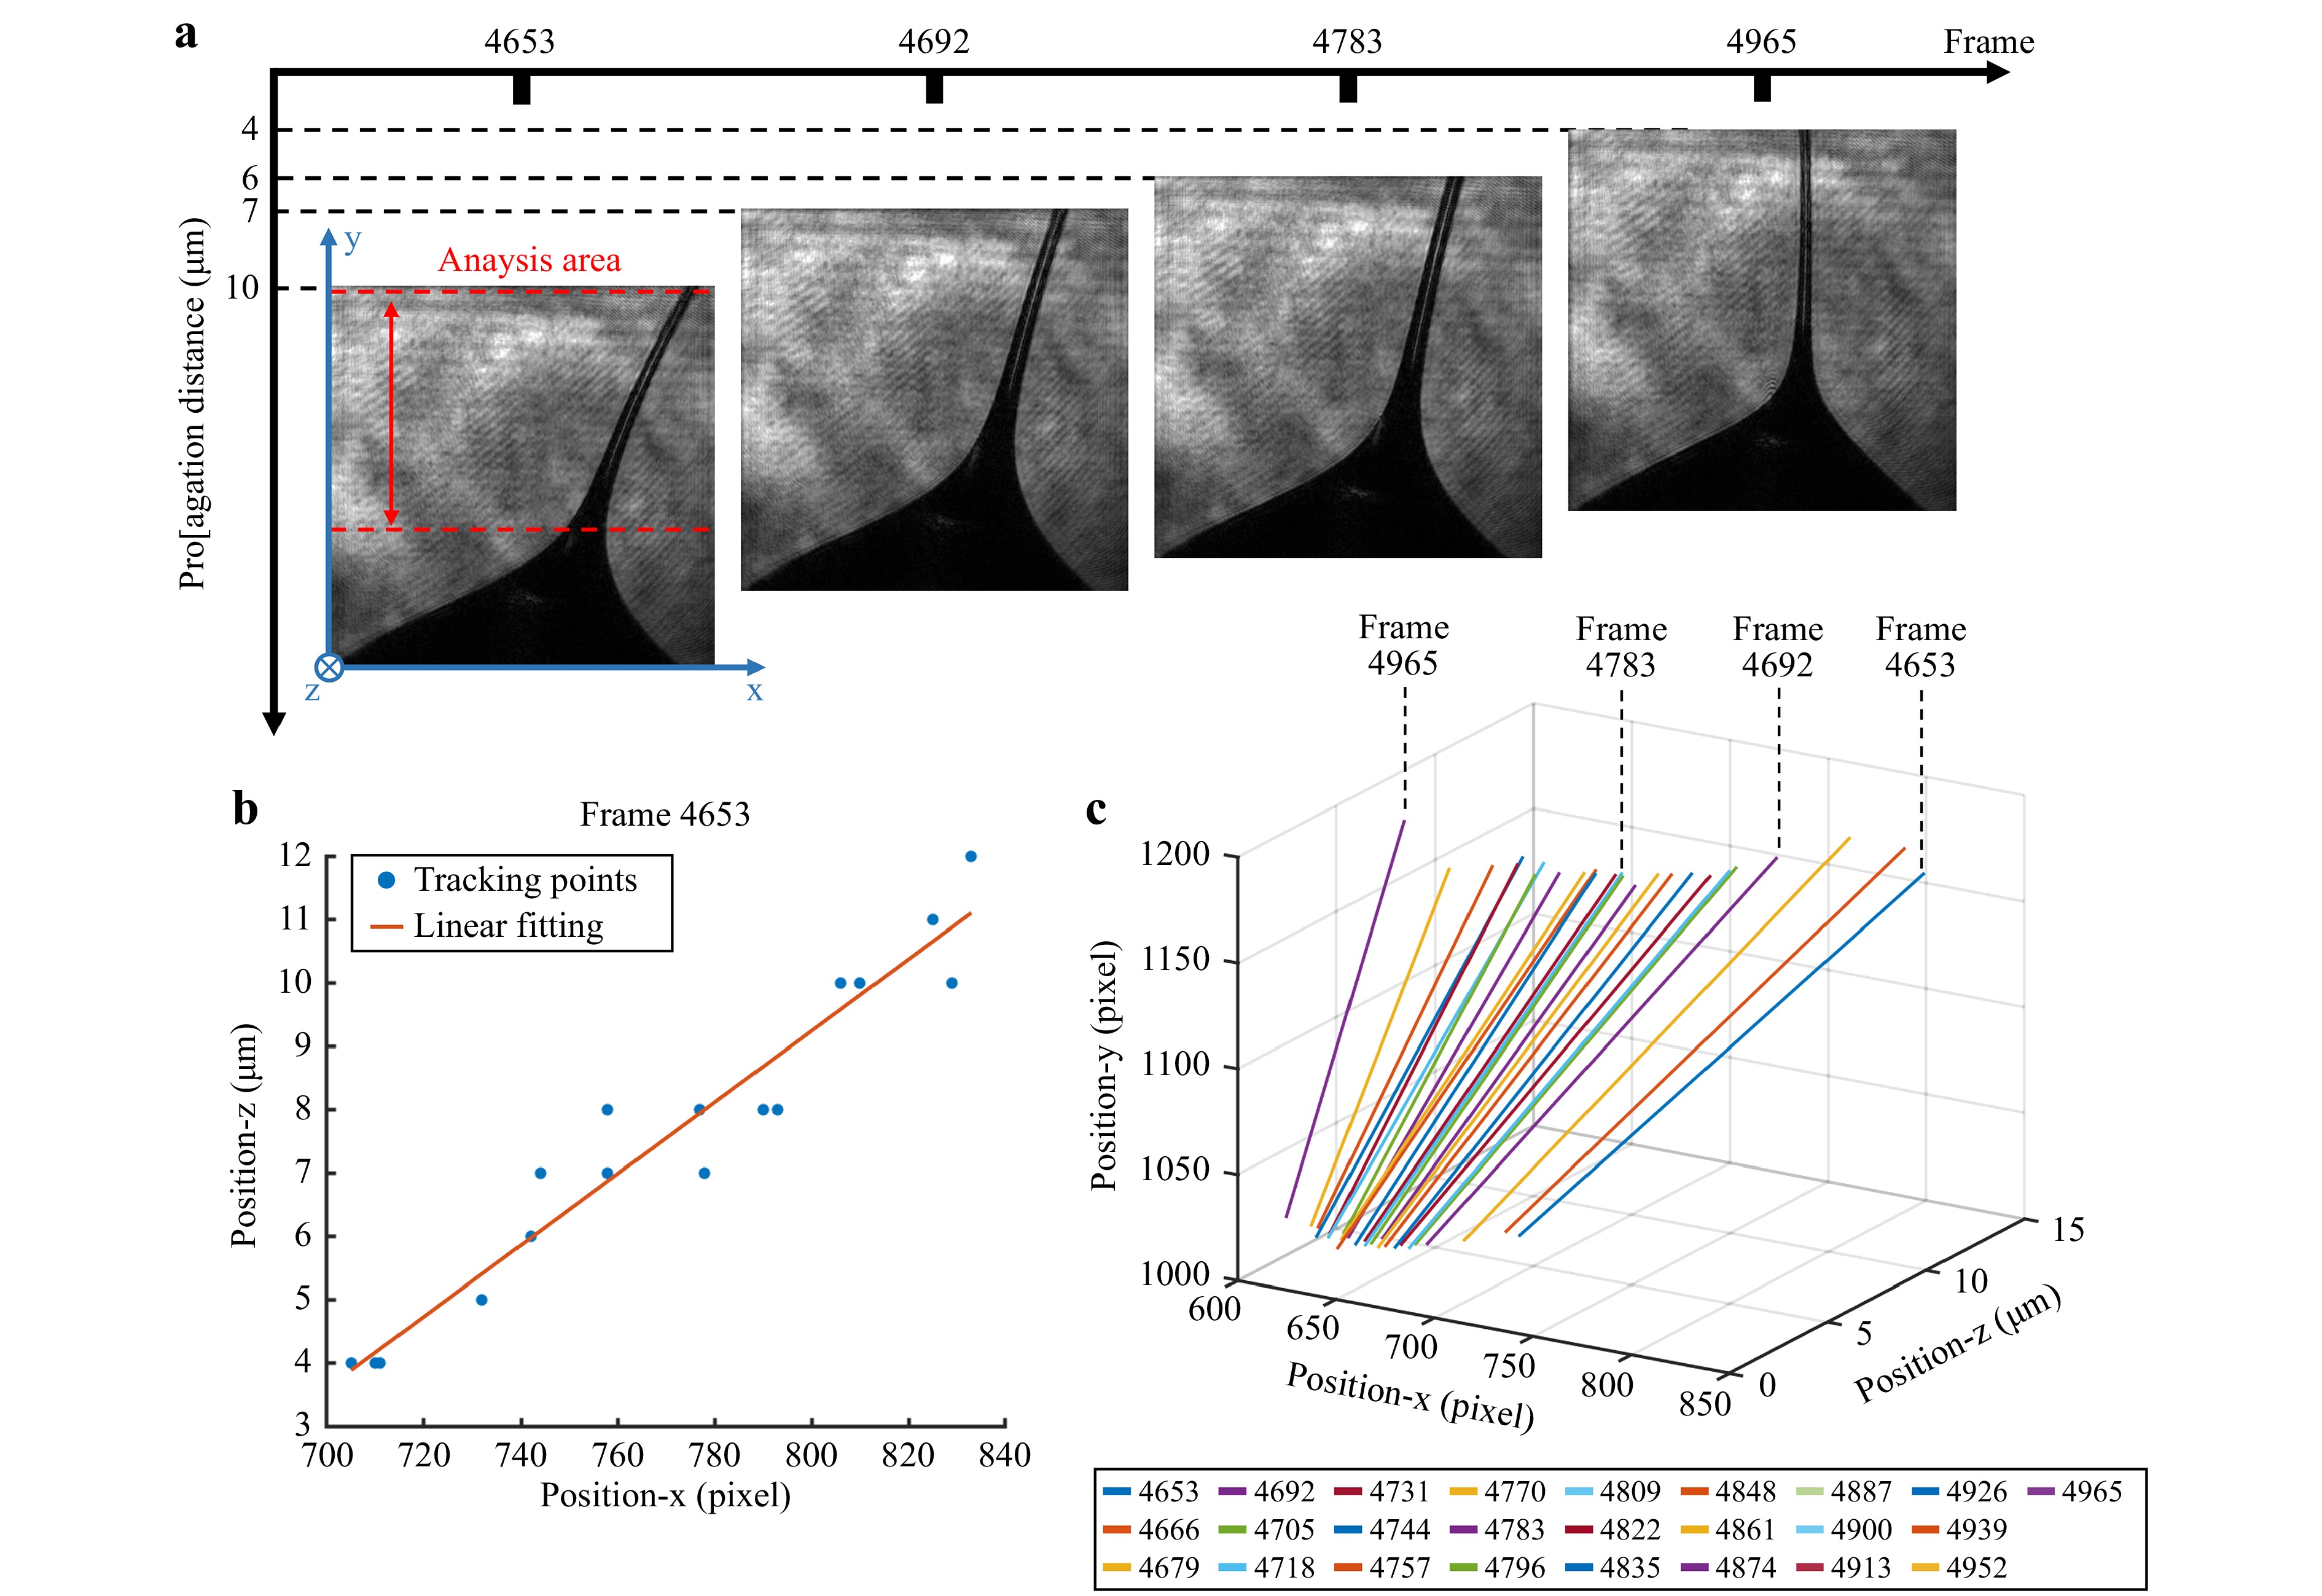
Fig. 7 a Experimental frames of polymer jetting, showing the movement of the fiber in time. b Tracking of the fiber position in frame 4653, the blue dots represent the focus position. c Three-dimensional fitting of discrete fiber position with a straight line for the experimental frames within the range 4653–4952.
-
DH also enables us to accurately locate BOAS structures over thin polymeric fibers. As shown in Fig. 8, we selected three frames from a series of BOAS generation processes to reconstruct the position and size of each bead. The spatial location and size of each bead are shown in Fig. 8b. Here, multi-steps diffraction propagation and stripes reconstruction process were used to extract the bead information. Furthermore, in the 2D phase as shown in Fig. 8a, which is reconstructed by a uniform propagation distance, we could see that the beads were arranged vertically on the fiber, but after holographic 3D positioning, the size and spatial position of each bead, including z position, could be retrieved, providing important data for further quantitative analysis.
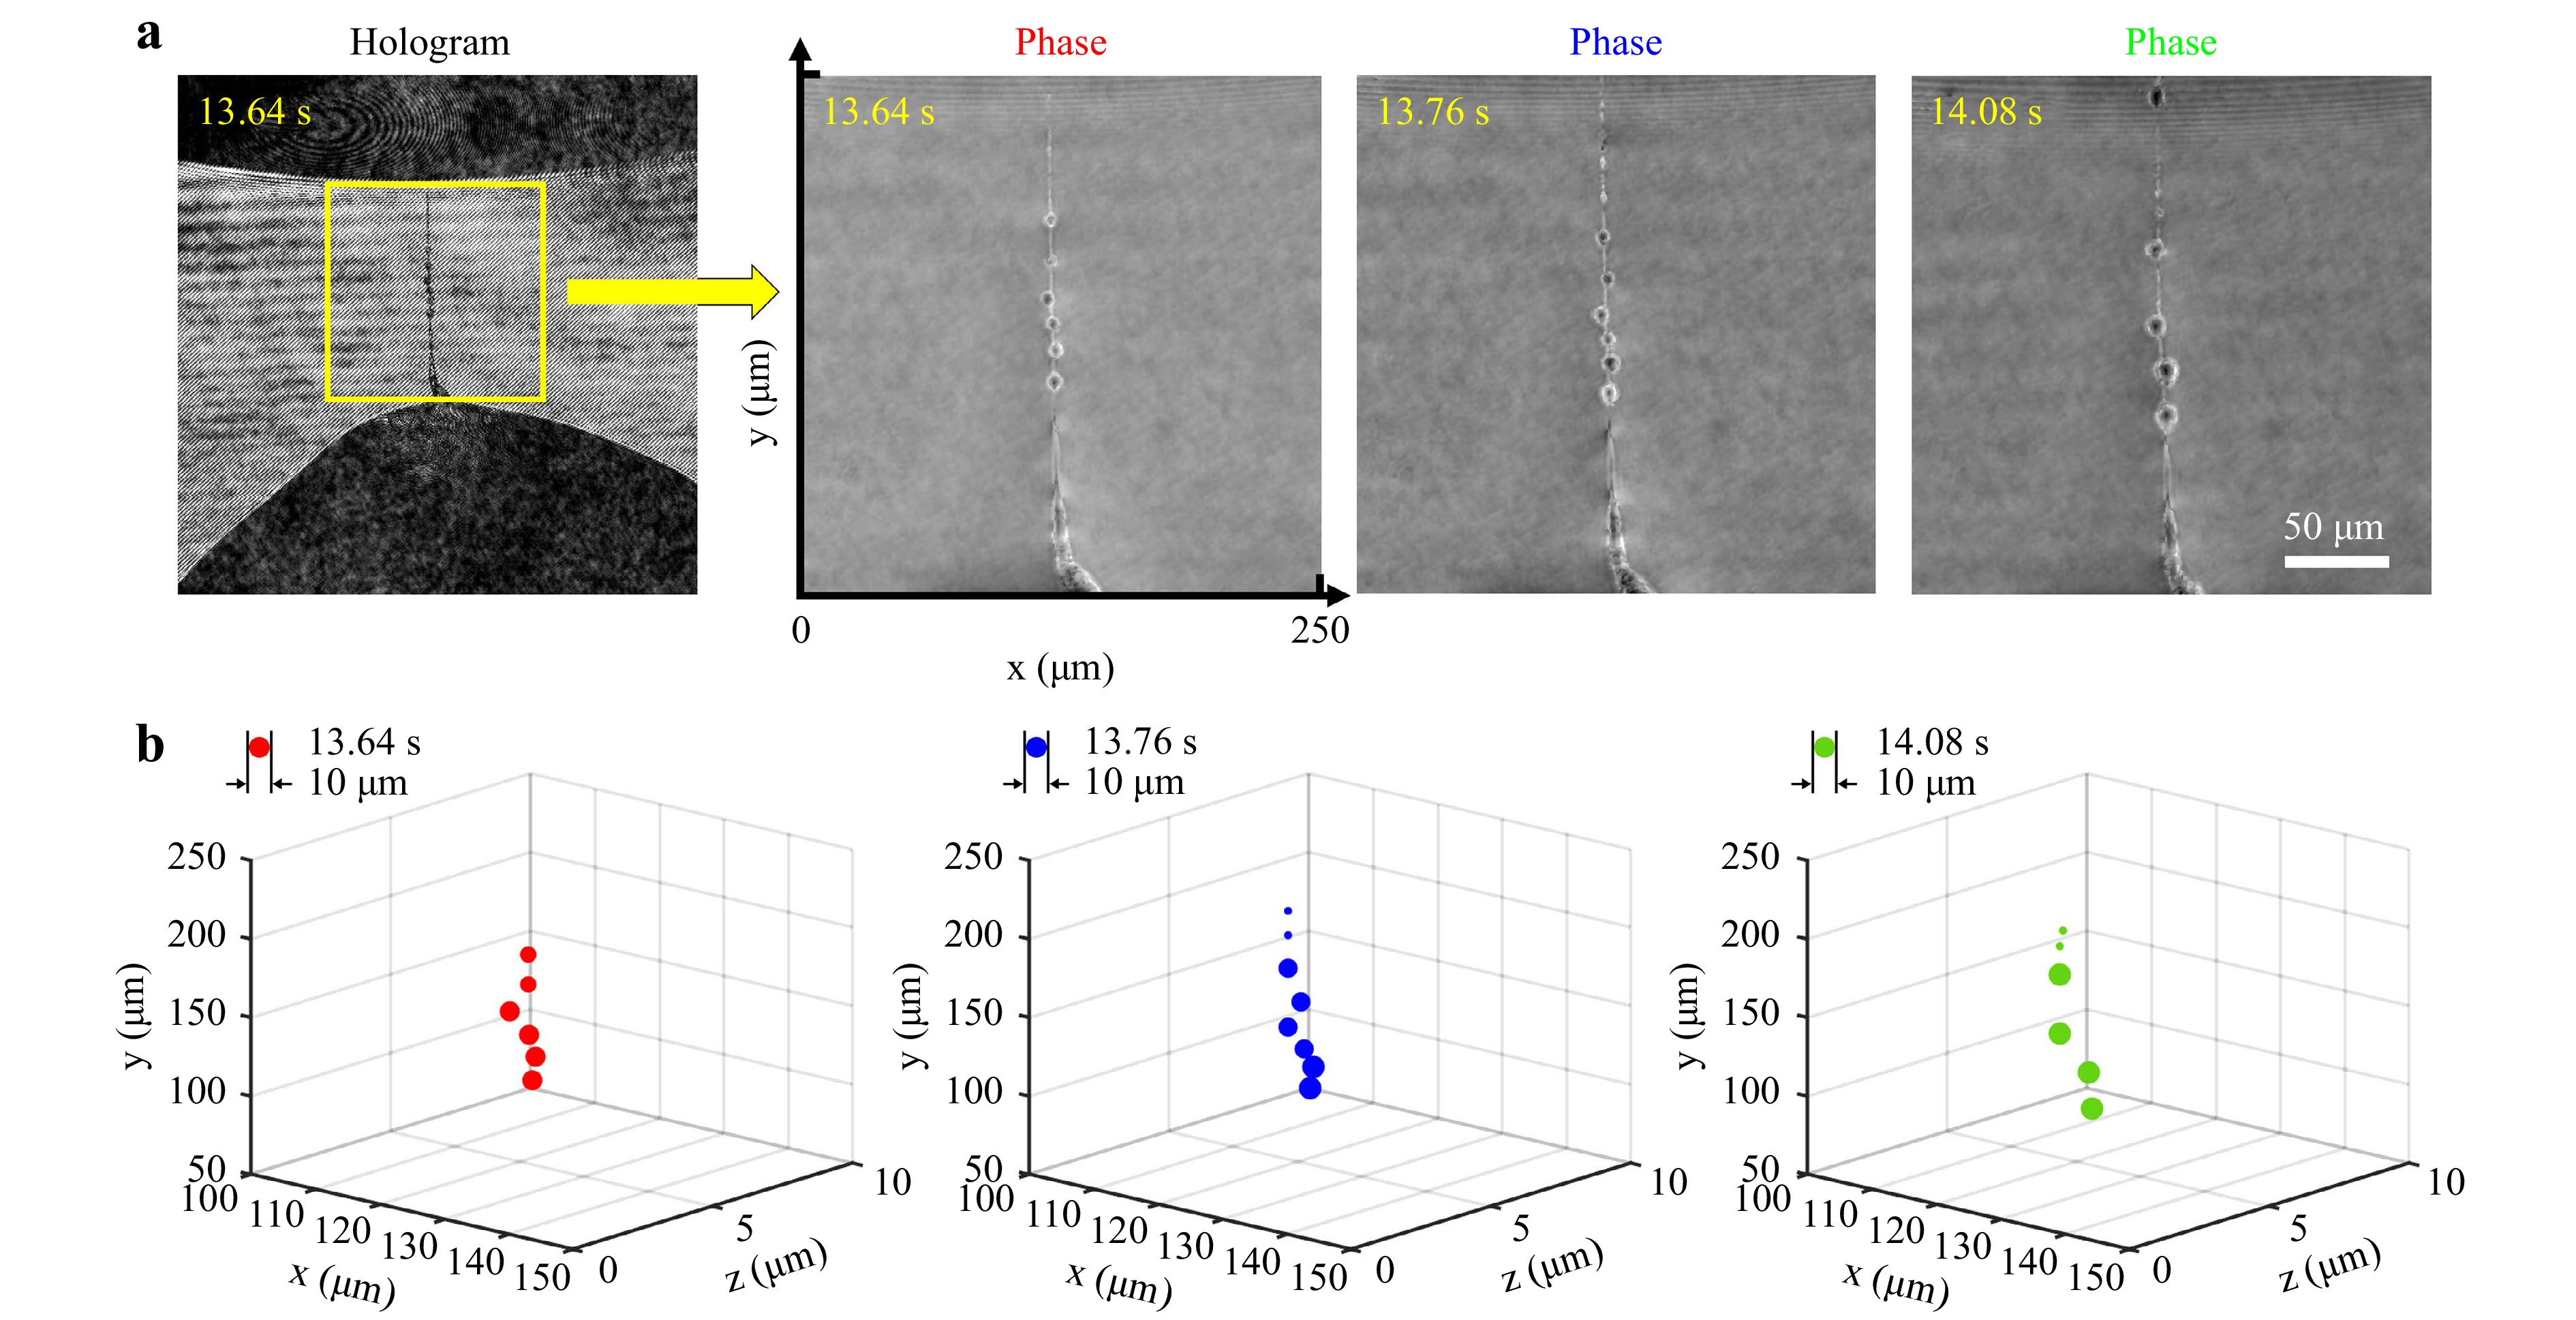
Fig. 8 a Hologram and phase reconstruction of experimental frames, the yellow region indicates the region of interest with the polymeric beads. b Evolution in time of tracking position of the beads flowing on the fiber.
-
The process of cone formation at the base of the polymer elongation described in the previous section can also be adopted for the jetting of the polymeric drop. In particular, once the electric charges accumulated on the tip of the polymeric cone overcome the surface charges of the material, small volumes can be dispensed and collected onto a commercial target. In this configuration, the starting reservoir polymeric drop was deposited on a pillar base, while the pyroelectric crystal was mounted over the coverslip upon which the drop was supported, and was heated locally together with the base droplet, thus allowing the generation of pyroelectric surface charges on the crystal. The liquid droplet started to deform under the action of a sufficiently strong electric field, and was released from the conical tip microdroplets onto a moving substrate. By controlling the starting volume, contact angle of the substrate, and by selecting the polymer of interest, droplets of different geometries and volumes could be dispensed by direct writing (see Fig. 9).
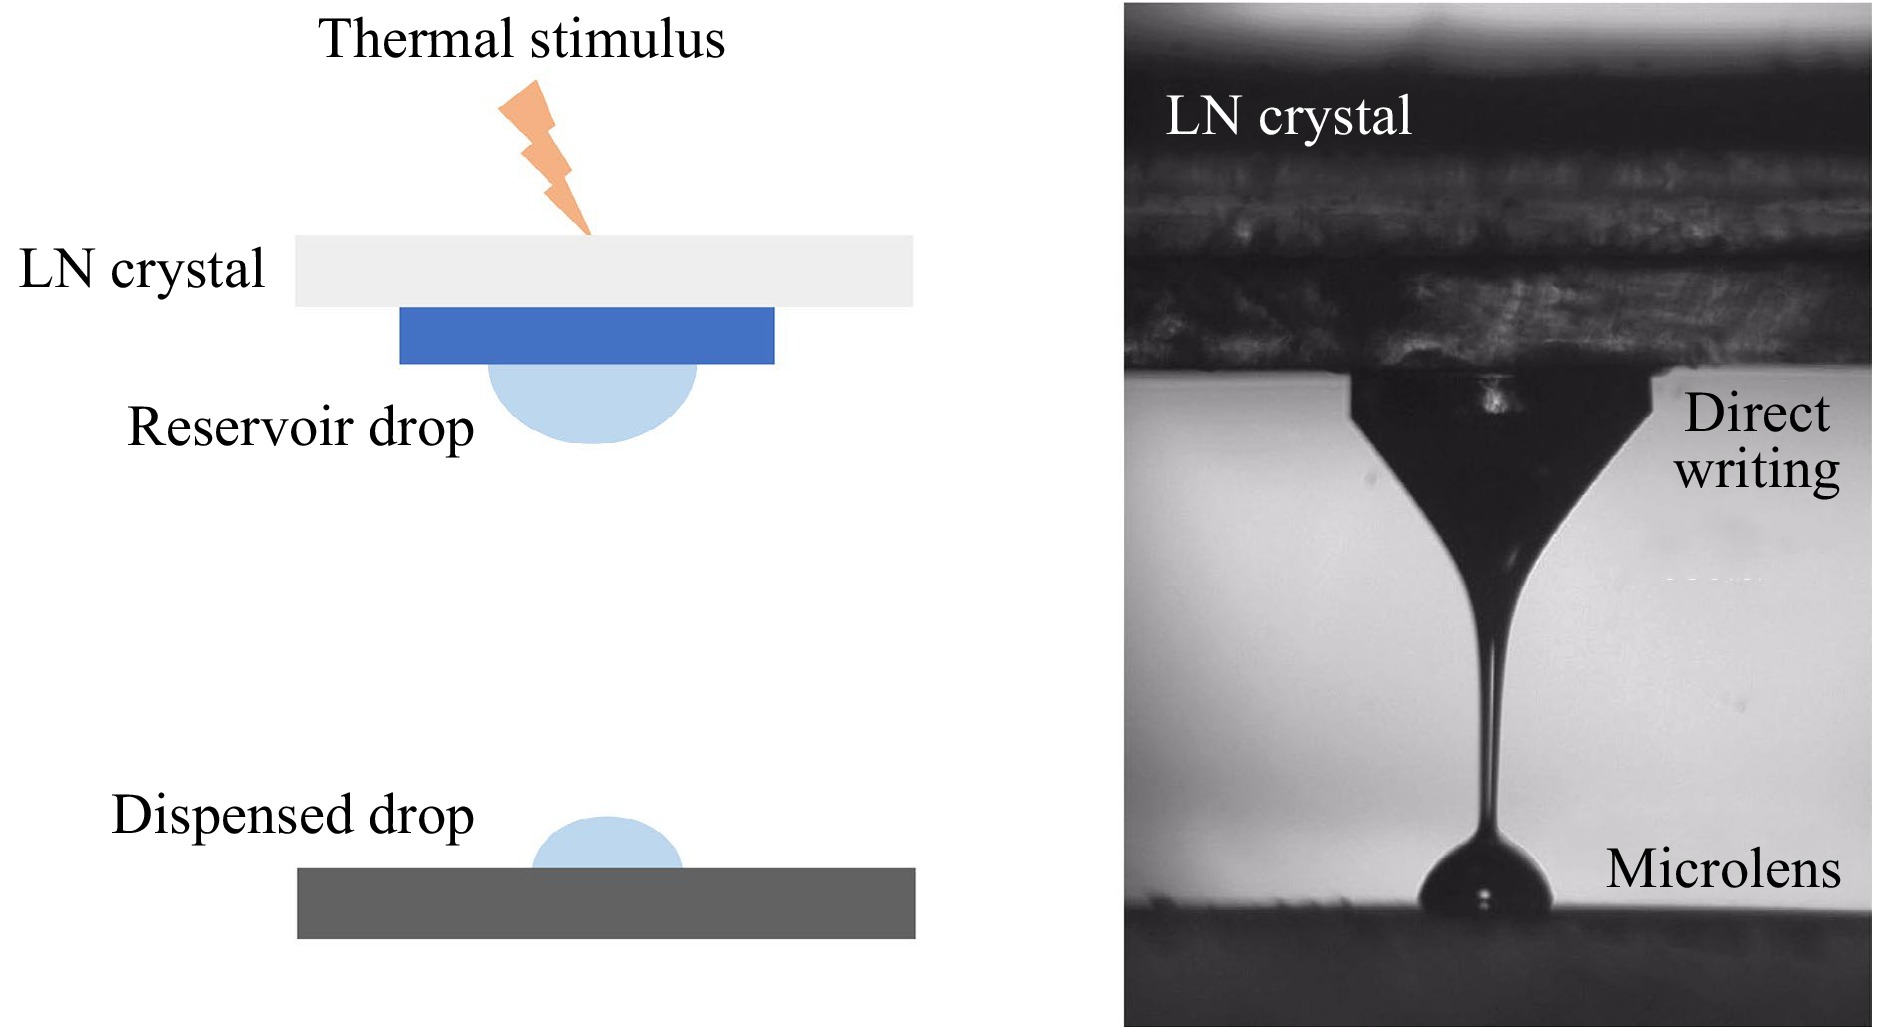
Fig. 9 a Outline of the direct writing set-up: a thermal stimulus is applied to the LN crystal for the activation of the pyro-EHD effect. b Direct writing of a polymeric microlens onto a commercial PMMA target.
Once cured, the polymeric structures could be used as optical microlenses, and interferometric characterization based on DH microscopy was carried out to evaluate the optical aberrations of the microstructures and their focusing properties85, 86. The optical setup consisted of a classical Mach-Zehnder interferometer in the transmission configuration, as shown in Fig. 10.
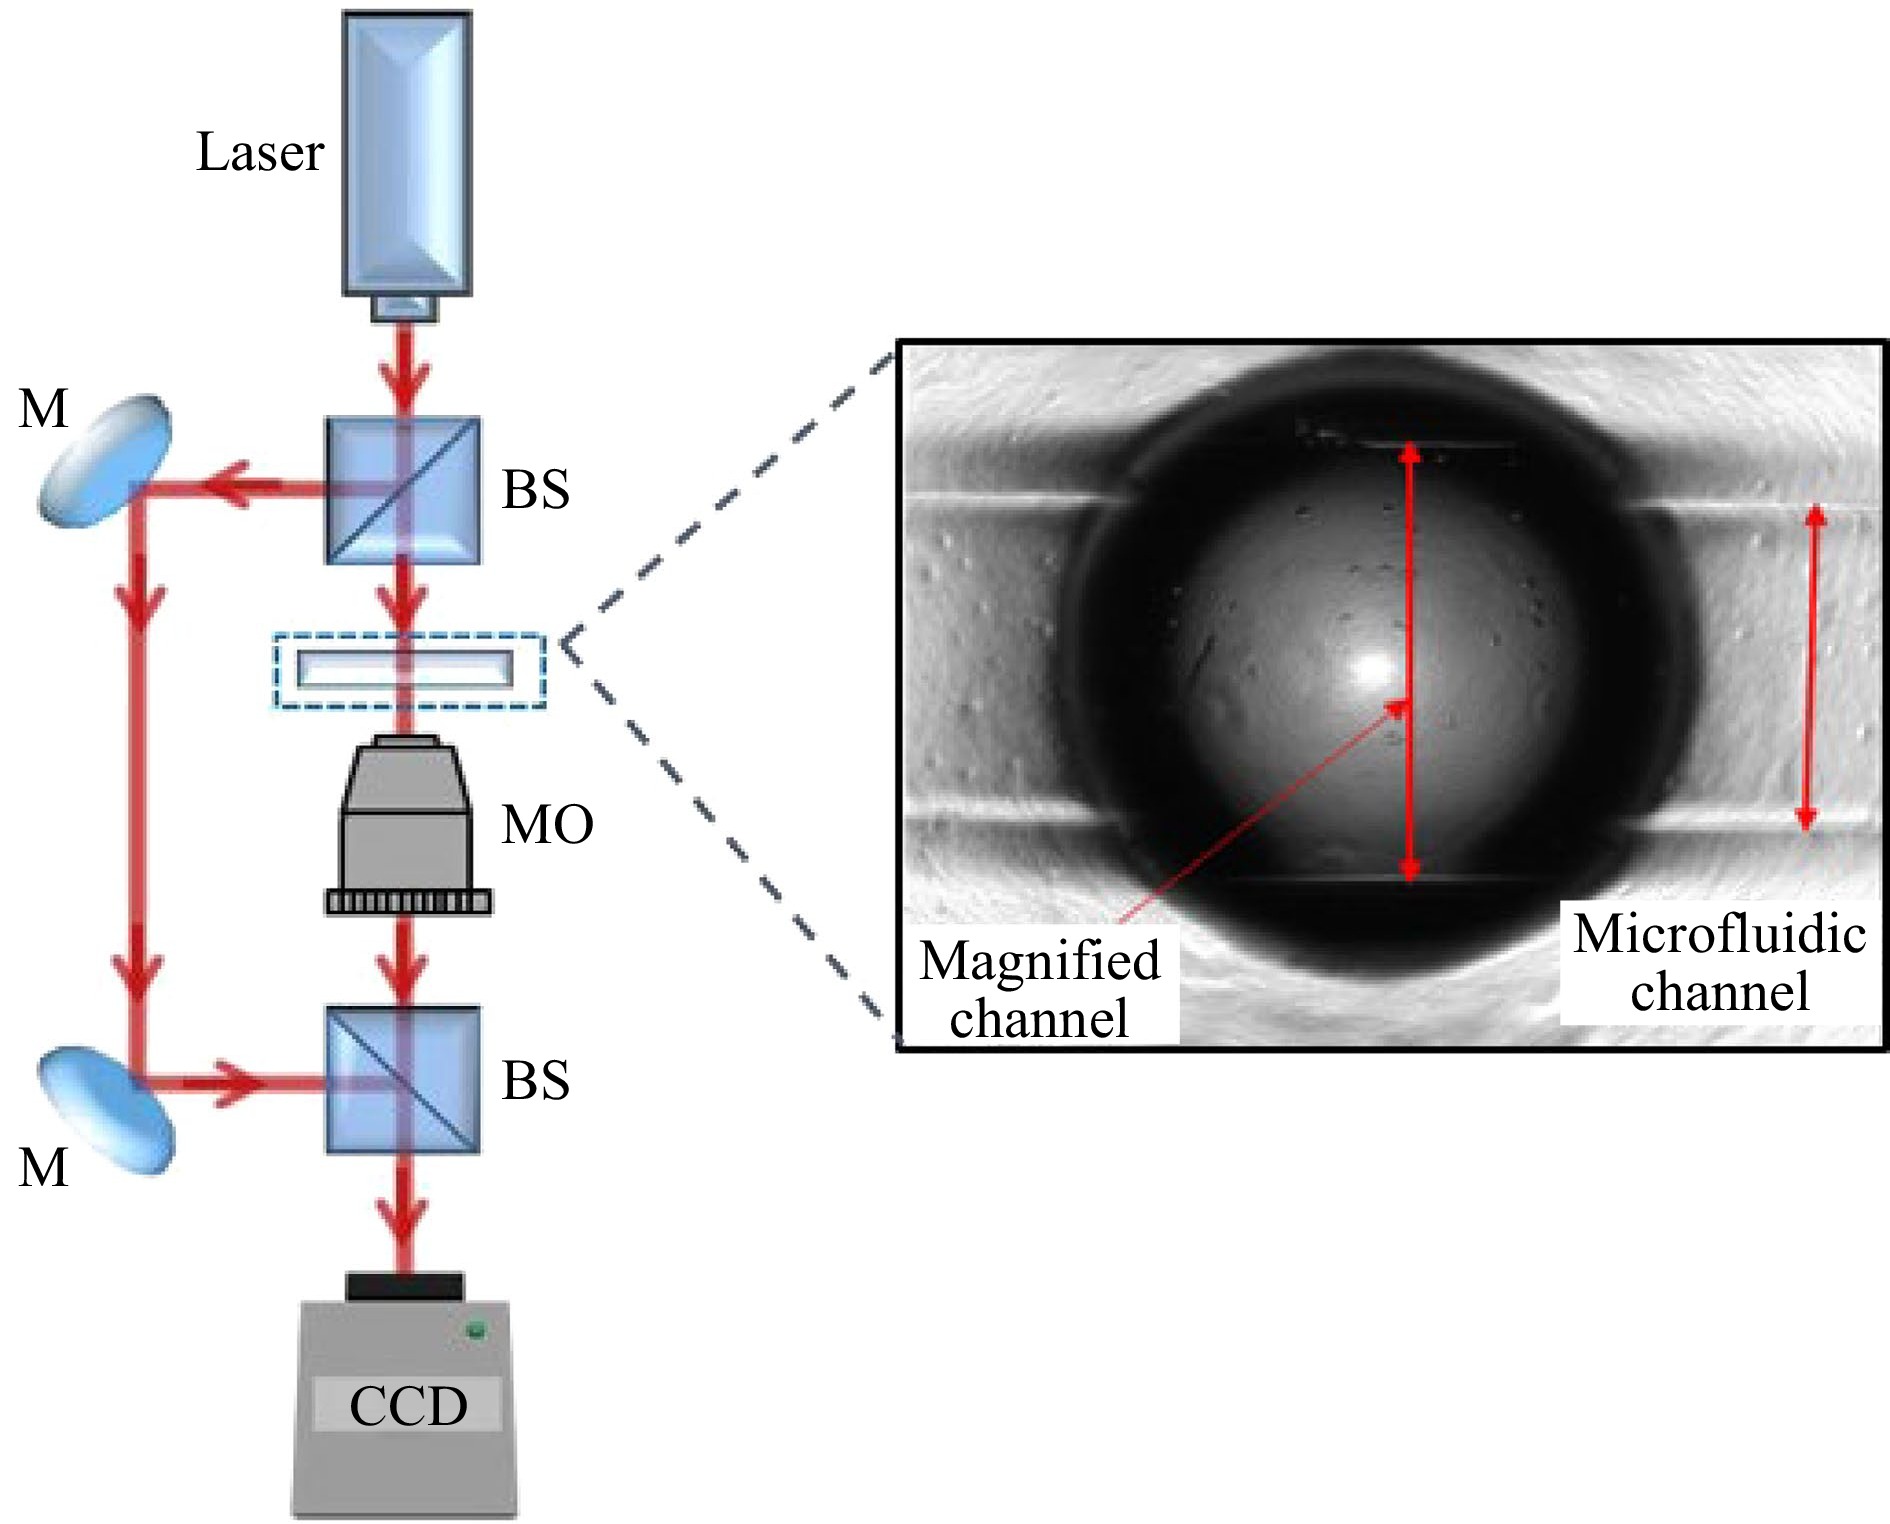
The beam emitted by a continuous-wave (CW) laser with wavelength λ = 632.8 nm is first split into two parts, constituting the reference and the object arm of the interferometer. Both encounter a 5 × microscope objective on their path toward the sensor (a 1024 × 1024 CCD camera with pixel pitch Δx = Δy = 4.4 µm). The object beam is directed toward the microfluidic chip where a sample microlens is deposited and it then recombines to the reference in the acquisition plane to produce an interference pattern. Once the hologram is recorded, numerical propagation provides the object complex field in any plane along the optical axis z, from which the intensity and phase distributions of the optical wavefield transmitted by the sample can be extracted87. A double-exposure method was adopted to compensate for the aberrations of the optical components in the setup, as well as the phase delay introduced owing to the passage of the object beam through the chip. Hence, the recovered phase-contrast map directly yields information on the optical behavior of the lens. The analysis was performed by exploiting the Zernike fitting to evaluate the contributions of the defocus and other aberration terms. The results of the Zernike analysis are shown in Fig. 11.
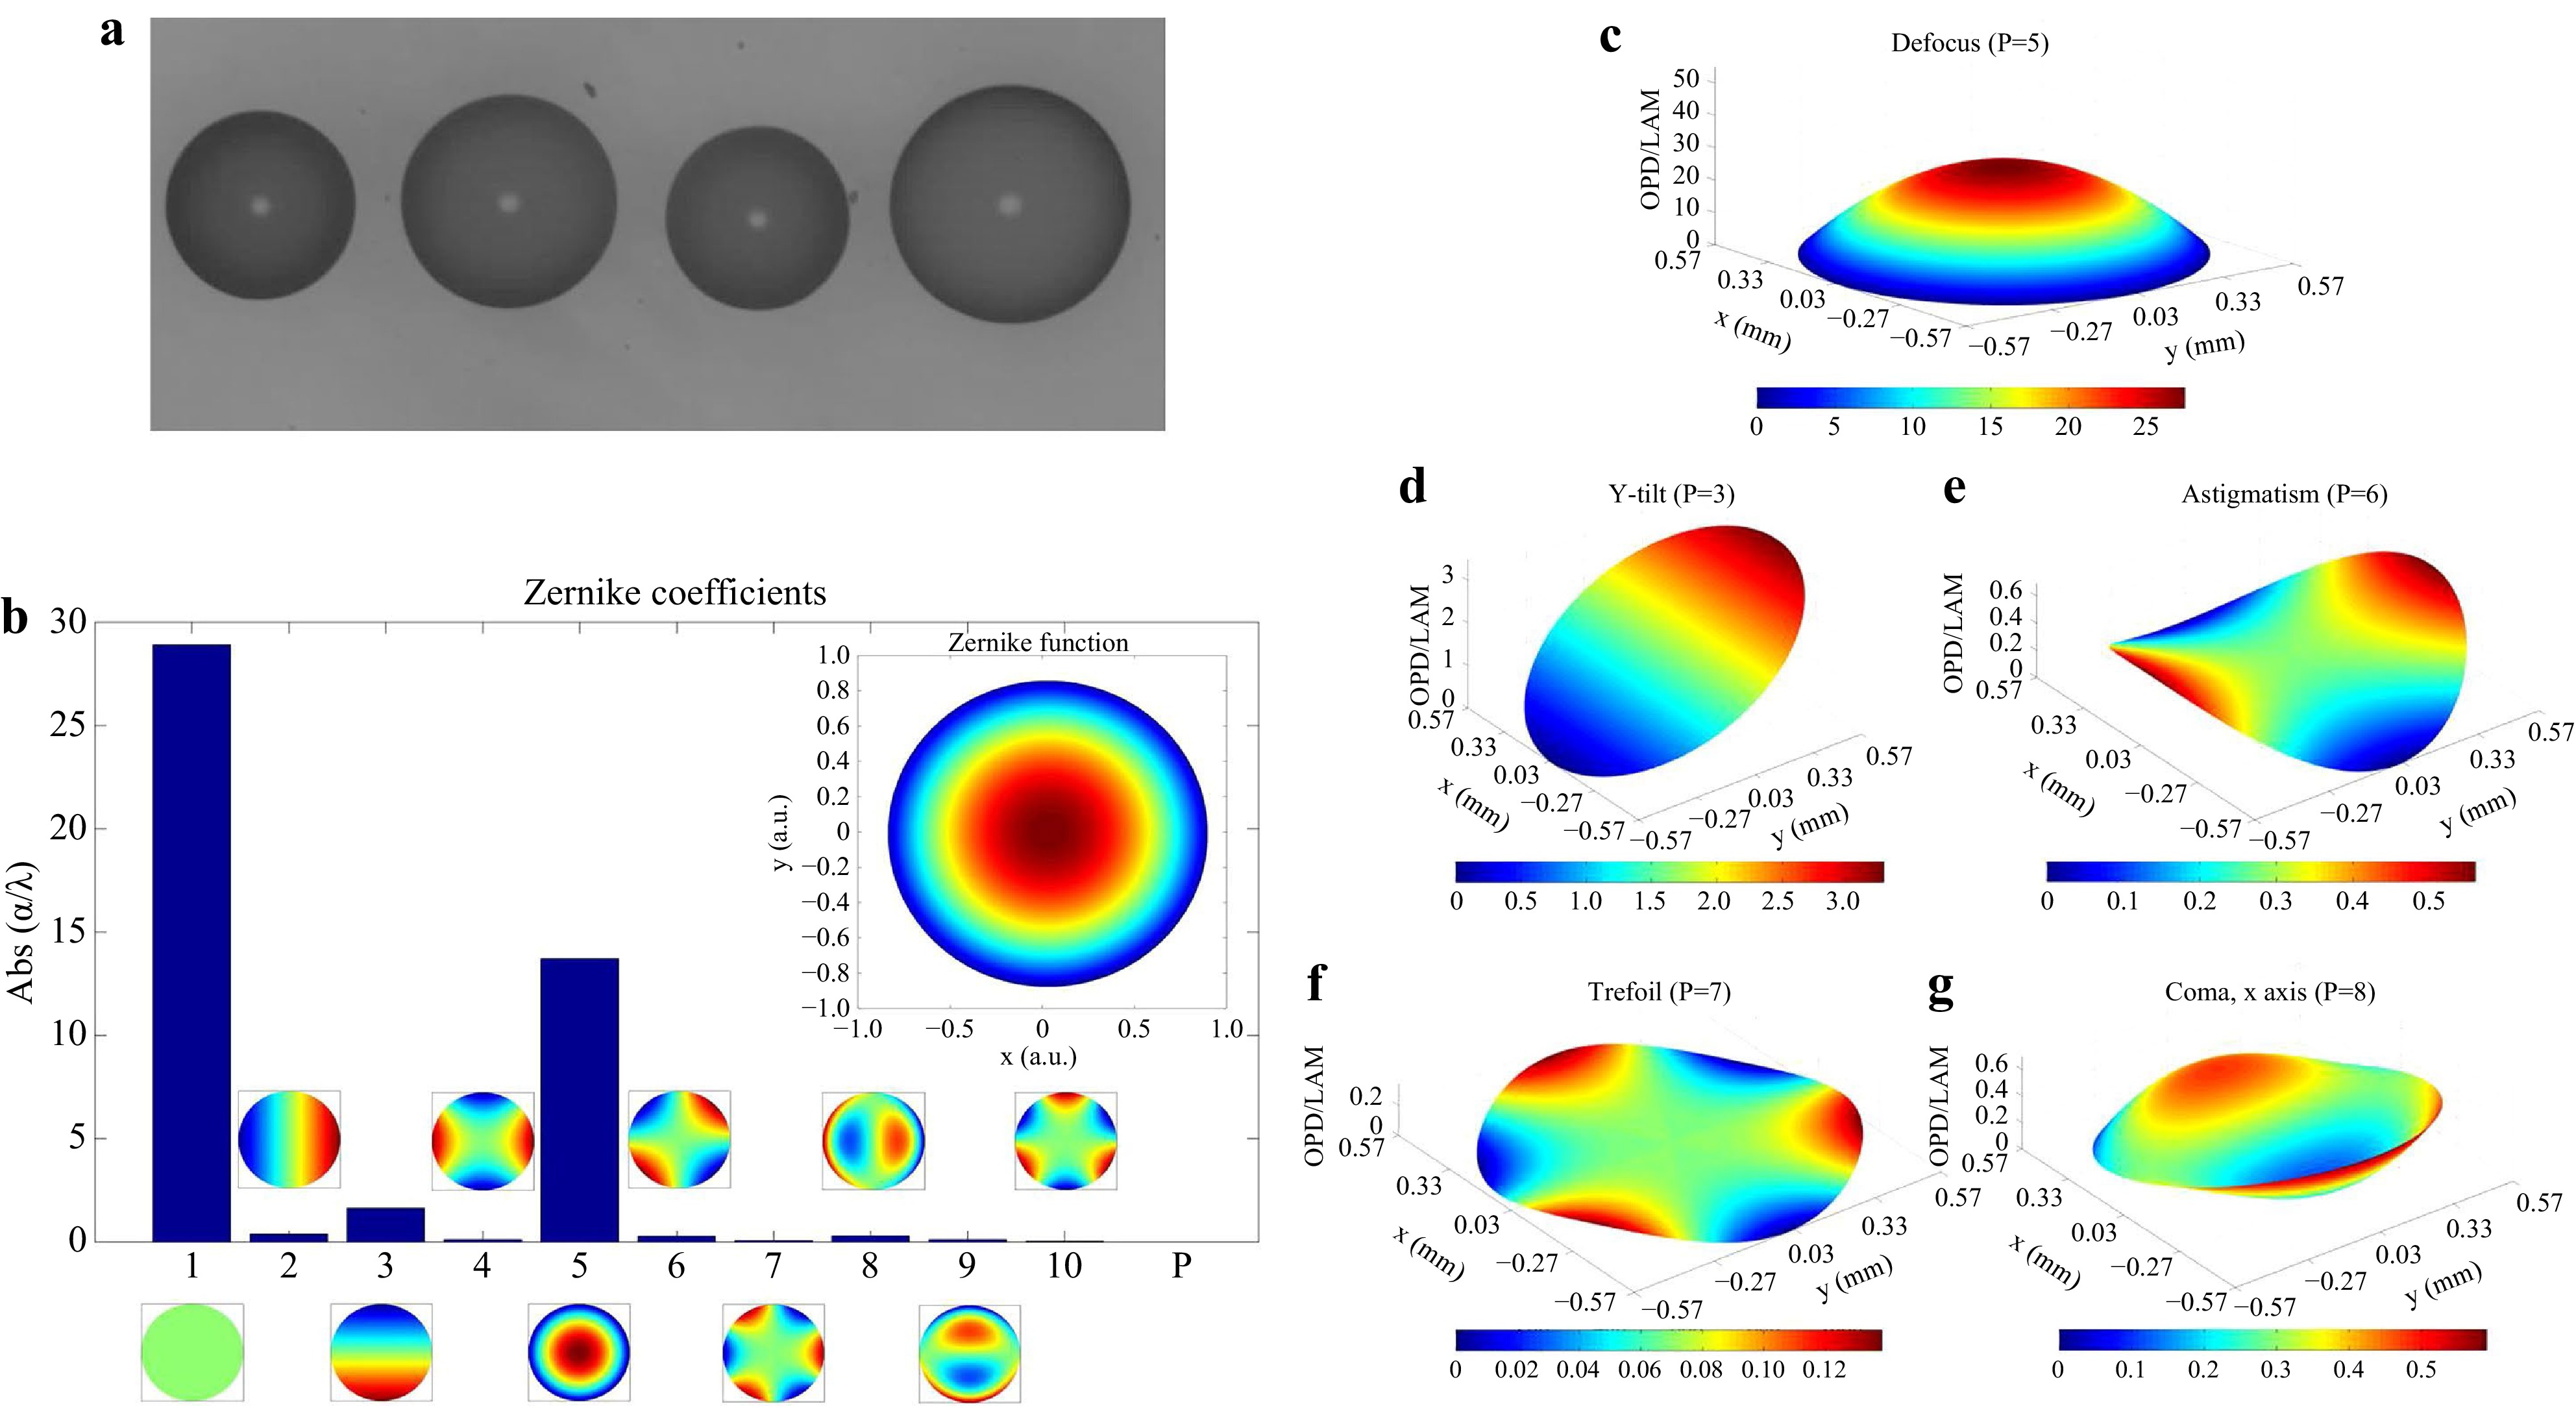
Fig. 11 a Microscope image of polymeric lenses. b Normalized Zernike coefficients derived from the lens phase-contrast map; for each order P, the corresponding Zernike polynomial is shown. Surface distribution of the main Zernike polynomials: c Spherical factor. d Tilt along the y-axis. e Astigmatism. f Trefoil aberration. g Coma aberration, x-axis. Fig. 11 was reproduced from Ref. 85 with permission from the Royal Society of Chemistry.
-
The pyroelectric effect has also been investigated to change the wettability of micro-engineered surfaces. In particular, the wettability of LN crystals is patterned by inducing a pyroelectric effect on the domain-engineered samples. As previously mentioned, this technique enables wettability patterning to be achieved by an electrode-less configuration, in contrast with conventional electro-wetting (EW) experiments. In fact, the surface charges inducing this effect are pyroelectrically generated and spatially modulated by the domain grating. A micro-array of thousands of sessile droplets is obtained on a single chip, and using a DH apparatus, it is possible to characterize such microstructures, demonstrating their optical quality as microlenses.
Wettability patterning at solid surfaces is an important aspect for different applications, such as the self-assembly and alignment of particles, as well as for all integrated microfluidic and optofluidic systems where liquid actuation is fundamental88-91. EW allows the alteration of the wetting properties of a substrate by means of free electrical charges92,93. Among all the application fields, EW has been demonstrated to be a key technology for realizing liquid lenses94, 95. Usually, EW-based experiments require complex electrode geometries to actuate and control the surface wettability. Therefore, the possibility to pattern surface wettability by activating specific properties of the material without using external electrodes is desirable.
In this section, it is shown that by activating the pyroelectric effect in periodically poled LN (PPLN) substrates, it is possible to pattern and control the surface wettability without the need for external electrodes and circuits. This technique can be used to generate an array of sessile droplets according to the reversed domain structure of the PPLN substrate. LN is a rhombohedral crystal that exhibits pyroelectricity at certain condition. The spontaneous polarization,
$ {P}_{S} $ , changes according to$ {P}_{i}={\xi }_{i}\Delta T $ , where$ {\xi }_{i} $ is the pyroelectric coefficient and$ \Delta T $ is the temperature variation. At equilibrium, all$ {P}_{S} $ in the crystal are fully screened by the external screening charge, and no electric field exists96. A temperature change modifies$ {P}_{S} $ , and consequently, such equilibrium is perturbed, causing a lack or excess of surface charge, thus generating a high electric field. The spontaneous polarization of LN was inverted by photolithography and electric field poling to obtain a periodic square array of hexagonal reversed domains. Fig. 12a shows an image of the PPLN crystal. Fig. 12b shows a schematic of the patterning effect induced by the temperature change. A thin layer of an oily substance was spread onto the crystal surface. The sample was made of a crystal substrate, and the oil film was heated and then cooled down, the whole explored range of temperatures is from 25 to 100 °C97. All the reported results were obtained using carboxylic acid (pentanoic acid - C5H10O2) as the oily substance spread onto the z-cut LiNbO3 substrates. The liquid film experienced only a smooth shape modification during heating, with the liquid-air interface exhibiting a wave-like (WLR) profile following the geometry of the domain array (top of Fig. 12b). Conversely, pronounced wettability patterning is observed during cooling, which is called the separated lens regime (SLR), as shown in the bottom part of Fig. 12b, when the liquid film starts to break in different regions, forming isolated sessile droplets. The final result consists of an array of sessile droplets that follow the geometry of the PPLN domain structure (see the bottom part of Fig. 12d).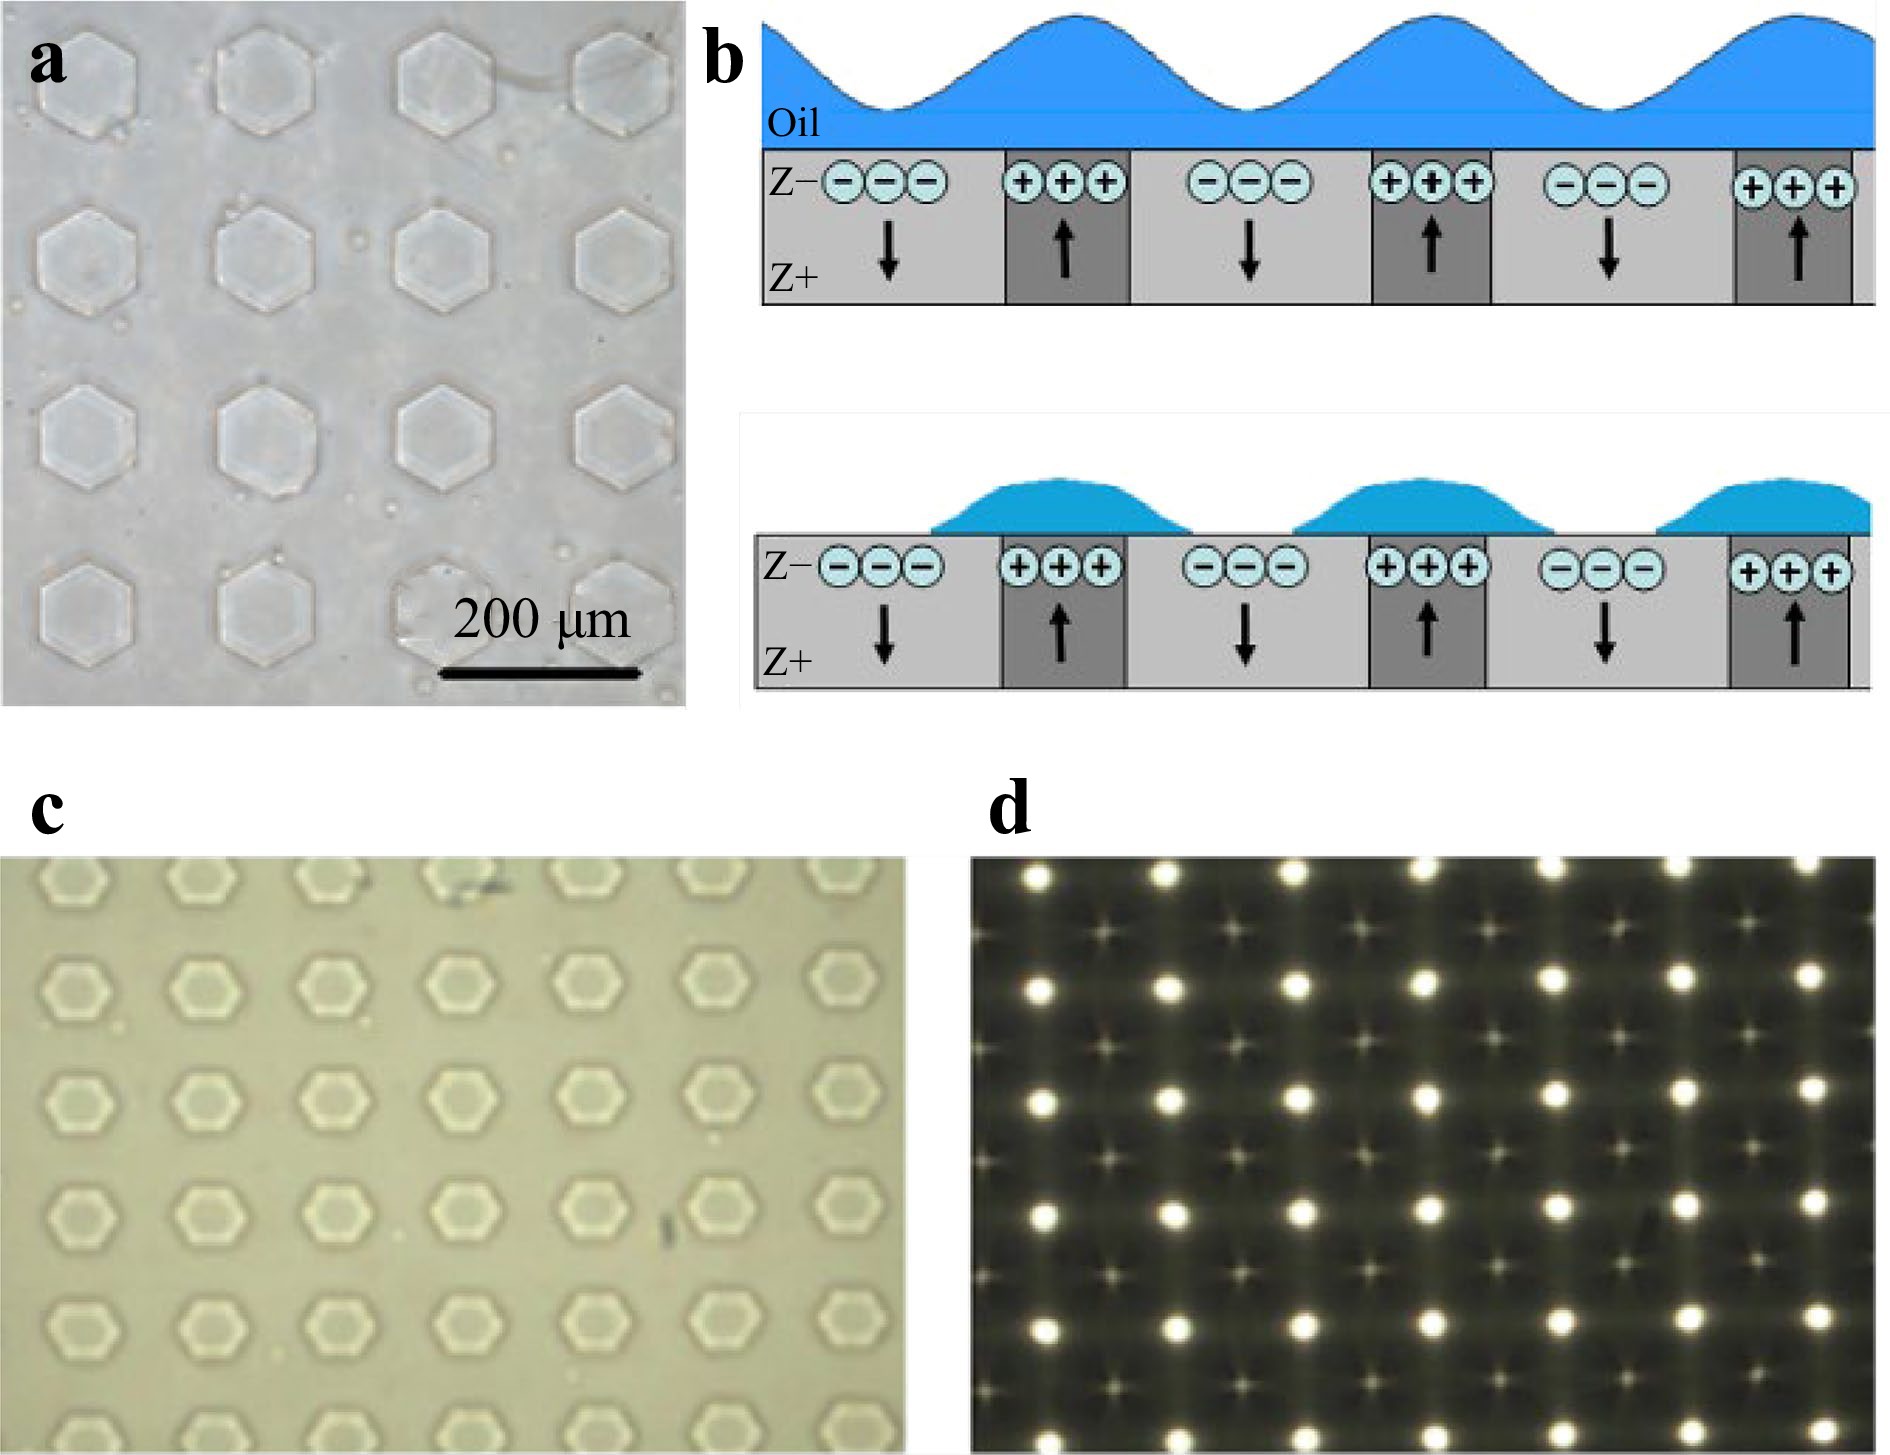
Fig. 12 a Optical microscope image of a typical PPLN with a square array of hexagonal reversed domains; b schematic views of the sample cross-section corresponding to the wave-like lens regime and to the separated lens regime of the micro-lens array, respectively. The black arrows indicate the orientation of the spontaneous polarization. c and d two corresponding images of a PPLN sample before and after the liquid reshaping on the surface, respectively. Sessile drops are present corresponding to each hexagon. Reprinted with permission from Refs. 98, 99 © The Optical Society.
Both regimes, i.e., WLR and SLR, were investigated using a DH microscope set-up to characterize the focusing behavior and optical aberrations of the microlenses. Fig. 13a shows a schematic view of the interferometric apparatus used for the measurements based on the Mach-Zehnder interferometer. The calculated wrapped phase map of the lens microarray is shown in Fig. 13b, and after applying an unwrapping algorithm, the continuous-phase image for the microlens array is retrieved, as shown in Fig. 13c.
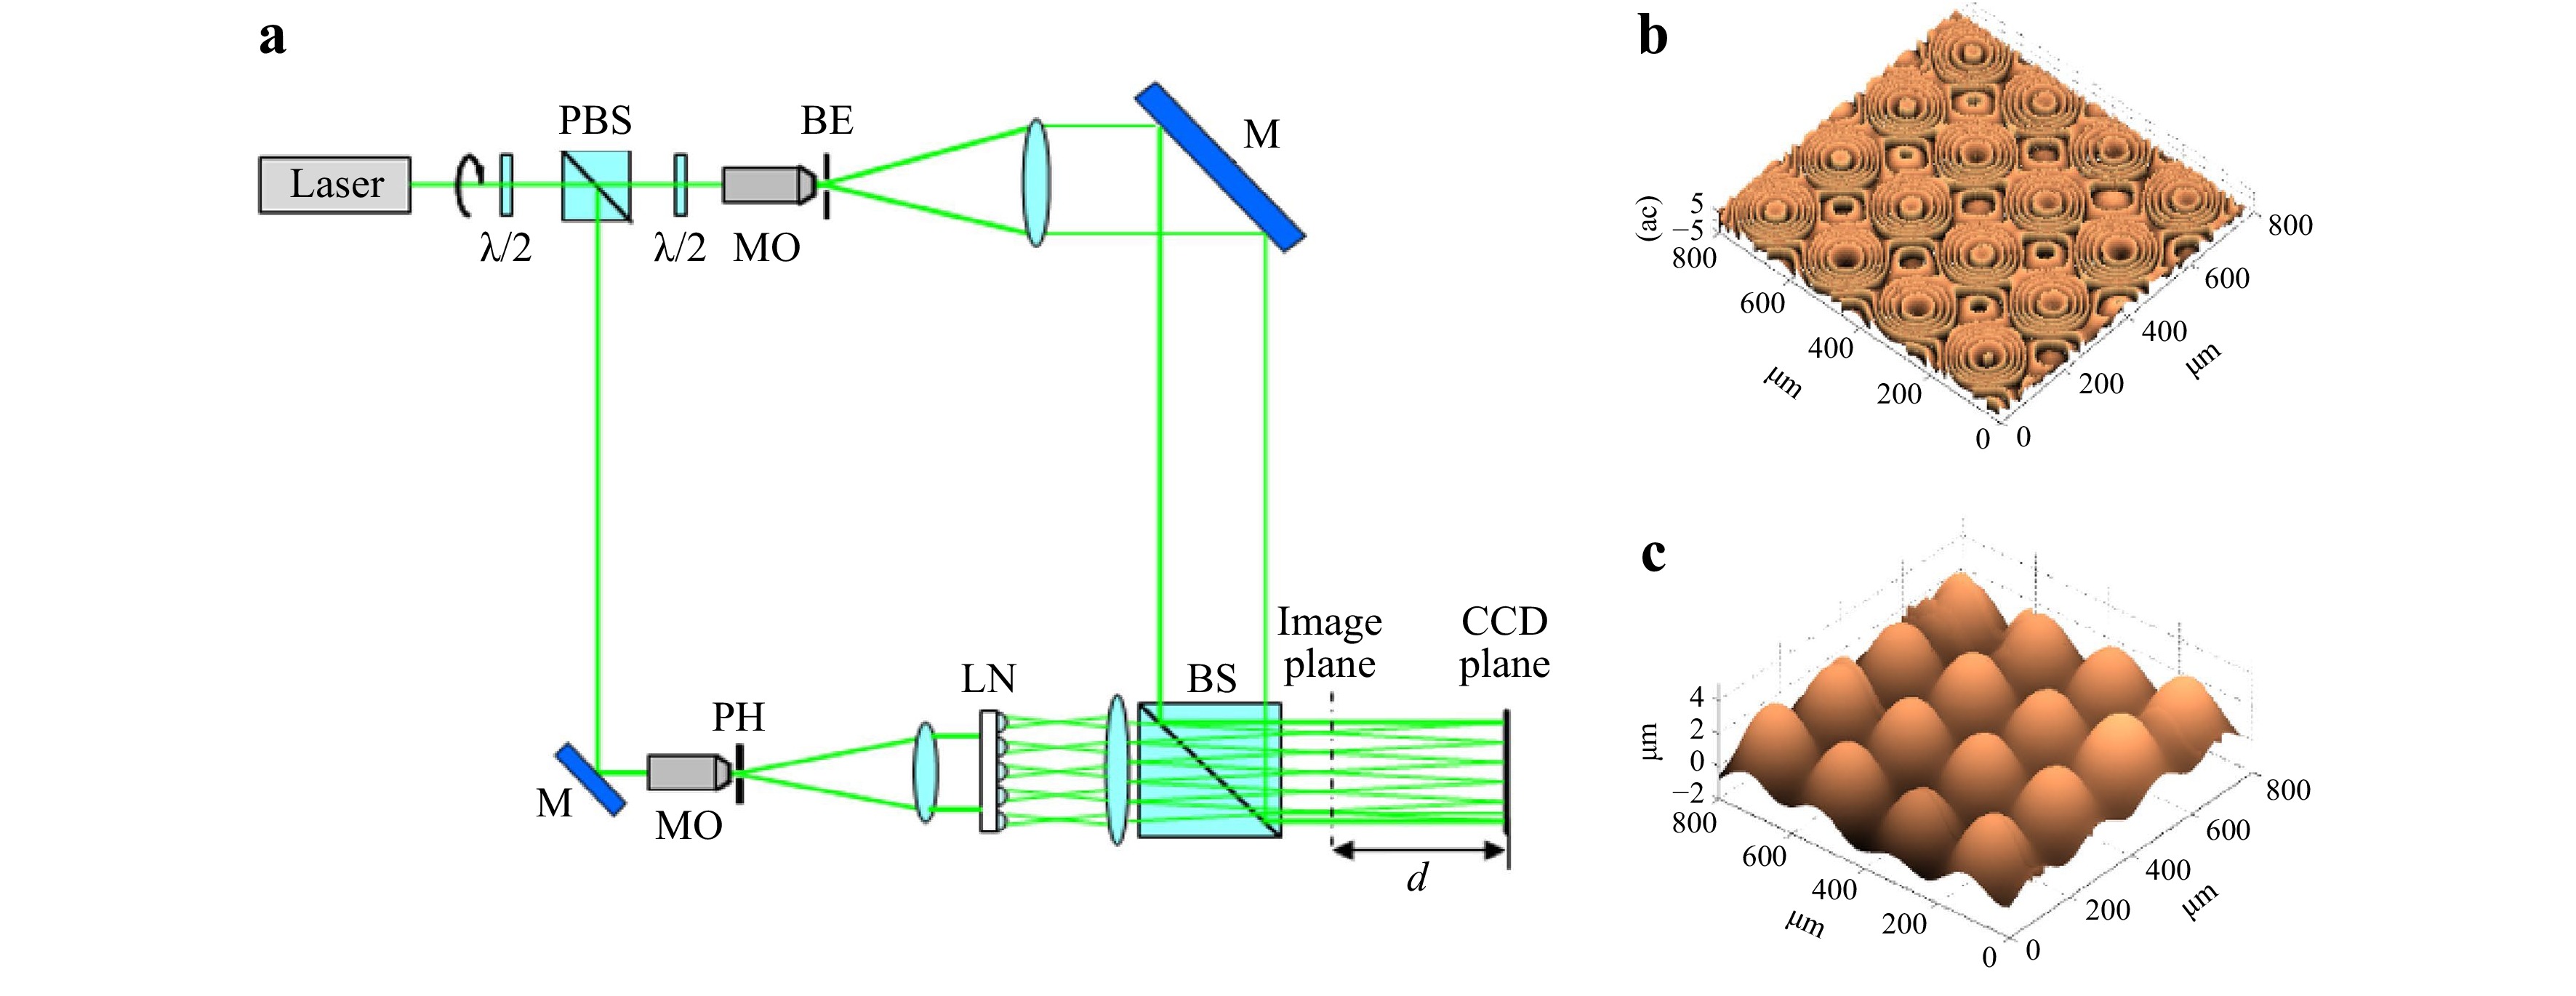
Fig. 13 Holographic liquid microlenses characterizing. Optical geometry is shown in a. Two-dimensional representation of b the wrapped and c the unwrapped phase map corresponding to the 4 × 4 liquid microlens array. Reprinted with permission from Ref. 99 © The Optical Society.
The temperature of the thermo-controlled plate under the sample was varied at a rate of 10 °C/min, and it was controlled with an accuracy of 0.1 °C. Interferometric characterization was performed by registering the temperature value for each digital hologram captured during thermal treatment. Two different types of analyses were carried out to evaluate the temperature dependence of the focal length and optical aberrations of the lenses, thus characterizing both the tunability and optical performance of the device. The temperature dependence of the focal length was independently investigated during the cooling and heating treatments. The aberrations of the lenses were evaluated through a deeper analysis of the wavefronts transmitted by the lenses themselves, and this was done by exploiting the Zernike fitting98-101.
The wrapped phase maps exhibit different behaviors in the case of heating and cooling. When the temperature increases, oil shaping occurs only up to a temperature value of approximately 65 °C, and consequently, the number of fringes increases. After this temperature, the lens shape stabilized. Conversely, during the cooling process, the number of fringes increased during the whole process. An unwrapping numerical procedure was applied to phase mode 2π to measure the real phase distribution of the wavefront. Subsequently, a one-dimensional (1D) fitting procedure was performed to evaluate the focal length of each microlens in the array. Fig. 14a, b show the experimental and fitted profiles of the unwrapped phase corresponding to the two different processes. The focal length trend vs. temperature variation is reported in Fig. 14c, d for both the heating and cooling experiments.
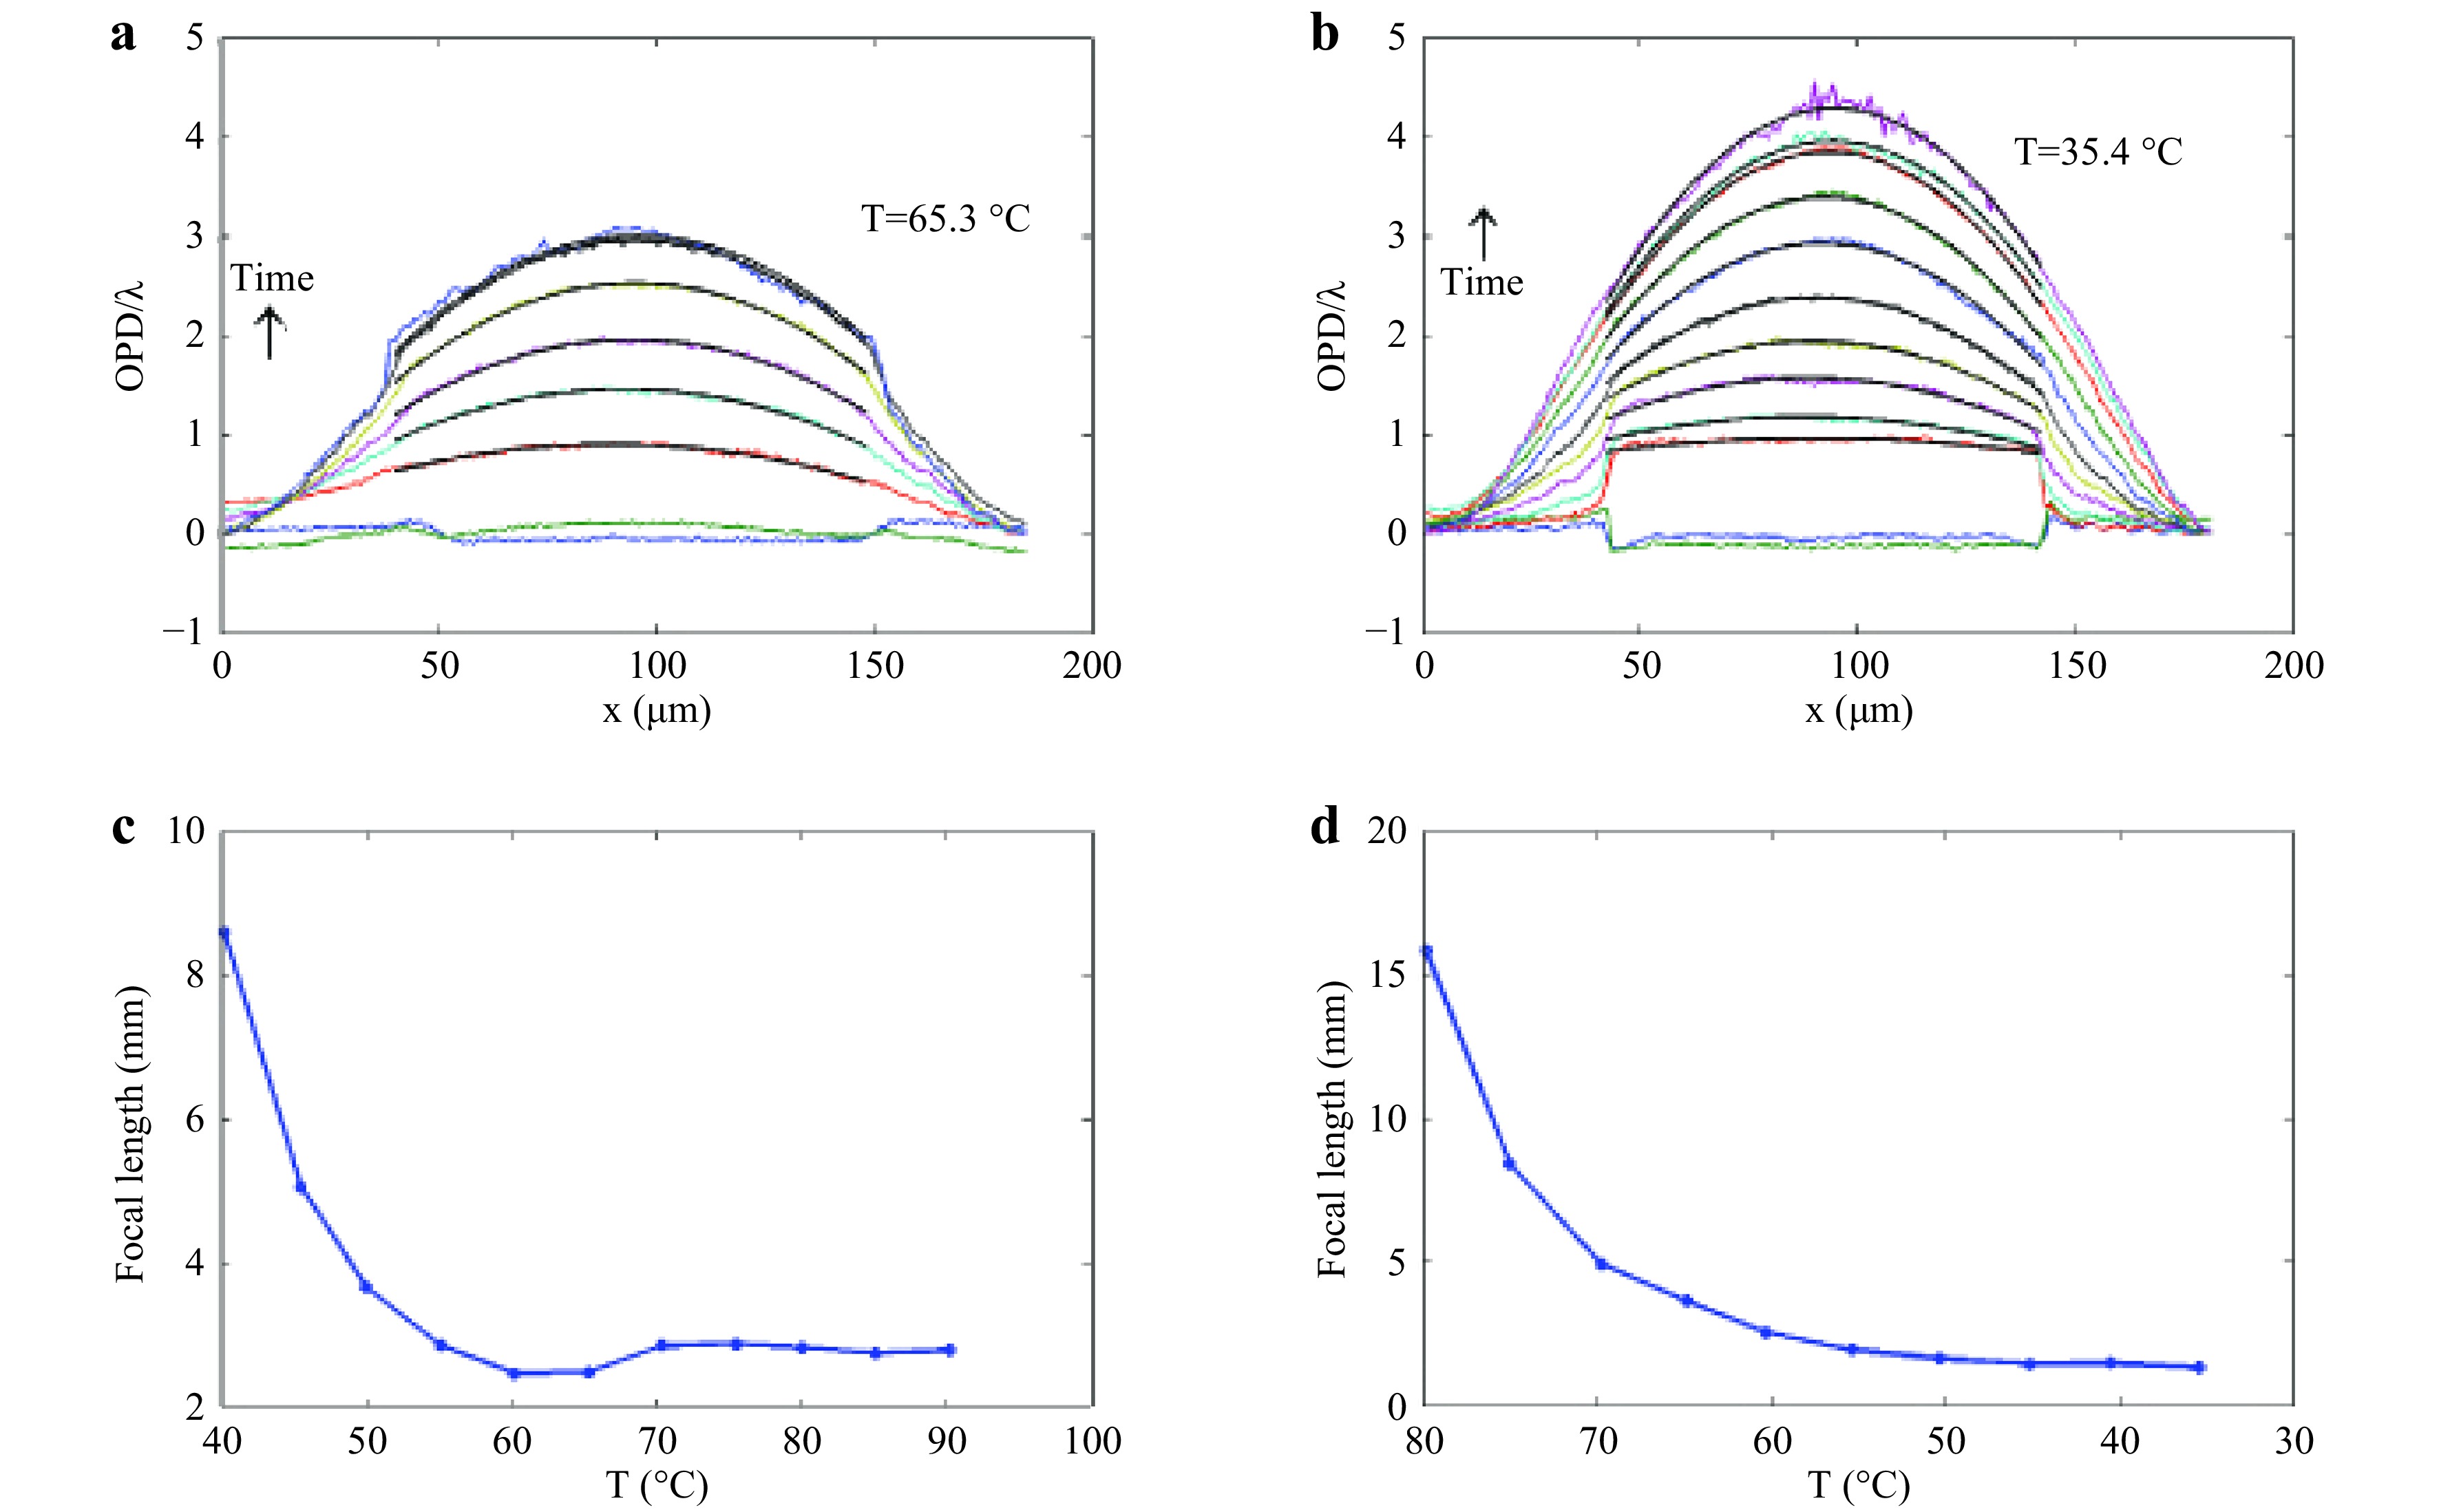
Fig. 14 Experimental and fitted profiles of the unwrapped phase distribution corresponding to a the heating and b cooling process; c, d focal length variation as a function of temperature in case of the heating and the cooling process. Reprinted with permission from Ref. 99 © The Optical Society.
The optical behaviors of the microlenses were also characterized in terms of optical aberrations by applying a 2D fitting algorithm to digital holograms of a 4 × 4 lens array acquired during stationary conditions, that is, when the number of fringes is stable in the wrapped phase distribution, while the fitting procedure was performed for each lens of the array and for lenses of several arrays at different time instants. The function used for the fitting process is a linear combination of Zernike polynomials by considering the coefficients for the tilt, astigmatism, defocus, and third-order spherical aberration terms. The coma and higher-order coefficients were neglected because some orders of magnitude were minor.
Fig. 15 shows the surface distribution of each polynomial employed for Zernike fitting, and it enables us to visually compare the focus term with the other terms that describe the wavefront curvature. The main term is the defocus term, which allows the state of the quality of such a microstructure, and the spherical aberration term has a quite high value because the curvature changes from convex to concave between two adjacent microlenses.
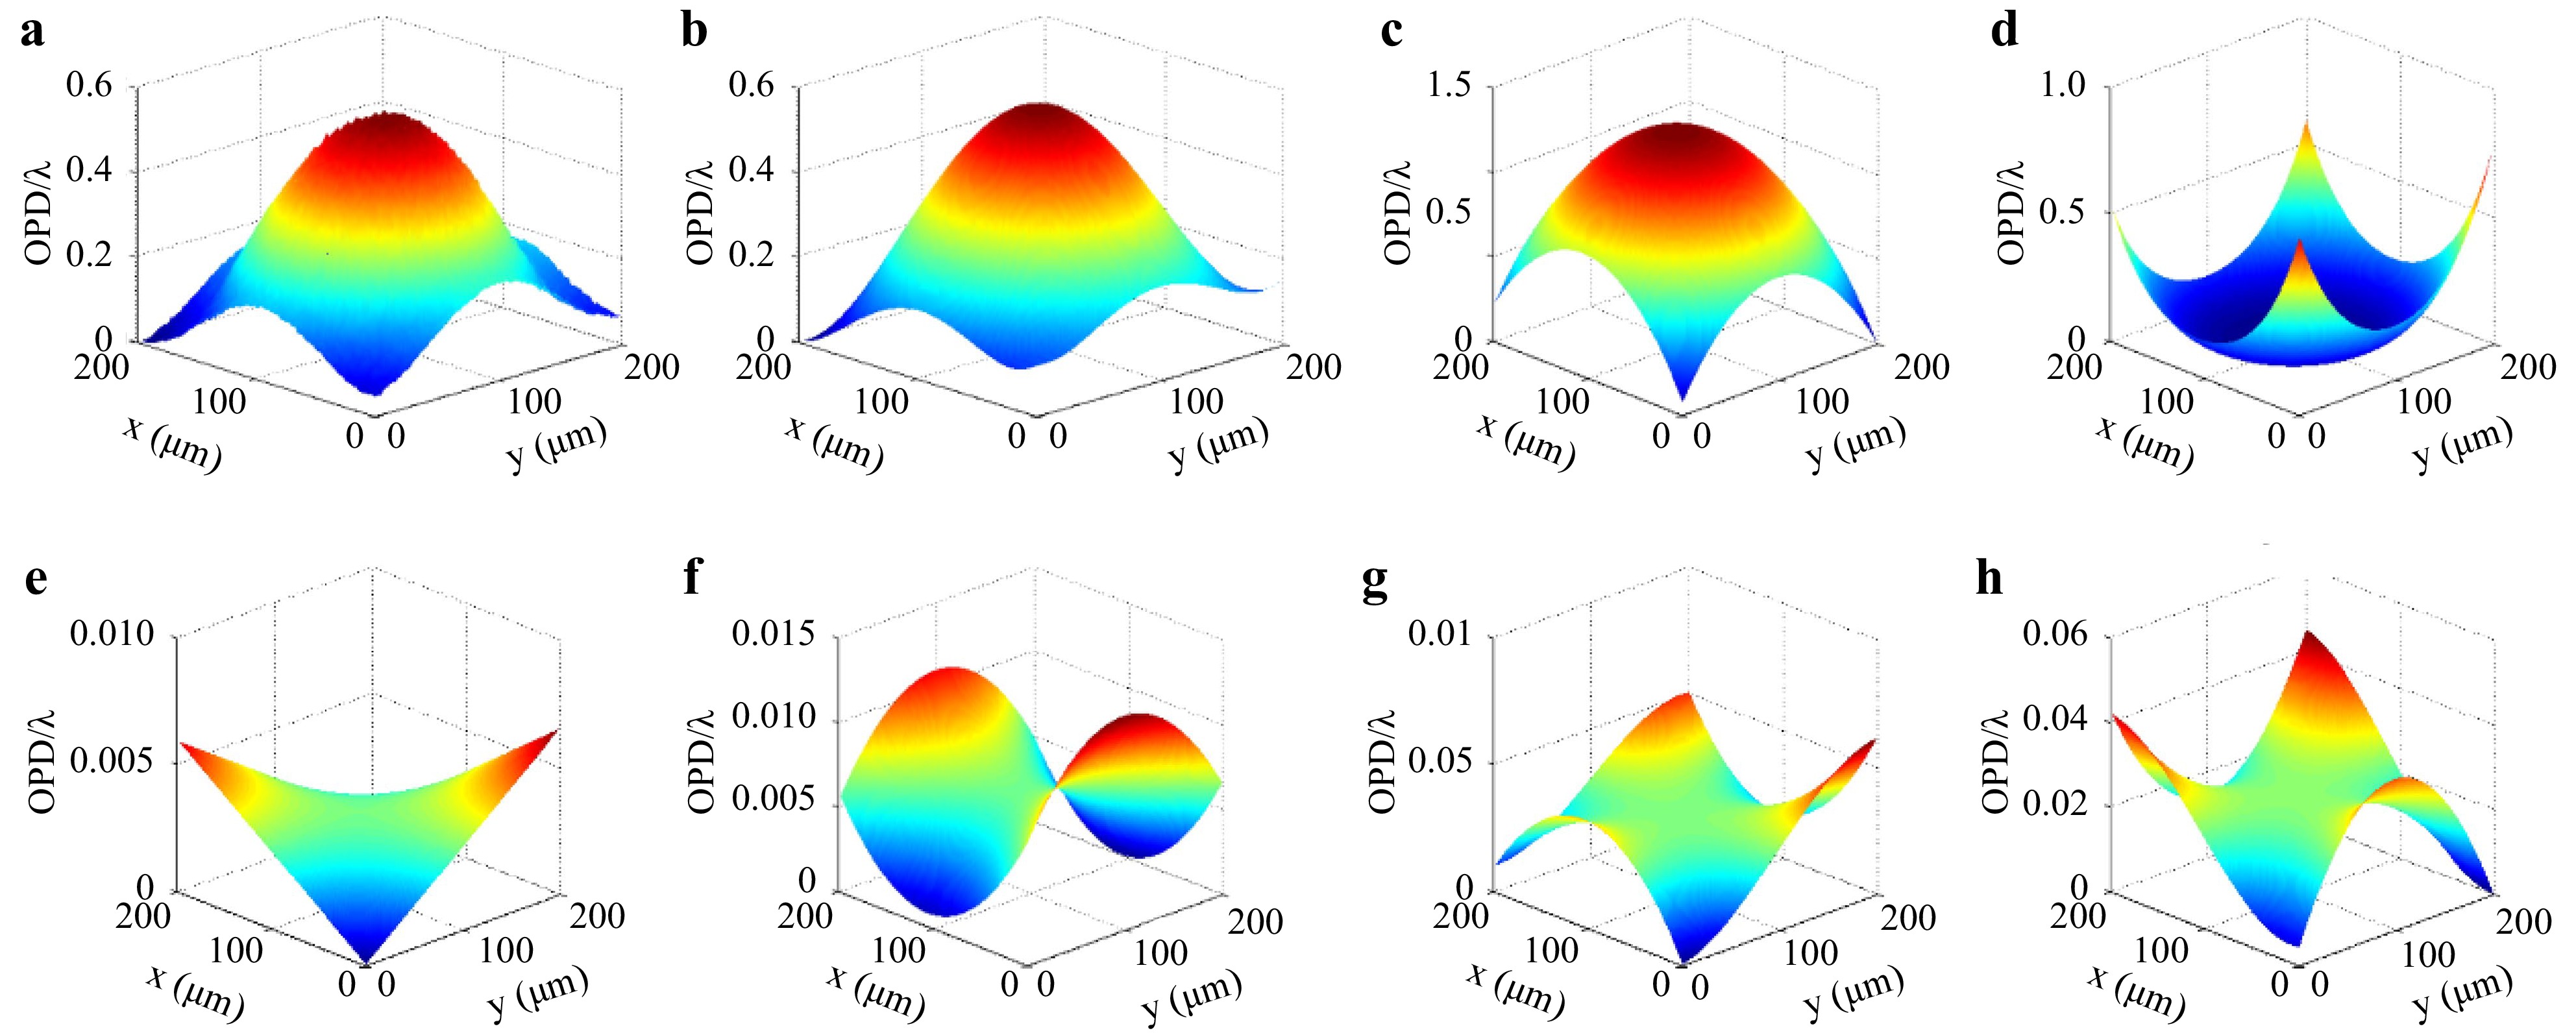
Fig. 15 a Measured phase distribution and b corresponding Zernike fitted surface; c surface distribution of the focus term, d the third order spherical aberration, e the astigmatism at 45° term, f the astigmatism at 90°, g the triangular astigmatism on the x base, h the triangular astigmatism on the y base. Reprinted with permission from Ref. 99 © The Optical Society.
-
DH can be used to characterize microfluidic structures. In fact, the direct printing previously described could be implemented for the fabrication of high-resolution microchannels with transversal sizes ranging from several hundreds of nanometers to hundreds of microns76. The printing resolution that has been demonstrated is well below the resolution limit of standard methods, even in the case of processing biocompatible and biodegradable materials, so the final devices are useful candidates for biological analysis because of their intrinsic absence of toxicity and immunogenicity (Fig. 16a, b). In the case of a straight channel (length 1.5 cm and diameter limited to approximately 2 μm), interferometric characterization based on DH microscopy was carried out to evaluate the morphology and quality of the footpath finish, as shown in Fig. 16c. The cross-section of the channel is cylindrical, showing the 3D core of the pyro-electrospun microfiber.
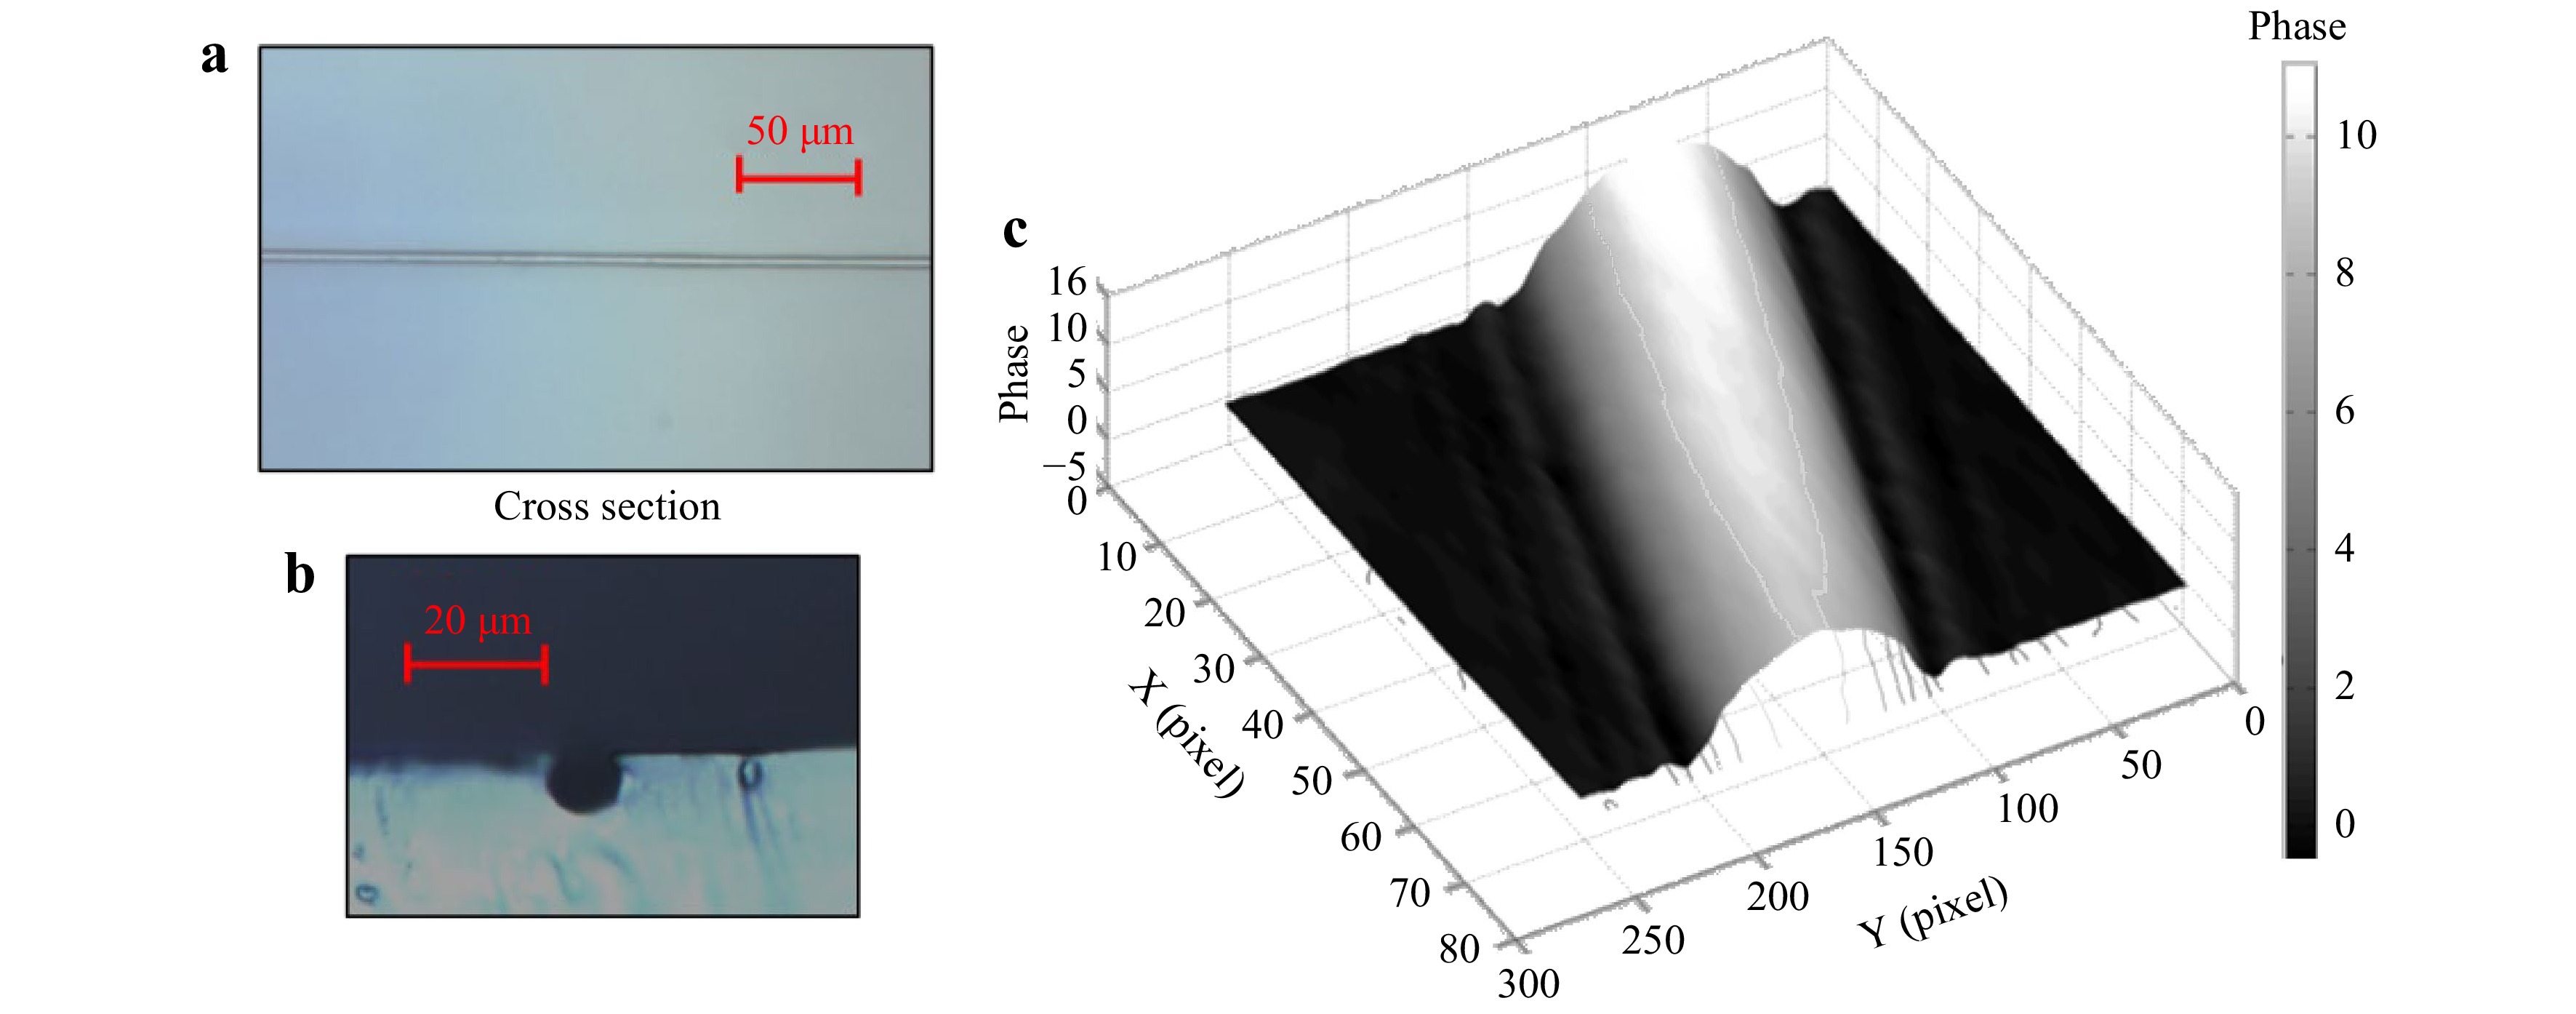
Fig. 16 a Top view of the PDMS device demonstrating the good control of direct printing of a single 3D printed footpath. b The channel cross-section is displayed by side view imaging and c characterized by digital holography. Adapted with permission from Ref. 102 Copyright 2021 American Chemical Society.
-
Currently, the field of artificial biological tissues represents an area of much research interest, and applications range from artificial skin to liver lobules. Similar to the way that a complete LEGO set is made up of bricks, artificial biological tissues can be assembled on the cellular micro-scaffolds. These micro/nanoscale scaffolds are the navigators of cell growth; they can guide the cells’ behavior by their spatially heterogeneous architecture, and further influence the functional expression of the engineered tissues directly103. Researchers have developed different micro/nano scaffold fabrication methods to advance techniques used when manufacturing different artificial tissues104-106. The possibility of monitoring in real-time and in situ high-resolution fabrication processes through accurate characterization remains a significant challenge. Recently, a closed-loop control system for the fabrication of high-fidelity micro-scaffolds was proposed107. A combination of digital light processing (DLP) and digital holographic microscopy (DHM) has been used to precisely manufacture cell-encapsulated hydrogel micro-scaffolds under real-time monitoring. Poly(ethylene glycol) diacrylate (PEGDA) and gelatin methacrylate (GelMA) hydrogels were used as experimental materials to fabricate micro-scaffolds using the DLP system. Meanwhile, the 3D imaging capability of DH provided support for the quantitative monitoring of liquid-solid conversion by ultraviolet (UV) light. Fig. 17a shows the proposed set-up used for the holographic feedback-based photocuring system. Herein, DLP guided the fabrication of hydrogels under UV light, while DHM furnished quantitative observation of the forming material. The UV beam, which is modulated by a digital micro-mirror device (DMD), illuminated the hydrogel in a designed manner. Meanwhile, the hydrogel was processed by the UV beam, and it was also irradiated by the laser beam from the DH setup. The object beam carrying its information interferes with the reference beam on the camera screen to form a digitally recorded hologram.
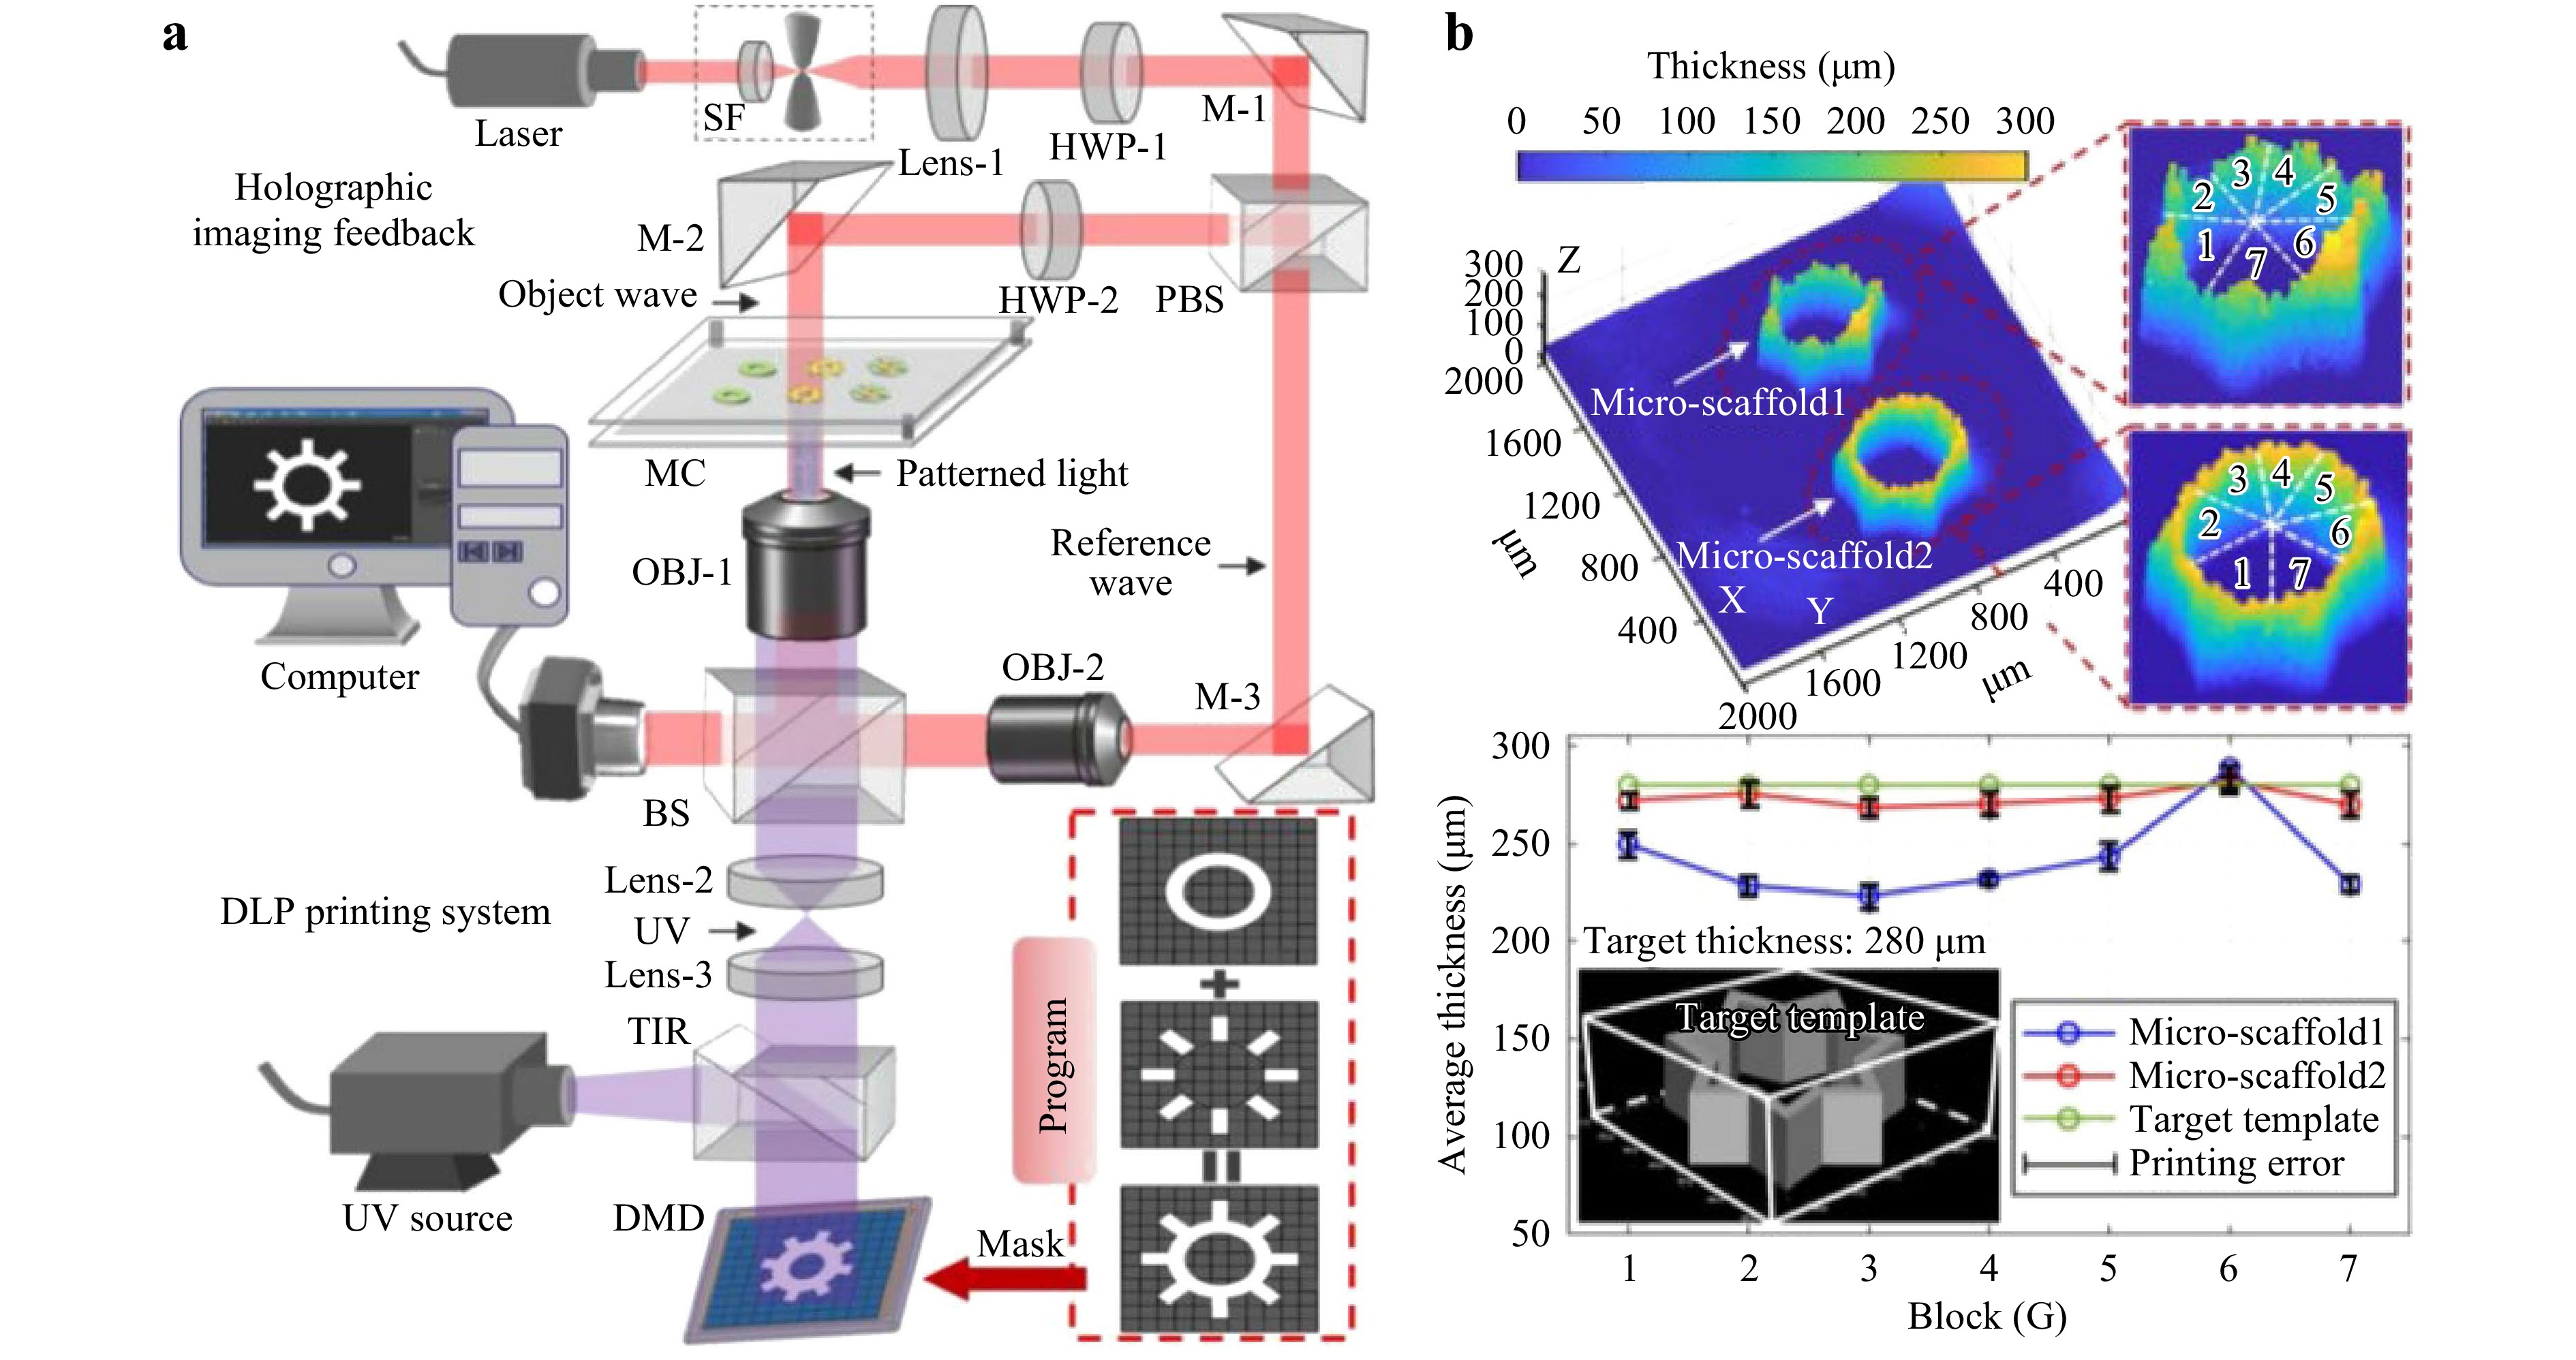
Fig. 17 Closed-loop control fabrication system and experimental results for hydrogel micro-scaffolds. a Optical setup. b Digital holographic reconstruction results of 3D polygonal micro-scaffold. © [2021] IEEE. Reprinted, with permission, from Ref. 107.
The experimental results are shown in Fig. 17b. To verify the calibration capability of the DH for the fabrication process, comparative experiments were conducted. Herein, the first micro-scaffold (test 1) was fabricated using the DLP printing system without DH monitoring, whereas the second micro-scaffold (test 2) was fabricated under the feedback control of the DHM. Each micro-scaffold was divided into seven blocks by dashed lines to fit the average thickness of each block. The expected thickness of the fabrication template was 280 μm, as indicated by the green line in the plot. Comparing the results, micro-scaffold 2 exhibited smoother surface topography. In general, the fluctuation range of the fitted curve for micro-scaffold 1 was 65.4 μm, which was larger than the fluctuation range obtained for micro-scaffold 2, which was 12.7 μm. From the cross-sectional view, it can be more clearly observed that DHM played a key role in improving the manufacturing accuracy and stability of the DLP system. Using the same approach, the relationship between the Young’s modulus and exposure duration was investigated. The above experimental results effectively prove the positive effect of DHM on hydrogel micro-scaffold fabrication for constructing a heterogeneous architecture inside a single integrated micro-scaffold. The use of DHM as a closed-loop control method to improve the fabrication accuracy will be an important topic in the near future, especially for the processing of biological materials. The organic combination of transmissive, micron-level, real-time, and 3D imaging in DHM is expected to lead to the development of a good tool for the fast and high-precision fabrication of artificial biological tissues.
-
The increase in miniaturization from medical engineering to consumer electronics requires the development of advanced fabrication methods. Recently, 3D printing was proposed for the fabrication of micro-optics and miniaturization of spectroscopic compact and integrated measurement systems108. However, among the existing manufacturing methods, 3D lithography by two-photon polymerization shows intriguing functionalities for printing complex 3D structures of different geometries, including curvilinear features, with a submicrometer resolution109. Recently, there has been increased attention on the characterization of samples fabricated by such technology. In fact, it is challenging to address specific goals for two-photon lithography and even more useful manufacturing approaches, such as the non-destructive online monitoring of photoinduced polymerization. Holographic monitoring of photopolymerization dynamics has recently been demonstrated by characterizing the evolution of the photoresist RI during the photopolymerization process110, 111, please see Fig. 18.
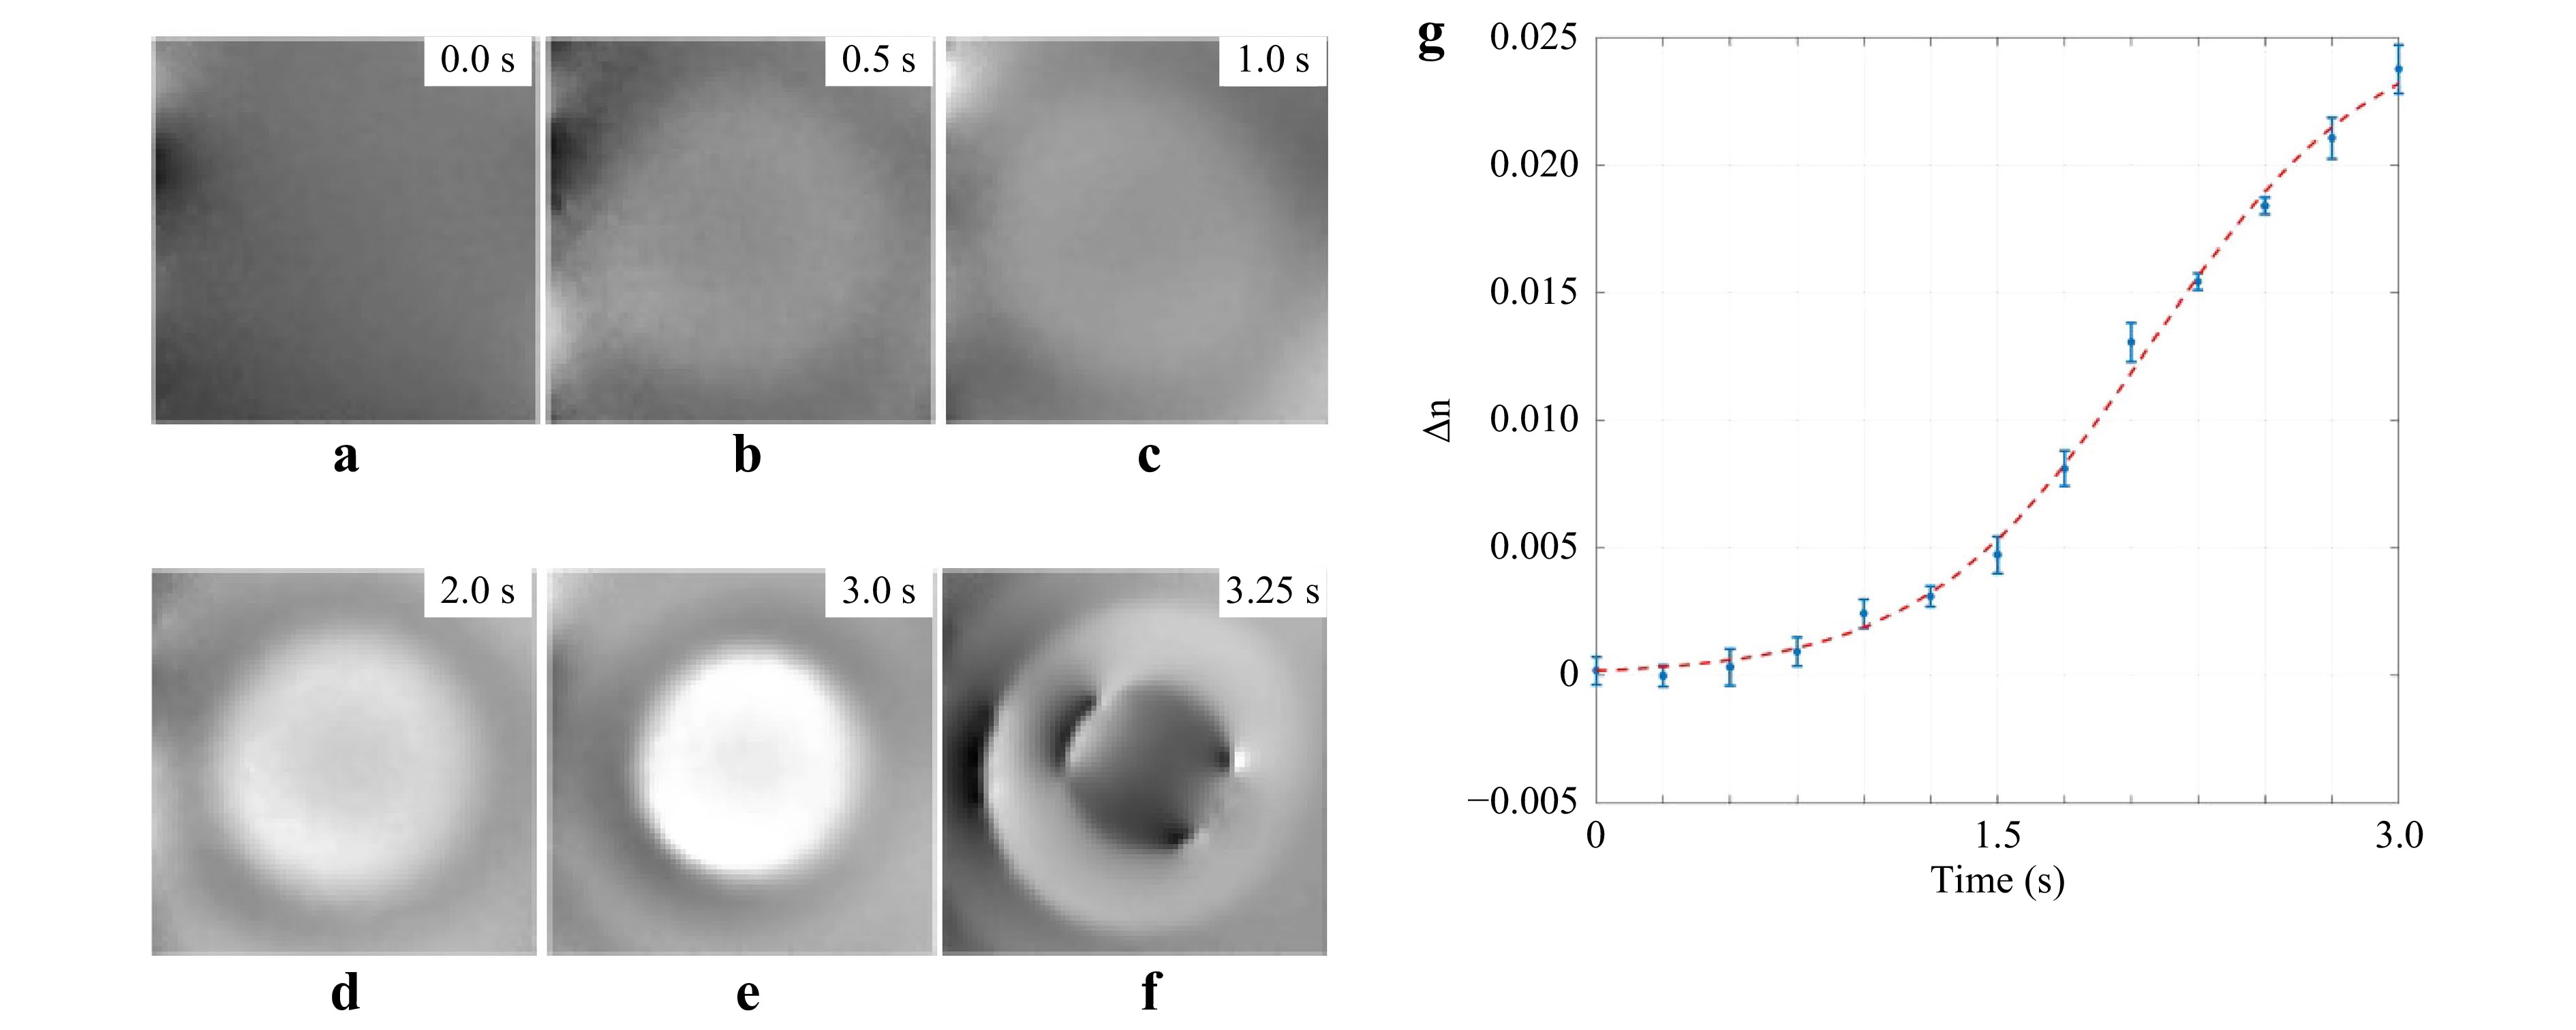
Fig. 18 Online holographic monitoring of the refractive index evolution: phase maps corresponding to a the initial state of the sample before the exposure started, and exposure times of b 0.5 s, c 1.0 s, d 2.0 s, e 3.0 s. f Explosion of the polymer after illumination for 3.0 s. All figures represent the same area of 400 × 400 pixels. g Change in the material’s refractive index Δn during the photoinduced polymerization. Red dashed line represents the fitting curve for the experimental data with error bars. Adapted with permission from Ref. 110 © The Optical Society.
-
Complex surface relief patterns can be manufactured by the light-induced surface structuring of azobenzene-containing films. Such relief patterns, which have different heights and topography patterns, are difficult to achieve using conventional lithography systems, and understanding their formation dynamics and response to different types of light irradiation is still an open task. Recently, DH has been explored to investigate the manufacturing processes. In particular, significant results have been reported on the potential for the development of holographic tools that can write the desired surface relief grating (SRG) structures, and furnish the quasi real-time and in-situ monitoring of the process. In one configuration, a Lloyds interferometer was used to create the SRG pattern, while a DH microscope, working with a He-Ne laser emitting at 632.8 nm, was used to monitor its formation and dynamic evolution112. In a more recent paper, the interference pattern for SRG writing was monitored using a DHM operating with a 488-nm light input and a polarization-maintaining fiber113. The results reported in this paper prove that DH can provide an optimal measuring instrument for monitoring the formation of SRG patterns. The experimental setup and results are shown in Fig. 19.
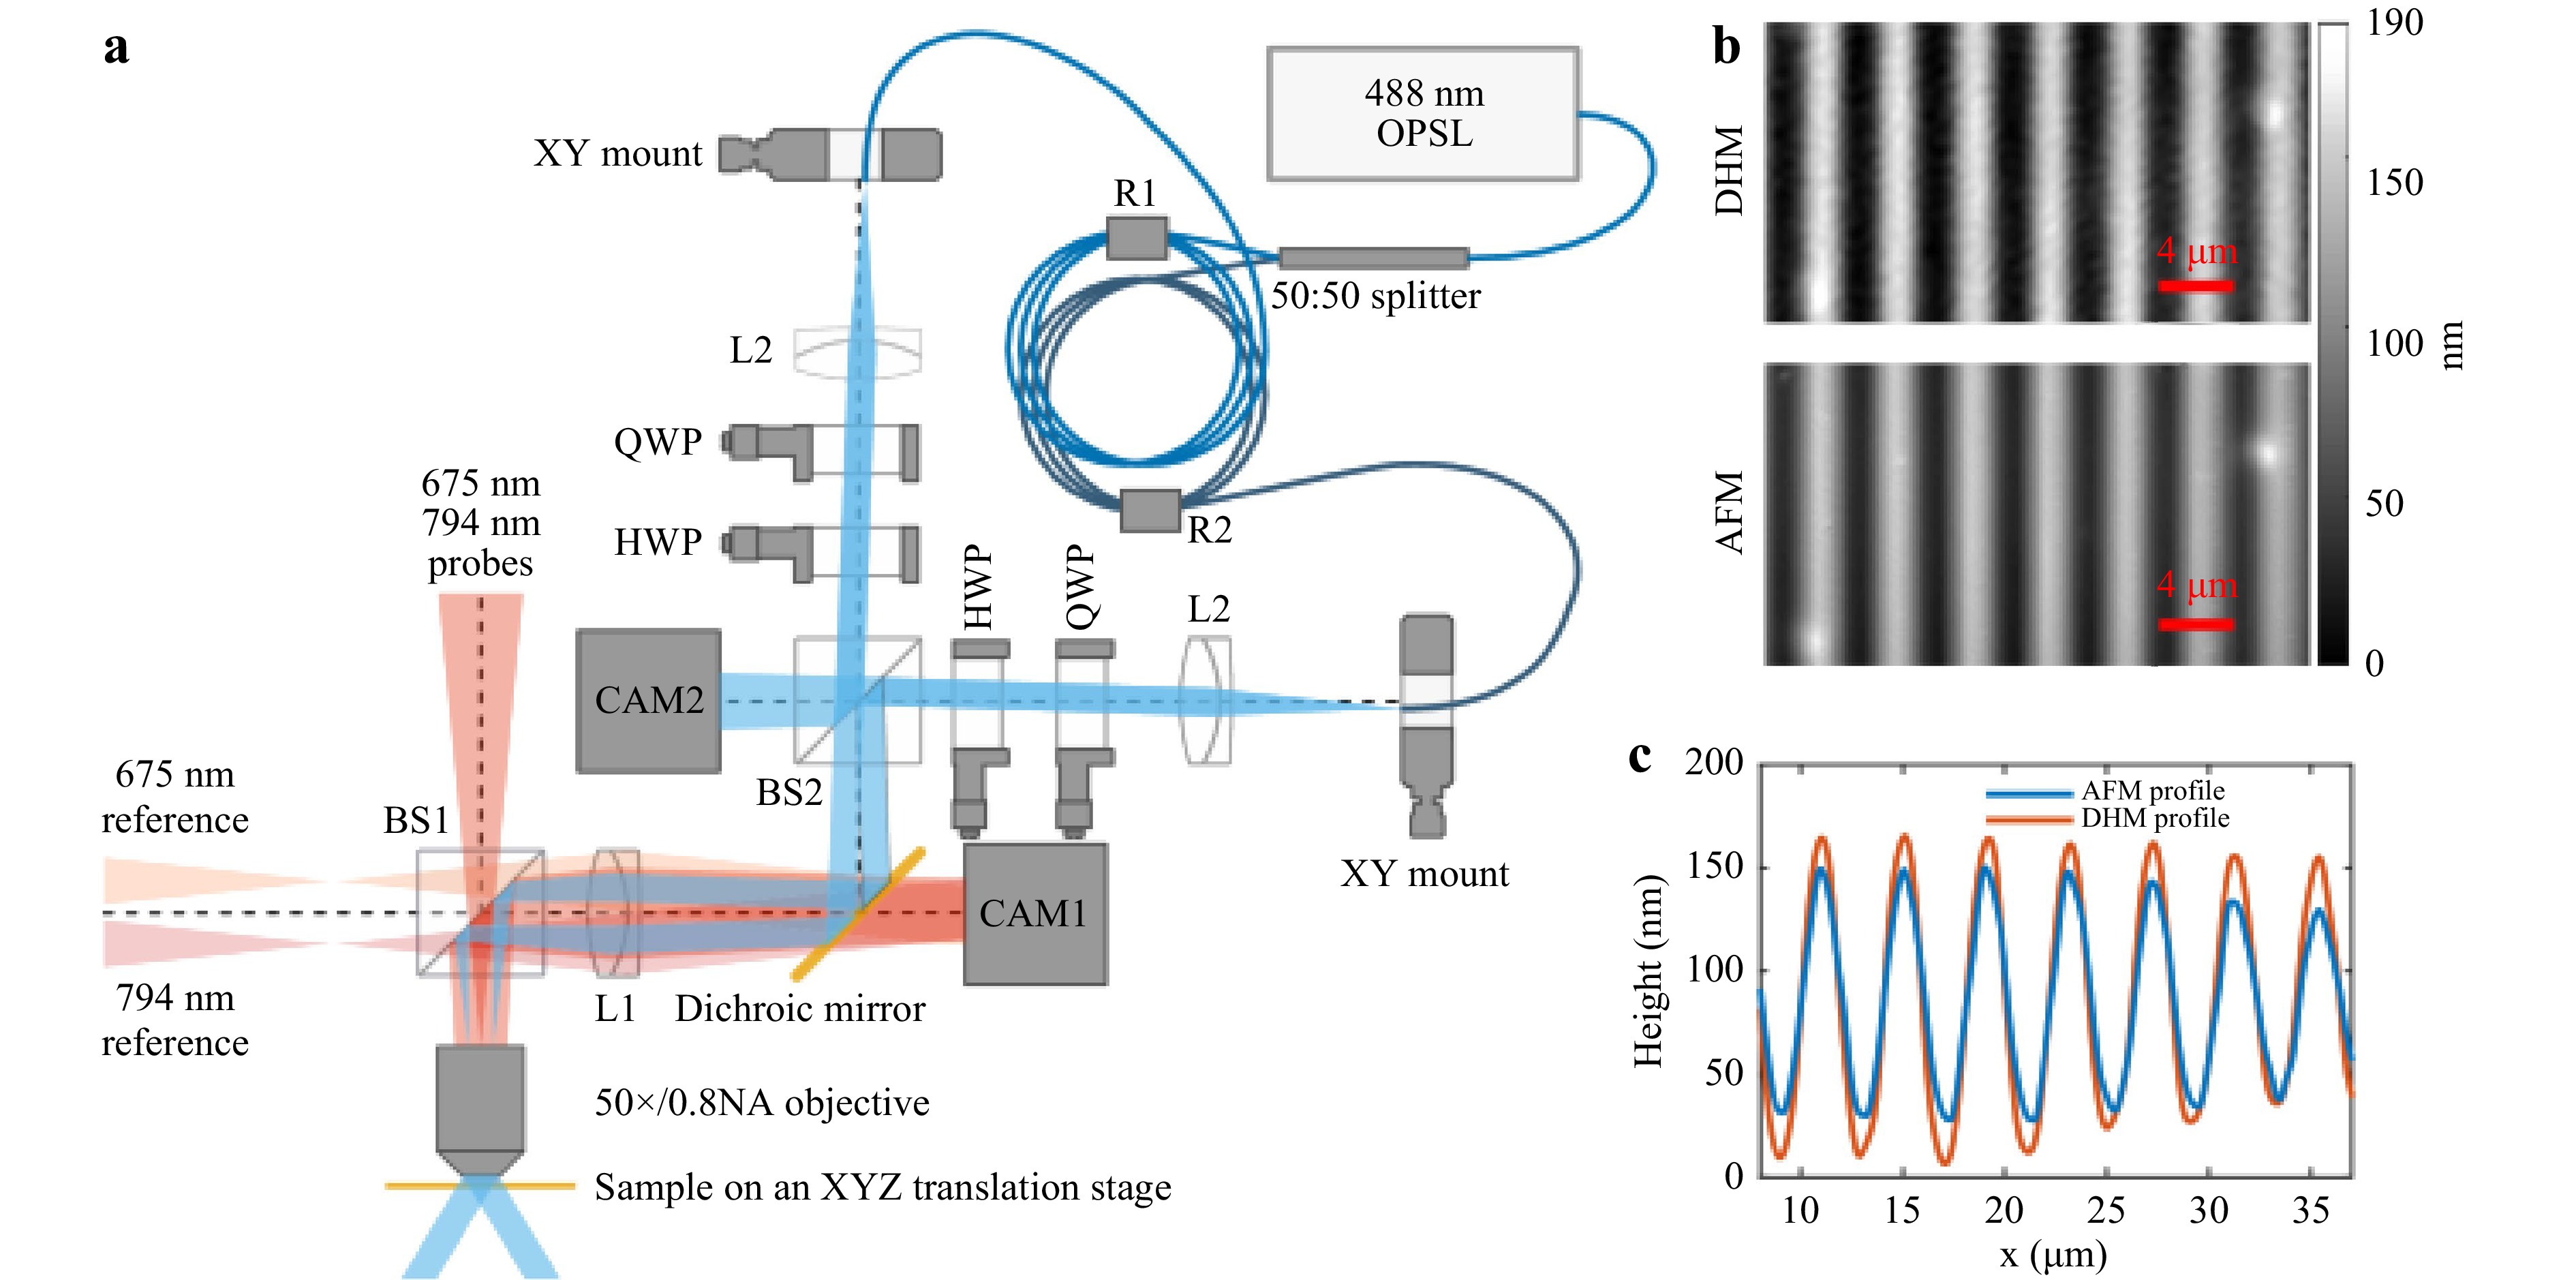
Fig. 19 Optical measurement setup for simultaneous surface height measurement and SRG patterning. Reproduced from Ref. 113 © 2021 Springer Nature.
-
In the pioneering era of DH, many applications have been explored for quantitative analysis and to obtain accurate measurements in transparent materials. The analysis of liquids, gases, plasma, and photoelastic materials has been demonstrated. In fact, owing to the intrinsic features of holographic methods, it was possible to study stress formation in photopolymers during the live recording of holograms. A recent paper114 demonstrated that it is possible to detect and retrieve stress formation during the recording and bleaching of photopolymer holograms as a result of the distortion of the internal diffractive structure. This is particularly important in the case of holographic solar concentrators or other holographic optical elements that must meet stringent specifications. DH measured the stress formation in photopolymers during hologram acquisition by recording many holograms at successive exposure time intervals.
Another example of the capability of DH to measure deformation was presented in Ref. 115. In this research, it was shown that the deformation of cylindrical nanostructures made of silica aerogels can be analyzed using DH. In particular, two-beam phase-shifting digital holographic interferometry was applied to investigate in-plane displacements. While the structures under investigation were mechanically loaded with various loads from the top surface, phase-shifted holograms of the silica aerogels with and without deformation were acquired using a CCD camera. Reconstruction of the complex amplitude of aerogel samples using the Fresnel diffraction integral was adopted to analyze the reordered holograms. In-plane displacements were obtained from the phase distribution of the deformed aerogels by measuring the change in the two-phase distributions, enabling the observation of their elastic behavior. The deformation of silica aerogels was observed within the range of 0.02058 cm to 0.0017 cm, corresponding to an increase in bulk density from 0.01742 gm cc−1 to 0.1952 gm cc−1.
A further example of the application of DH in measuring mechanical properties is the investigation of the Young’s modulus of polyacrylamide gels116. DH is shown to be a convenient technique for measuring the Young’s modulus of soft materials for cellular adhesion. The interaction between an elastic substrate and adherent cells plays a key role in regulating functions and behaviors in the concentration, migration, and proliferation of the cells. Polyacrylamide (PAA) is a soft polymeric gel and a flexible substrate with specific mechanical properties commonly used for testing the mechanical properties of cells. However, to quantitatively measure the stress induced by cells, it is necessary to determine their mechanical response with high accuracy. The accurate measurement of the Young’s modulus can be achieved through DH by retrieving the optical phase of the light transmitted through the transparent gel.
-
To the best of our knowledge, Lorenz-Mie analysis has been widely used in in-line DHM to track and measure colloidal particles117, which is also known as holographic particle characterization (HPC). Owing to the Lorenz-Mie theory of light scattering, the 3D tracking of particles with nanometer precision while simultaneously measuring each sphere’s radius and refractive index could be achieved. This technique can be used not only for a single particle but also for measuring multiple colloidal particles, as reported by Fung et al.118; in this study, up to six colloidal spheres were accurately modeled based on superposition solutions. In the past decade, HPC with Lorenz-Mie analysis has been applied to different areas of colloidal particles. In 2014, Krishnatreya et al. successfully measured the Boltzmann constant of a single particle119, which means that individual colloidal particles can be tracked over large distances with high precision. In 2017, Cheong et al. applied HPC to colloidal particles in turbid media120, for the first time verifying its applicability in translucent media. In addition to the above applications, HPC can be used to guide the development of synthesis protocols for colloidal particles121. The monodisperse TPM sphere fabrication process was examined by HPC to study the influence of protocol choices on the size and refractive index.
In a recent study, DH microscopy in conjunction with particle tracking velocimetry (PTV) was implemented to measure microfluidic shear rheology and the wall slip of viscoelastic fluids122, 123. The technique involves introducing non-deformable microparticles into the fluid, recording the holograms, and identifying the particle centroid locations in 3D with a digital reconstruction of the particle scattering field for an imposed driving pressure. Starting from the PTV, it is possible to retrieve the velocity and characterize the shear rheology of the viscoelastic fluids. Then, using a small sample volume (approximately 20 μl), it was possible to characterize the shear rheology of viscoelastic fluids across a wide range of shear rates. The results were compared with those of simulations and classical macrorheometry. Moreover, a recent study used DH to monitor surface slippage to investigate microparticle sedimentation124. Understanding the behavior of microparticle sedimentation in fluids is of fundamental importance for many industrial processes and natural phenomena. Digital holographic microscopy was used to measure the effect of the proximity of a flat microfluidic chamber wall on the sedimentation of colloidal microspheres. The numerical refocusing feature of DH was employed to track multiple particles instantaneously, obtaining quantitative images of the samples. By analyzing the 3D paths and speeds of multiple sedimentation microparticles, it was shown that the proximity to flat walls of higher slip lengths causes faster sedimentation. This effect was driven by the ratio of the particle size to the slip length and its distance from the walls. Moreover, the dependence of the 3D trajectories on the internal coatings provided to the chamber walls was also retrieved. In Fig. 20, the paths followed by different microparticles are shown, as they are retrieved by DHM.
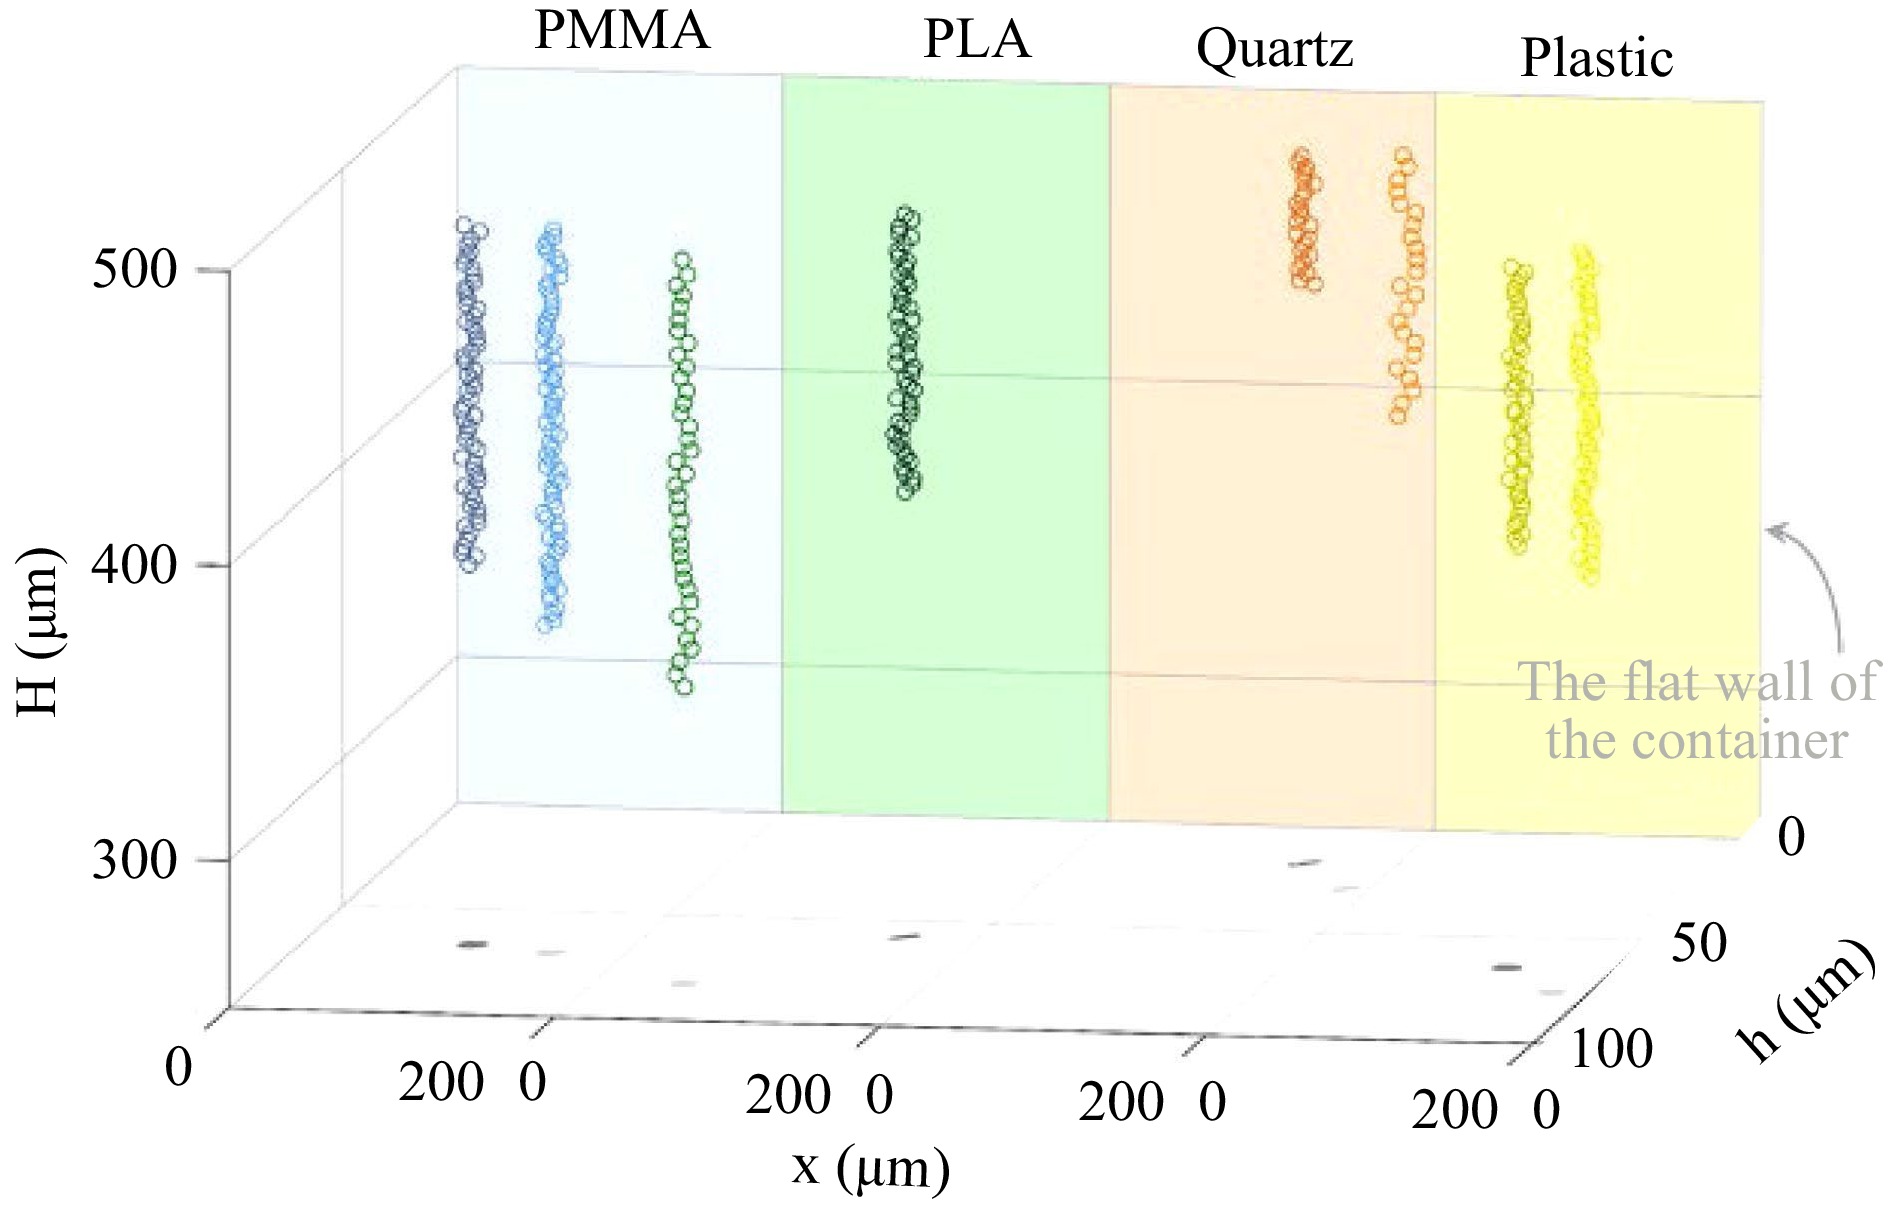
Fig. 20 3D trajectories of several polystyrene micro-particles at different distances from the flat wall of the container within 5 s and in different levels of hydrophobicity wall effects (PMMA, PLA, Quartz, Plastic). The different materials and the sedimenting micro-particles near them are shown in different colors. The different colored circles show the sedimenting micro-particle distances to the flat wall; lighter colors indicate farther ones. Reproduced from Ref. 124 © 2021 Springer Nature.
Holographic technology has a wide range of applications in microfluidic imaging. A typical example is the application of holographic particle image velocimetry (HPIV) to track particles in fluids125, 126, especially when the particle density is high and the 3D spatial distribution is complex. Here, HPIV technology based on an off-axis DH setup was used to track the particles inside the thin films and realize the tracking of large-scale 3D liquid flow36. As the twin technology of in-line DH with Lorenz-Mie analysis, off-axis HPIV focuses on particle tracking for undefined spaces with ultralong-distance movement.
In this experiment, particles with a diameter of 10 μm were injected into the PA solution, which moved with the film during the pumping of the bubble. Fig. 21 shows the trajectories of the three particles, from which the gravitational drainage process of the thin film can be clearly observed. The most notable among them is particle A, which first raised gradually with the film and then quickly moved to the edge with a decrease in height. These datasets can be used to better understand the liquid flow movement process on the surface of the film and convert complicated liquid flow tracking into simple particle tracking. In fact, this technology can be applied in many experiments on film motion processes in the study of membrane gravitational drainage and rupture processes.
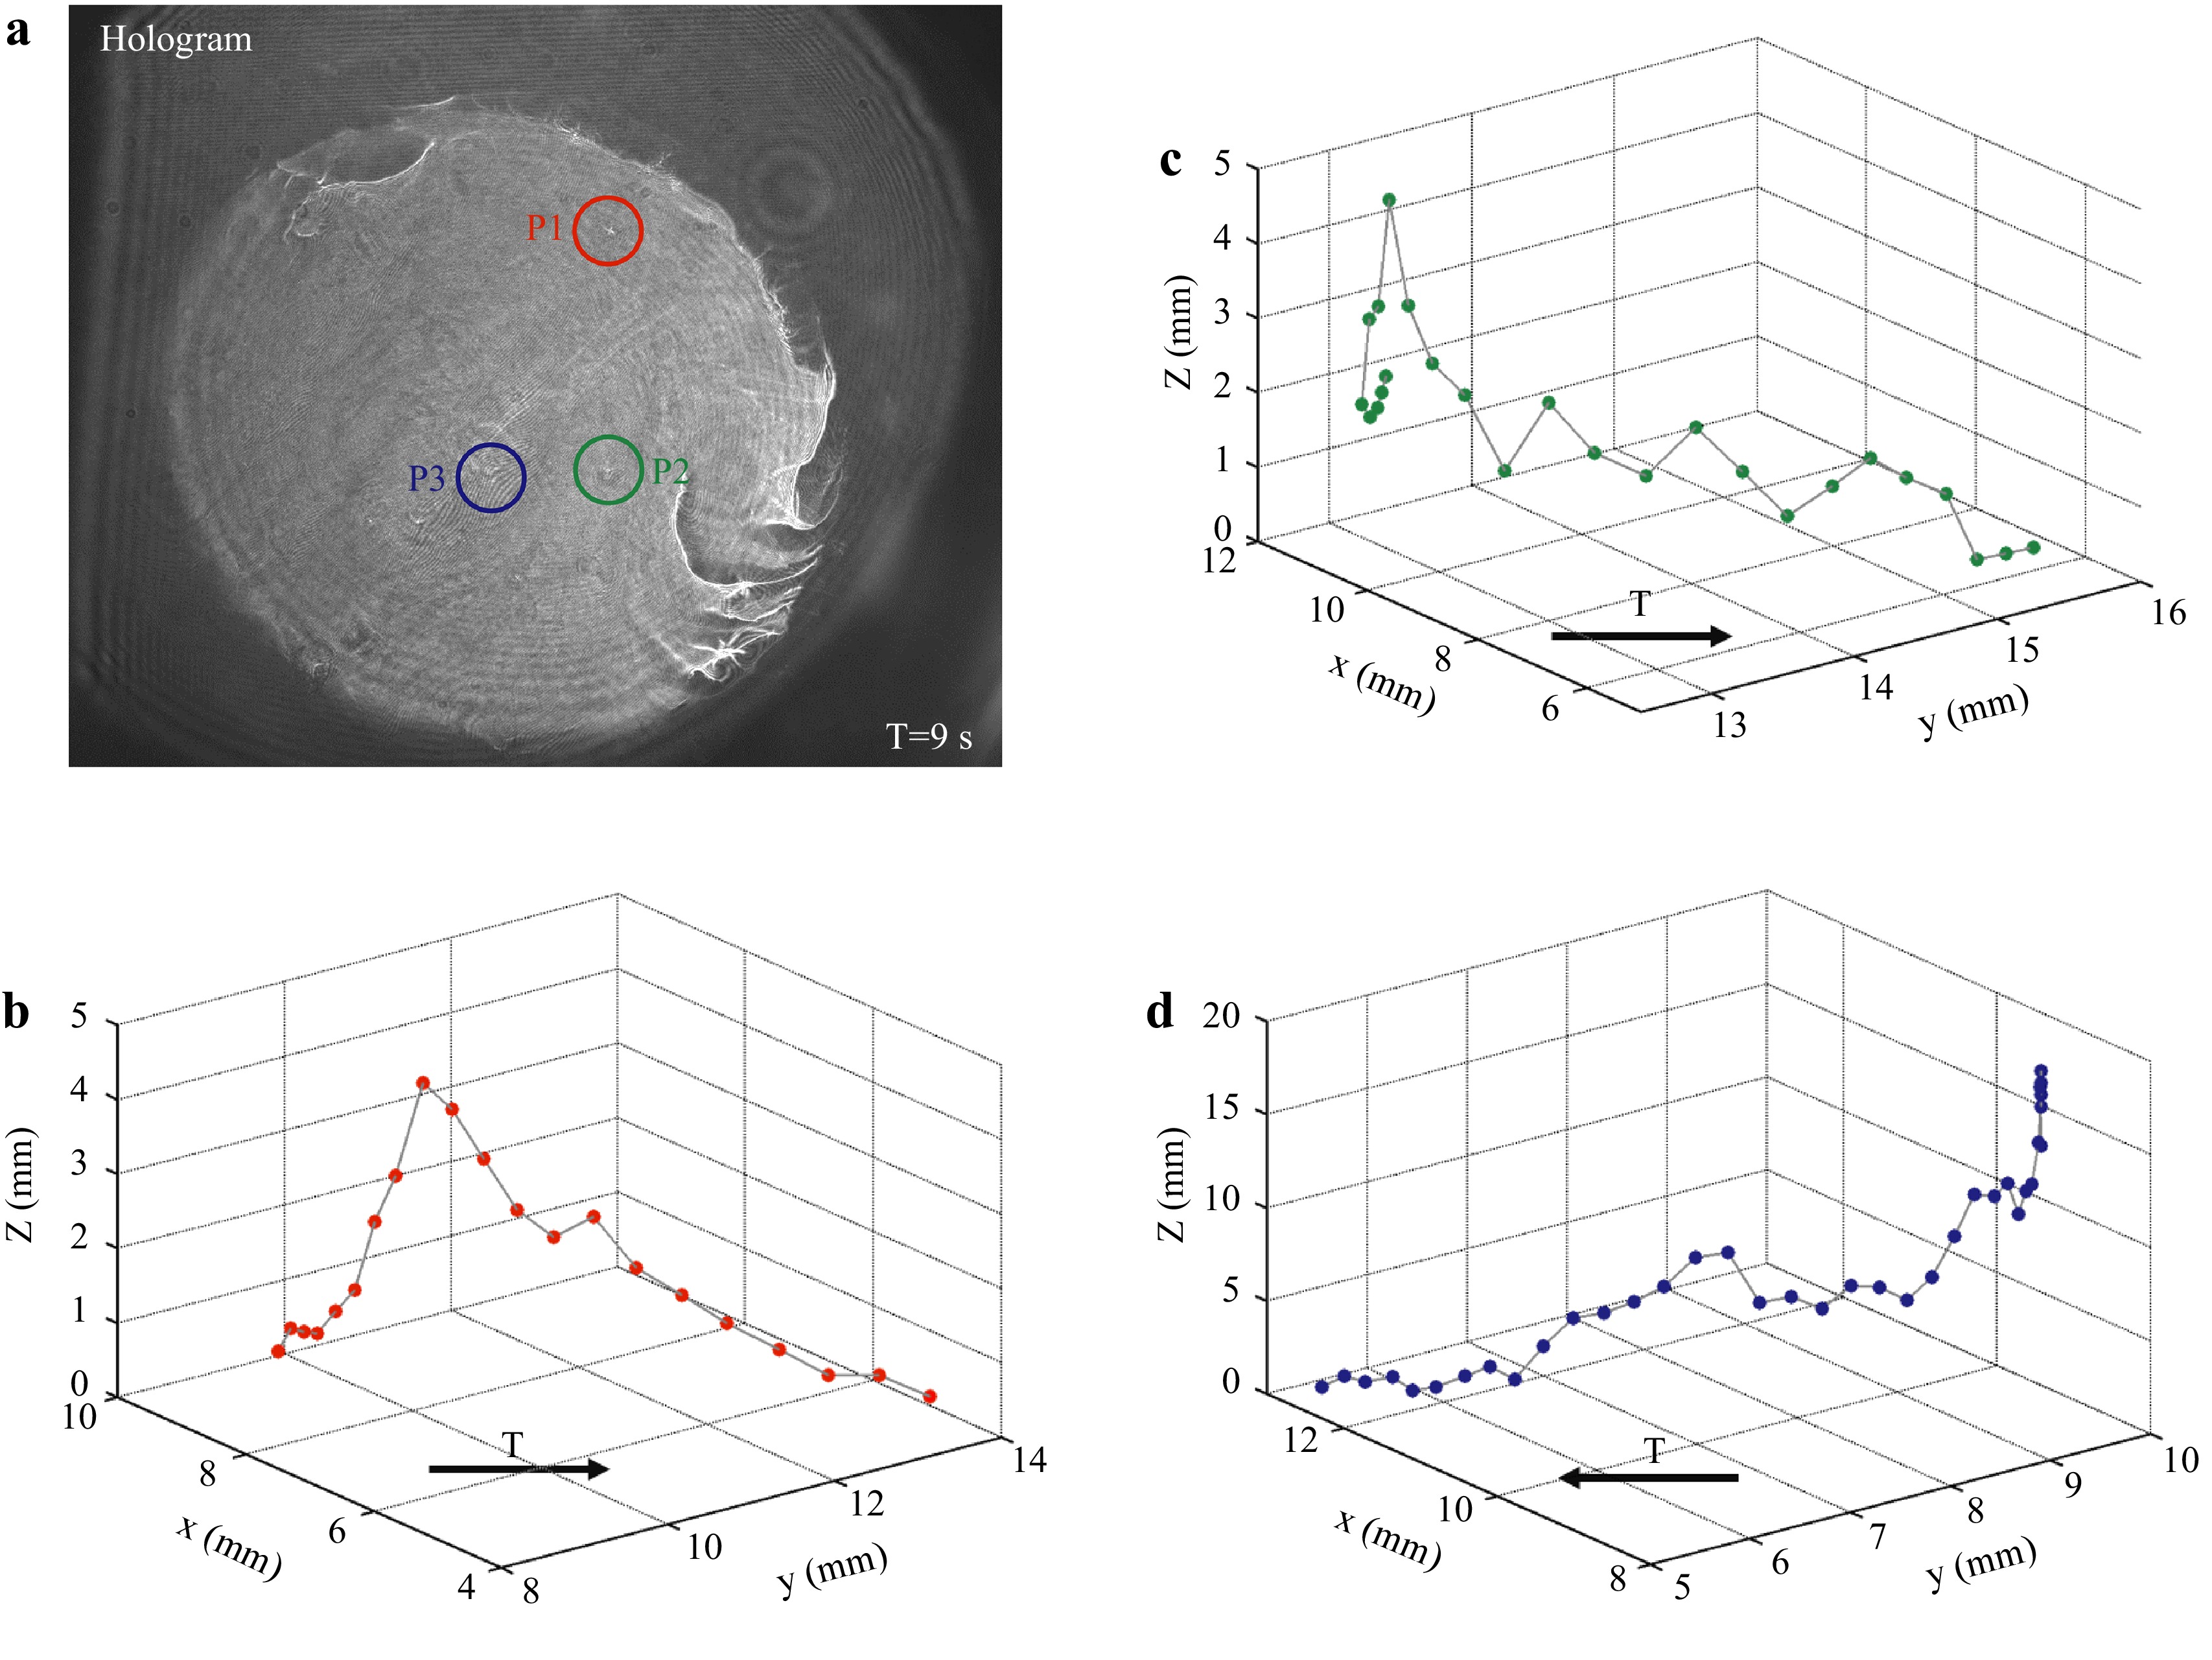
Fig. 21 Holographic particle image velocimetry of particles in pumping bubble. a the hologram particles could be clearly observed. b, c, d Three-dimensional trajectory of particle movement. Reproduced from Ref. 36 © 2021 Springer Nature.
-
The integration of deep learning with DH imaging is an emerging and widely studied topic. In the digital holographic morphology of soft matter, deep learning can also be used to enhance recording and numerical reconstruction processes, especially for colloid aggregation127. In 2020, Altman et al. proposed a method for characterizing and tracking colloids holographically (CATCH) in colloidal dispersions128. In this study, in-line holograms of colloids were studied using a neural network to acquire the properties of the particles. Although the CATCH output did not achieve the full precision of the conventional Lorenz-Mie analysis, it successfully provided approximate results in a shorter time, providing a new solution for the analysis of the colloidal dynamics process. In 2021, Midtvedt et al. used deep learning to enhance the optical characterization of subwavelength particles129. A neural network was applied to link the reconstructed results with the real radius and refractive index of individual subwavelength particles. In this case, the holographic scattering patterns of single particles contain sufficient information to reveal the subwavelength size and the precise refractive index. As a result, the aggregation kinetics of a sample consisting of polystyrene nanoparticles were monitored by combining DH and deep learning without prior knowledge of the physical properties of the surrounding medium. Furthermore, this method could be extended to other application scenarios; for example, tracking the movement of aggregates in special microfluidic channels, and it will open new possibilities for characterizing particle interactions and properties130. Neural networks can also be used to improve the accuracy of phase reconstruction for the morphology of time-varying objects, such as fluids and soft matter. Lu et al. proposed an Ynet-ConvLSTM network for extracting phase information during dynamic holographic imaging131. The time-related information in the hologram sequence was learned by the neural network, and it was then used to improve the reconstruction accuracy and suppress the background noise. The author implemented the proposed method on quantitative holographic droplet alcohol evaporation imaging, and a comparison between different reconstruction methods was presented. From the results obtained, the phase information obtained by the Ynet-ConvLSTM network reveals higher precise object information compared with the results obtained from the conventional Unet method and two-step phase-shifting algorithm. Through the combination of conventional holographic recording and deep learning reconstruction, phase extraction under a neural network will challenge the conventional numerical diffraction reconstruction process to achieve dynamic high-precision low-noise imaging. In the future, the combination of the DH method based on the deep learning reconstruction process and wavefront shaping132 may create more possibilities and expand the application scenarios of holographic soft-matter measurement.
-
We have presented, reviewed, and extensively discussed how DH can be a suitable metrology tool for use in a variety of challenging cases dealing with soft matter, that is, with liquid/polymer matter and fast dynamically evolving processes such as inkjet printing. DH can successfully provide engineering solutions for many applications and basic scientific questions. Even though this review is not exhaustive, we believe that we have reported the most significant cases in which such measurement techniques can be effectively applied to soft matter. We have intentionally excluded “biological matter”, as it is outside the scope of this review. In particular, we reported on the applications of DH measurement for different types of soft matter, such as thin films, EHD drawn fibers, polymeric lenses, micro-channels, hydrogel micro-scaffolds, photoresists, surface relief gratings, and particles. Table 1 lists the implementation conditions and parameters of the relevant measurements, where we identified the optimal measurement approaches for different materials/processes.
Soft matter Method Light Source Measurement range Sample feature Thin-film WLI White light ~50 nm to ~1.5 μm Smooth liquid film with thickness less than 1.5 microns. Off-axis DH Visible laser ~300 nm to ~100 μm Transparent film with continuous morphology. Hybrid approach White light
Visible laser~50 nm to ~100 μm All types of liquid film. EHD drawn fiber Off-axis DH Visible laser According to morphology
and phase unwrapping.Transparent or translucent soft- matter micro-structures with continuous thickness distribution and no-hollow structure. Polymeric lens Micro-channel Hydrogels micro-scaffold Photoresist Surface Relief Grating Particles In-line DH Visible laser Nanoscale particles moving
in microscale.Solution embedded particles. Off-axis DH Visible laser Microscale particles moving
in milliscale.Solution or films embedded particles. Table 1. Cross-overview over the different materials and DH presented approaches
For most transparent soft matter, DH is one of the best candidates for implementing measurements. Among them, the special case is for ultra-thin liquid films, meaning liquid films with an average thickness of less than 1 μm; WLI will be the best method in theory because it has excellent resolution for smooth sub-micron thickness distribution. Meanwhile, we indicate the possible measurement ranges for different materials, but these ranges are only reasonable references. In soft matter holographic measurements, the precise measurement range is related to the choice of recording wavelength and sample morphology. For an interferometric imaging system, the horizontal resolution depends on the selected magnification lens, while the axial resolution depends on the recording wavelength and the minimum pixel size of the camera. Therefore, one of the advantages of holographic measurement is its adjustable measurement range and optimized measurement accuracy. Although holographic phase errors can be analyzed and calibrated through specific methods, the main measurement uncertainty still comes from the light source itself133, which is different from interferometric measurement. The measurement error of interferometry arises from the number of observed interference fringes and the position of the sample134-136. This also implies that one of the reasons for choosing DH as the main measurement method for soft matter is that the placement of the sample does not affect the measurement accuracy.
The results reviewed here show that DH is robust in many challenging situations as it does not require frequent calibration while maintaining the attractive features of DH, that is, non-invasive, no-contrast agent, full-field imaging, high spatial resolution, and temporal high-frequency, up to the MHz range. We believe that DH has a bright future in the field of soft matter and advanced fabrication processes owing to its intrinsic capability to perform 3D imaging combined with quantitative analysis137. This idea is also supported by the increase in technological applications of thin films, from electronic to cosmic protective clothing and packaged water in gravity-free environments. Several other examples and published papers can be found discussing other challenging applications, we apologize if it was not possible to include all of them in this review.
-
This work is partially supported by the MIUR project, "Piattaforma Modulare Multi Missione" (PM3), ARS01_01181.


 DownLoad: