


-
Digital holographic microscopy has emerged as a powerful tool for imaging transparent phase objects, including live cells. It provides single-shot, high contrast images of unstained samples, which are usually transparent to visible electromagnetic radiation1-3. The technique also has the added advantage of numerical focusing. Numerically reconstructed digital holograms of the phase objects provide the sample’s complex amplitude distribution4.
The phase extracted from the complex amplitude distribution, can be used for the computation of optical thickness of the investigated object with sub-wavelength axial accuracy5, refractive index tomography6, cell migration studies7, live cell imaging8-16 including study of human red blood cells9, cell division12, study of cardiomyocytes13, and embryonic stemcells14. Digital holographic microscope can also be combined with microfluidic systems for cell identification15. Object thickness distribution and its time variation provide many sample features that could be used for its characterization, identification, and classification7-9,12-17.
In transmission mode, digital holographic microscopes are usually constructed using the Mach-Zehnder two-beam interferometer geometry5, where One of the extracted beams from a laser source trans-illuminates the sample, and carries the object amplitude and phase information, and acts as the object beam. The second beam, which is unmodulated by sample information, serves as the reference beam. The object and the reference beams are made to superpose on a digital array by using beamsplitters, mirrors, and other beam steering optical components leading to the creation of digital holograms, which are numerically evaluated. A simplified version of digital holographic microscopes employing amplitude division self-referencing geometry microscopes have also been demonstrated18-25 and used in cell classification problems22-24. Digital holographic microscopes, when coupled with image processing9, pattern recognition, and machine learning algorithms16-17,22-24, provide researchers with a potent noninvasive, label-free, real-time tool to characterize, identify and classify technical and biological phase objects14,17,22-24.
The realization that a tightly focused laser beam could immobilize microparticles and control their movement opened new research areas26. The high intensity gradient at the focus of the laser beam draws the microparticles to the laser beam’s center and traps them there27. This laser beam can then be used to micro manipulate the trapped particle. Nowadays, optical tweezers find place in many areas of imaging of technical and biological samples. It has been used for the imaging, characterization and isolation of stem cells28,29. It has also been demonstrated for trapping and manipulating viruses and bacteria30 and studying the mechanics of single DNA molecules attached to micro-beads31. Optical tweezers were also explored for fertilization of oocytes and development of cell biosensors32. The advantage of optical tweezers is that they can trap and manipulate samples with dimensions ranging from nanometers to few hundreds of micrometers. This aspect is especially useful in optical sorting, elasticity, and deformability measurement, and single-cell isolation33-35. Optical tweezers are also ideal for exploring, characterizing, and classifying red blood cells (RBCs)36-42. It has been used to study the behavior of red blood cells in patients with sickle cell anemia36. It was also used to diagnose malaria using the power spectrum of Brownian position fluctuations of the trapped cells37. Shape asymmetry (deformation and shape change) in RBCs due to the onset of diseases was also observed using optical traps38. Pathological analysis for the determination of biomechanical properties of red blood cells was also reported40.
The coupling of digital holographic imaging devices to optical traps will further enhance its capabilities in the study and characterization of bio-samples. Such a combination will allow investigating the morphological changes occurring to bio-samples in their natural environment, obtaining sample features otherwise inaccessible using optical tweezers, like sample volume, surface area, shape, and thickness fluctuations. Two-beam interferometer geometry has already been reported for combining optical tweezers and digital holographic microscopy25,43-45.
Optical tweezers coupled with digital holographic microscopes for quantitative phase imaging of the trapped particles require laser sources for optical trapping and holographic imaging and a light source for bright field imaging. The technique will also need digital arrays for brightfield image acquisition and digital recording of holograms. A quadrant photodiode is also necessary to determine the corner frequency and trap stiffness, which directly depends upon the Brownian fluctuations of the trapped particle. So, integrating the optical trap and digital holographic microscope leads to a bulky and costly device. However, optical traps can be designed using any laser source which has enough power to trap the investigated sample. A DVD Optical Pickup Unit (OPU) has all the components (high power laser, high NA lens mounted on a voice coil) necessary to make a compact optical trap and has already been demonstrated35.
As mentioned earlier, digital holographic microscopes in transmission mode usaually use a two-beam geometry based on Mach-Zehnder interferometer5. Such a microscope is large, bulky, expensive, and difficult to integrate with an optical trap. Also, in Mach-Zehnder geometry the object beam (beam interacting with the sample) and reference beam travels along different paths. The beams will pick up uncorrelated phase variations (due to mechanical noise), which will reflect as phase noise in the cell thickness variation measurements. However, digital holographic microscopes can also be implemented using self-referencing geometry. In such geometry, a portion of the object beam, which is unmodulated by object information, is made to interfere with the portion of the same beam containing object information leading to the formation of holograms18-20. A self-referencing digital holographic microscope using can be easily integrated into an optical tweezer. The simplest Self-Referencing Digital Holographic Microscope (SRDHM) utilizes a glass plate to create two laterally sheared versions of the same object wavefront19,21-24. When the shear is much larger than the object’s size, it leads to the creation of holograms19. It has been demonstrated to be robust for label-free cell identification22,24. Digital holographic microscope based on self-referencing lateral shearing geometry requires a single glass plate to generate holograms19,21-24, making it very simple, cost-effective and easy to integrate with optical traps, making the whole device compact. Also in lateral shearing digital holographic microscope, the object and the reference beam travel along identical paths encountering the same set of optical elements (magnifying lens and glass plate), leading to high immunity towards mechanical noise. It should be noted here that single-shot quantitative phase imaging could also be achieved using transport of intensity equations using multifunctional metastructures. However, it might be challenging to integrate this with optical tweezers46,47.
We have been working on integrating low-cost optical tweezers using DVD optical pickup units and SRDHM modules for quantitative phase imaging of trapped particles for their characterization and identification48. This manuscript is an overview of our work on integrating optical traps with digital holographic imaging. We have used self-referencing digital holographic microscope using lateral shearing geometry for quantitative phase imaging of the trapped particles. It is an effective and compact way to integrate digital holographic microscopy and optical traps. In our earlier work48, we have shown the proof of concept of the integrated device. In the present manuscript, the device is extended to optically trap red blood cells and extract cell features based on its morphology and its time variation, from digital holographic images. These features and the corner frequency information of the trapped particles are supplied to a machine learning model based on Support Vector Machine (SVM)49 for cell classification.
-
Fig. 1a shows the schematic of the optical trap integrated with the digital holographic microscope. The trapping mechanism comprises of an OPU containing a diode laser module (λ = 650 nm) and a lens of ~4 mm focal length and ~0.6 NA (Supplementary Fig. S1 shows details of the OPU). One of the advantages of OPU is that the focusing lens is mounted on a steering mechanism allowing axial and lateral displacement of the lens by applying electric current35,48. This enables easy focusing and micromanipulation of trapped particles. A blue LED (Luxeon star λ = 470 nm, Δλ = 30 nm) was integrated to the device for bright field imaging. Output from a green laser diode module (Thorlabs CPS532, Output power 4.5 mW) was coupled to the OPU by a dichroic filter (inbuilt in OPU) for digital holographic imaging. The working of the integrated system is detailed in Supplementary Video V1.
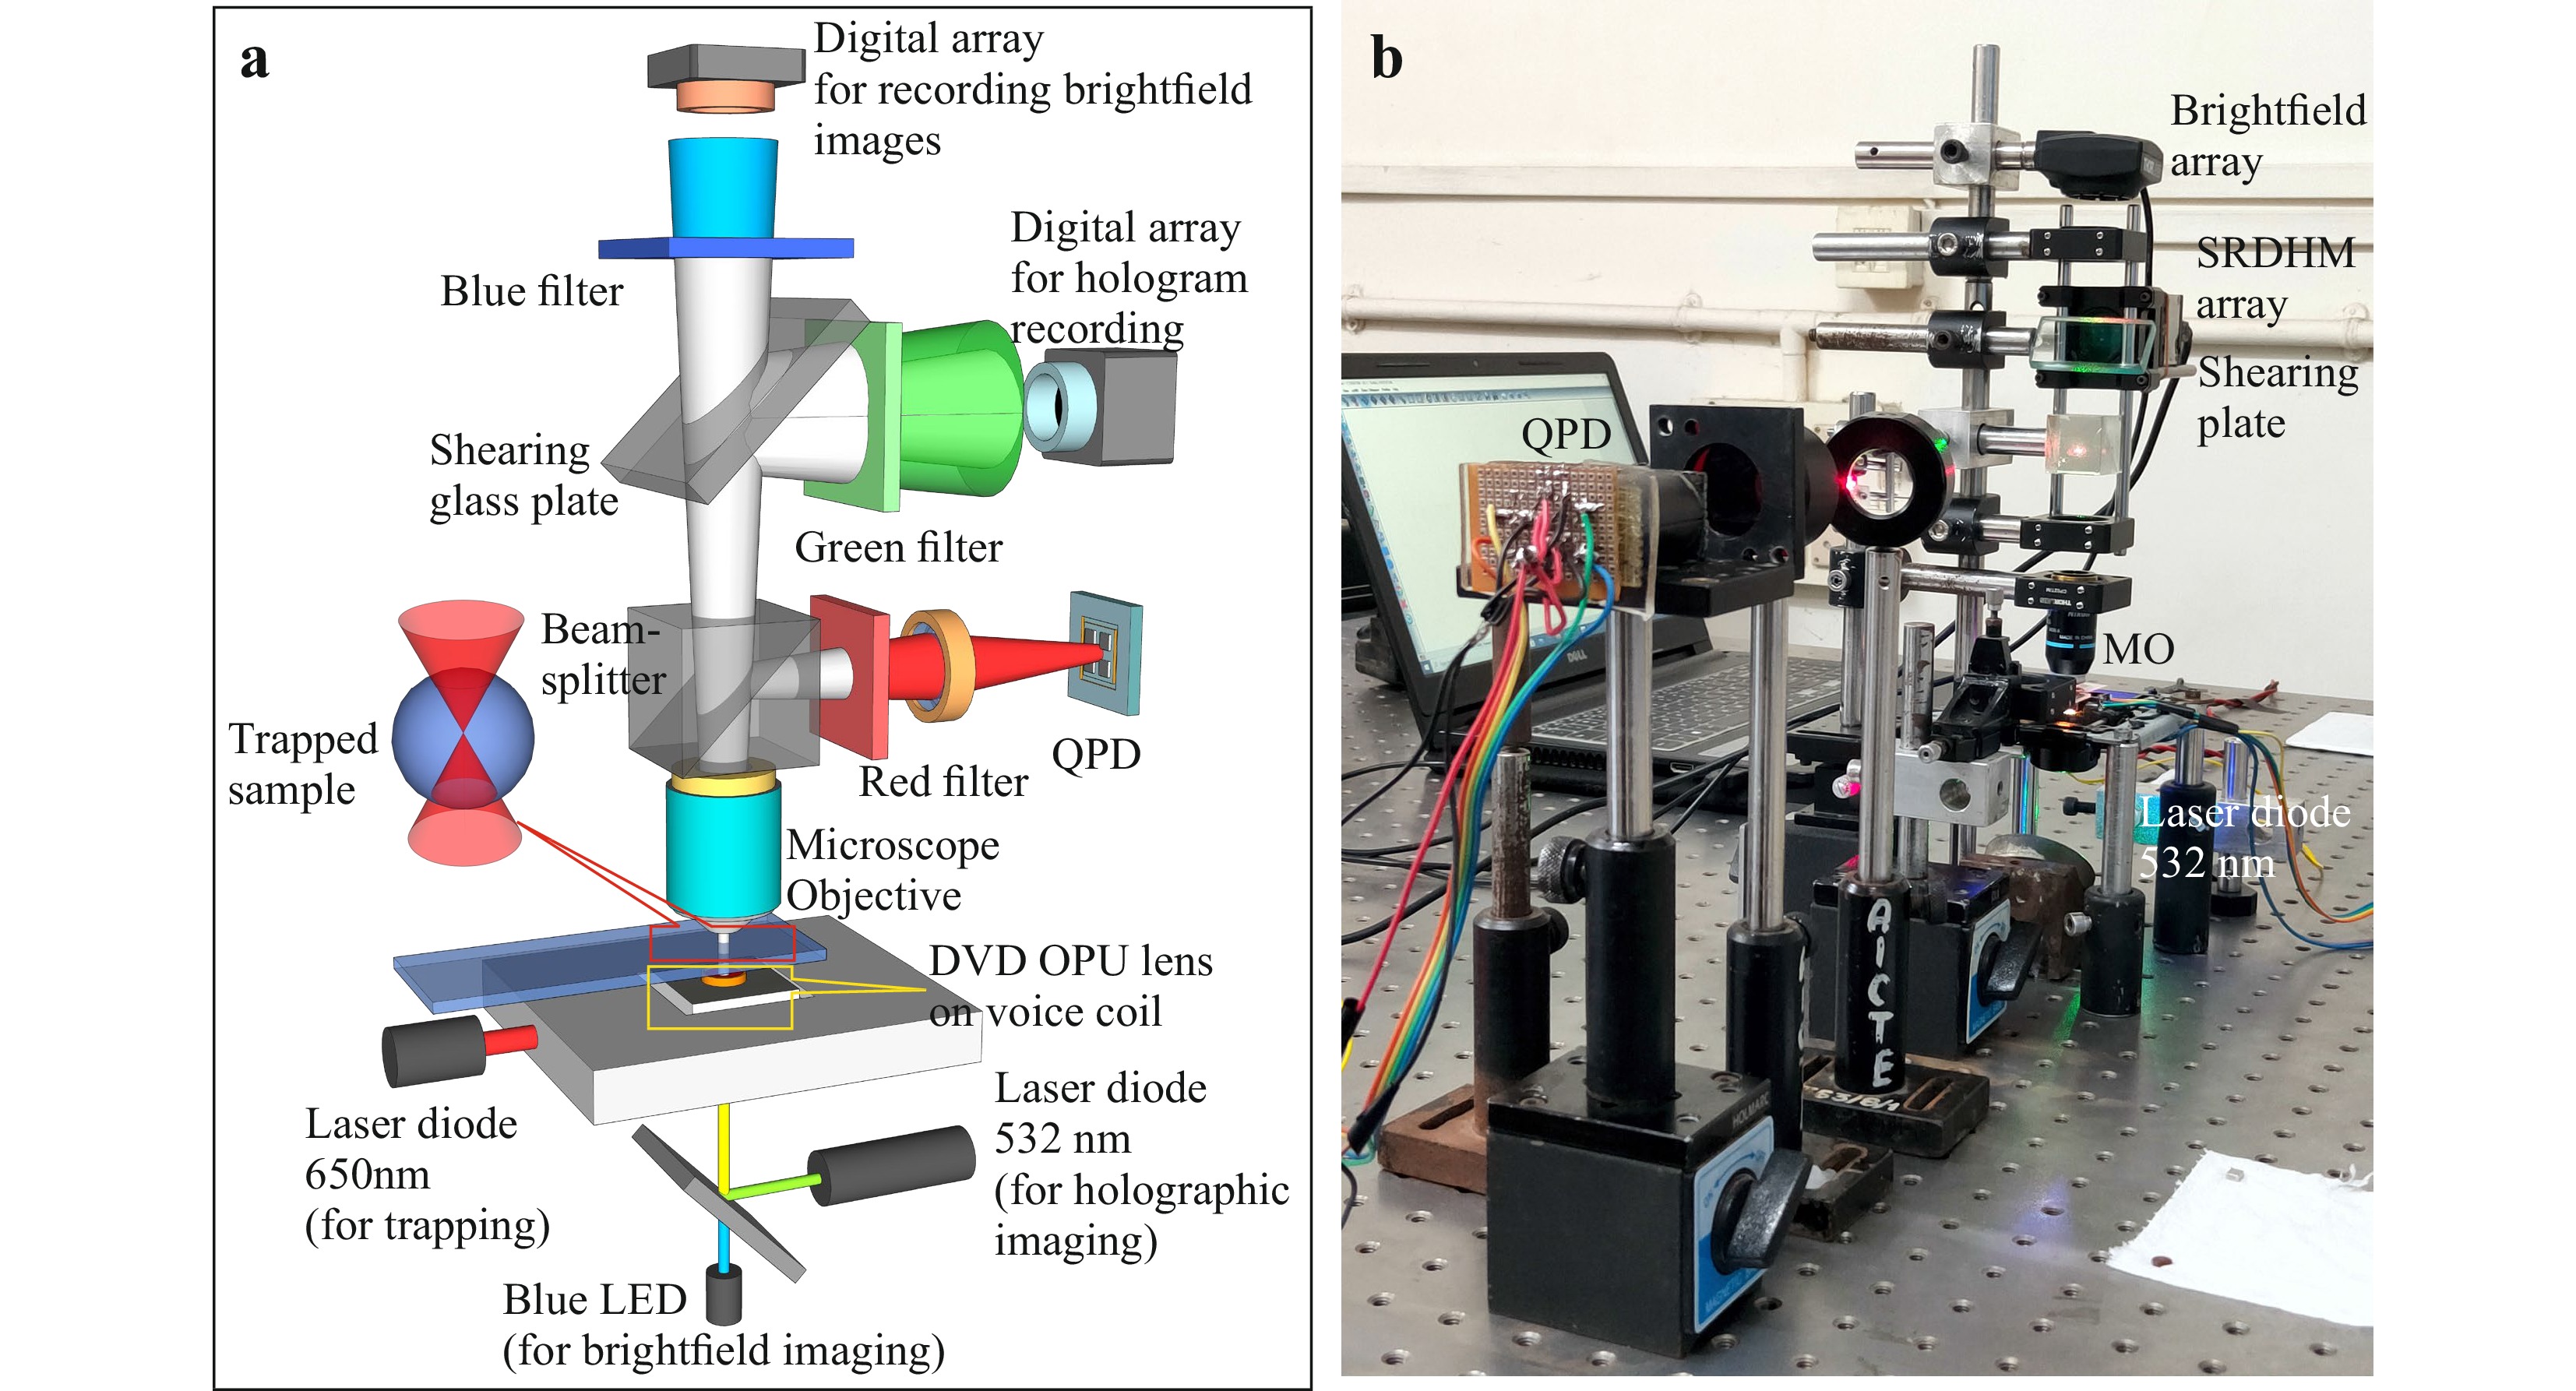
Fig. 1 a Schematic of the Self-referencing digital holographic microscope integrated with low-cost optical tweezer. b Photograph of the table-top setup. Laser (650 nm) from the DVD optical pickup unit acts as the trapping beam. Laser output from 532 nm laser diode module was used for digital hologram recording. A blue LED (470 nm) was used for brightfield imaging. An in-house developed QPD measures the laser beam fluctuations due to the Brownian motion of the trapped particle.
-
To assess the OPU based optical trap, it was tested by trapping 5 µm and 15 µm diameter polystyrene microspheres (Polysciences Inc.) immersed in deionized water. These trapped microsphers were then manipulated by moving the trapping lens by applying an electric current to the voice coil on which it was mounted. Fig. 2 shows the movement of the 15 μm polystyrene microsphere (refractive index = 1.59) in the trap recorded using the brightfield camera. A blue bandpass filter was used to block the trapping laser beam and hologram laser source reaching the bright field camera, and images was captured at the rate of 15 Hz. A microscope objective lens (40X, NA = 0.65) was used to image the sample on to the bright field sensor.
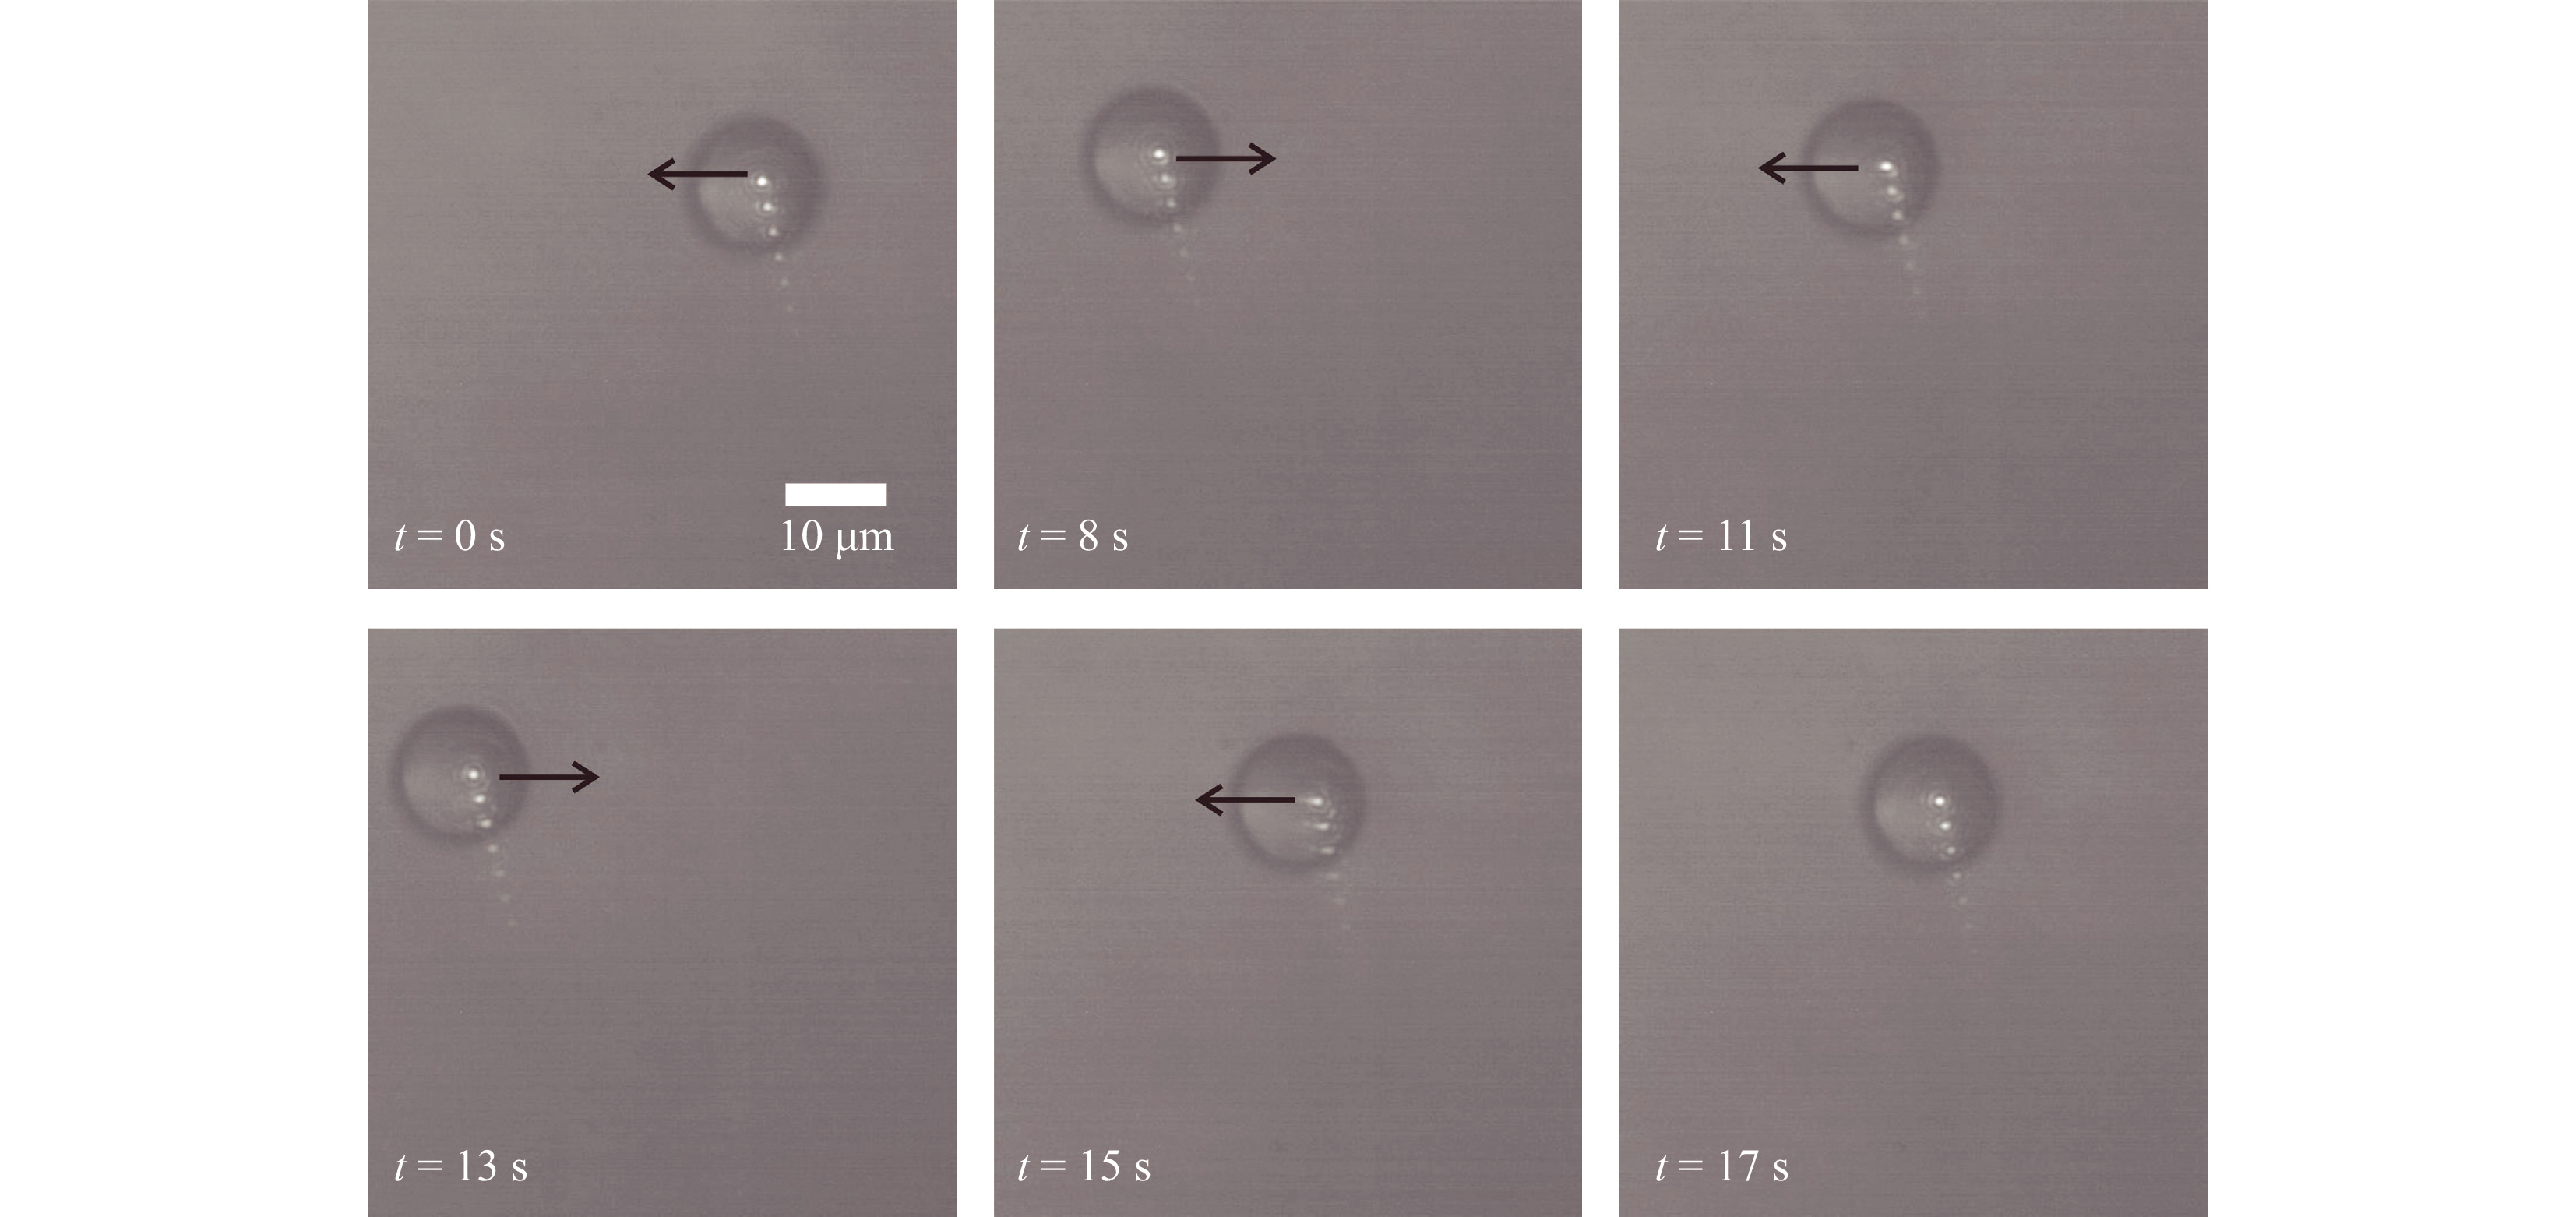
Fig. 2 Brightfield images of micromanipulation of 15 μm diameter polystyrene spheres (Video V2 shows the details). Multiple reflections from the blue filter led to multiple spots in the image.
The measured power of the trap laser at the back focal plane of the OPU lens was less than 40 mW. In Fig. 2, the black arrow depicts the direction of the movement of the trapping beam. Results shown in Fig. 2, confirm that the system can immobilize and manipulate micro-particles46. Supplementary Video V2 and video V3 show the micromanipulation of the trapped 15 μm and 5 μm diameter polystyrene microspheres, respectively. Both the videos were recorded at 15 fps for 30 s.
-
Holographic images of the trapped phase objects were recorded using the lateral shearing self-referencing digital holographic microscope (SRDHM). It comprises of a laser diode module working at 532 nm. The laser output was expanded using a 25 mm focal length lens to ensure that an expanding laser beam illuminates the sample. A 5 mm thick fused silica glass plate kept at an angle of 45° with the incoming laser beam acted as the shearing element. The two laterally sheared versions of the object wavefronts were made to superpose on digital array (Thorlabs DCU224C, 8-bit, 4.65 μm pixel pitch), which recorded the resulting holograms. Fig. 3 shows the portion of the object hologram (hologram recorded with the object in the field of view) of a 15 μm diameter polystyrene microsphere immersed in microscope oil (refractive index = 1.52). A reference hologram (without the object but with the medium surrounding the object in the field of view) was also recorded for phase comparison (subtraction). The recorded holograms were numerically reconstructed using angular spectrum propagation diffraction integral, best suited for short distance propagations2,3. The phase difference (Δϕ) computed by subtracting the reference phase from object phase is related to the object thickness (h) distribution through the constant average refractive index of the sample (nO) and the surrounding medium (nR) via the relation
$\Delta \phi = \left( {{{2\pi } \mathord{\left/{\vphantom {{2\pi } \lambda }} \right.} \lambda }} \right)\left( {{n_O} - {n_R}} \right)h$ . If the refractive indices of the sample and the surrounding medium are not available, the same relationship yields the sample optical thickness distribution. The phase subtraction also nullifies much of the phase due to aberrations as it remains the same between exposures (as we use same set of optical elements for recording of object and reference holograms), bringing out the sample phase distribution. Fig. 3b shows the sample phase distribution obtained after phase subtraction for polystyrene microsphere of 15 μm diameter. This phase, along with the refractive index values, yield the object thickness variation shown in Fig. 3c. Fig. 3d shows the cross-sectional profile of the thickness distribution along the dashed line shown in Fig. 3b. As can be seen from Fig. 3b, the measured value is close to the manufacturer specified value, showing that SRDHM can be used for accurate thickness measurement of phase objects.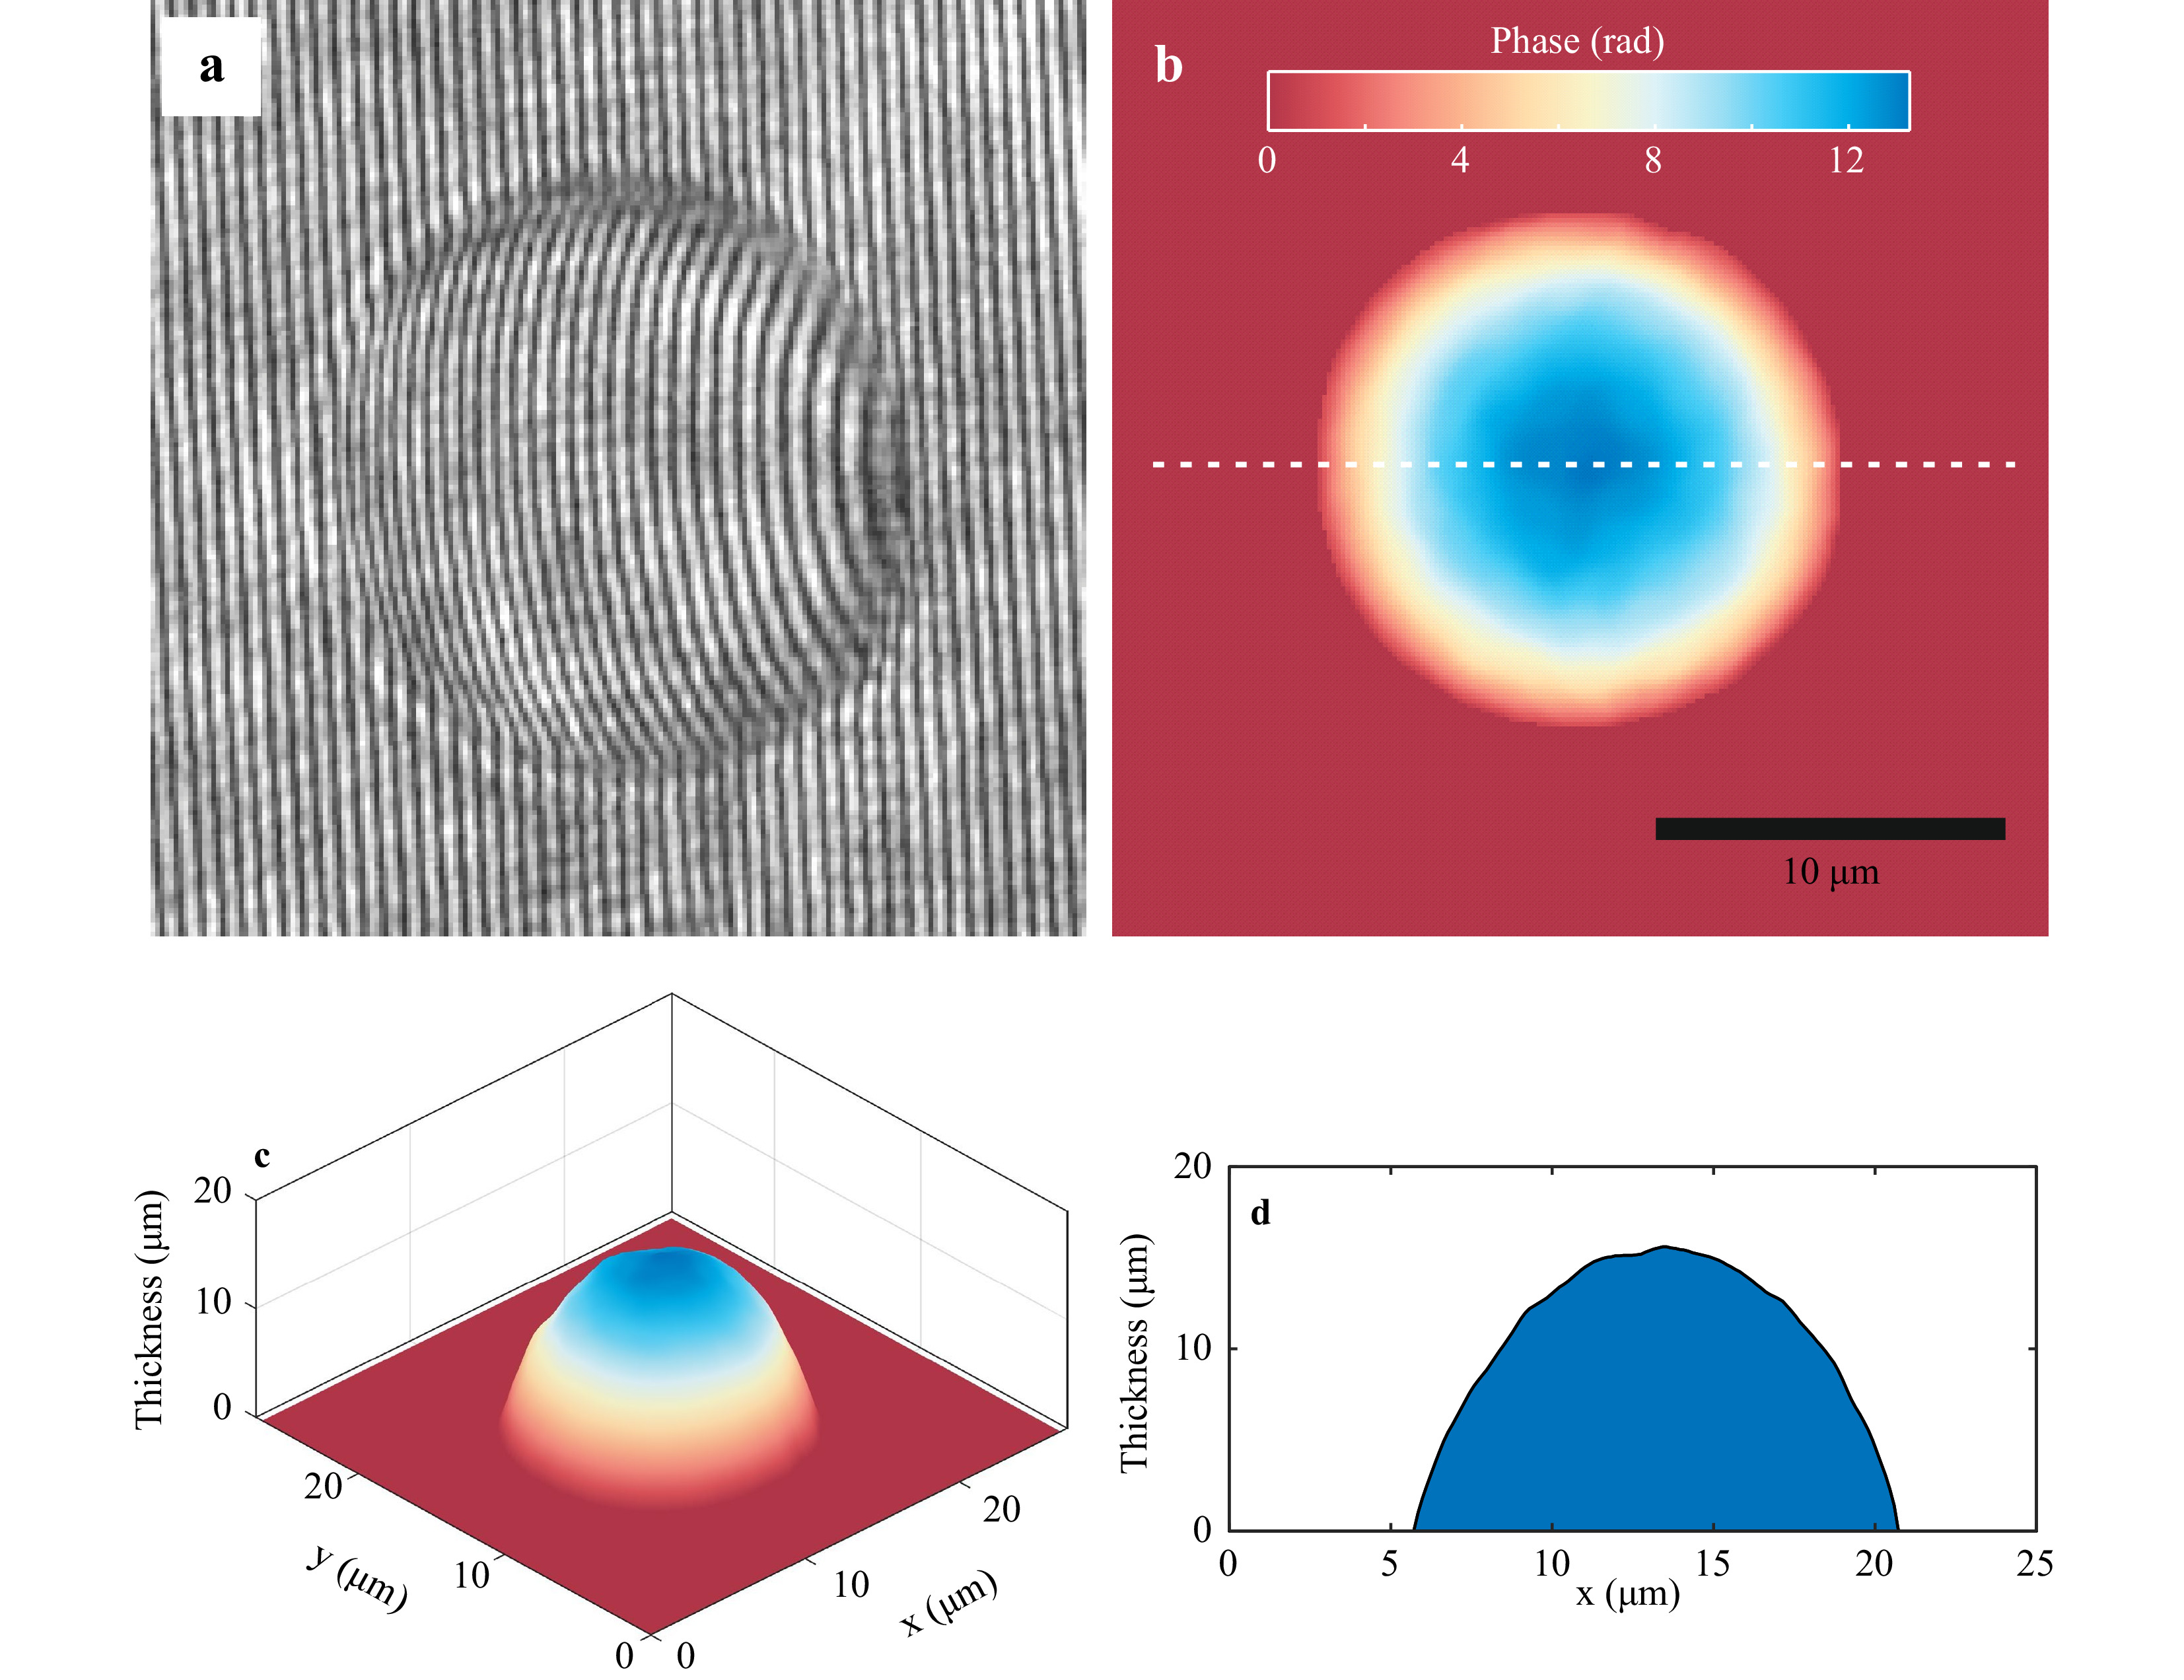
Fig. 3 Quantitative phase imaging using SRDHM module. a Portion of the hologram recorded with 15 μm polystyrene microspheres immersed in microscope oil. b Reconstructed phase distribution of the test sample obtained after phase subtraction. c Three-dimensional rendering of the thickness distribution obtained by using the refractive indices of the sample and the surrounding medium. d Cross-sectional thickness profile along the white dashed line in Fig. 3b.
-
The strength of the optical tweezer depends upon the trapping laser power and the characteristics of the trapped particle, including its shape50,51. The trapping force is computed by measuring the power spectrum (S) of the Brownian motion of the trapped particle. The Brownian motion of the trapped particle is measured by a quadrant photodiode (QPD), which acts as the position detection device42. The strength of the trap is also proportional to the trap stiffness, which in turn is proportional to the corner frequency (
$f_{\rm c} $ ) which is computed from the power spectral density (PSD) of the temporal fluctuations of the trapped particle. Therefore, the corner frequency is a reliable measure of trap strength48,50. The power spectrum of these Brownian fluctuations in position will have a Lorentzian distribution ($ S\left( f \right) = {A \mathord{\left/{\vphantom {A {\left( {{f^2} + f_c^2} \right)}}} \right.} {\left( {{f^2} + f_c^2} \right)}} $ , where A is a constant that depends upon the viscous drag coefficient and temperature). By fitting the resulting PSD with a Lorentzian distribution, corner frequencies in x and y directions can be computed. The corner frequency is sensitive to the deformation and shape change of the trapped particle and hence can be used for identification and classification. We have calculated the corner frequencies of the trapped micro-objects from the power spectrum. Corner frequency can be used to determine trap stiffness knowing the viscosity of the medium surrounding the trapped particle and the diameter of the trapped particle. Force can then be calculated using the stiffness value by measuring the displacement of the particle. However, we have used only the corner frequency values in the classification process as it is proportional to trap stiffness.As mentioned, measurement of the corner frequency (which also measures the force of the trap) requires power spectral analysis of the time-varying position of the trapped sample. QPDs detect the position by measuring the change in intensity of light falling on the detector and are fast compared to arrayed image sensors. The use of commercially available QPDs will increase the cost of the developed device. We used four photodiodes (OPT101) in a 2 × 2 format to develop a cost-effective alternative. However, using these photodiodes led to significant lateral separation (due to the large area of the diodes and circuitry involved) between the individual diodes compared to standard QPDs available commercially, making position determination difficult. This hurdle was overcome by using closely spaced multiomode optical fibers in 2 × 2 format to collect the laser light for position detection48. The trapping red laser beam was focused onto the front end of these fibers using a 25 mm focal length lens. The front end of the fibers was positioned such that the beam spot covered all four fibers. The light collected by the optical fibers was then delivered to the photodiodes at the module’s backend. This geometry is equivalent to four closely spaced photodiodes. A data acquisition system using Arduino Uno R3 was used for logging the output from the photodiodes at a sampling rate of 10 kHz48. Supplementary Fig. S2 gives details of the developed QPD system using multimode optical fibers.
-
The displacement data was recorded (at the rate of 10 kHz for a period of 20 s) for the polystyrene beads (5 μm and 15 μm diameter) to measure the corner frequency. The obtained power spectrum and the corresponding Lorentzian fit (solid black line) for 5 μm and 15 μm diameter samples are shown in Fig. 4. The corner frequency is determined from the Lorentzian fit to the power spectrum. Fig. 4a, b shows the PSD for the position variation in x and y directions, respectively, for 15μm diameter microsphere. Similarly, Fig. 4c, d show the spectrum for 5 μm diameter sample.
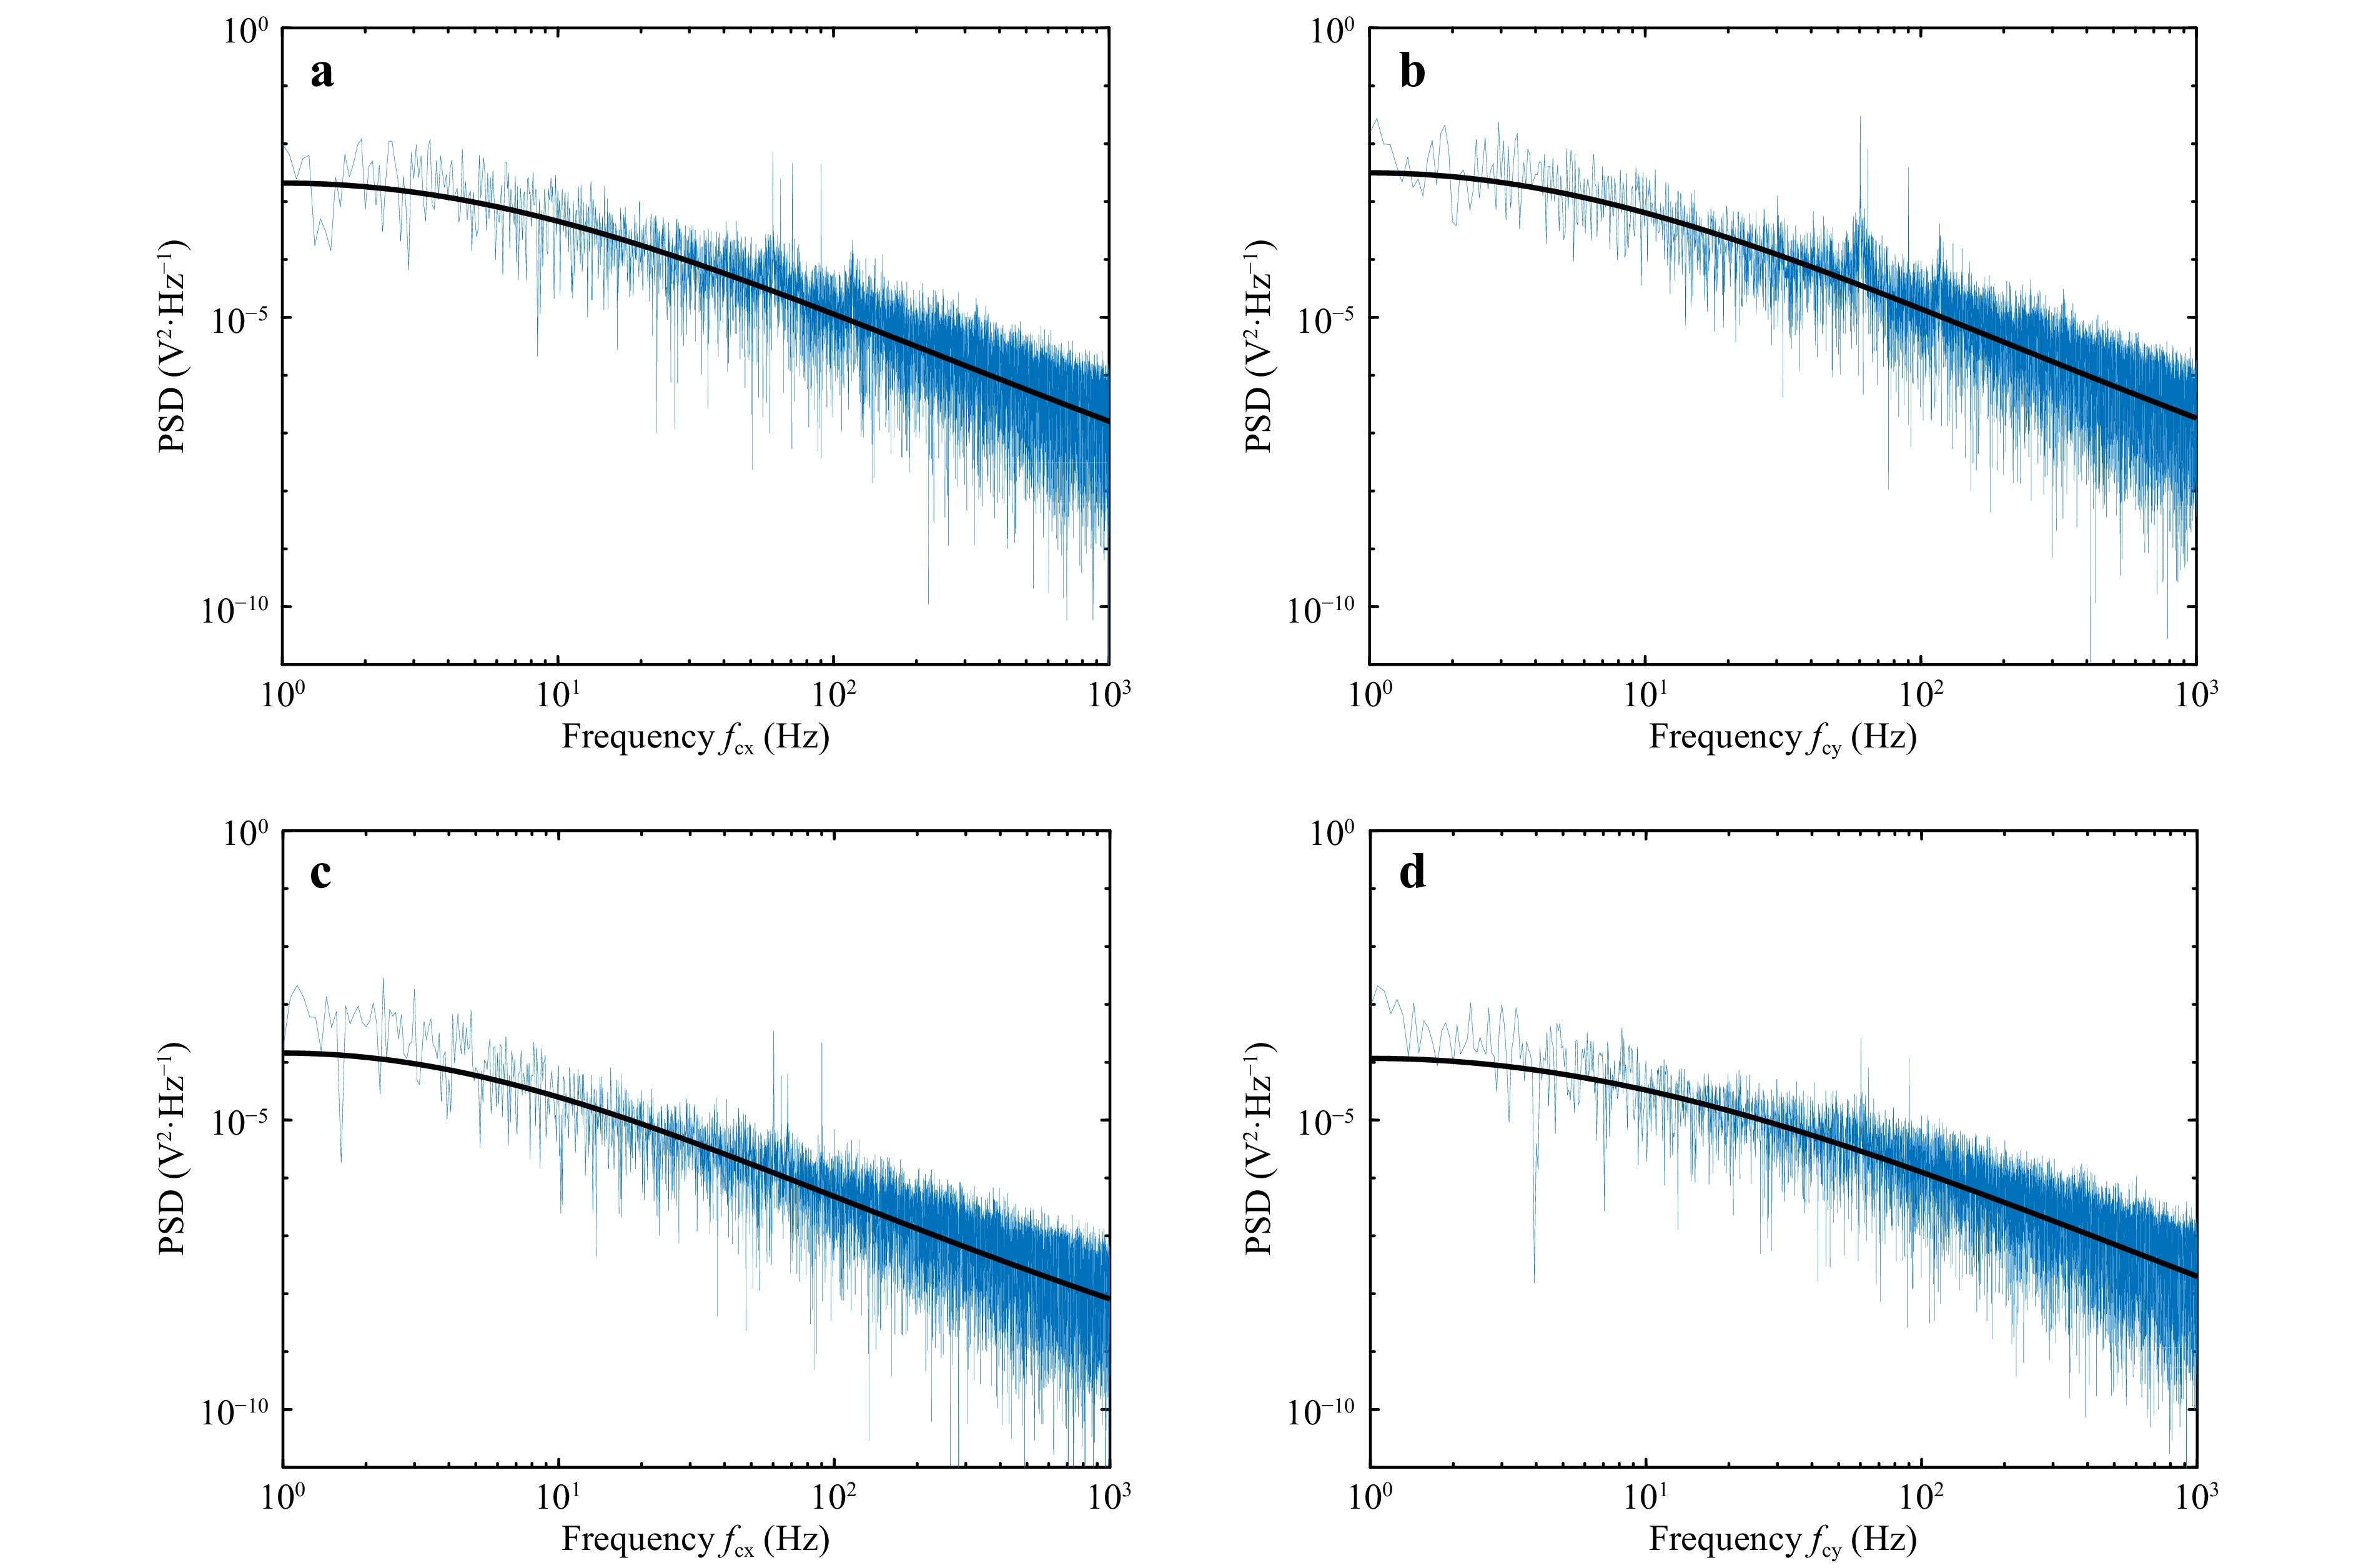
Fig. 4 Power spectrum measured using QPD. a, b power spectrum for 15 μm diameter particle obtained for particle Brownian motion in x-direction and y-direction respectively. c, d power spectrum for 5 μm diameter particle for motion in x-direction and y-direction respectively. Solid black line represents the Lorentzian fit to the power spectrum.
Measured corner frequencies for both classes of microspheres in x and y direction are shown in Fig.5a, b, respectively. The measured corner frequencies for 15 μm diameter microspheres were
$f_{\rm{cx}} $ = 3.87 ± 2.01 Hz and$ f_{\rm{cy}}$ = 4.08 ± 2.12 Hz. The measured corner frequencies for 5 μm diameter microspheres were$f_{\rm{cx}} $ = 8.63 ± 3.03 Hz and$f_{\rm{cy}} $ = 8.37 ± 2.97 Hz.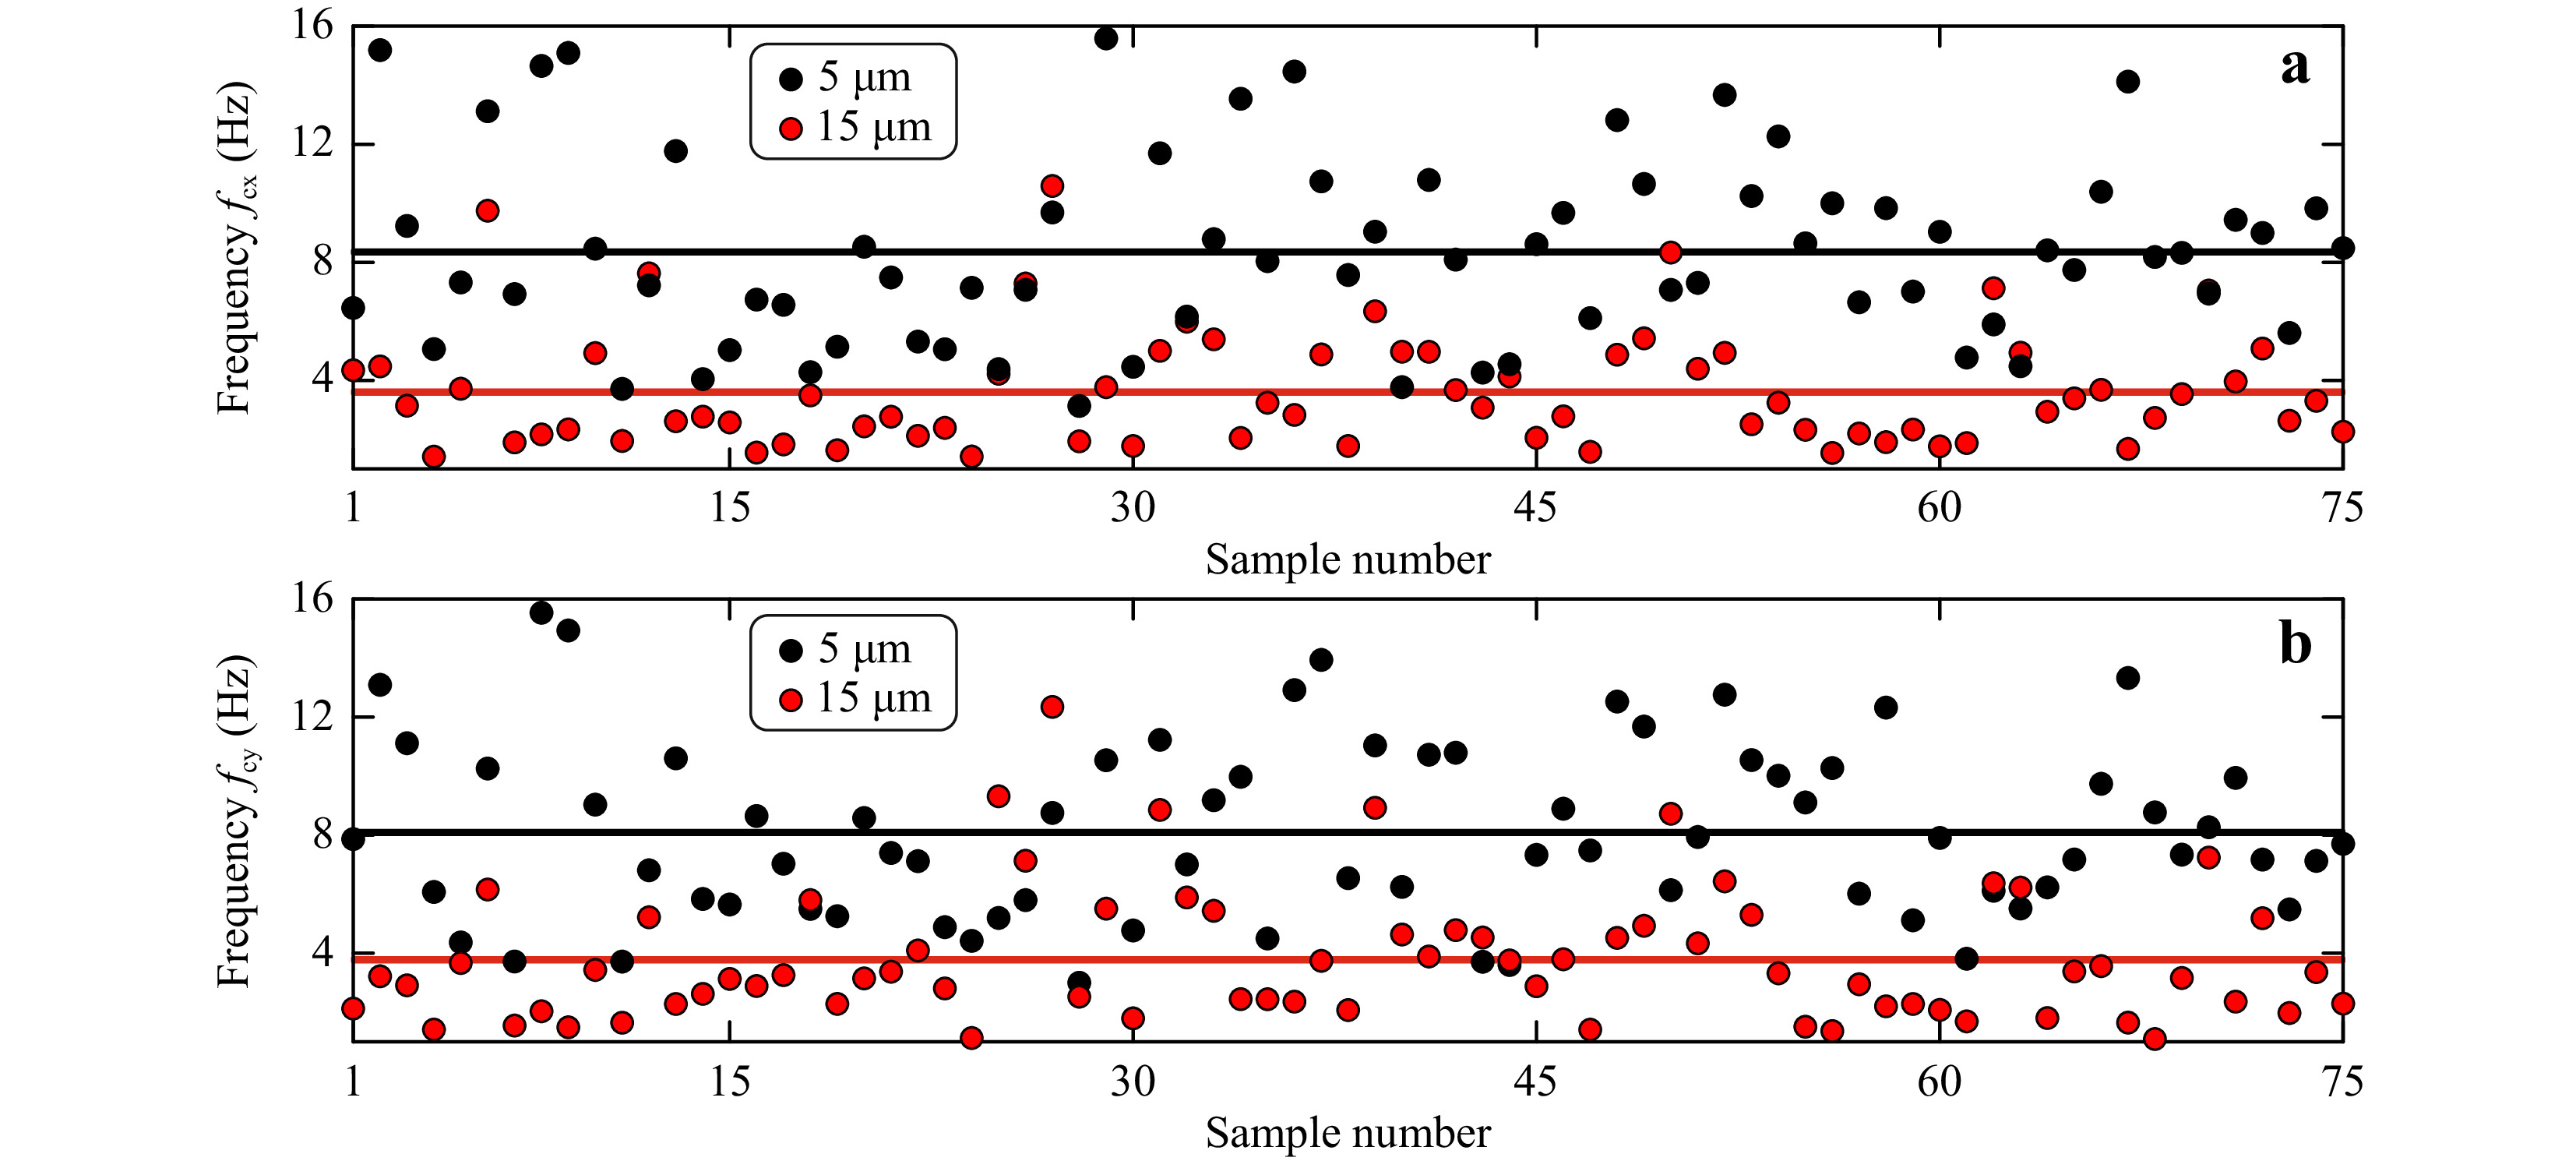
Fig. 5 Measured corner frequencies for 15 μm and 5 μm diameter polystyrene microspheres computed from a power spectrum for Brownian motion in x-direction and b power spectrum for Brownian motion in y-direction. Solid black line is the mean corner frequency value for 5 μm particle, and the solid red line represents the mean corner frequency value for 15 μm particle.
-
Position information of human red blood cells (RBC) in phosphate buffer solution (PBS) was also recoded using the QPD and used for determination of corner frequency. The studies used red blood cells extracted from healthy blood samples and blood samples tested positive for Sickle Cell Disease (SCD). Fig. 6a, b show the power spectrum for motion in the x-direction for healthy and SCD positive red blood cells, respectively. In the case of SCD, red blood cells are deformed compared to heathy red blood cells, which will be reflected as a change in the corner frequency38.
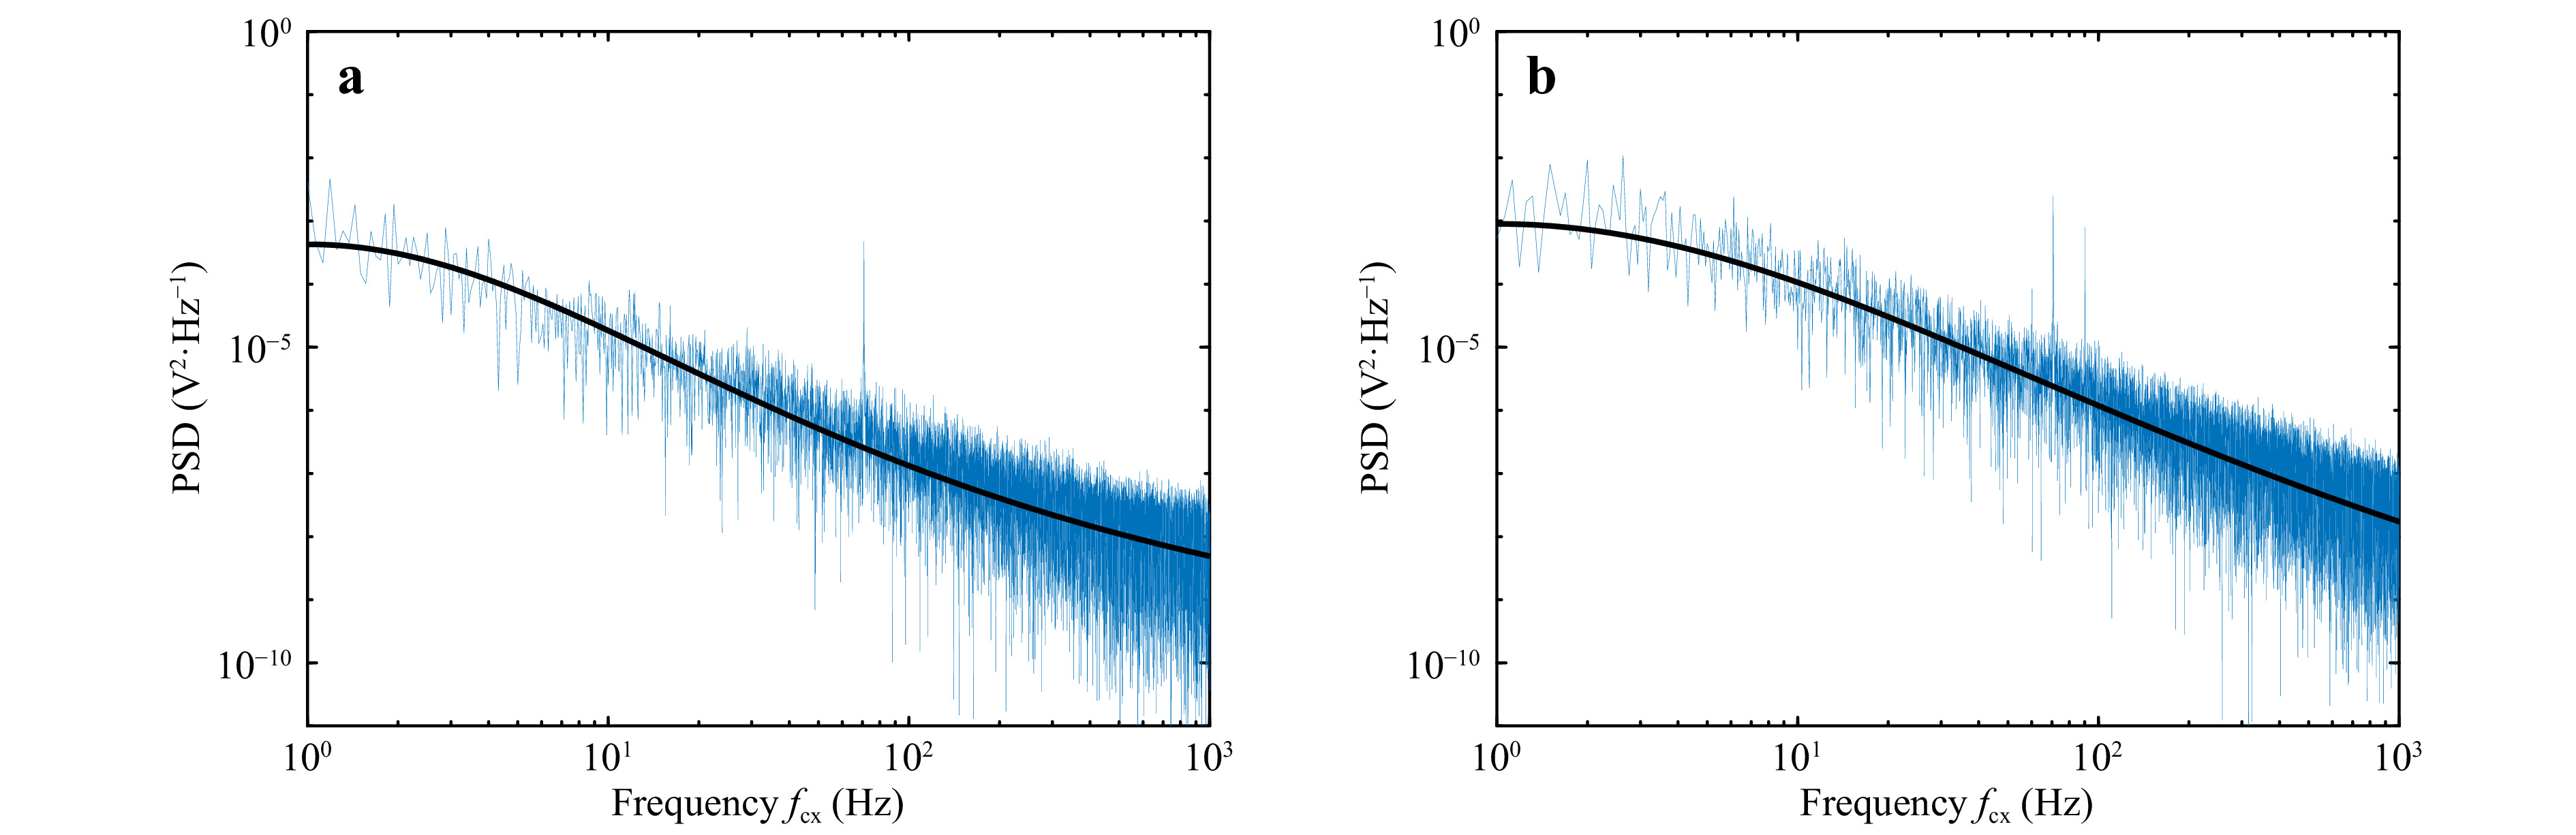
Fig. 6 Power spectrum for red blood cells. a Healthy sample. b SCD positive sample. The solid black line represents the Lorentzian fit to the power spectrum.
Fig. 7 shows the measured corner frequency (
$f_{\rm{cx}} $ ) for the investigated red blood cell, obtained from healthy sample and sickle cell disease positive sample. The mean values of the corner frequencies are shown as solid lines in the figure. In the case of RBCs, the obtained corner frequency alone may not be enough to determine the class of the cells.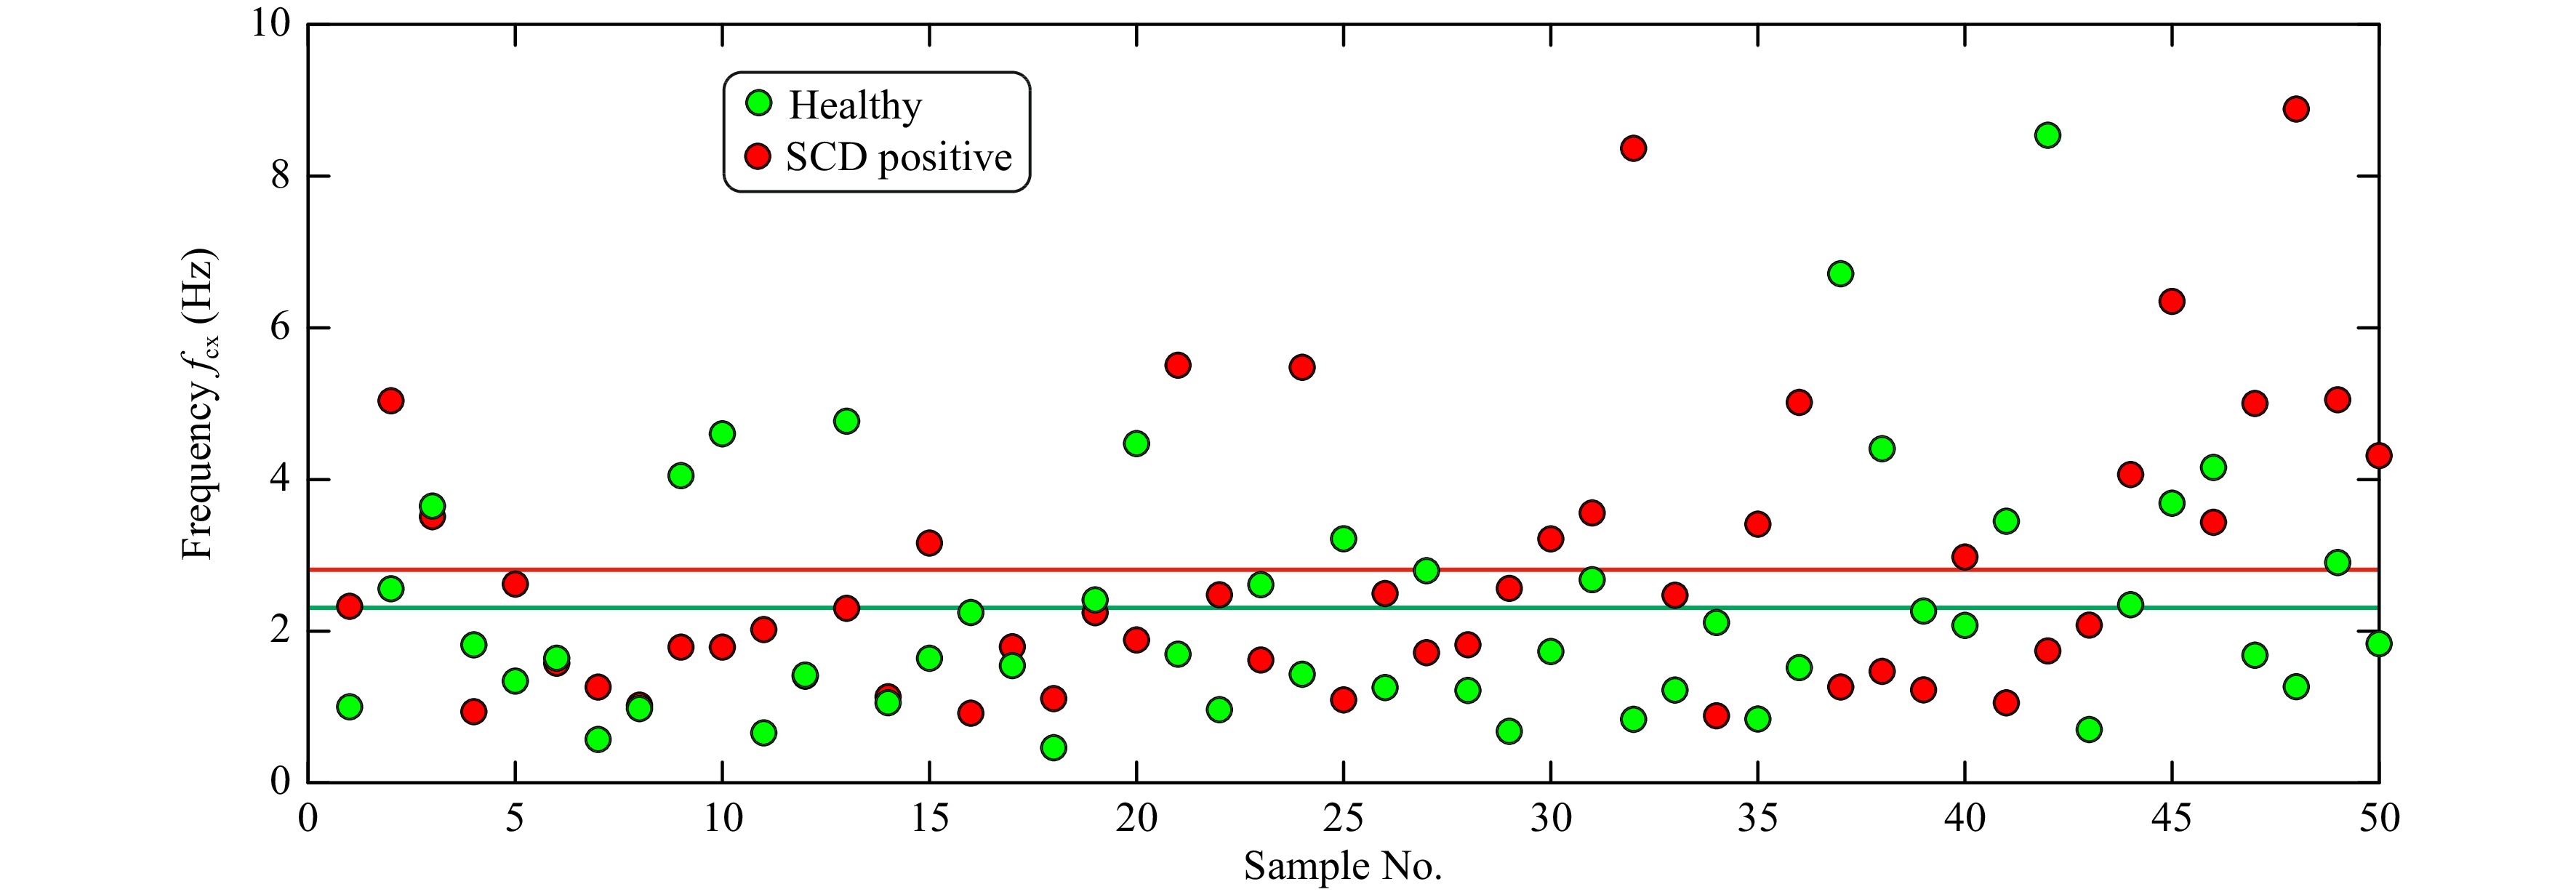
Fig. 7 Measured corner frequencies for healthy and SCD positive red blood cells computed from power spectrum for Brownian motion in x-direction. Solid redline line represents the mean corner frequency value for SCD positive sample, solid green line represents the mean corner value for healthy sample and solid black line represents mean corner frequency value obtained considering both classes of RBCs.
-
Quantitative phase imaging of trapped particles was achieved using the integrated SRDHM module shown in Fig. 1a. Using SRDHM a significant number of sample features based on sample thickness and its time variation could be extracted. From the thickness profile 20 biophysical and biomechanical features of the cells were extracted21-24. The extracted cell features were diameter, eccentricity, mean thickness, maximum thickness, minimum thickness, median thickness, coefficient of variation of thickness, skewness of thickness distribution, kurtosis of thickness distribution, sphericity, projected area, curved surface area, total surface area, surface area to volume ratio, projected area to volume ratio, amplitude of thickness fluctuation, mean peak frequency of thickness fluctuation, amplitude of volume fluctuation and peak frequency of volume fluctuation. These features contain vital information required for cell classification.
For quantitative phase imaging of microspheres, a video of the resulting holograms was recorded at the rate of 30 Hz for a period of 16 s. Supplementary Video V4 illustrates the time series holograms. Each hologram was extracted from the video and numerically reconstructed individually, and the sample thickness information was computed19-21. Fig. 8a shows a hologram of a 15µm diameter polystyrene bead immobilized by the trap at one time instant. Fig. 8b shows the thickness distribution at the same time instant obtained from the reconstructed quantitative phase map. Fig. 8c shows the time varying thickness profile of the trapped 15 μm polystyrene sphere at the points shown in Fig. 8b. The effect of the Brownian motion of the sample is evident from this plot. The variation in the thickness happens since the trapped microspheres shifts its position as can be seen from the Video V4. As trapped microsphere shifts, the optical path length of the light passing through it changes (due to change in angle of incident ray and as well as the length travelled through the sample), leading to change in optical thickness at that spatial point. The physical and mechanical features of the sample extracted from the hologram, along with corner frequency information can lead to better sample classification. The fluctuation profile of the sample is obtained by computing the standard deviation of the thickness variation in every 2 s time window and is shown in Fig. 9.
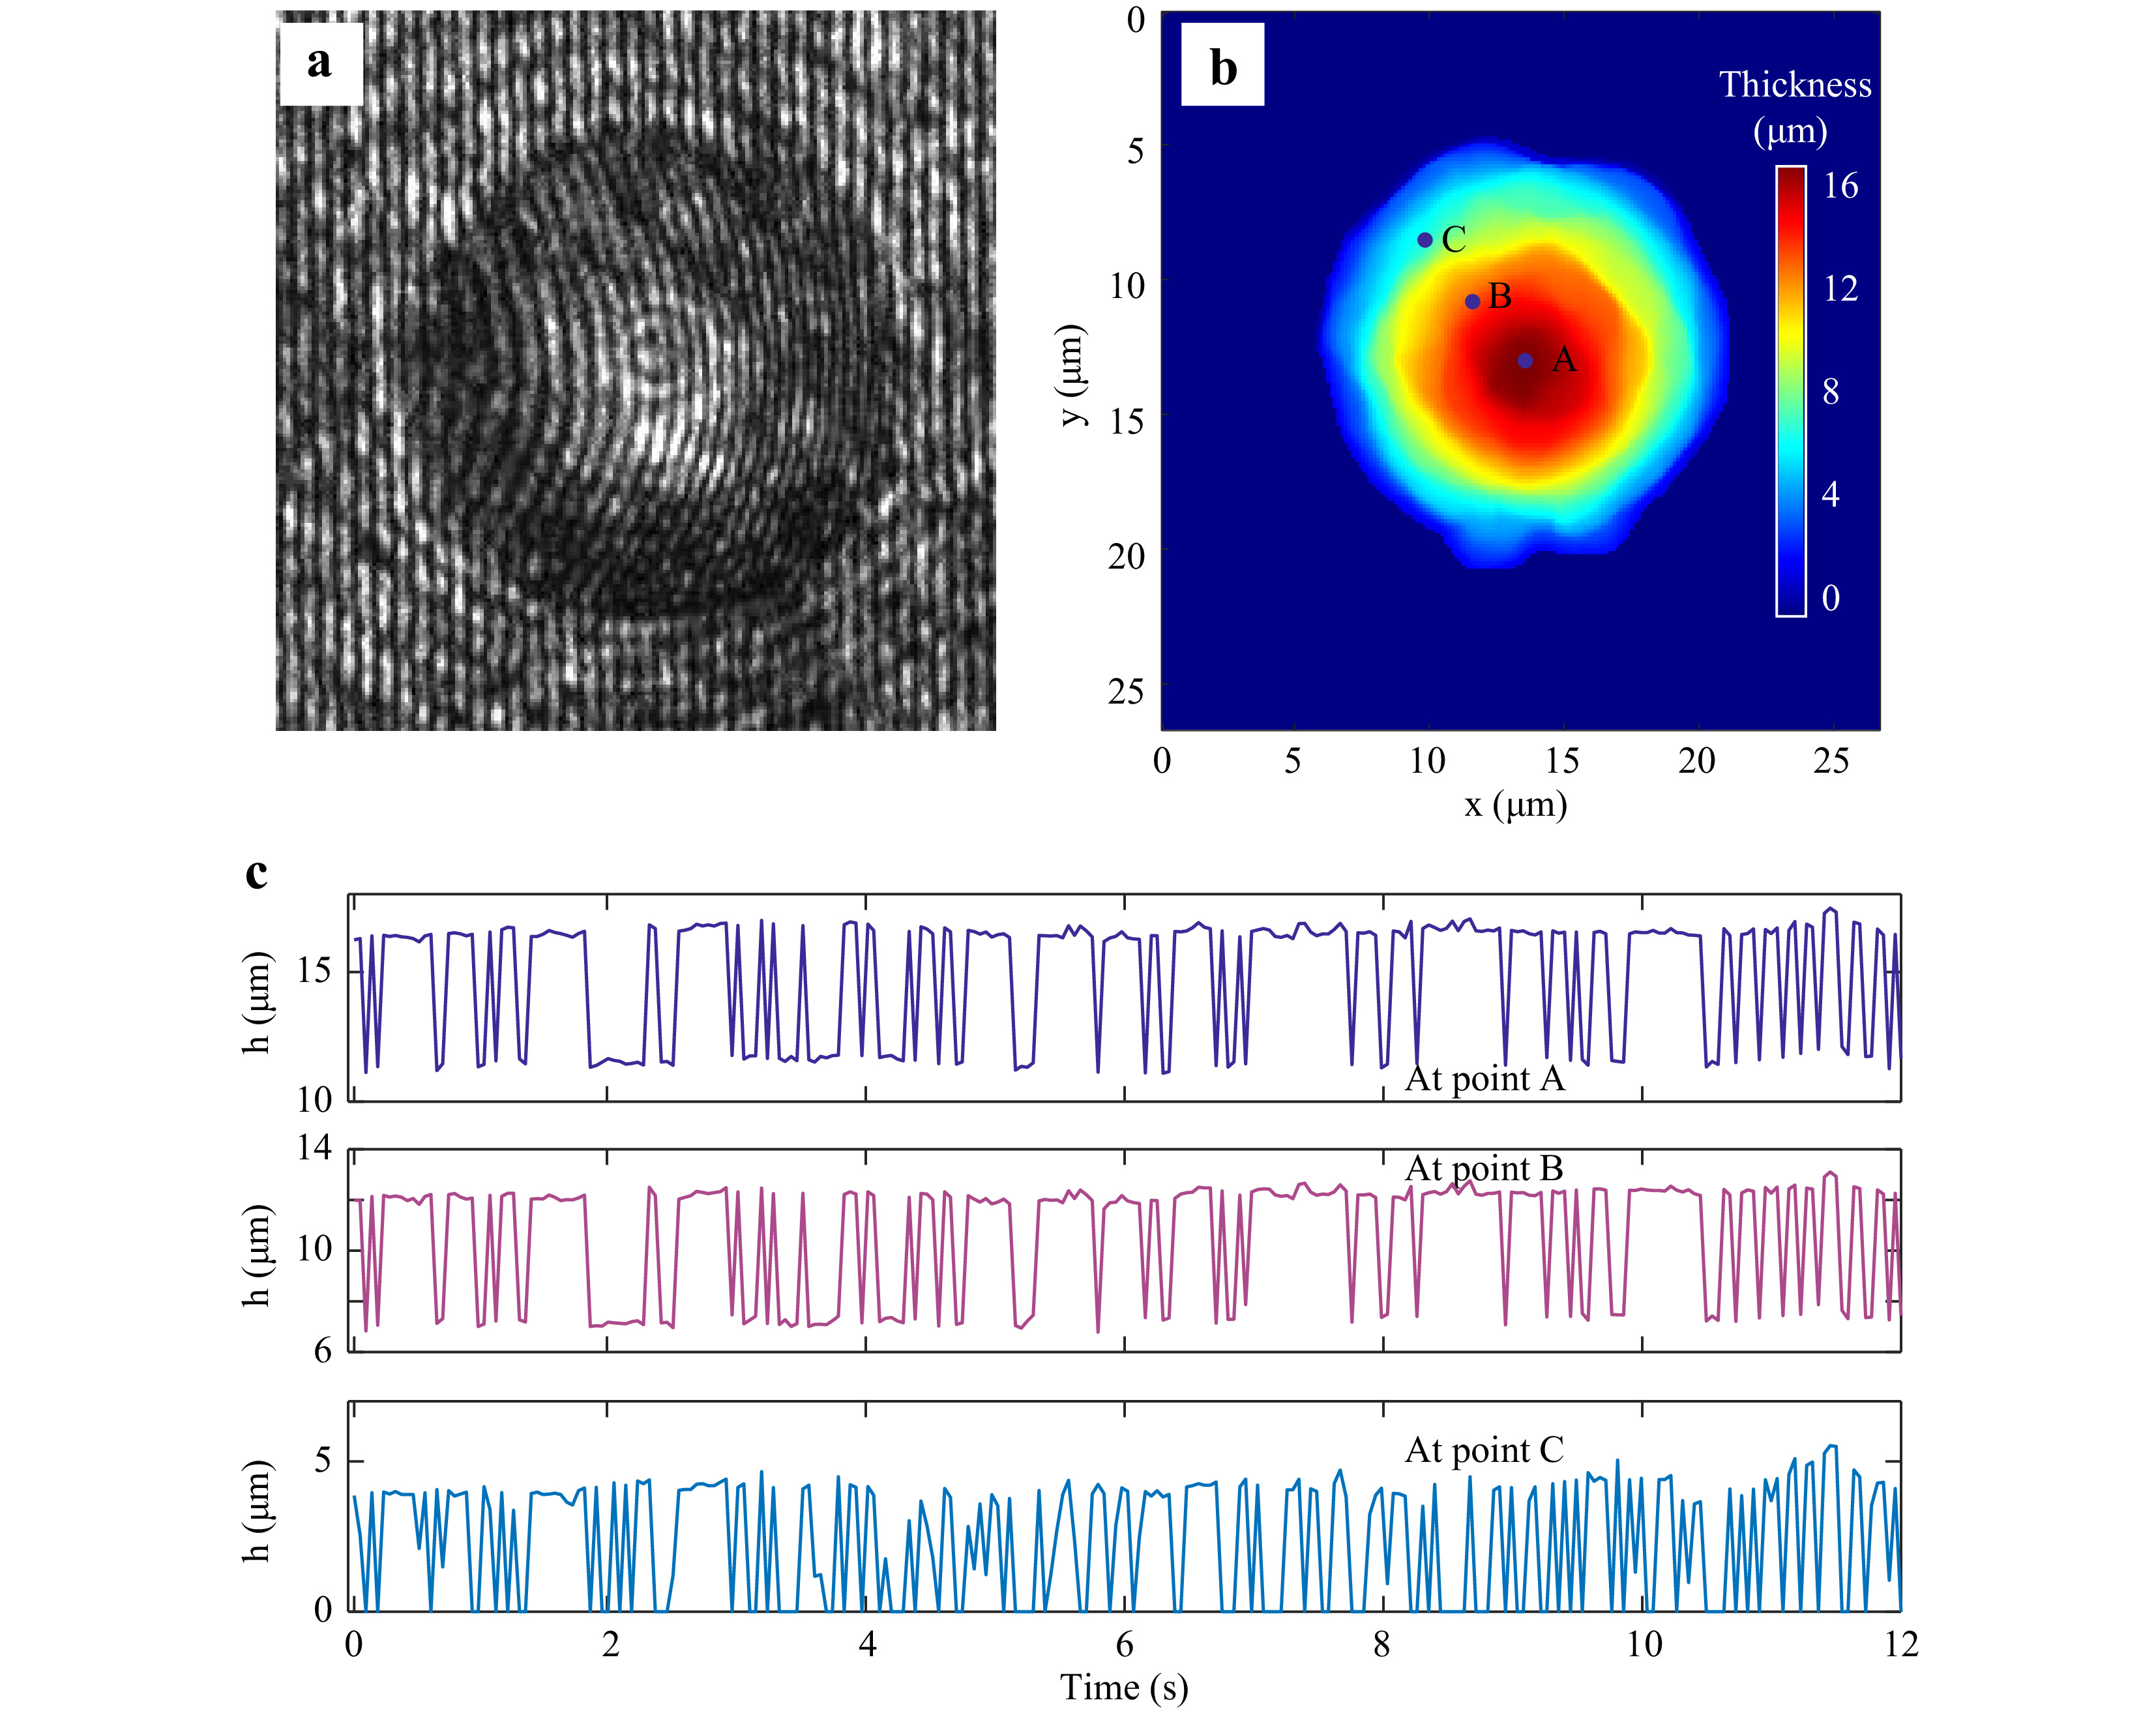
Fig. 8 Digital Holographic imaging of trapped microsphere. a Portion of the hologram of the trapped 15 μm diameter polystyrene microsphere. b Reconstructed thickness profile. c Time varying thickness at the points shown in Fig. 8b, obtained from a series of holograms.
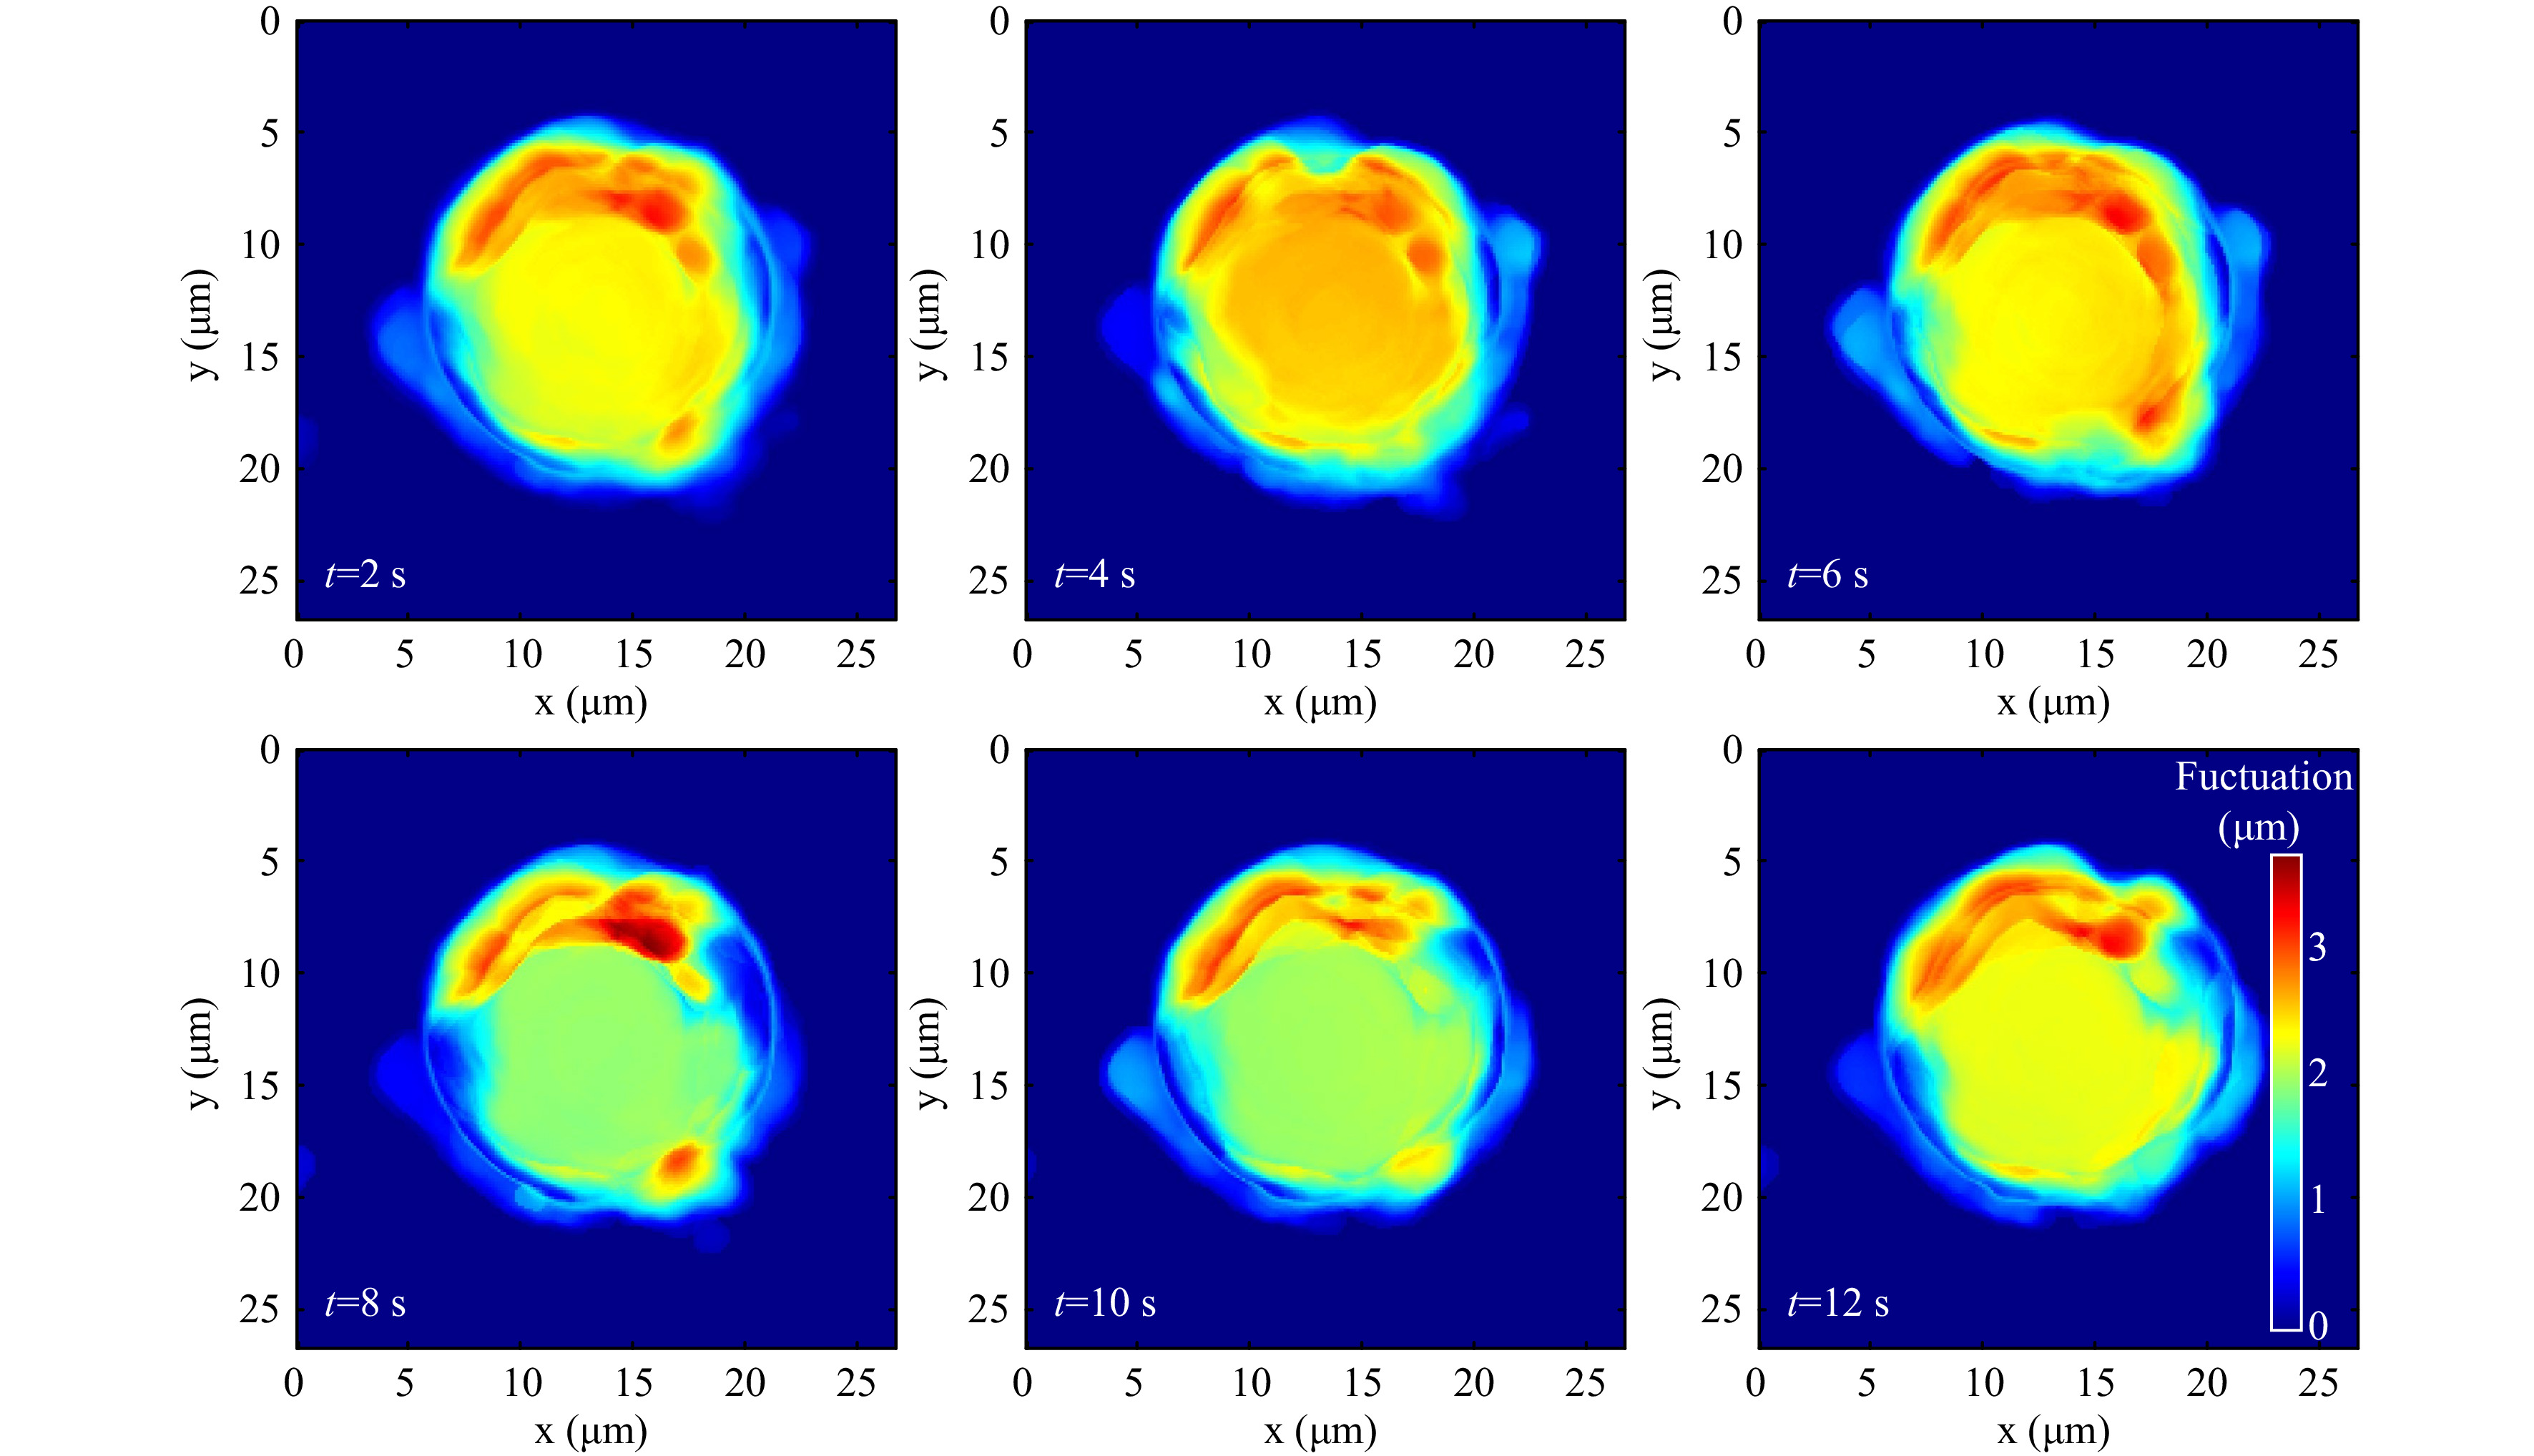
Fig. 9 Thickness fluctuation of the trapped 15 μm polystyrene microsphere obtained from the standard deviation of the time varying thickness profile.
-
Red blood cells in PBS were immobilized using the developed integrated system and their holograms were recorded. Fig. 10a shows the portion of the recorded hologram of an immobilized healthy RBC. The optical thickness information obtained from the numerically reconstructed hologram is shown in Fig. 10b.
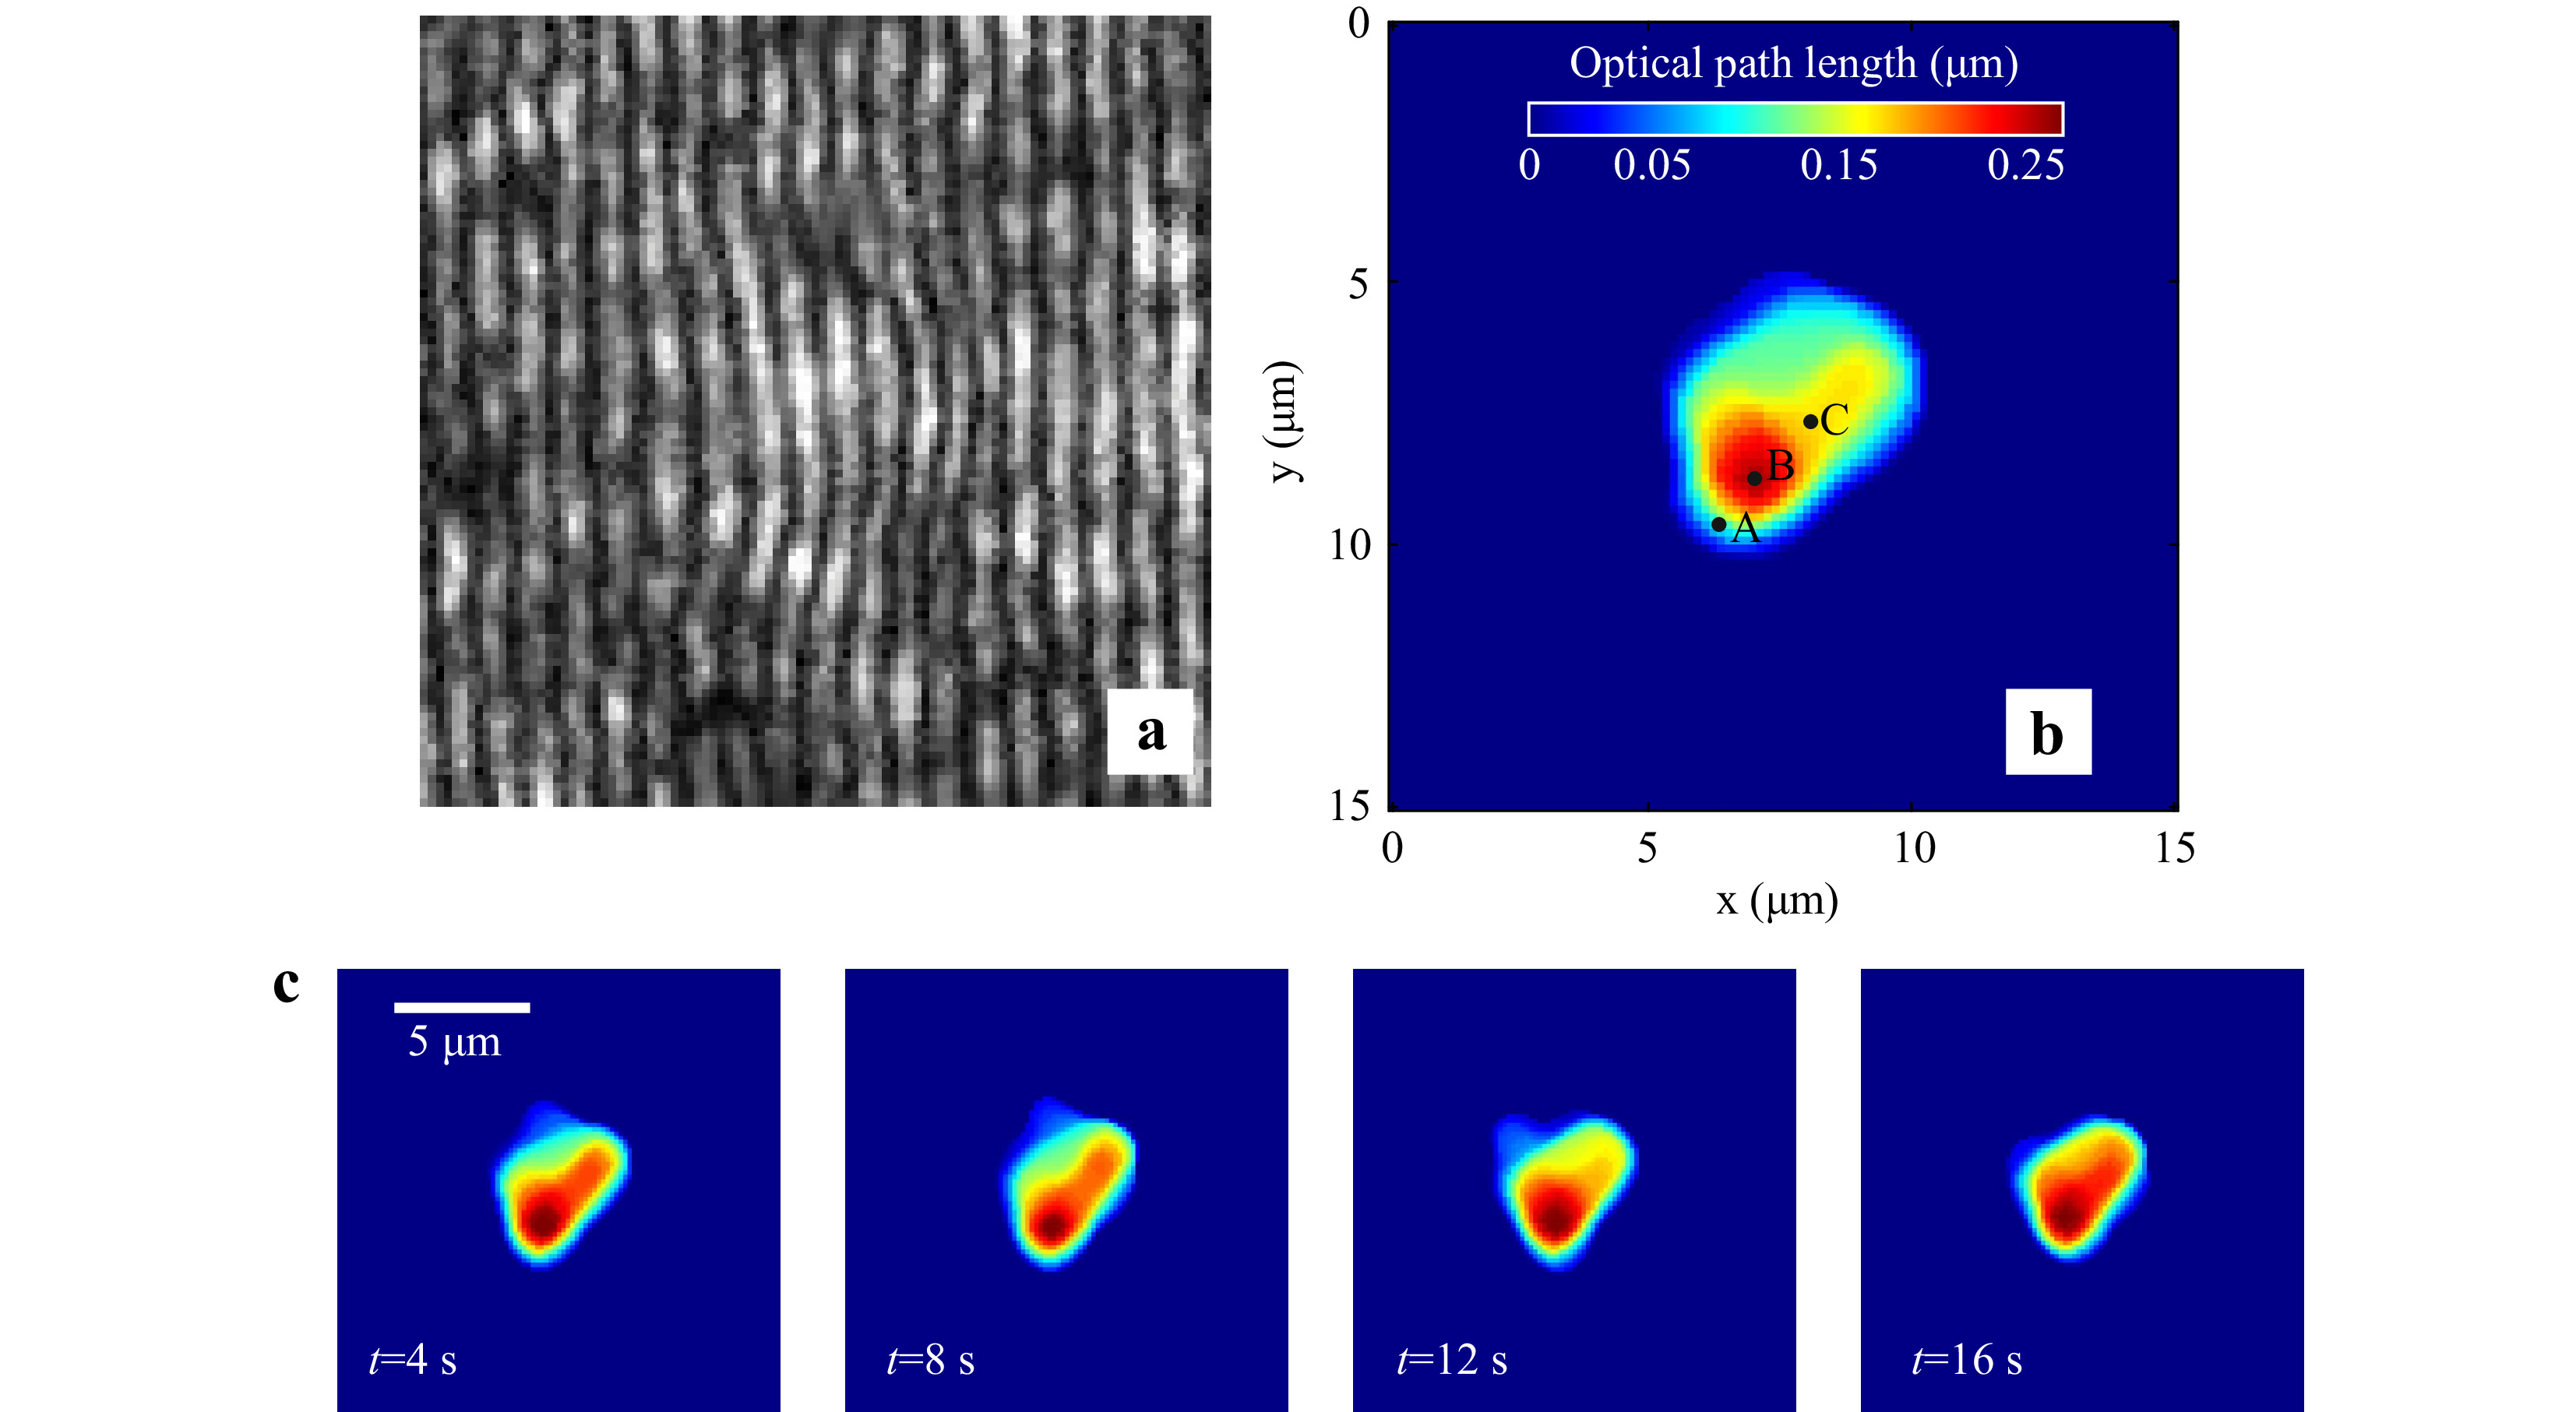
Fig. 10 Digital Holographic imaging of trapped red blood cell. a Portion of the hologram of the trapped RBC. b Reconstructed thickness profile of RBC. c Time varying quantitative phase images of the trapped cell.
A time series of holograms can also be used for extraction of time varying cell morphology (Supplementary Video V5, shows the time series holograms of trapped RBC). After extracting the cell thickness profile at each time instant, the cell thickness distribution as a function of time can be determined. Fig. 10c shows the cell thickness at different time instances. Supplementary Video V6 provides a detailed view of cell thickness as a function of time.
Quantitative phase maps can also be used to compute the thickness fluctuations of the trapped red blood cell. As in the case of microspheres, in the case of red blood cells also, the time varying thickness at each point can be obtained and analyzed. Fig. 11 shows the optical thickness variation of RBC at the points shown in Fig. 10b. Here the optical thickness variation rather than the real thickness is shown. Optical thickness represents thickness multiplied by refractive index difference between the cell and the surrounding medium. In fact, classification of cells can be achieved using features based on optical thickness negating the need for knowing the exact refractive indices of the cells, which may vary for cells of different classes.
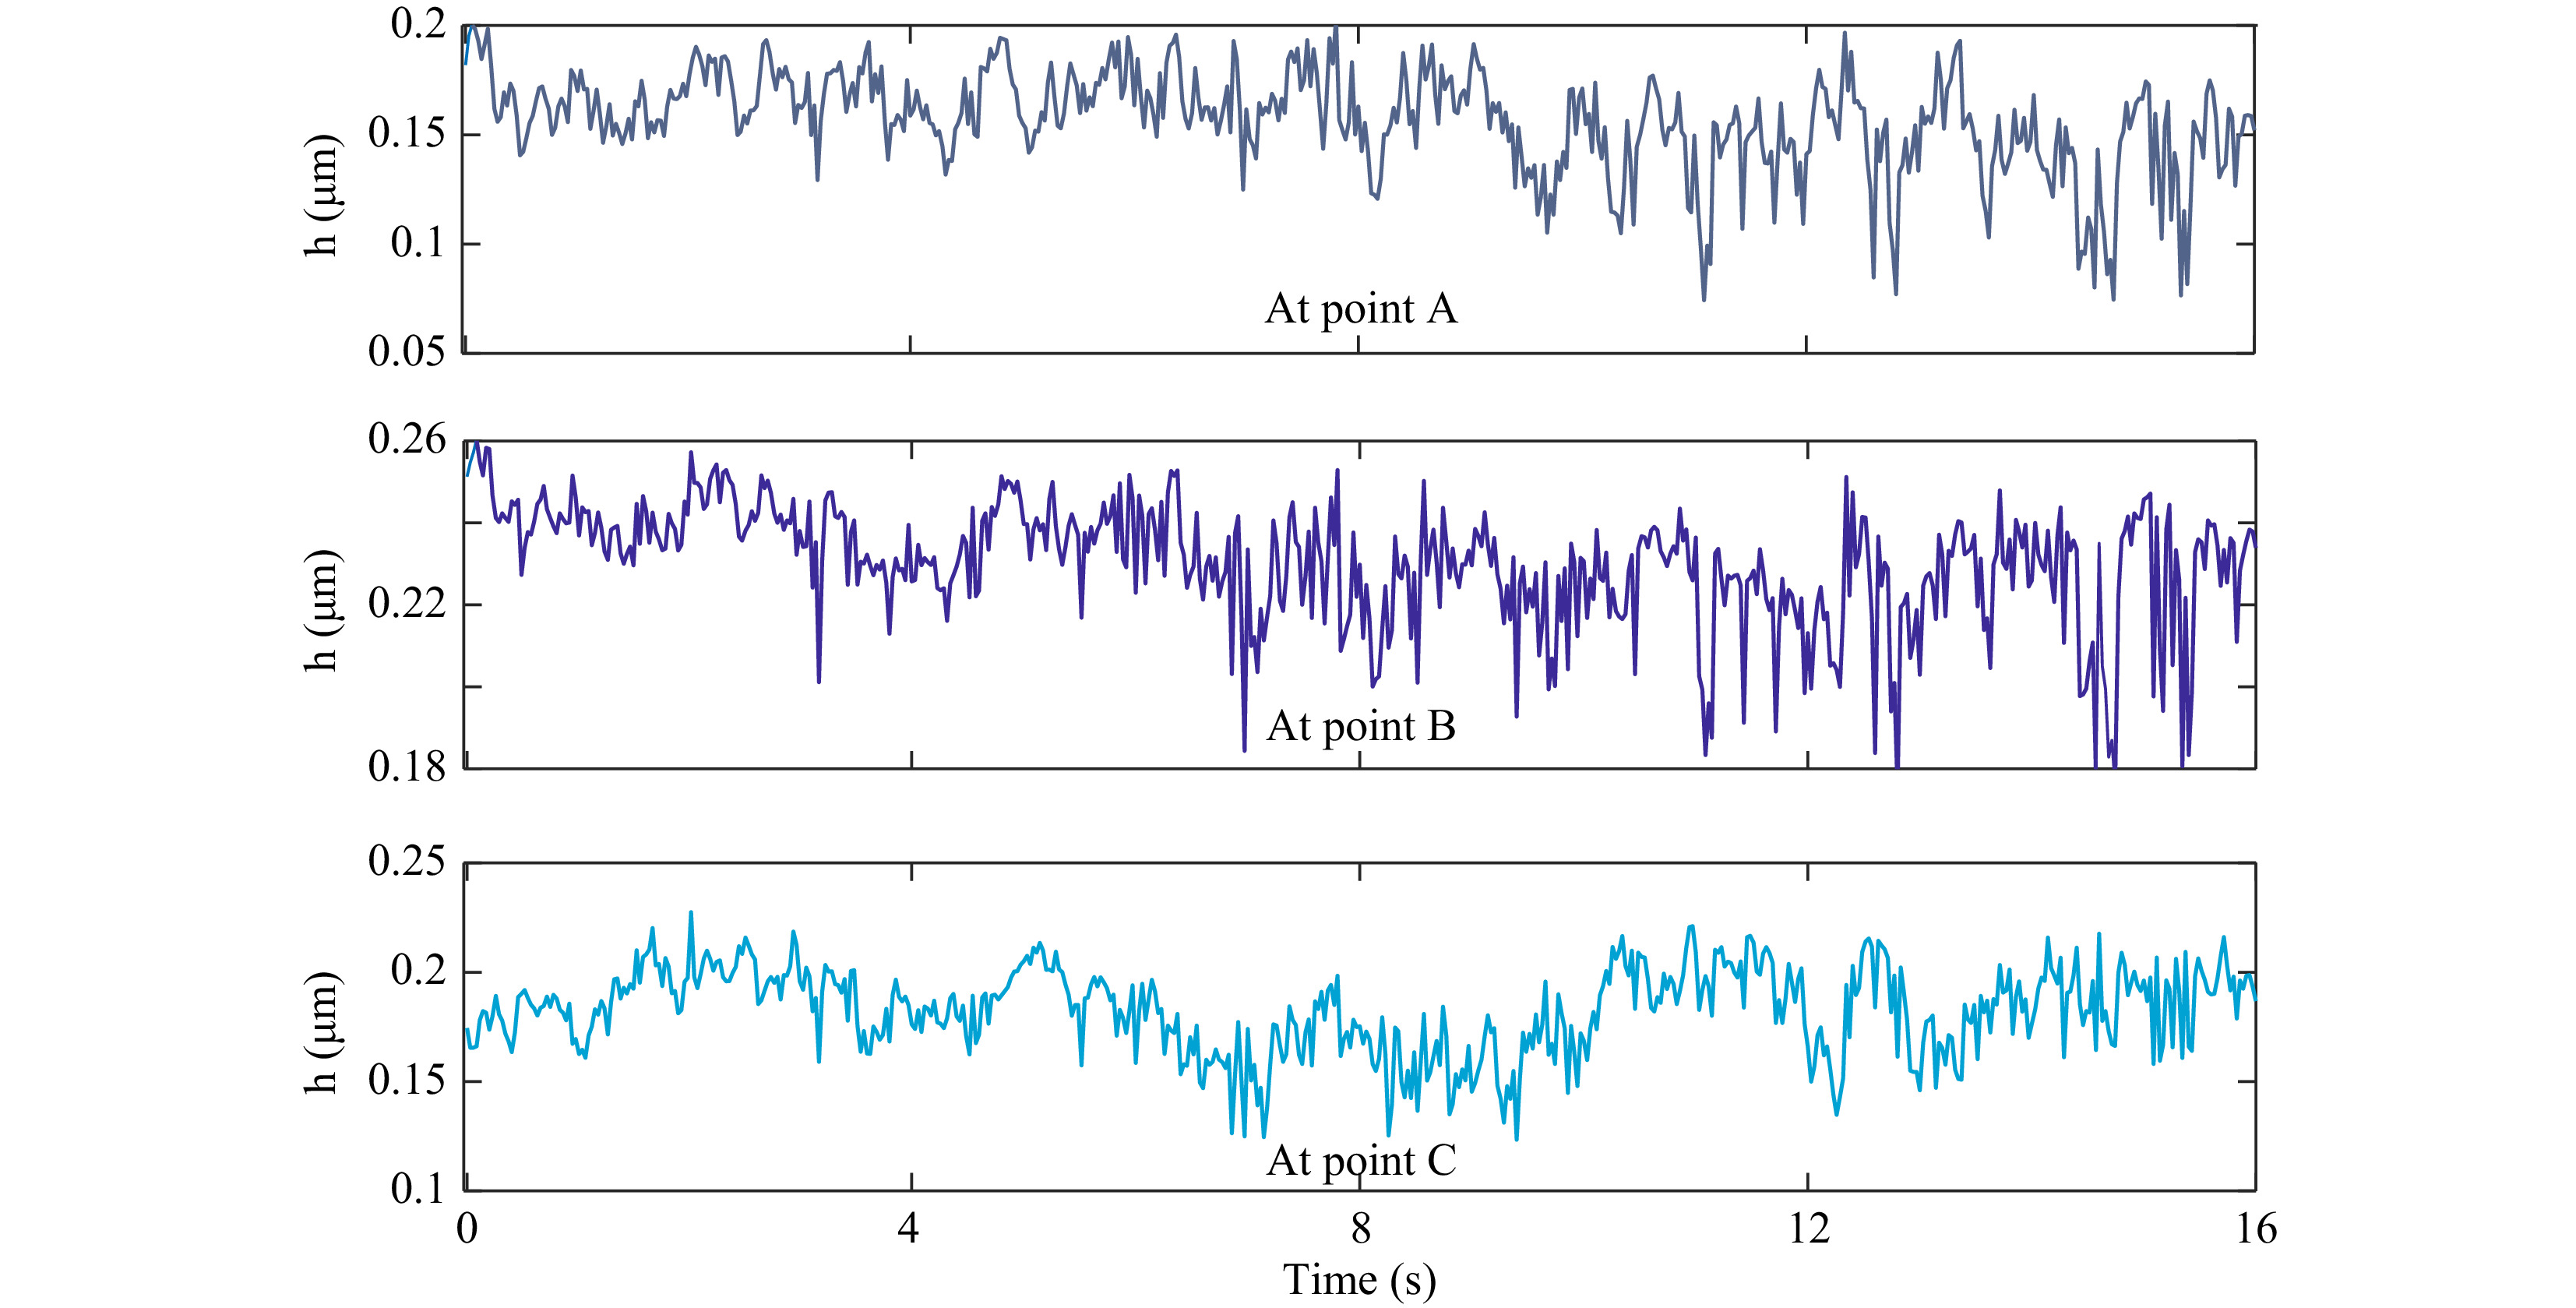
Fig. 11 Time varying optical thickness of the trapped blood cell at the points shown in Fig. 10b. Standard deviation of this thickness variation provides the cell thickness fluctuation.
The standard deviation of the thickness variation in a time window provides the cell thickness fluctuation profile as shown in Fig. 12. Supplementary Video V7 shows the fluctuation profile computed from thickness variation occurring in each second.
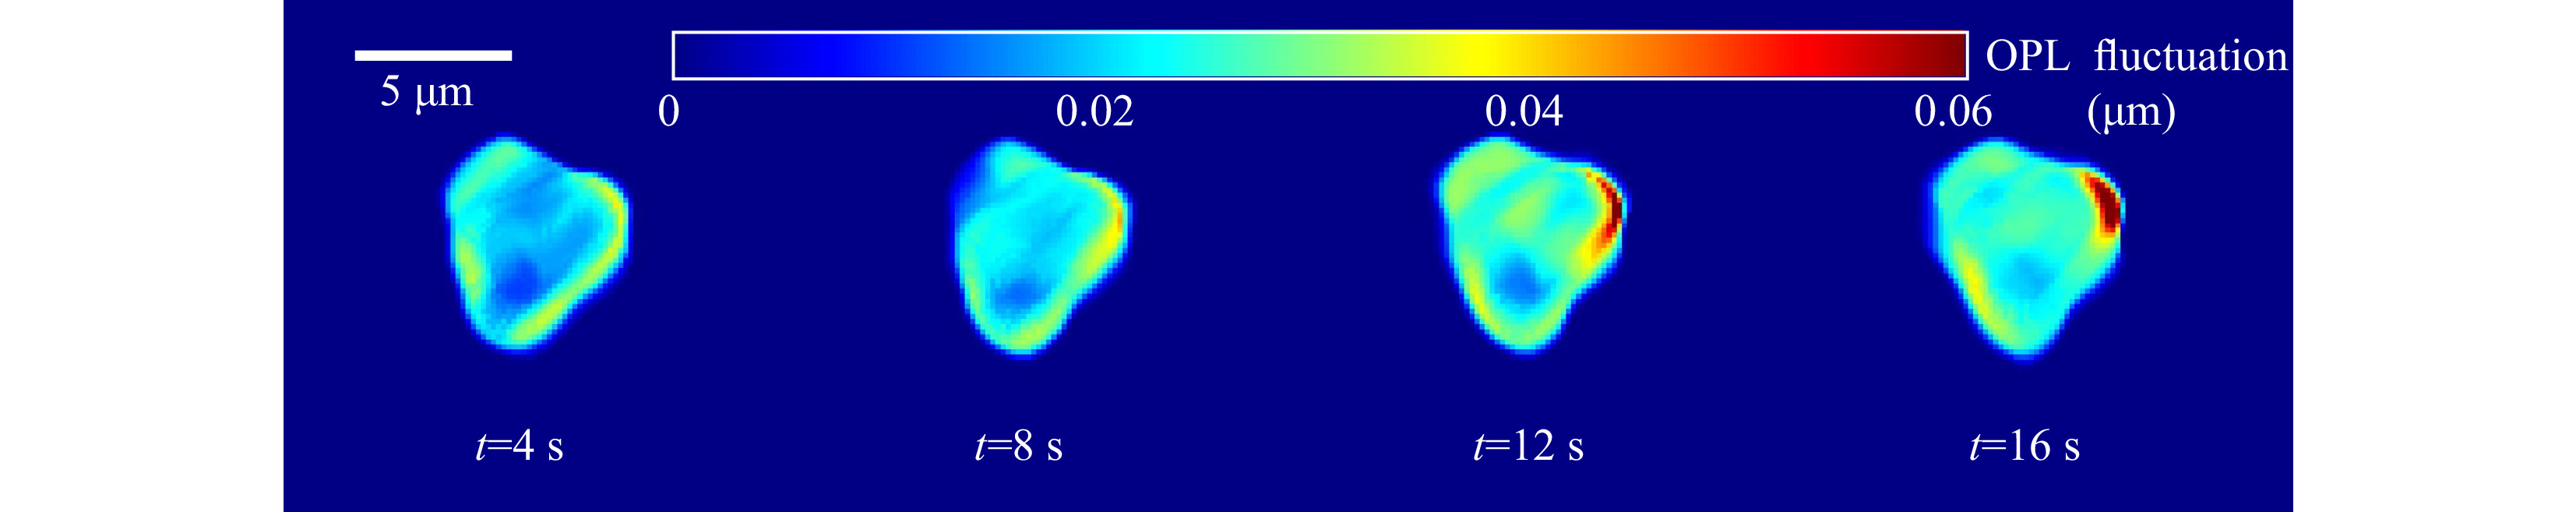
Fig. 12 Cell optical thickness fluctuation of trapped red blood cell at various time instances.
-
The developed low-cost optical tweezer can trap microparticles and manipulate them by moving the lens of the optical pickup unit. The in-house developed QPD provides the position data of the trapped particles and their corner frequency. In the case of red blood cells, as can be seen from Fig. 7, only corner frequency many not be useful in cell classification. To check the technique’s effectiveness in classifying red blood cells into healthy and SCD, Machine Learning model based on Support Vector Machine (SVM)49, which is ideal for classification problems, was trained. The training used the extracted feature values of 50 healthy and 50 SCD cells. Initially, only the corner frequency information was used to classify the cells. SVM with a Gaussian Kernel and five-fold cross validation provided a classification accuracy of 62%. However, the proposed integrated optical trap and SRDHM also yield quantitative phase images of trapped micro-particles including living cells and provide a wide range of features based on sample thickness and its time variation, which is normally not available in conventional optical tweezers. These parameters and the Brownian motion spectral information can be used in machine learning algorithms to classify the cells. The extracted morphological features along with the corner frequency information was then used to train a machine learning model. Fig. 13 provides the classification results in the form of a confusion matrix.
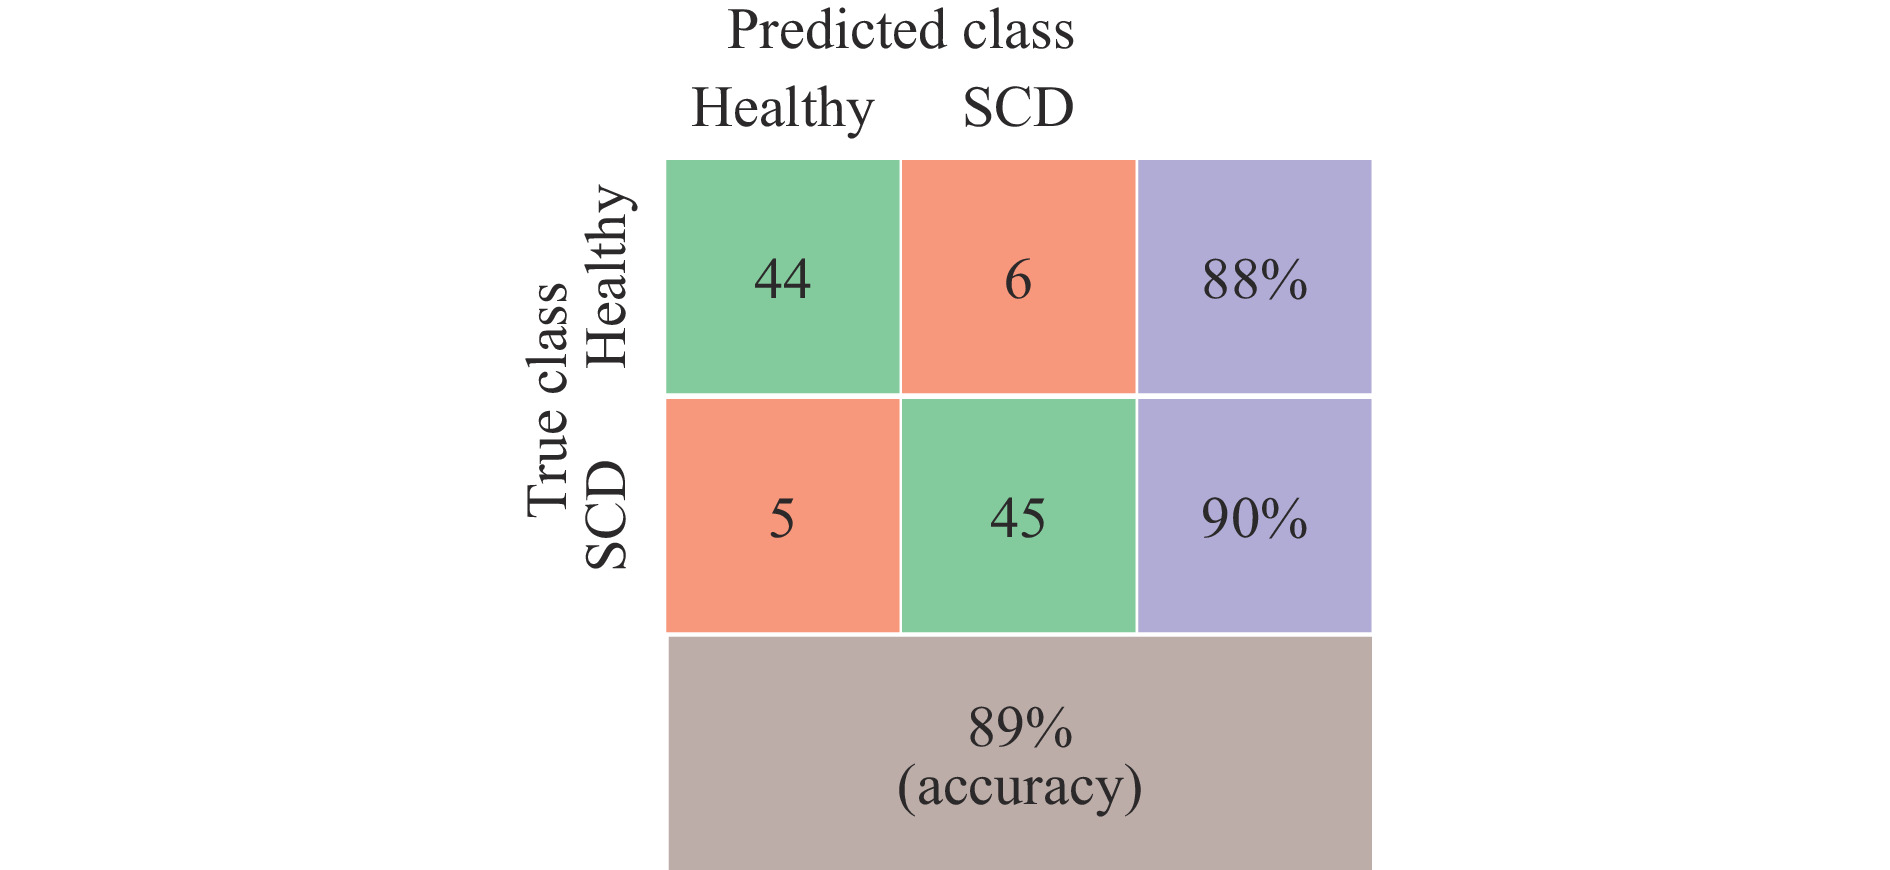
Fig. 13 Confusion matrices for classification of red blood cells.
The inclusion of morphological features improved the classification accuracy to 89%. The trap beam (focused laser beam) may also affect the sample morphology and lead to its deformation, which may depend upon the class of cells investigated. This aspect has to be investigated further.
The optical trap, which is derived from the optical pickup unit of the DVD burner provides good enough immobilization of the investigated particles. It is not necessary that a DVD optical pick must be used in the trapping of the microparticles.
Low-cost laser diode modules, both in the electromagnetic spectrum’s visible and infrared regions, are readily available. These lasers can be coupled with a lens mounted on a voice coil (or a scanning mechanism) to act as the micromanipulation unit. This will be further investigated in the future.
The technique discussed in the manuscript utilized a CCD array to record holograms. However, it is not necessary to use costly CCD arrays to record holograms. Low-cost digital arrays like webcams can also provide high quality quantitative phase images which are comparable to those offered by CCD arrays48. Fig. 14a shows the portion of the hologram of a 15 μm diameter polystyrene microsphere recorded using a commercial VGA webcam array. The quantitative phase profile of the sample was reconstructed after subtraction of the phase obtained from reference hologram and is shown in Fig. 14b. The result shows that webcam arrays are suitable candidates for recording holograms and their use further reduces the cost of the device.
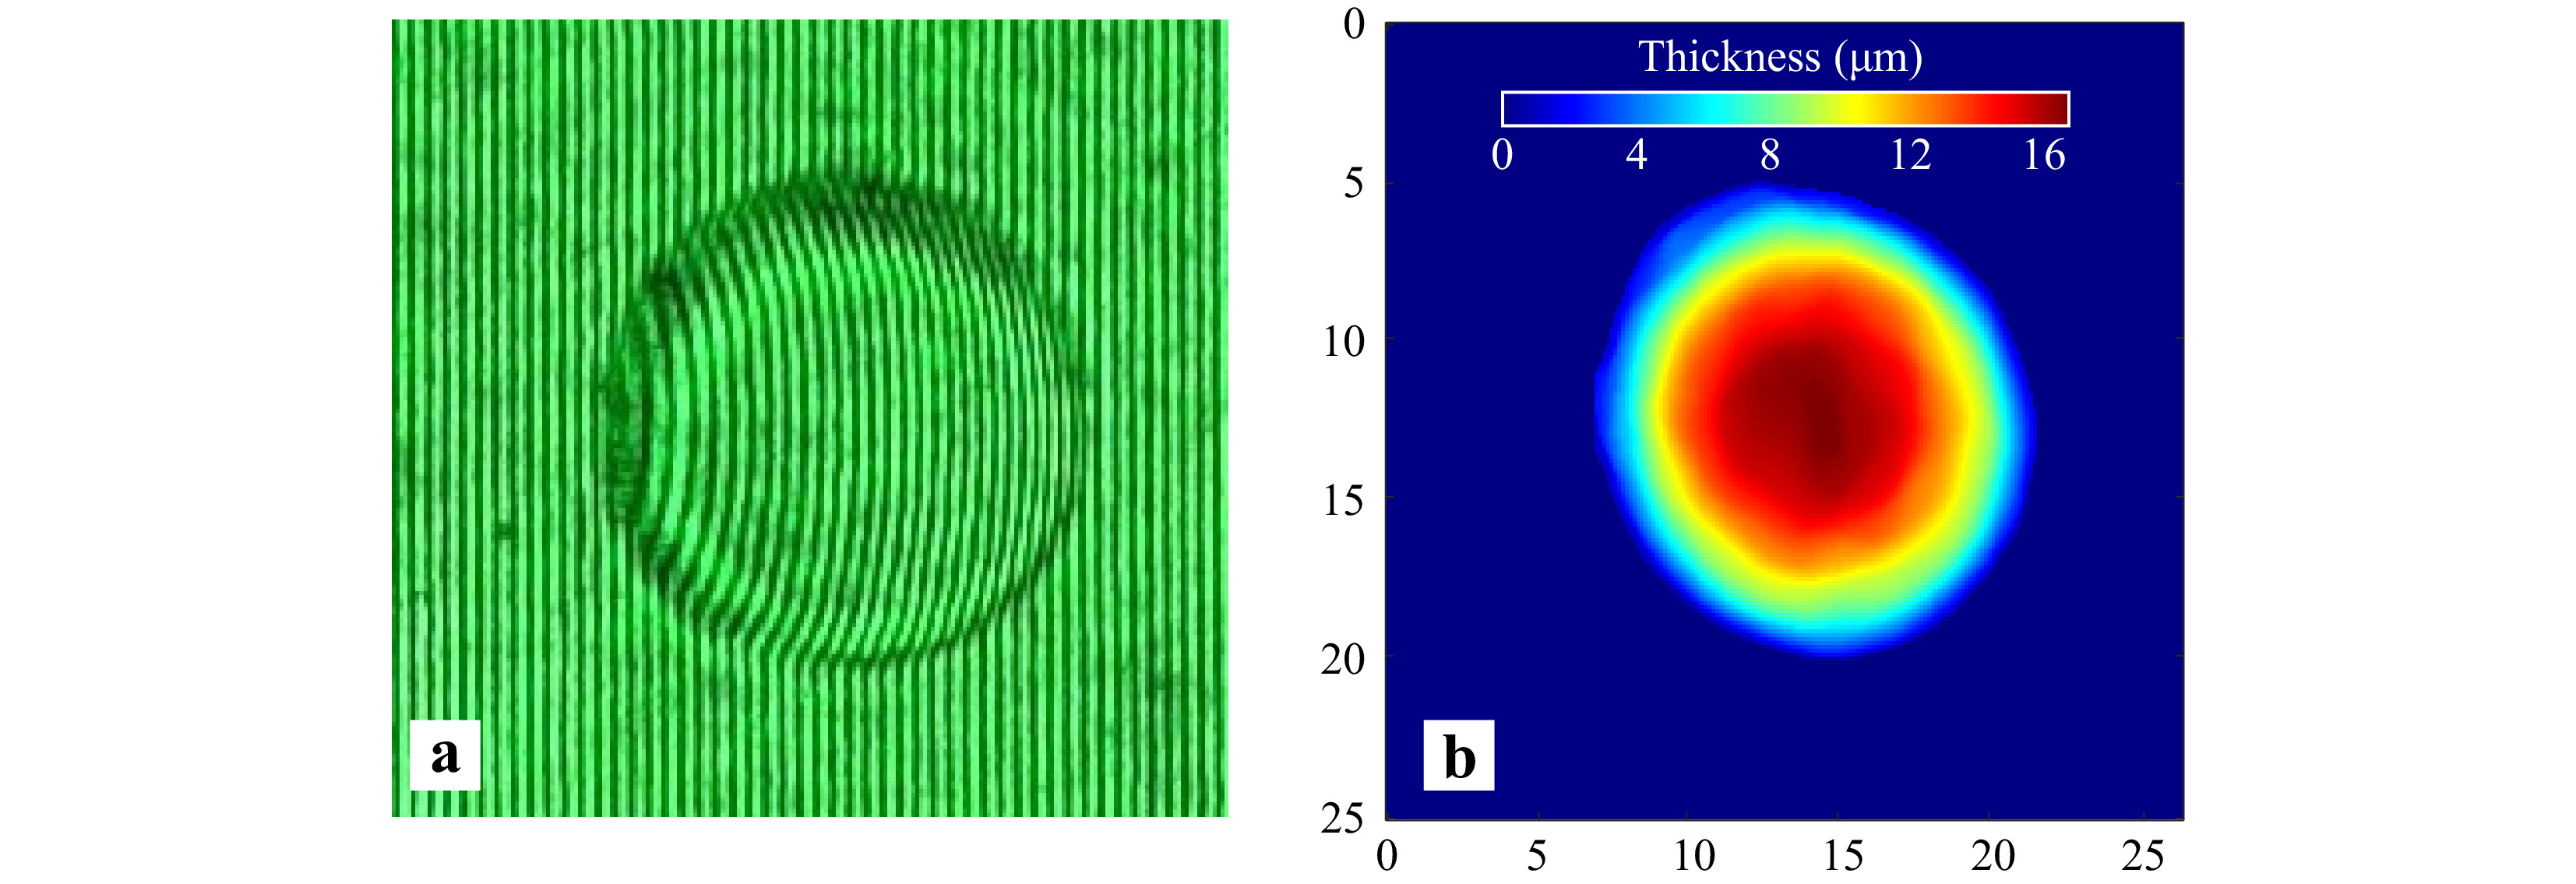
Fig. 14 Use of webcams for recording of holograms a Portion of the hologram of a 15 μm polystyrene microsphere recorded by a VGA webcam array. b Reconstructed thickness profile of the microsphere.
Since the described technique is compact, requiring fewer optical and beam steering components, it could be converted into a field-portable device. This will be carried out soon. The method provides a multitude of sample features, which has been demonstrated to provide high accuracy classification of cells. In the next step, in-depth cellular analysis that uses both biophysical and biomechanical cell properties of immobilized cells for sorting, classification, and identification will be investigated.
-
Samples of Polystyrene beads (refractive index 1.52) of diameters 5 micrometers and 15 micrometers were prepared to calibrate the developed Optical Tweezer setup. The sample was prepared by making the solution of respective poly beads with deionized water. Sodium Lauryl Sulphate (Molecular weight −288.31 g mol−1), which acts as a surfactant, was added to the solution to prevent clustering of the beads and adhesion of the beads to the wall of the container. The solution was thoroughly mixed and used for analysis48.
The human erythrocytes were also analyzed using the developed optical tweezer setup. The Phosphate Buffer Saline solution (PBS,1X, pH 7.4) used in preparing RBC suspension, was prepared in the laboratory by continuously stirring the mixture of NaCl (8 g), KCl (0.2 g), Na2HPO4 (1.15 g), KH2PO4 (0.24 g) in 800 ml of deionized distilled water. Further, the solution was made up to 1 liter by adding required deionized distilled water to it52. The PBS solution looks after a proper environment for the biological samples by maintaining constant pH and ion concentration values for biological specimens. Further, it maintains the osmolarity of the cells and thus prevents cell rupturing. Then, the RBC suspension was prepared by mixing the 1 ml of the blood sample with the 1 ml of PBS solution.
The solution was centrifuged at a rate of 2000 rpm for 600 s, resulting in separating a layer of white blood cells, plasma, and red blood cells. The red blood cells were isolated from the samples by removing the supernatant and washing the PBS solution again. The protocol was repeated three times to isolate RBCs from other blood constituents53. Then a RBC suspension was obtained by mixing a drop centrifuged of blood (containing only RBCs) with the required PBS solution and analyzed.
For cell classification into healthy and SCD positive, Machine Learning model based on Support Vector Machine (SVM)49, was trained using the extracted cell parameters (biophysical and biomechanical features obtained from SRDHM and the corner frequency values from QPD) as the independent variables and the cell class as the independent variable. The features from 50 healthy and 50 SCD positive samples were used in training of the model. The accuracy of the model was determined from five-fold cross validation.
-
The work was supported by research grants SERB (EMR/20l7/002724), DAE-BRNS (2013/34/11/BRNS/504), DST-FIST and DST-PURSE. AA and VC would like to acknowledge Abdus Salam International center for Theoretical Physics (ICTP), Trieste, Italy for Regular Associate fellowship.
Integrated self-referencing single shot digital holographic microscope and optical tweezer
- Subhash Utadiya1,
- Sachin Joshi2,
- Nimit Patel1,
- Chetna Patel1,
- Mugdha Joglekar1,
- Vani Cahhniwal1,
- Timothy O’Connor2,
- Bahram Javidi2,
-
Arun Anand1, 3, ,

- Light: Advanced Manufacturing 3, Article number: 37 (2022)
- Received: 14 September 2021
- Revised: 11 May 2022
- Accepted: 23 May 2022 Published online: 04 August 2022
doi: https://doi.org/10.37188/lam.2022.037
Abstract: Digital holographic microscopy is a single-shot technique for quantitative phase imaging of samples, yielding thickness profiles of phase objects. It provides sample features based on their morphology, leading to their classification and identification. However, observing samples, especially cells, in fluids using holographic microscopes is difficult without immobilizing the object. Optical tweezers can be used for sample immobilization in fluids. The present manuscript provides an overview of our ongoing work on the development of a compact, low-cost microscopy system for digital holographic imaging of optically trapped samples. Integration of digital holographic microscopy system with tweezers is realized by using the optical pickup unit extracted from DVD burners to trap microsamples, which are then holographically imaged using a highly compact self-referencing interferometer along with a low-cost, in-house developed quadrant photodiode, providing morphological and spectral information of trapped particles. The developed integrated module was tested using polystyrene microspheres as well as human erythrocytes. The investigated system offers a multitude of sample features, including physical and mechanical parameters and corner frequency information of the sample. These features were used for sample classification. The proposed technique has vast potential in opening up new avenues for low-cost, digital holographic imaging and analysis of immobilized samples in fluids and their classification.


Rights and permissions
Open Access This article is licensed under a Creative Commons Attribution 4.0 International License, which permits use, sharing, adaptation, distribution and reproduction in any medium or format, as long as you give appropriate credit to the original author(s) and the source, provide a link to the Creative Commons license, and indicate if changes were made. The images or other third party material in this article are included in the article′s Creative Commons license, unless indicated otherwise in a credit line to the material. If material is not included in the article′s Creative Commons license and your intended use is not permitted by statutory regulation or exceeds the permitted use, you will need to obtain permission directly from the copyright holder. To view a copy of this license, visit http://creativecommons.org/licenses/by/4.0/.

 DownLoad: