


-
Spectral imaging is a powerful technique that captures wavelength-resolved information (spectra) at every pixel in an image to non-invasively estimate relative abundances of spectral signatures, representing for example the chemical composition of spatially heterogeneous samples2–5. The interaction of light with a given sample, for example through absorption, reflectance or fluorescence, provides a spectral signature that is determined by the relative abundance of key chromophores or fluorophores. Applying ‘spectral unmixing’ algorithms to extract chemical abundances can then provide valuable diagnostic information across a wide range of disciplines, from biomedical imaging to agricultural inspection6–11.
Real-time spectral imaging is commonly realized using multispectral filter arrays (MSFAs). MSFAs are mosaics of pixelated optical filters integrated atop an image sensor; images at each spectral band are formed by interpolation between spatially distributed filters using a demosaicking algorithm2, 12–14. Conventionally, each element in the MSFA is an optical bandpass filter, usually with a fixed, narrow bandwidth. The center wavelengths of each spectral band can either be spaced evenly across the spectral range of the sensor (e.g. 400-900 nm for silicon image sensors) for generic applications, or can be spectrally and spatially optimized to a particular application via computational processes5, 12, 13. One key shortcoming of bandpass filters is that much of the incoming spectral power—outside of the bandpass region—is discarded (reflected or absorbed). This can reduce performance, in particular the signal-to-noise ratio (SNR) of the raw data (see Equation 8 in Materials and Methods), which may be problematic in environments with high noise or interference from other spectral signatures.
In commercial spectral imaging, several distinct technologies offer a range of trade-offs between spectral resolution, band count, and acquisition speed. Liquid crystal tunable filter (LCTF)-based cameras employ tunable filters to achieve spectral resolutions—typically defined by a full width at half maximum (FWHM) of 10-30 nm—across the visible spectrum, enabling the capture of 30-100 spectral bands (e.g. see Thorlabs Kurious LCTF15). In contrast, push-broom hyperspectral cameras, such as the Specim FX17 and Headwall Photonics Nano-Hyperspec, typically deliver higher spectral detail with FWHM values around 5-15 nm and capture a much larger number of bands, generally between 200 and 300; for instance, the Specim IQ provides approximately 200 bands16 while the Nano-Hyperspec offers around 340 bands17. Snapshot hyperspectral and multispectral cameras, often based on filter arrays, are designed for rapid data acquisition by capturing images in a single snapshot; these systems usually offer 16–25 bands with filter FWHM values ranging from 10 to 50 nm, as exemplified by IMEC’s snapshot mosaic sensors18, Ximea’s multispectral cameras19 or Silios’s Toucan20.
If a priori information of the sample is known then an optimal spectral imaging approach—with regards to maximizing the spectrally unmixed SNR relative to the raw SNR (see Eqs. 7, 8 in Materials and Methods)—would be to match the spectral transmission of the filters to the spectrum of each contributing chromophore; the concept of ‘matched filters’ is widely used for SNR maximization in telecommunications21 and other fields. For optical filters, matching has been achieved using optimized thin-film multilayered elements called multivariate optical elements22 in challenging spectroscopy applications where highly sensitive detectors cannot be easily deployed e.g. in undersea oil and gas extraction23, 24. Further, it has been shown that tailored broadband filters are generally more robust to noise than narrowband filters25. However, multivariate optical elements have only been used to make spatially uniform filters and have not been applied as pixelated filter arrays.
Demonstrating a matched filter concept in an MSFA has been elusive to-date due to the complexity of creating arbitrary (i.e. not single narrow-bandpass) spectral characteristics within pixel filter arrays. Previous studies have achieved some compact, broadband solutions using: nanohole metasurfaces26, 27; multilayer structures with spatially varying holes etched into them28; metasurfaces designed to perform 'pixel routing' where sub-wavelength 3D structures route light to different parts of the image sensor based on their wavelength29; random or semi-randomized diffusers30; and coded apertures31. Recently, a generalized concept of ‘free-form pixels’ with tailoring for spatial structures has been proposed32, as well as structures that use AI-optimized pixel and sensor layout designs for improved performance33, 34.
Nonetheless, it is challenging to tailor spectra with these approaches due to computationally intensive inverse design processes and designs typically require high resolution (nanoscale) lithographic techniques with tight tolerances. Most recently MSFAs with each pixel made up of a Fabry-Perot etalon with random cavity height (and hence resonant wavelength) have been demonstrated35, which also show potential for multiband transmission but with potential for an easier design and fabrication process.
Building on these previous works, we demonstrate here a new matched filter concept, ‘hyperpixel’ filter arrays (see Fig. 1), that can be deployed as an MSFA for snapshot multispectral imaging. Hyperpixels comprise multiple spatially heterogeneous Fabry-Perot resonators, termed subpixel filters, located within the bounds of a single image sensor pixel. Each of the subpixel filters can have a different cavity height, so that when integrated over the pixel area, the overall transmission forms a composite spectral filter based on the sum of these responses. This allows spectral optimization at the single pixel level. The hyperpixel approach overcomes the design and fabrication demands of prior approaches, being easily designed based on cavity heights and fabricated using grayscale lithography14. For future commercial up-scaling, alternative fabrication techniques such as binary lithography with reflow may also be feasible36. As a result of the hyperpixels implementation, spectra can be easily unmixed using only a single standard matrix multiplication that can be implemented in real-time using existing cost-effective hardware. We demonstrate here the hyperpixels concept using 100 subpixel filters to tailor spectra in a 10 × 10 μm hyperpixel targeted to four distinct reflectance spectra and arranged in a hyperpixel filter array.
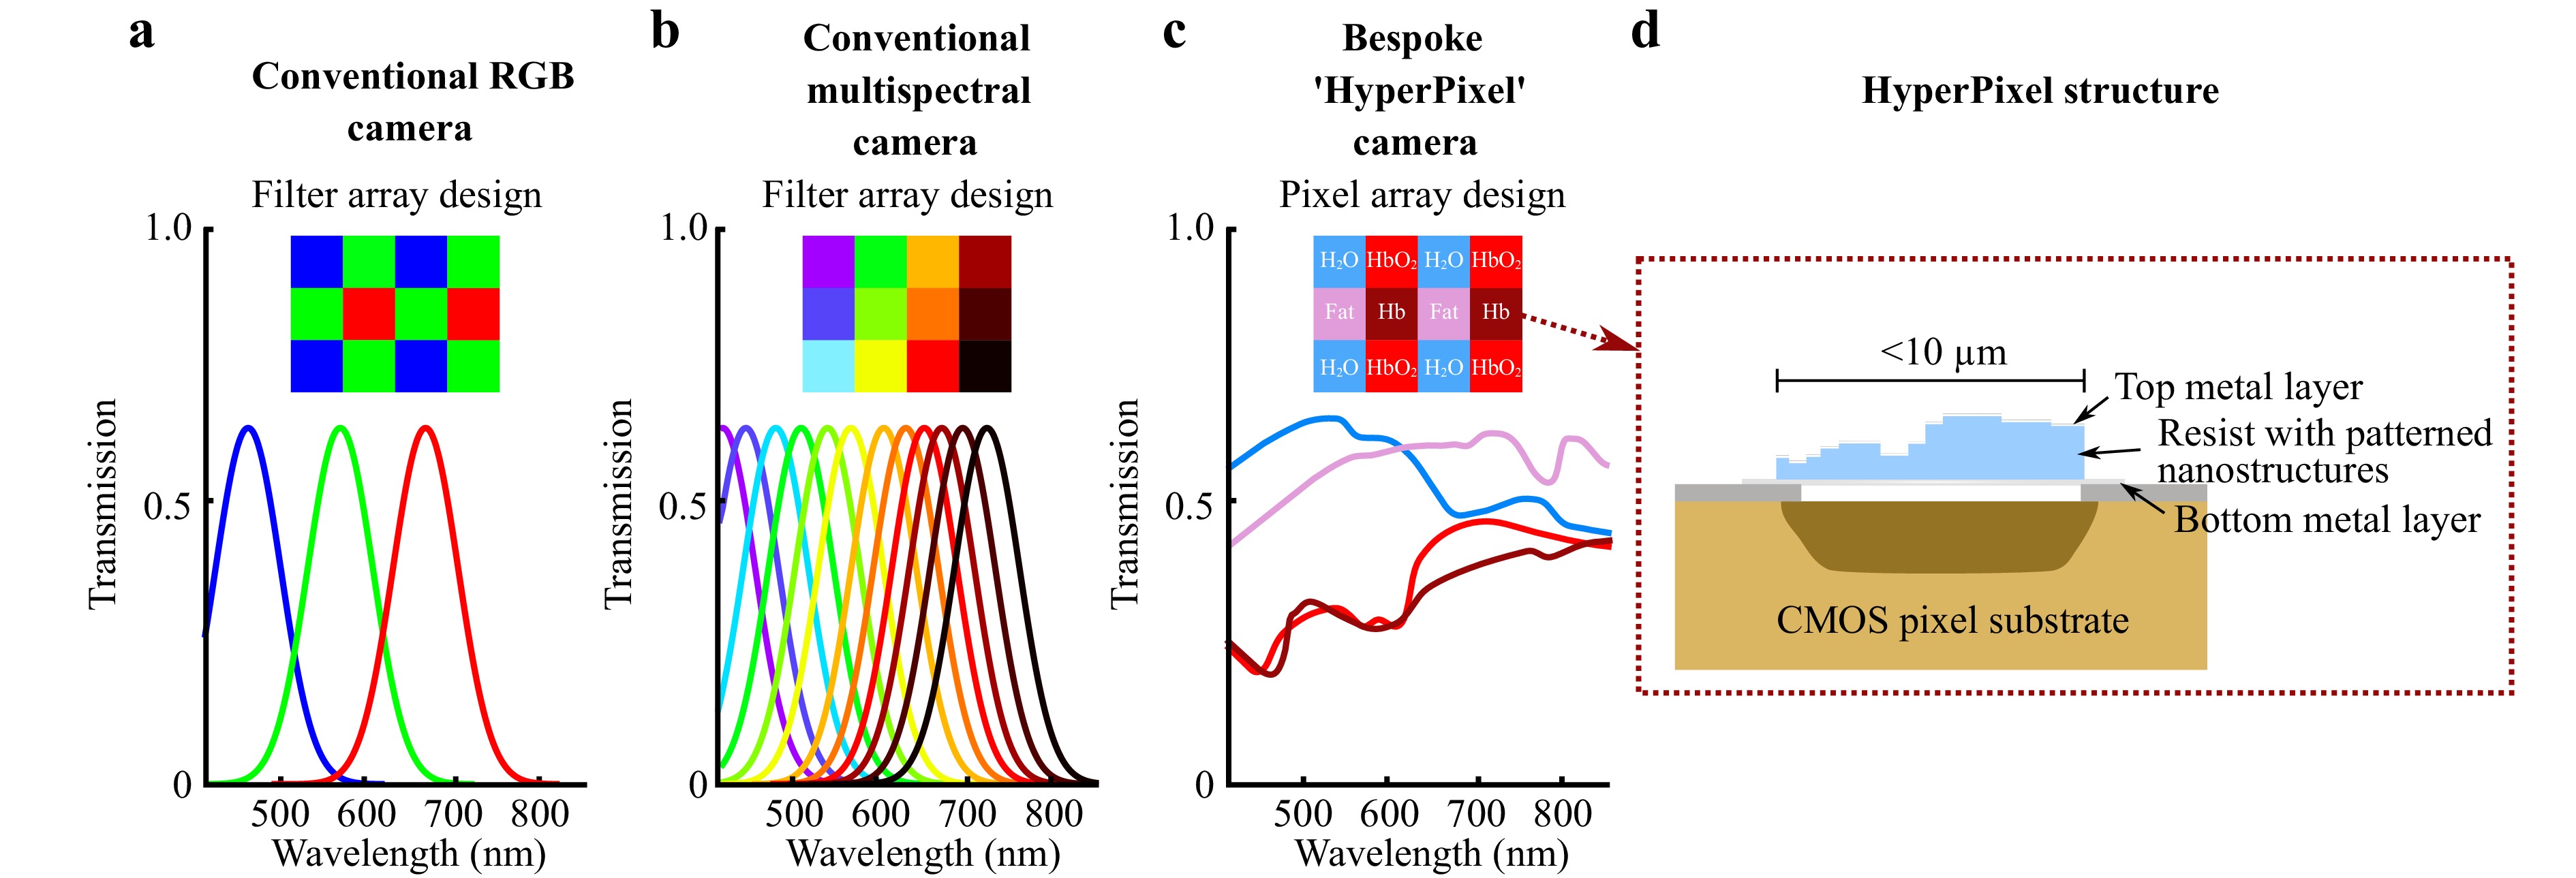
Fig. 1 Hyperpixel concept: a Conventional color cameras have Bayer filters applied per-pixel to discern red, green and blue wavelengths. b Conventional snapshot multispectral cameras based on multispectral filter arrays (MSFAs) extend this using bandpass filters centered at many different wavelengths – 12 in this example. c hyperpixels replace the conventional MSFA filters and enable different pixels spectral responses to be ‘matched’ to the reflectance spectrum of a target substance. d Hyperpixels are implemented by fabricating several Fabry-Perot resonators within the area of a single pixel on a CMOS sensor. The area of each resonator dictates the power transmitted in that particular band, but the total power integrated across the spectrum cannot exceed that of an equivalent single band-pass filter.
Building on our previous work, which explored the feasibility of hyperpixel fabrication1, this study represents a significant advancement by demonstrating, for the first time, experimentally measured performance improvements achieved with hyperpixels. Using a MacBeth ColorChecker chart as a spectral test target, we show that hyperpixels outperform a standard band-pass filter array–representing the best possible conventional MSFA–by a factor of 2-3× in accurately estimating the abundance of target spectral components. This marks the first clear empirical evidence of practical superiority. Furthermore, our simulation analysis extends these findings, revealing that the hyperpixel advantage persists across a broad range of realistic spectra, even in the presence of large fabrication errors. This robustness underlines the potential of hyperpixels to offer consistent performance improvement over conventional designs in future real-world applications.
-
Experimentally fabricated filter arrays (Fig. 2a) were used to obtain spectral response (transmission) results for 14 different spatial regions (Fig. 2) from the center of the array to the outer edges. The measured transmission spectra from the bandpass filters (Fig. 2b) indicate a relatively large variation in central peak position across the sample, though some areas do closely match the designed structures. This spectroscopic variation enables direct characterization of fabrication variation across the sample. There are numerous reasons that contribute to this variation, these include: difference between the modeled and deposited thin film materials’ refractive indices (i.e. porosity, grain size effects, etc.); slight variations (and uncertainties) in the thicknesses of the deposited thin-films (simulated contributions to total transmission from of different layers shown in Supplementary Figures S2-S5); the deposited e-beam resist refractive index and surface morphology will slightly vary with processing differences (i.e. heat treatments, exposure variation etc.); surface roughness of the deposited layers will result in increased optical scattering leading to broader responses; reduction in performance due to cone half angle (numerical aperture and f-number) of the spectroscopic or imaging optics in the characterization setup; proximity effect in e-beam lithography results in higher effective doses towards more dense features (i.e. center of pattern) in comparison to the edges / corners. Further, these effects can be multiplicative and thus we note that decreasing the variation between modeled and experimentally realized designs requires a series of iterative fabrication-characterization cycles.
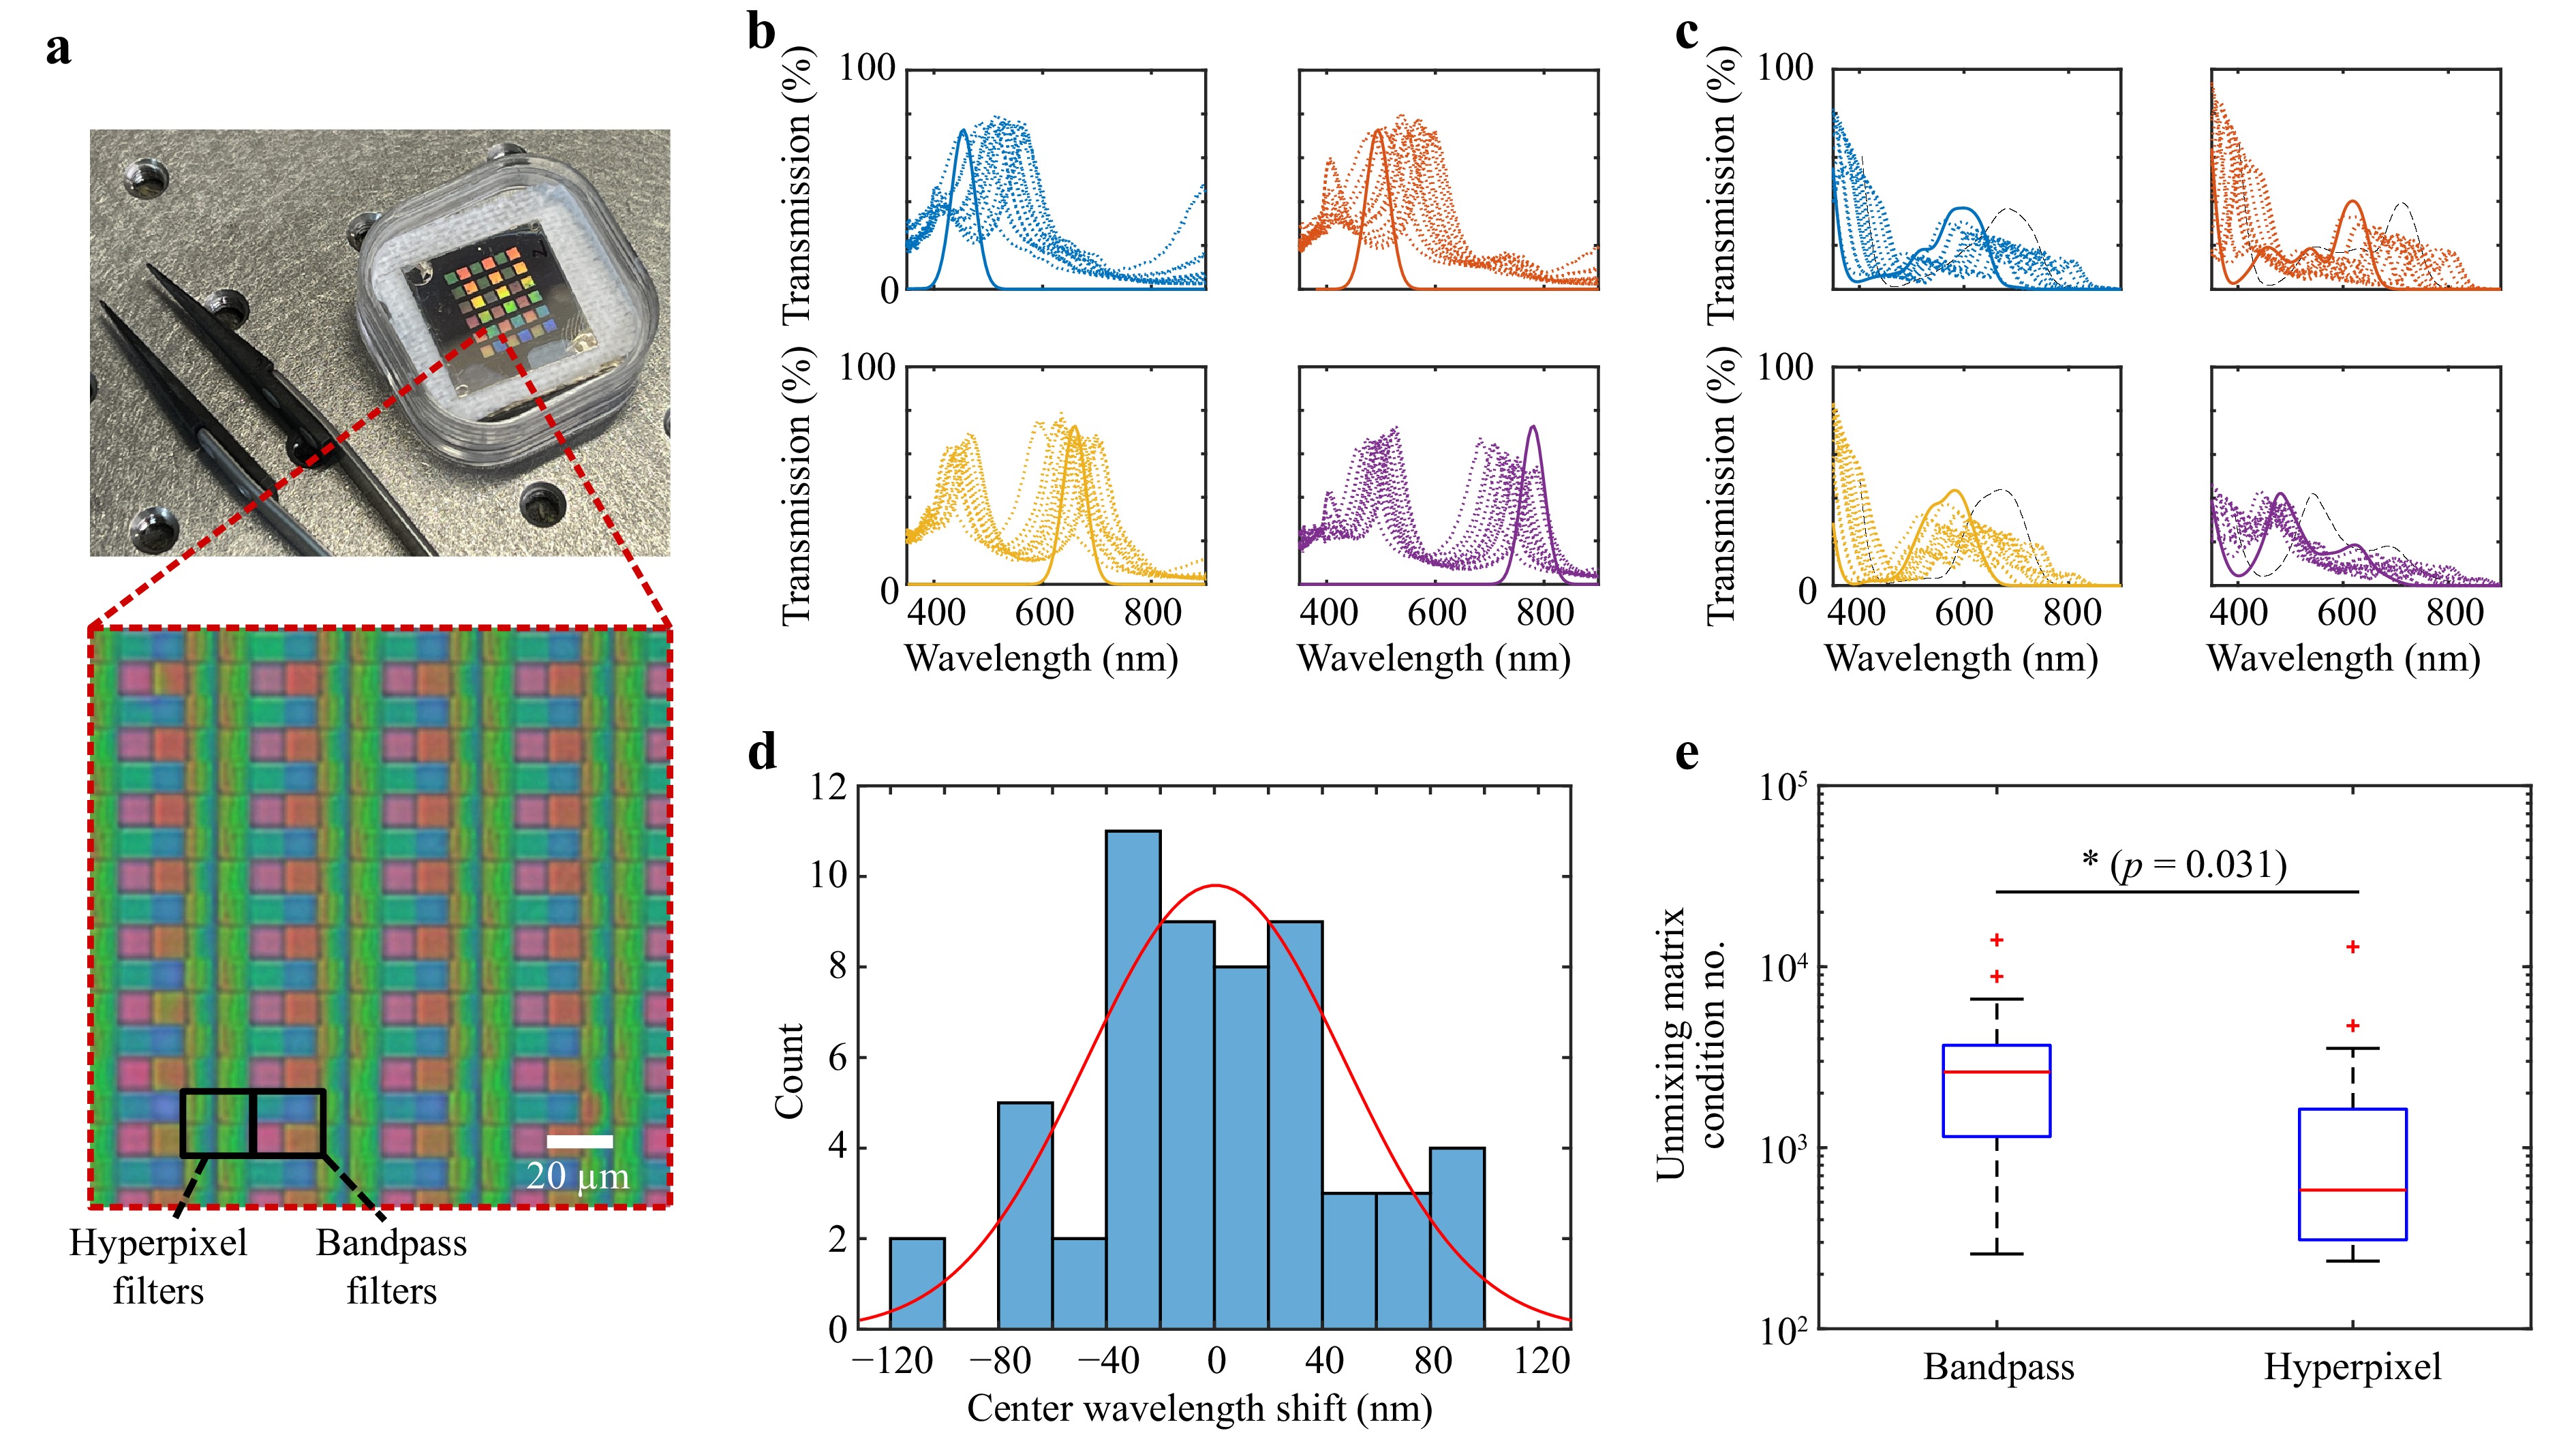
Fig. 2 Spectral characterization of fabricated hyperpixel filter array. a Microscope image showing repeating 2 × 4 array of hyperpixels and bandpass filters. b Measured spectra from bandpass filters. Solid lines: designed spectra, dotted lines: measured spectra from 14 different areas on filter array. c Reconstructed spectra from hyperpixel filters. Dashed lines: designed spectra, solid lines: blue-shifted spectra following fabrication, dotted lines: inferred spectra from 14 different areas on filter array. d Histogram showing error between designed center wavelength and measured center wavelength for bandpass filters across 14 locations on filter array (normal distribution fit: μ = 0, σ = 47.4 nm. e Comparison of condition number of unmixing matrix shows a statistically significant reduction (ratio = 2.41x, 95% CI = 1.10-5.30) of the hyperpixels compared to optimal bandpass filters.
The inferred spectra for the hyperpixels (Fig. 2c) were reconstructed from the corresponding wavelength shift of adjacent bandpass filters. By aggregating the observed shifts in center wavelength of the bandpass filters (Fig. 2d) a normal distribution fit can be made, which gives a standard deviation of 47.7 nm in center wavelength across our sample. We have also validated height mappings using AFM, as shown in Supplementary Figure S7.
Our measurements reveal that the average FWHM of the Fabry-Perot resonators is 69.4 nm–somewhat larger than that of commercial devices such as those from Ximea (with FWHM values up to 20 nm19)–but comparable to other sensors like Silios’ Toucan, which feature FWHM values up to 50 nm20. The passband can be narrowed by employing multilayer distributed Bragg reflectors–as is often implemented with commercial multispectral filter arrays. The metal-insulator structure, albeit offering wider passbands, is typically suitable for rapidly prototyping novel filter arrays as it provides a way to spectrally filter with only a few thin-film layers which can be deposited without the need for precisely controlled reactive sputtering techniques for low loss dielectric thin-films.
Our hyperpixels have 4 distinct channels (i.e. distinct transmission spectral profiles), making a 4-channel multispectral camera a fairer comparison—whether using a filter wheel or an integrated pixel approach. Due to their broadband design, hyperpixels provide an effective spectral coverage of ~500 nm (400-900 nm). However, with only four spectral channels, the nominal spectral resolution is approximately 100-125 nm in the most generic (or worst-case) scenario. This spectral resolution is comparable to commercial 4-channel multispectral cameras, such as the Spectral Devices RGB-NIR system37, which features 70 nm FWHM filters and offers a similar spatial resolution. While this approach can be customized for specific applications, we demonstrate that tailored hyperpixels achieve higher unmixed SNR and greater noise robustness than even optimally tailored conventional multispectral cameras. It is important to note that our primary objective is not high spectral resolution but rather effective spectral unmixing. When targeting known spectra, hyperpixels offer improved unmixed SNR, a more relevant metric in this context, as it accounts for both spectral fidelity and power capture.
Since our objective here is to demonstrate a minimal proof-of-principle, we have implemented only four channels. However, the hyperpixel technology could be easily scaled to 16 or 25 channels which would correspondingly enhance the spectral resolution by trading off spatial resolution. Moreover, because the hyperpixels incorporate subpixels of at least 12 distinct heights (see Table 1), one might argue that 12 bandpass filters are required to achieve comparable unmixed SNR performance–resulting in a effective spectral resolution of approximately 500 nm/12 $ \approx $ 42 nm when detecting the 4 target substances used in the design. In fact, because hyperpixels support up to 100 subpixel heights/bands, the effective spectral resolution could, in some edge cases, be as low as 5 nm.
Height(nm) HP filt1 HP filt2 HP filt3 HP filt4 No. subpixel filters 87 2 3 1 2 93 3 10 1 8 96 4 8 0 26 99 0 0 2 0 102 11 6 12 16 108 8 13 23 8 111 24 3 0 9 114 0 0 27 0 117 24 27 25 10 123 22 29 9 14 126 1 1 0 5 132 1 0 0 2 Table 1. Specifications of designed set of four hyperpixel filters.
We also note that the bandpass filters exhibit high-order Fabry-Perot resonances, resulting in secondary transmission peaks at shorter wavelengths (bottom two panels of Fig. 2b). This is in agreement with our simulations in Fig. 5b where a secondary resonance can be observed in the top left of the graph. This means the performance is not exactly the same as that of ‘ideal’ bandpass filters. However they still represent a valid base-case for comparison to hyperpixel filter designs because they are the closest approximation to ideal bandpass filters that can be fabricated with a simple metal-insulator-metal resonant cavity design. Replacing metal layers with distributed Bragg reflectors leads to higher transmission efficiencies, narrower passbands and lower out of band rejection (Supplementary Figures S1, S2), but the complexity of thin-film deposition increases due to the need for low absorption (loss) in the high-low index bi-layers. Fabry-Perot filters introduce higher-order resonances due to the constructive interference condition. This is often suppressed by sandwiching bandpass filters between short and longpass filters, or it’s possible to introduce ultrathin metallic layers38. Nonetheless, as a representative proof of concept, we have opted for simplicity of fabrication and structure, yet acknowledge there are ways of improving performance further.
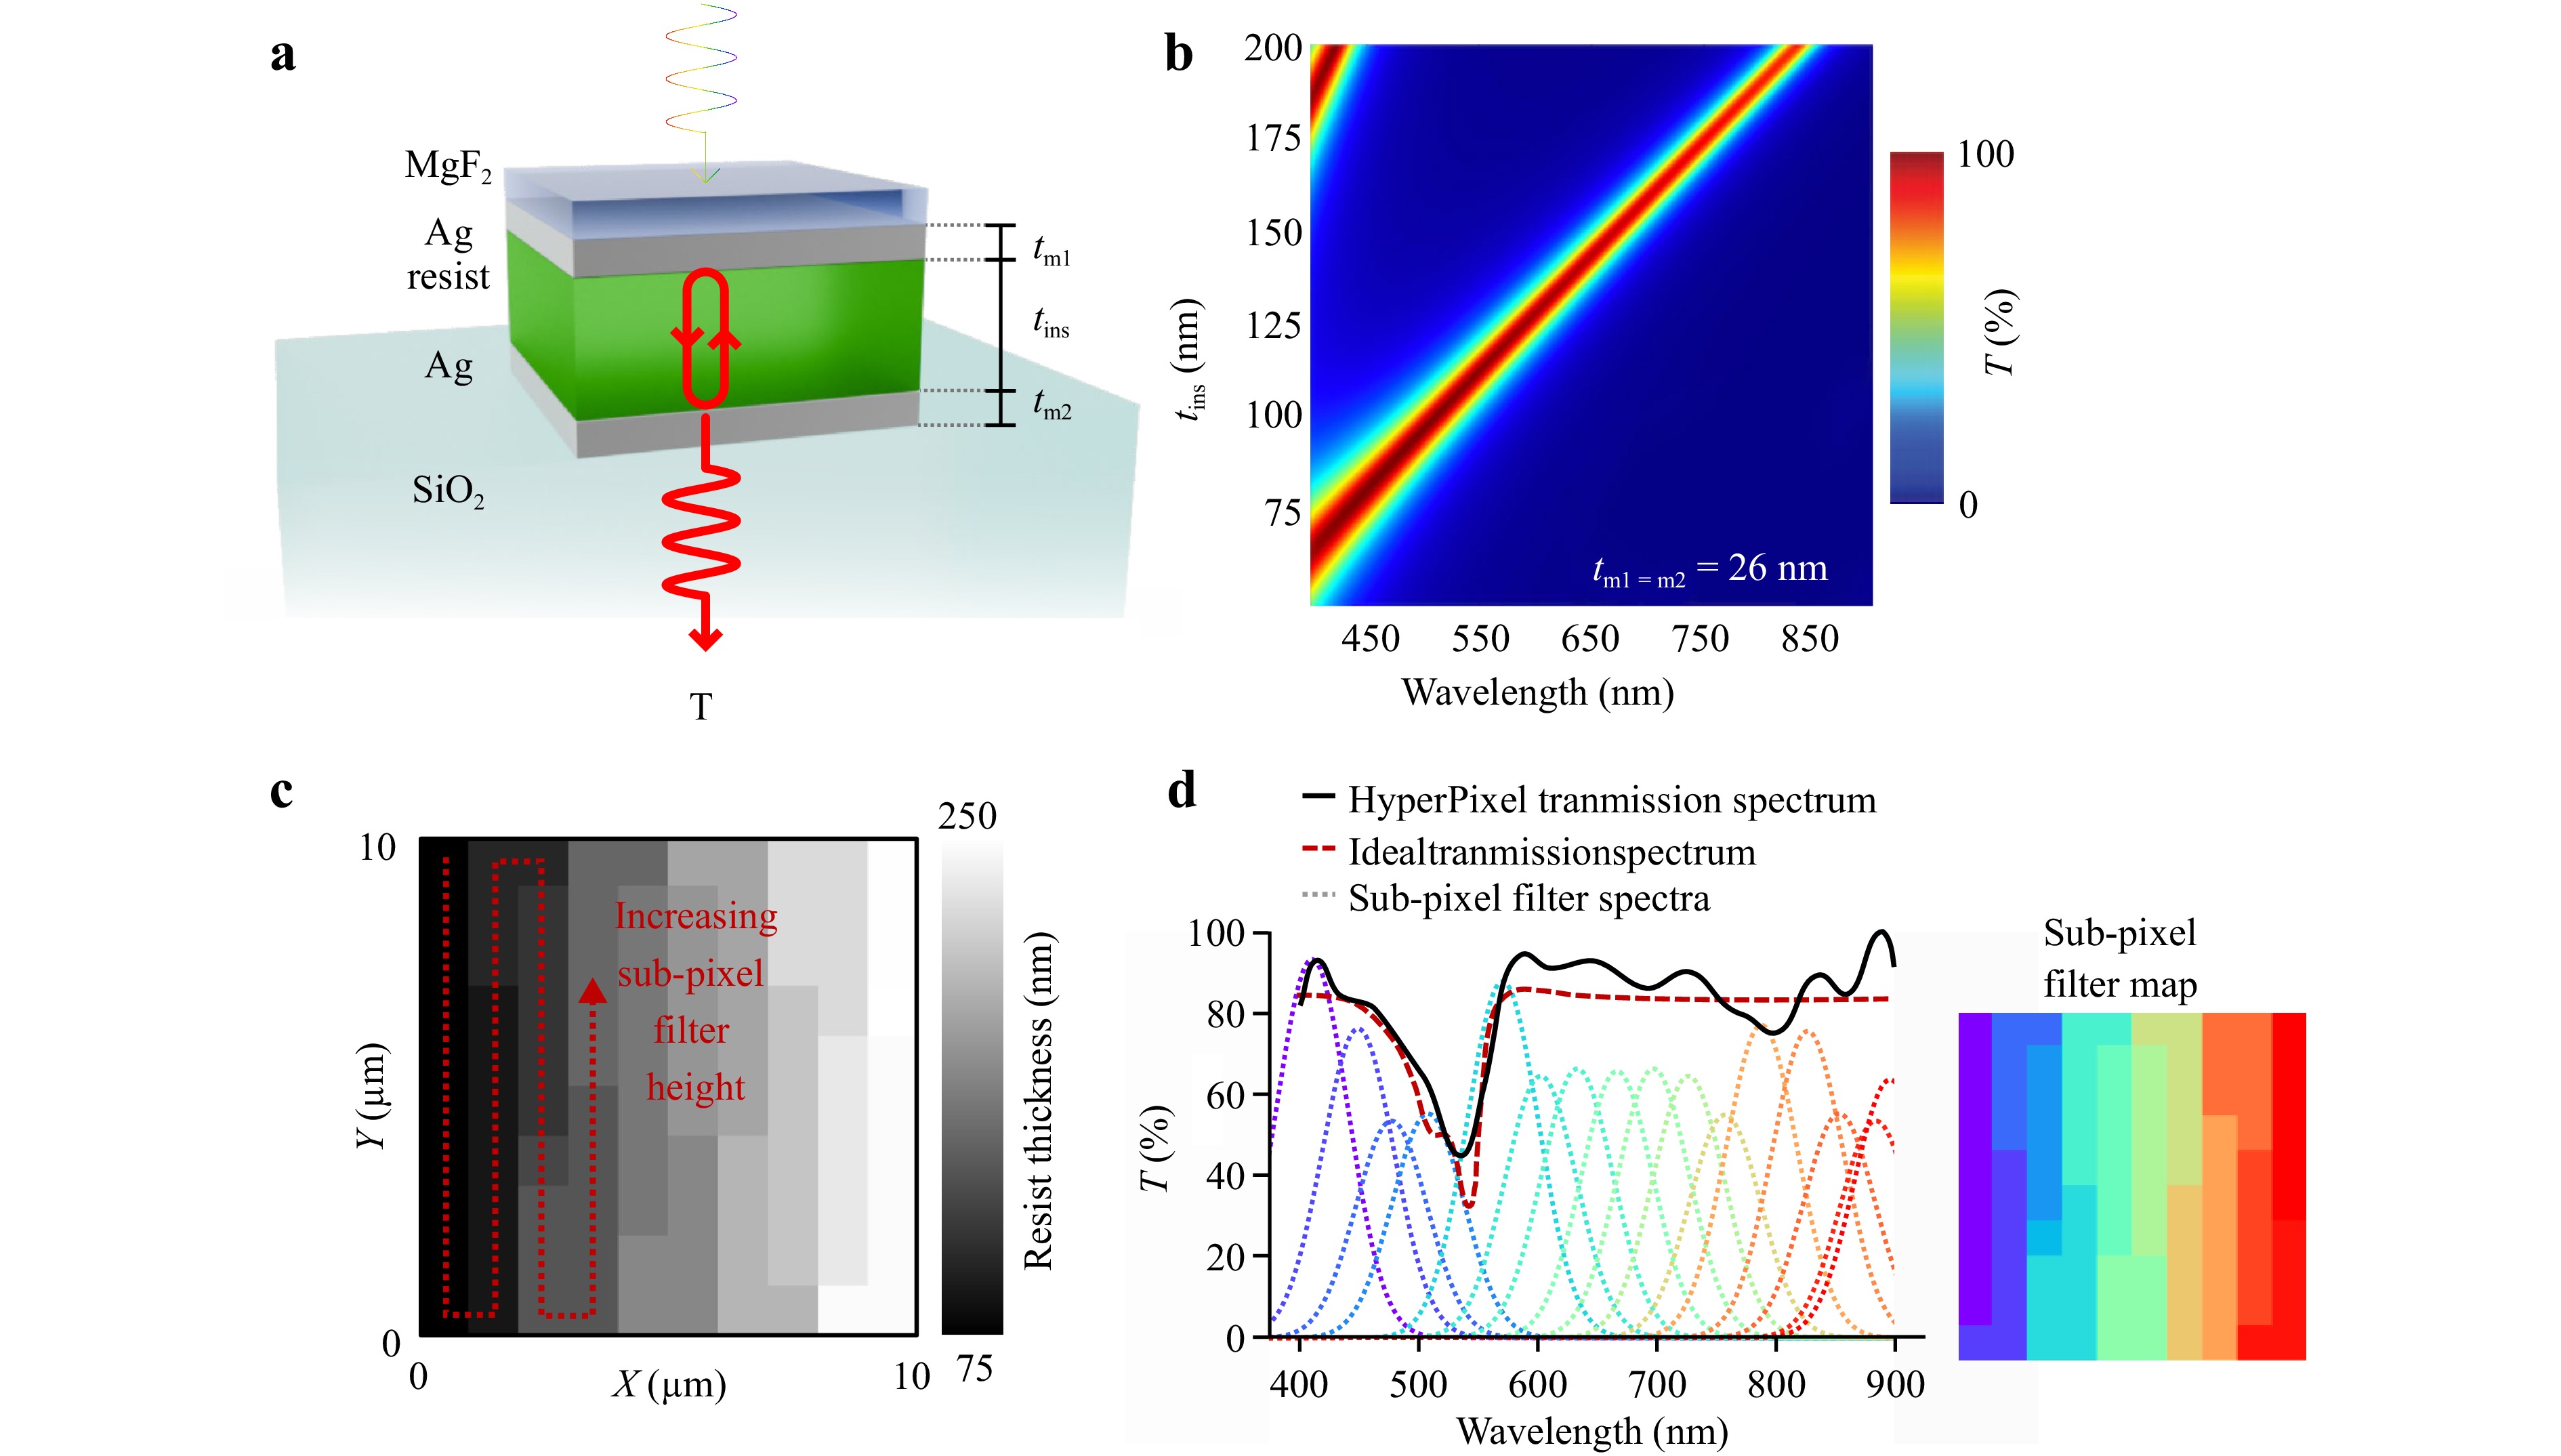
Fig. 5 Design process for hyperpixels. a Structure of constituent Fabry-Perot cavities making up each hyperpixel. $ t_{m1} $ = 22 nm, $ t_{m2} $ = 22 nm and $ t_{ins} $ = 75-200 nm. b Simulation data showing the theoretical relationship between cavity thickness and center transmission wavelength. c Example spatial design of hyperpixel showing ordering by increasing height of sub-pixels for more reliable fabrication. d Example transmission spectrum produced by hyperpixel design showing a close match to target spectrum. The inset shows color-coded sub-pixels of different height, whose corresponding transmission spectra are plotted on the graph, indicating how the sub-pixel filters contribute to the overall spectral shape.
Due to a fault in the specification of the fabrication design file, the hyperpixel spectral are blue-shifted by 50-100 nm (dashed lines in Fig. 2c) compared to the target designs (solid lines in Fig. 2c). This may reduce performance, however a close inspection of the spectra measured from hyperpixels in different filter array regions (dotted lines in Fig. 2c) shows that the variation in spectral shift across the filter array is comparable in magnitude to this blue shift and in many cases actually compensates. At a minimum we therefore expect that at least some areas of the sample will exhibit hyperpixel spectra matching the design specification. Further, we note that since this fabrication blueshift did not occur with the bandpass filters these ought to closely match the optimal designs (save for variation across the sample). Any observed performance advantage of hyperpixels is therefore still being measured against an optimal benchmark. Such variations can be minimized with tighter control over fabrication tolerances and processes in future. Our simulations (see Section below) also find that the hyperpixel designs are relatively robust against such significant fabrication errors.
Despite the limitations in the fabrication process, which led to inaccuracies in the filter properties compared to design, the measured condition number for the unmixing matrices of bandpass and hyperpixel filters shows that hyperpixels produce statistically significantly lower condition numbers than optimized bandpass filters (ratio = 2.41x, 95% CI = 1.10-5.30, p = 0.031) for this set of reflectance targets (Fig. 2e).
-
Spectral imaging data were next obtained using the MacBeth Color Checker chart scene (Fig. 3b, obtained using a smartphone camera; target reflectance squares are circled). The raw unprocessed image through the hyperpixel filter array (Fig. 3c; mosaic visible on zoomed inset) was demosaiced to produce 2 spectral hypercubes: bandpass (Fig. 3d) and hyperpixel (Fig. 3e). Each hypercube comprises 4 planes representing the different spectral channels. From these hypercubes, relevant sections of the image were cropped to highlight the target spectral reflectance areas (Fig. 3e, f).
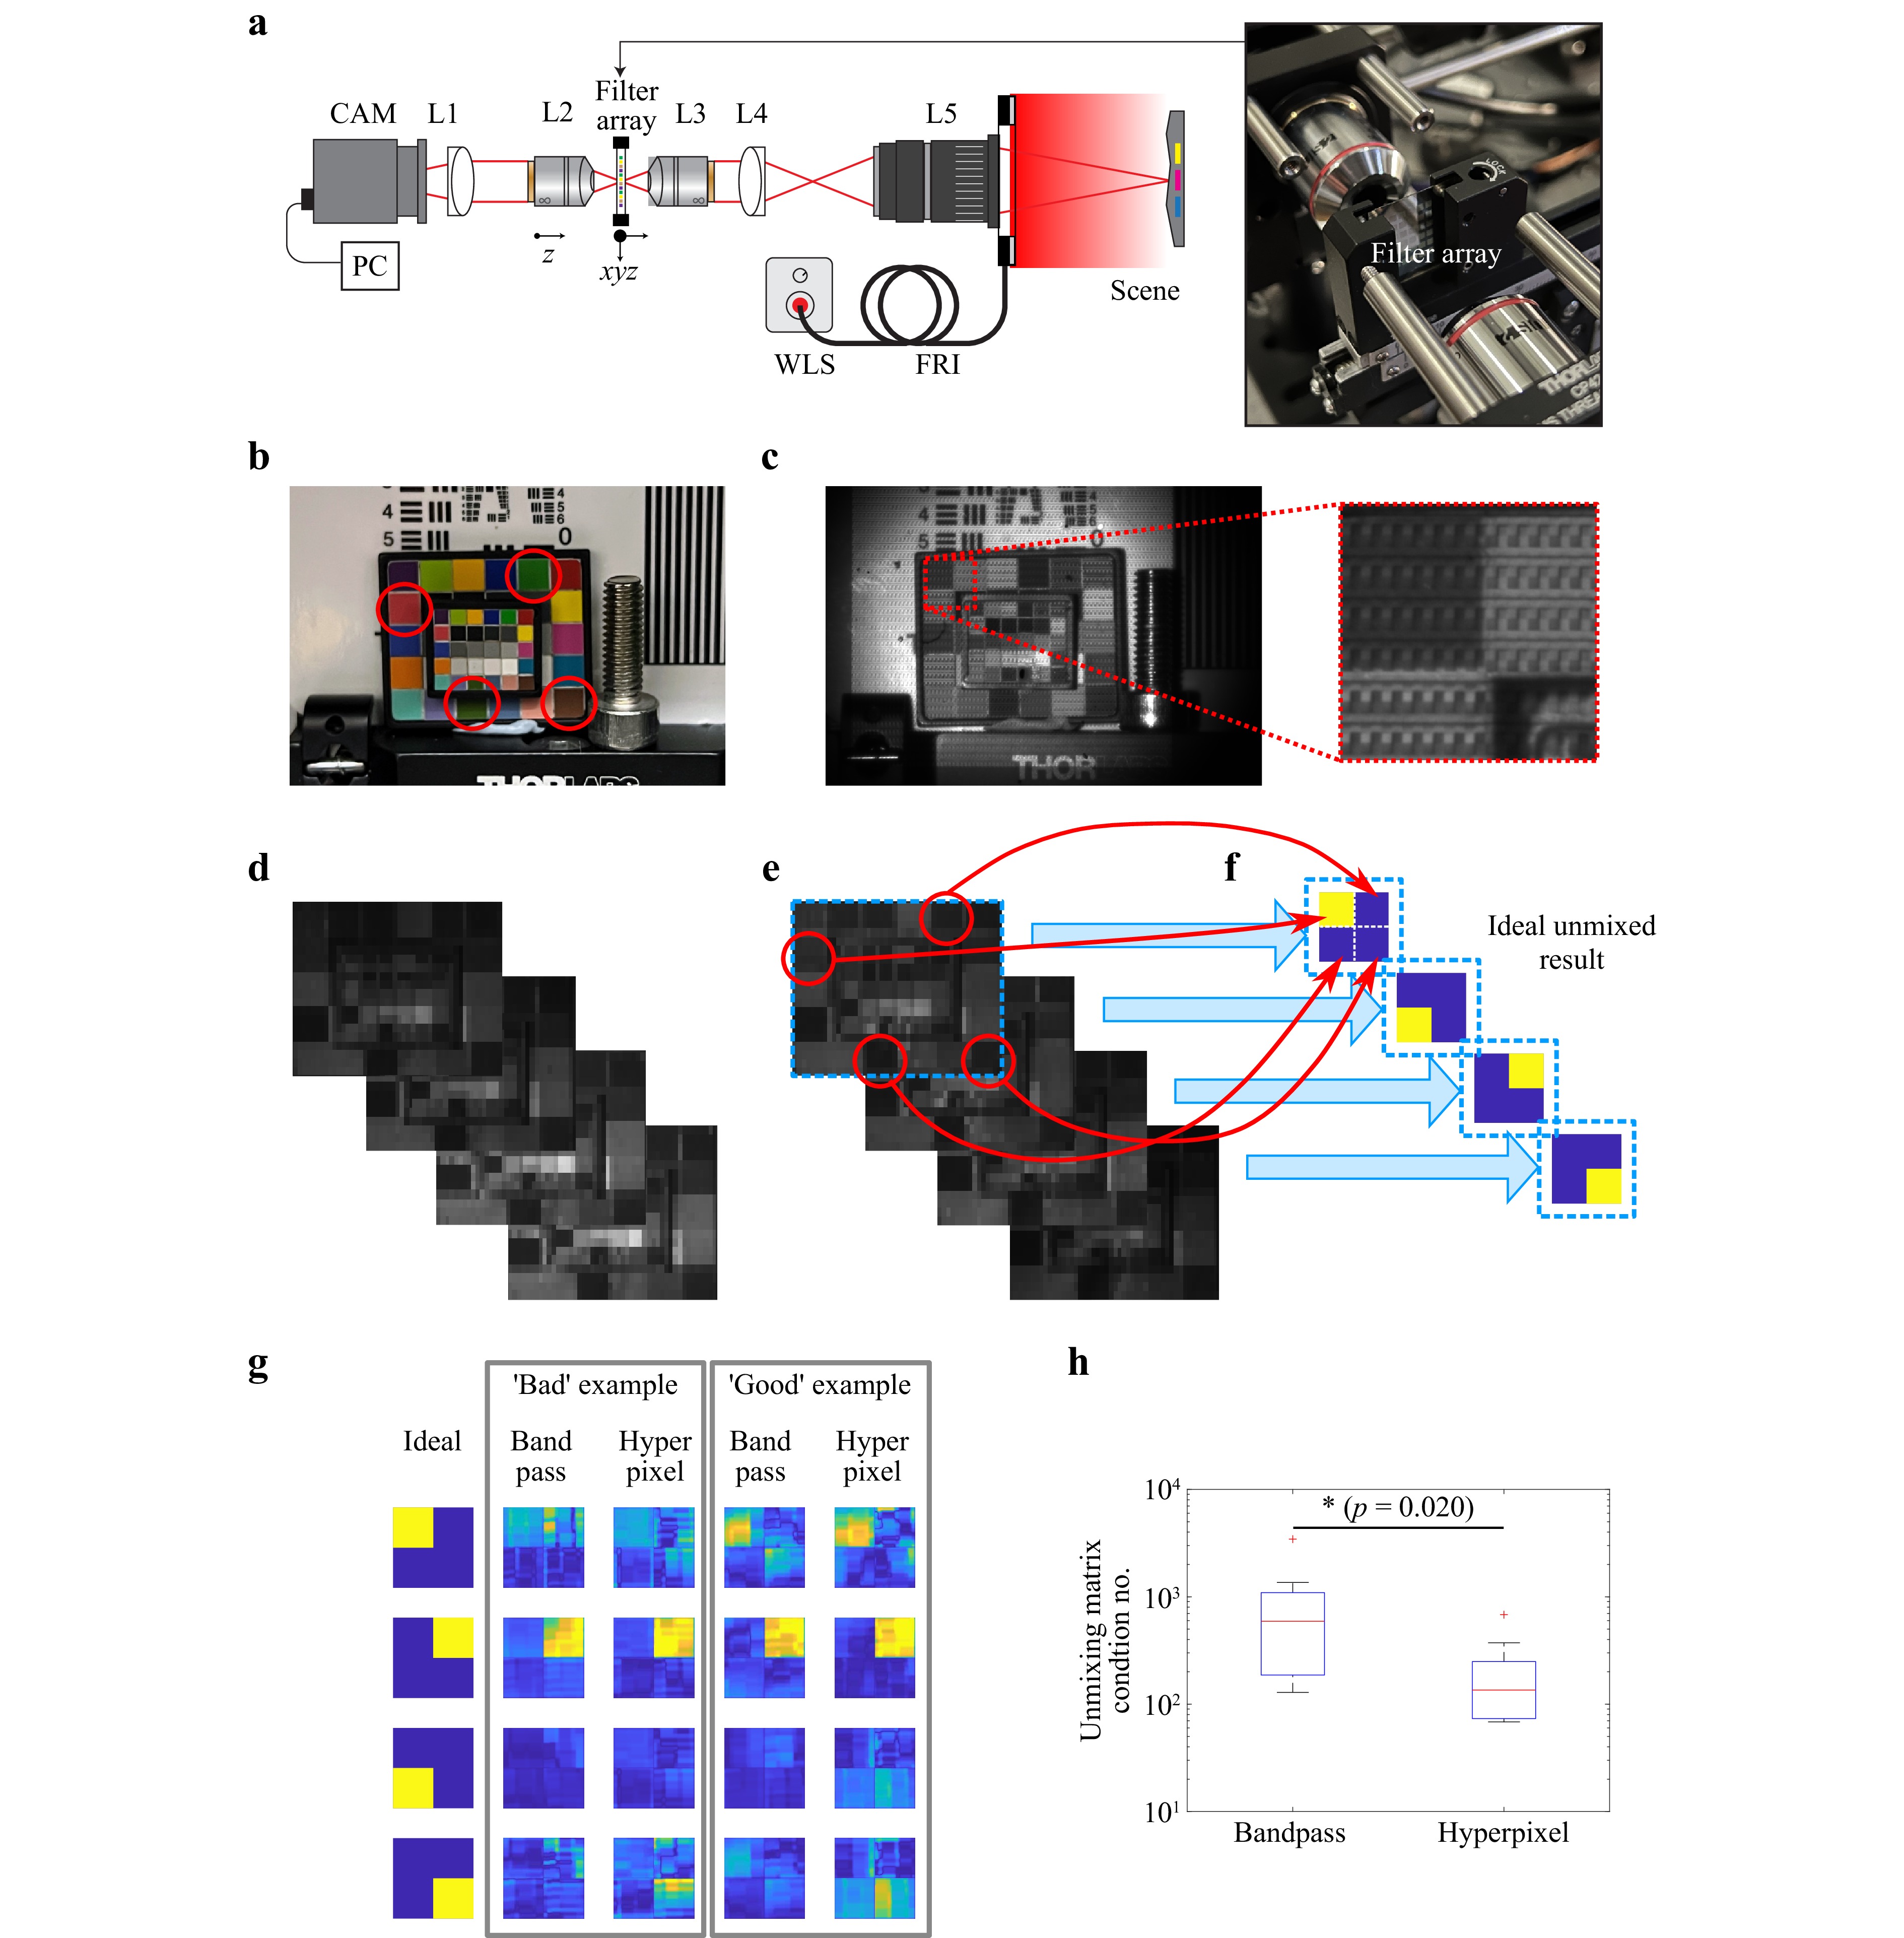
Fig. 3 Imaging experiments with hyperpixel filter array. a Diagram of experimental set-up with photograph inset. CAM = monochrome camera (Basler, a2A3840-45umPRO), L1 = achromatic doublet (Thorlabs, AC254-075-A-ML), L2 = 4x objective (Thorlabs, RMS4X), L3 = 4x objective (Thorlabs, RMS4X), L4 = achromatic doublet (Thorlabs, AC254-075-A-ML), L5 = imaging lens (Navitar, 35mm NMV-35M1), WLS = halogen white light source (Thorlabs, OSL2IR), FRI = fiber ring illuminator (Thorlabs, FRI61F50), xyz stage = xyz translation stage (Thorlabs, MBT616D). b Conventional RGB image of sample scene. c Raw image recorded with filter array placed atop CMOS sensor, inset shows the mosaic pattern. d Example demosaiced hypercube of images for bandpass filters. e Example demosaiced hypercube of images for hyperpixel filters. f The appropriate spectral reflectance target areas are cropped from the full image frames, and then are spectrally unmixed using the appropriate 4 × 4 unmixing matrix to produce 4 images. Under ideal conditions of perfect unmixing, only one of the 4 spectral reflectance targets should contain power in any recovered frame. g Unmixed images for a ‘good’ section of the filter array where the hyperpixel outperforms the optimal band-pass filter in terms of condition number, and also a ‘bad’ section where hyperpixel performance is lower than optimal bandpass. h Over 10 different regions of the filter array we find that the condition number of the unmixing matrix is significantly reduced for hyperpixels compared to bandpass (ratio = 3.47x, 95% CI = 1.28-9.40, p = 0.020).
Some visual improvement is observed in Fig. 3g where for hyperpixels, more power is directed to the appropriate pixel than for the bandpass filters. Based on the value of the unmixing matrix condition number (Eq. 6), we are able to select ‘Good’ (condition number small) and ‘Bad’ (condition number large) images to aid visualization. For example in the top row of Fig. 3g in the ‘Good’ example we see that the hyperpixel confines light to the top left area as expected, whereas the bandpass splits light between the top left and bottom right area. However, we note that this visible benefit reduces somewhat in a 'bad' example where the hyperpixel and bandpass designs appear to exhibit similar performance. This could be a consequence of several factors. First, it could be due to deviation of the spectral profile of the input illumination from the expected shape, although this was checked with a spectrometer and found to closely match the datasheet so is unlikely to have a major impact. Second it could be due to the blue-shift of hyperpixels (Fig. 2b, c) which may reduce their performance. Third, it may be due to the observed random fabrication variation across the filter arrays (Fig. 2d).
To further examine these last two possibilities and robustly quantify change in condition number, we perform a $ t $-test across 10 different measured areas of the filter array (Fig. 3i). We find a significant reduction in condition number for hyperpixel filter arrays compared to bandpass filter arrays (ratio = 3.47x, 95% CI = 1.28-9.40, p = 0.020). This indicates that the mean condition of number the hyperpixel filter arrays is consistently lower (with high statistical confidence) than the bandpass filter arrays, suggesting that the blue shift is small enough that it does not eliminate the performance advantage of the hyperpixels. Second, it also shows that the variation in fabrication across is sufficiently small that the resulting variance in condition number does not remove the advantage of hyperpixels compared to bandpass filter arrays.
-
Following successful experimental demonstration for specific spectral reflectance targets, a key remaining question is whether the advantage of hyperpixel designs over optimized bandpass filters holds across a broader range of realistic spectral targets–particularly under conditions of fabrication variability and noise. To address this, we conducted simulations incorporating observed fabrication errors, such as random variation across the sample and blue-shifting of hyperpixel spectral designs (details in Materials and Methods).
Fig. 4 presents the outcomes of this analysis. At low levels of raw SNR in the measured spectra, the performance of hyperpixel and bandpass designs converges, providing similar unmixed SNRs (defined in Equations 7 and 8 in Materials and Methods). However, under realistic conditions where high noise levels are expected–resulting from sensor noise, unknown spectral contributions, dynamic variations, and scattering–we observe a clear and statistically significant advantage of hyperpixels. On average, hyperpixels outperform optimized bandpass filters by 5.4 dB, equivalent to a 3.5× improvement between raw SNR and unmixed SNR.
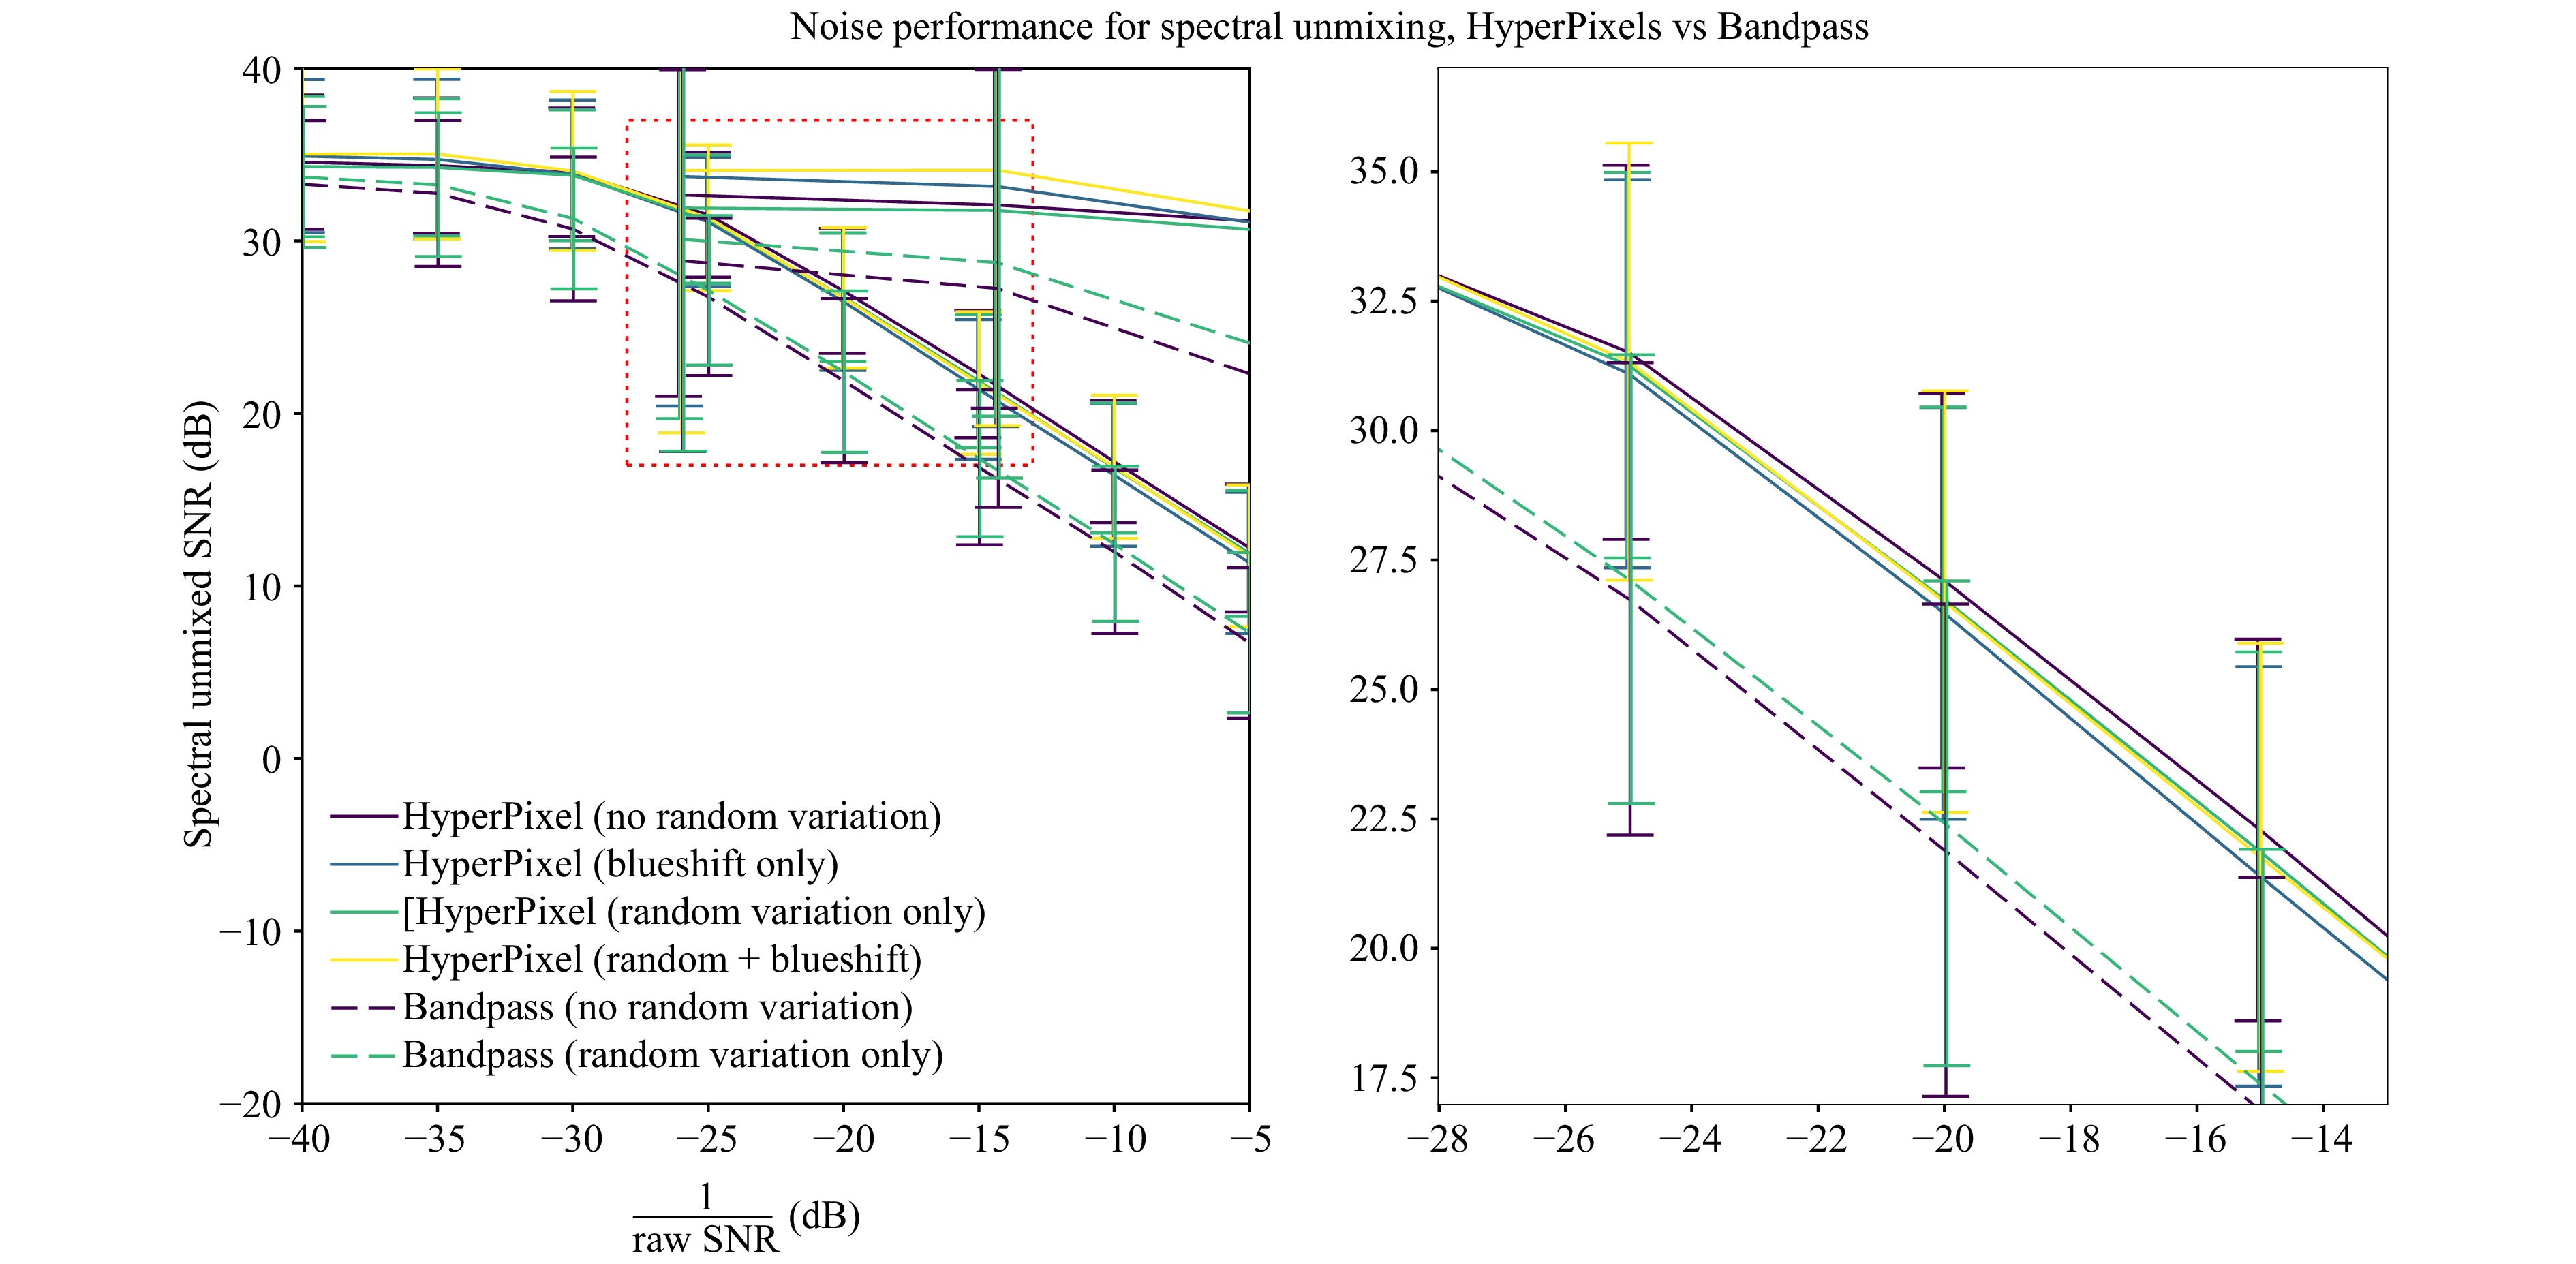
Fig. 4 Simulation results illustrating the unmixed signal-to-noise ratio (SNR) advantage of hyperpixel designs over optimized bandpass filter designs. The simulations account for random height variations in the Fabry-Perot cavities, reflecting experimentally observed fabrication errors, as well as a blue-shift in the fabricated hyperpixels. Despite these variations, hyperpixels consistently demonstrate a significant unmixed SNR advantage compared to optimized bandpass filters. The inset provides a closer view of the red-boxed region for detailed comparison.
To further evaluate robustness, we introduced fabrication variability into the simulation. Random spectral variation with a 100 nm full-width at half-maximum (FWHM), consistent with experimental observations (Fig. 2), slightly reduced the hyperpixel advantage to 4.9 dB. A 50 nm blue-shift in the hyperpixel spectra reduced the advantage further to 4.6 dB. Even in this latter scenario, hyperpixels still delivered a 2.9× improvement over bandpass filters, highlighting their resilience to significant manufacturing variability.
Finally, we examined two additional edge cases. First, we investigated the impact of highly similar spectra among the four target spectra by introducing a parameter, $ \rho $, that controlled the correlation between randomly generated spectra (see Materials and Methods and Supplementary Figure S8). We found that when data noise levels approach zero (i.e. raw SNR is high), conventional bandpass filters provide an unmixed SNR advantage of 3.7 dB over hyperpixels. However, as data noise increases to realistic levels (raw SNR < 20 dB), the unmixed SNR advantage of hyperpixels grows to 7 dB over bandpass filters.
Second, we examined the effect of mismatched illumination, where both hyperpixels and bandpass filters are optimized for a flat-spectrum light source but tested with a broadband, non-flat halogen source (ThorLabs OSL2). Under low data noise, hyperpixels provide a 4.5 dB unmixed SNR advantage over optimized bandpass filters, increasing to over 9 dB, further demonstrating the robustness of hyperpixels in these edge cases. Results are presented in Supplementary Figure S9.
These results demonstrate that hyperpixels maintain their superior performance across a broad spectrum of realistic spectral targets, even in the presence of substantial fabrication errors, mismatched illumination and very similar target spectra.
-
We have presented a novel approach to matched filter design for pixel filter arrays that utilizes numerous small ‘subpixel filter’ Fabry-Perot resonators within an image sensor pixel area to create ‘hyperpixels’, whose spectral response matches that of target spectra in a sample. Though our proposed design operates under a fixed-power constraint—since any given region can still only transmit one spectral band—there should still theoretically be a discernible advantage of this approach when performing spectral unmixing as it better exploits the broad spectral shape of many realistic targets. Indeed, our experimental tests with fabricated hyperpixel filter arrays show, using both measured spectra and imaging, that hyperpixels reduce the condition number of the spectral unmixing matrix at least 2-3 times compared to optimal bandpass filters. We have thus shown that these designs provide a measurable practical benefit. Considering that our experimental filter arrays are non-optimal (i.e. mismatch with designed structures), our results suggest the potential impact under optimized conditions could be far greater.
Our simulation analysis further evidences the robustness of hyperpixel designs. Across a wide range of realistic spectra, hyperpixels consistently demonstrate an unmixed SNR advantage of > 2.5×, even in the presence of significant fabrication errors (50-100 nm random and systematic variations). Furthermore, the devices are robust to mismatches in designed vs actual illumination conditions (different illumination spectra), with hyperpixels offering 2.8-7.9× SNR advantage. However, with very similar target spectra we find that in the low noise (high raw SNR) regime conventional bandpass filters offer a modest advantage over hyperpixels, but as raw SNR approaches realistic levels (< 20 dB), the hyperpixels again outperform conventional bandpass offering a 5.0× unmixed SNR advantage. By comparison, top-of-the-range commercial linescan hyperspectral imaging systems may offer peak SNRs of only about 26 dB in their best spectral channel. This means that, even in the most favorable scenario—-where a spectral target is perfectly matched to that channel and raw SNR is negligible-—the achievable unmixing SNR would be around 26 dB. Such an operational regime is unlikely to be encountered frequently in practice.
We attribute this advantage primarily to the broadband nature of hyperpixels, which effectively averages out spectral noise, enhancing robustness under noisy conditions. This property is particularly advantageous for biological samples, which typically exhibit broad absorption or reflection spectra39, a property we have replicated in our simulations. However, the same robustness may not apply to extremely narrowband applications, such as gas sensing. These findings align with existing theoretical knowledge that tailored broadband filters are generally more robust than narrowband filters25.
To progress the hyperpixel approach towards real-world application, there are some challenges that must be addressed: The first challenge is achieving more uniform performance across the fabricated sample. This could be improved by tighter control of the fabrication process, including exposure and development steps for the grayscale lithography aspect. Using a parallelized exposure scheme such as mask-based photolithography with either a single grayscale mask or a stepper (with dose modulation) may improve uniformity and is also scalable to larger-volume manufacturing.
The second challenge is to modify the design process to better optimize for the fixed power constraint. Due to the division of pixel area into spectral bands, there is inherently a fixed power constraint: the integrated area under the transmission spectrum of a hyperpixel is equal to that of a bandpass filter. However, previous simulation work has demonstrated that even under this fixed power constraint, a $ > $ 5-fold improvement unmixed SNR under realistic noise conditions can be achieved1. If there were no power constraint, we would expect hyperpixels to always perform equal or better than bandpass, with the limiting case being that the two are equivalent (e.g. for bandpass spectral reflectance targets). However, because of the fixed power constraint of our design there are scenarios in which bandpass filters perform better1, for example with very low noise and very similar spectra as detailed in our simulations. Conversely, there are also many scenarios where the hyperpixels, even under the total power constraint, outperform optimal bandpass filters and these will vary depending on the target.
Our design process for hyperpixels relies on the same assumptions used in designing matched filters, which a fixed total power constraint. Though this offers simplicity and clearly provides a measurable benefit (as demonstrated), alternative approaches such as water-pouring algorithm or a generic full-spectrum optimization may further maximize condition number40.
Linked to this is the third challenge: improving power transmittance. This could be achieved by using high-index all-dielectric metasurfaces to provide the tailored spectral response, though scaling such approaches to manufacturability scale may be challenging38. However, approaches such as nanoimprint lithography make this option increasingly feasible for production. Spectral responses could also be achieved through multilayer reflectors, as used for multivariate optical elements, although this may require numerous additional fabrication steps to create arrays41−44.
Recent advances in lithographic techniques offer promising routes to cost effectively scale hyperpixels. From a requirements point of view, hyperpixels require optical cavities of varying heights, ranging from tens to hundreds of nanometers, with a vertical resolution of approximately 10 nm. The lateral feature sizes are typically in the few to tens of microns range, aligning with integer multiples of image sensor pixels. The latter requirement is clearly well within even legacy optical lithography tooling; the challenge is vertical resolution (no. of levels). Our approach leverages grayscale electron-beam lithography, which provides precise control ($ < $10 nm steps) over cavity height through dose modulation, but is a prototyping (small volume) tool. We have previously demonstrated a scalable UV (i-line) grayscale lithography approach (proximity-based, mask aligner) for manufacturing of custom multispectral filters of comparable lateral-and-vertical dimension pixels14, 45. However, many commercial lithographic techniques can achieve these designs, from low to high-volume production. (1) UV projection (or proximity) lithography can achieve lateral resolutions in the micron range, with optical cavity height modulation enabled through dose-controlled step-and-repeat exposures14; (2) High Energy Beam Sensitive (HEBS) grayscale photomasks offer another viable option, allowing controlled grayscale exposure with up to 500 different gray levels for precise vertical control46; (3) Nanoimprint lithography (NIL) is now a mature, high-throughput solution whereby silicon or silicon dioxide NIL master stamps containing inverse cavity structures (resolutions down to $ < $10 nm) can enable mass replication, making it a promising approach for large-scale manufacturing of hyperpixel arrays47.
In terms of applications, we note that hyperpixels do not provide benefit in all scenarios. For example if the expected spectral response of the targets resemble bandpass filters, e.g. detecting fluorescence from multiple fluorophores, the optimal hyperpixel design will be similar to the bandpass filter design. However, the hyperpixel approach offers advantages in specific applications where the target spectra span large spectral bandwidths. Because of the high customizability, we anticipate hyperpixels could find use for low-volume applications where real-time performance is needed and unmixing is typically noisy. By using techniques such as photolithography or nanoimprint lithography, one could make standalone filter arrays in moderate quantities to be bonded to pre-packaged monochrome CMOS sensors rather than fabricating directly on sensors during manufacturing. Potential applications may include machine vision where high volumes of items with a priori known spectra are encountered, or biomedical spectral imaging where common analyte spectra such as oxygenated and deoxygenated hemoglobin are imaged across a wide range of applications.
-
The principle of hyperpixels is to enhance performance over conventional bandpass filter arrays by subdividing each pixel into multiple subpixel filters, each formed by a Fabry–Pérot cavity with a unique thickness. This design allows the averaged spectrum of the subpixels to be optimized within a single larger sensor pixel, ultimately improving spectral sensitivity through tailoring to spectral targets.
Hyperpixels were implemented as an array of thin-film metal-insulator-metal Fabry-Perot filters bounded within the pixel active area of a CMOS image sensor (Fig. 5a). A typical Fabry-Perot filter consists of two parallel mirrors separated by a thin-film cavity. Constructive interference conditions within the resonant cavity give rise to a series of sharp transmission peaks and through control of parameters such as cavity optical thickness and material selection, the center wavelengths of the resonant mode/s can be spectrally tuned (see Supplementary Information Section 1 for more detail).
For alignment simplicity, we assume a 10 μm pixel size and divide this up into 100 ‘subpixel filter’ units. The number of subpixel filter units is adjustable but should be a square number to match the geometry of the CMOS image sensor pixels. Subpixel filters should also be > 500 nm to avoid performance drop-off experience as the dimension approaches the wavelength of light48 and to minimize fabrication artifacts as structures become smaller. Working within these constraints we choose 100 subpixel filters as as a compromise between control over spectral shape and quality of subpixel filter.
Pixel crosstalk (resonance coupling between cavities), was considered as a potential reason for the discrepancies between simulated and measured pixel spectra, but was ultimately discounted. In our measurements, crosstalk primarily affects imaging and reconstruction rather than the pixel-specific spectrum, as individual pixels were measured under near-normal incidence to minimize adjacent-pixel contributions (see Characterization section). As a result, any residual crosstalk is too small to significantly impact the measured spectra of individual pixels. However, we note that crosstalk is practically unavoidable in micro-pixelated Fabry-Perot filter arrays, and typically ranges from a few to tens of percent49, 50. While the exact cause is still debated, the most likely sources are scattering at pixel boundaries—allowing fields to extend into adjacent cavities—or non-normal angles of incidence of the chief ray (imaging), which can shift the center wavelength and reduce transmission. Interestingly, metal-insulator-metal filters show reduced crosstalk than dielectric DBRs due to their thinner structure49, 51. Several strategies help mitigate this: using baffles or opaque masks between pixels, increasing the system’s f-number (trading-off spatial resolution for improved spectroscopic reconstruction), or optimizing filter arrangements49. In our imaging measurements, due to the small subpixel sizes (1 μm) with no baffle, we tried to minimize any pixel crosstalk by employing a 4f relay lens system with large f-number to ensure the chief ray angle on the filters is relatively small, thereby reducing angular effects that might exacerbate the issue. Although such effects are expected to worsen as pixel sizes approach 500 nm52, our spectral characterization shows distinctive features as designed (Fig. 2c), despite being shifted by random and systematic errors. This indicates that coupling is not a dominant concern, but we would expect for smaller subpixels this may become more prominent.
Each of these subpixel filters comprises a single cavity filter with Ag mirrors (thickness 22 nm) and resist cavity (variable thickness ~75-250 nm). A MgF2 encapsulation (capping) layer was used to mitigate oxidization and surface tarnishing. Silica glass (hundreds of micron thickness) was used as the substrate, which permits straightforward integration atop commercial monochrome image sensors or optical alignment (using relay optics) to the image sensor. To determine the optimal multilayer thicknesses for high transmission and sufficiently narrow passbands, numerical simulations were performed using the transfer matrix method (see Supplementary Information Section 1) as part of commercial optical simulation software: Lumerical Inc. (Ansys) STACK: Optical Multilayer Simulator and TFCalc (Fig. 5b). This approach uses recursive propagation matrices to model electric field propagation (backward and forward) within a 1D thin-film multilayer structure with each layer described by its material specific complex, and dispersive, refractive index.
Following simulations, an initial array with evenly spaced resist thicknesses from ~50 to 250 nm was fabricated as a height calibration target. Actual heights were measured using a combination of atomic force microscopy (AFM) and optical microspectrophotometry, as described in our previous works1 and used to optimize exposure dose by calibrating the relationship between actual (measured) height and designed height. Height calibration was iterated several times until heights are matched, because the optimal exposure dose profile is dependent on numerous factors including the substrate material/s, processing parameters (i.e. development times, temperatures, proximity effect etc). Optical microspectrophotometry was performed on the sub-pixels to characterize their optical responses (transmission spectra) and locate relative positions of center wavelengths, second order resonances, bandwidths (full width at half maximum, FWHM) and transmission.
To create a hyperpixel, we determine the heights of 100 subpixel filters so that their combined transmission matches a desired target spectrum (e.g. Fig. 5d). This matched filter approach—widely used in telecommunications21 and optical applications with multivariate optical elements22—optimizes the broadband response, which is generally more robust to noise than narrowband filters25. Although alternative methods like the water-pouring algorithm or full-spectrum optimization40 might further enhance performance, our fixed total power constraint design offers a simple and effective proof-of-principle.
We must then approximate this as a sum of bandpass filters, which represent the subpixel filters. The number of independent bandpass filters used need not be the same as the number of subpixel filters, and can be thought of as a method of quantizing the heights of the subpixel filters. This quantization process may be important for future manufacturing. For example if one exposure is required per grayscale height level (e.g. with a stepper) fewer heights would allow faster manufacturing. Similarly, there may be tolerances on the grayscale heights meaning that only finite number of distinct heights are realistically manufacturable. We therefore choose a quantization level of 32, which enables up to 32 distinct heights. We find this number enables fast and reliable convergence of our design optimization algorithm with high fidelity curve approximation, while still producing good quality fabrication results. The optimization process may assign certain wavelengths weights of zero, or may assign a certain center wavelength multiple times so the final quantization level may even be less than 32.
The optimization algorithm uses experimentally fitted spectral data to map a resist thickness to a spectral transmission profile and create 32 bandpass spectra that are then summed together to get the total transmission spectral profile. The center wavelengths and weights in the final summation are set as the adjustable parameters that are then optimized using a basin-hopping algorithm. The error function is a mean-square error with the target spectrum, which is the expected reflectance spectrum of the target, including the effect of non-flat spectral profile of the input illumination. The output of this process is a composite spectrum that closely matches the target (Fig. 5d). The optimization algorithm is implemented using custom Python code (available at53).
Finally, these 32 component spectra must be mapped onto the 100 available subpixel filters within each hyperpixel. To do this, center wavelengths are first rounded to the nearest 3 nm reflecting again the achievable height precision measured using AFM previously1. The algorithm produces weights for each of these components that vary from 0 to 1. In the final design these weights will be implemented by using the same height value for a greater number of the 100 available subpixels: greater weight for a particular component spectrum means more subpixels will have the height that creates that component. To achieve this, the weights within each hyperpixel are normalized and rounded to the nearest integer such that they sum to 100. These new normalized weights are then used to determine how many of the 100 subpixel filters (i.e. 10 × 10 array) should have that particular height.
Once the subpixel filters heights are determined, they are placed in increasing height order in a snaking pattern to minimize height steps between adjacent subpixel filters, which should enable more reliable fabrication (Fig. 5c).
-
To design a test set of filter arrays to evaluate performance of hyperpixels against conventional bandpass filters, we identified a subset of target spectra from a MacBeth ColorChecker chart (Fig. 6a) and designed hyperpixels optimally matched to them. We combined manufacturer provided spectral reflectance data with the spectrum of the illumination source to be used (OSL2 Halogen source, ThorLabs) to determine the total expected reflected spectral profile. These spectra were used as the target design spectra for the hyperpixels.
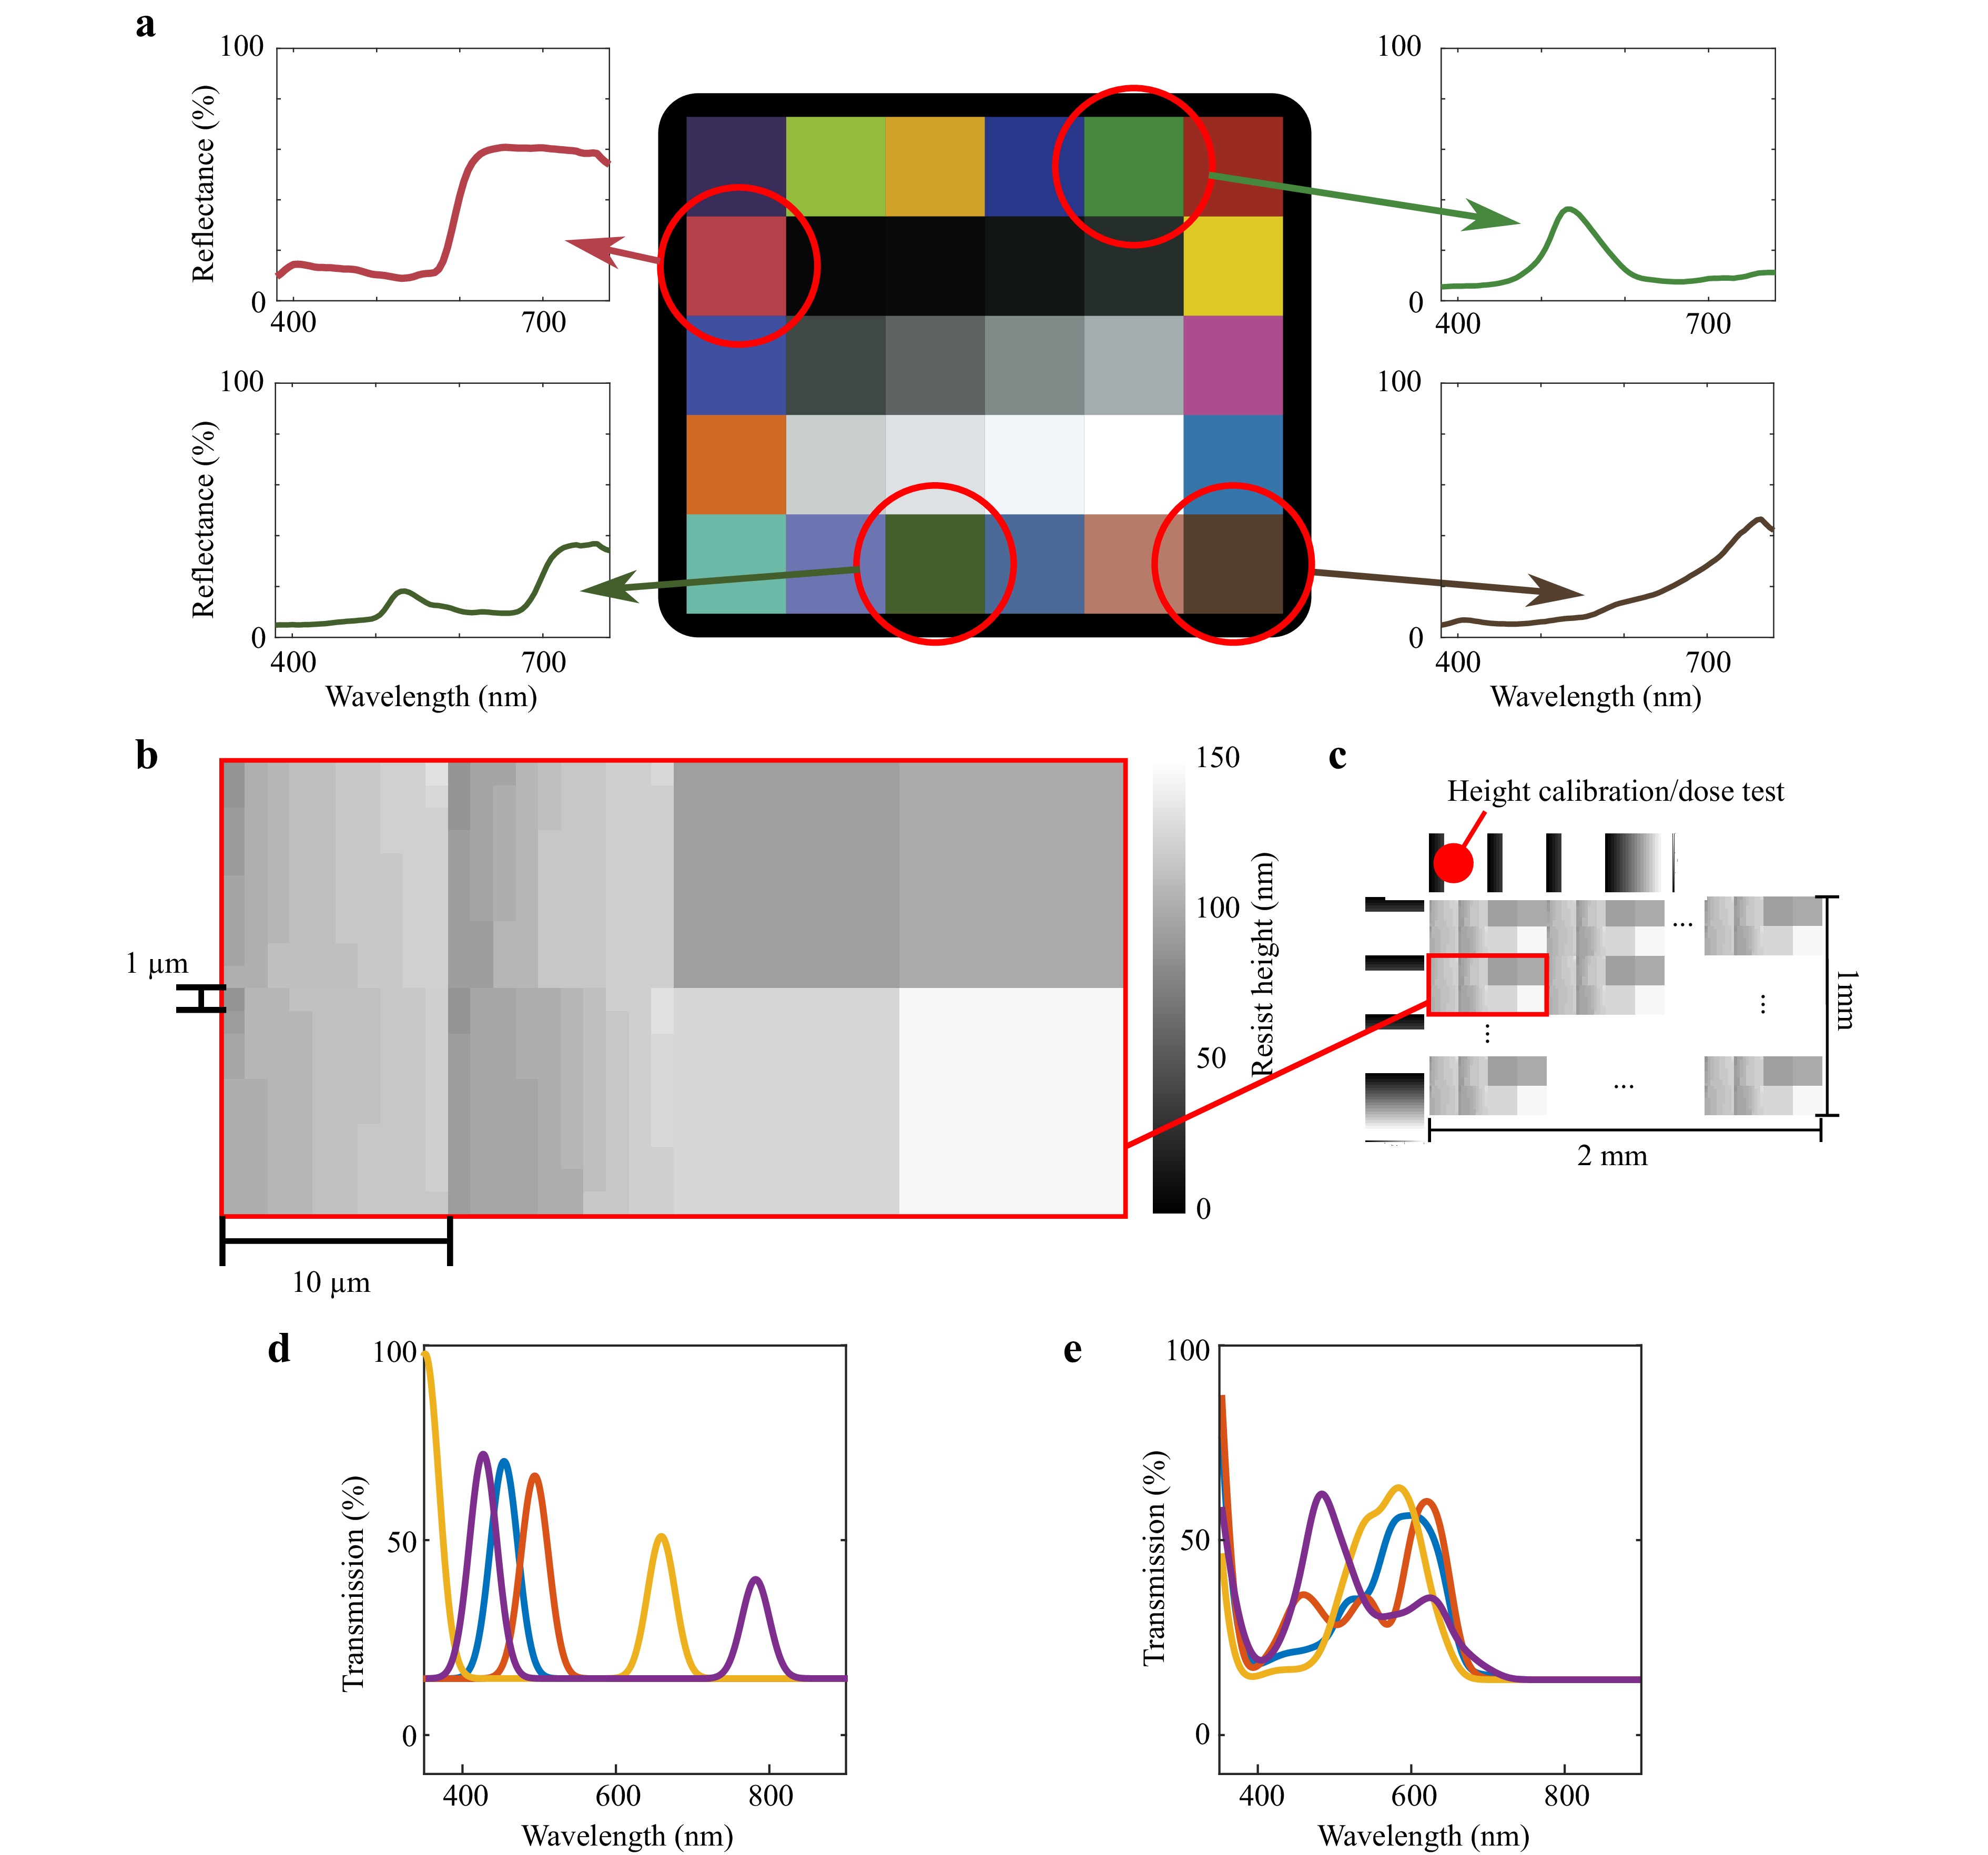
Fig. 6 Designing hyperpixels for optimal spectral unmixing. a Selected spectral reflectance targets on a Macbeth color checker chart, showing spectral reflectance profiles. b Unit cell of designed hyperpixel filter array, including 8 10 × 10 μm pixel designs: 4 hyperpixel designs (comprising 10 × 10 1 μm subpixel filters) and 4 bandpass filters with optimized center wavelengths. c Layout of the full filter array as fabricated, including height calibration targets around the edge. d Simulated spectra of bandpass filter pixels from filter array. e Simulated spectra of hyperpixel filters from filter array.
Four hyperpixel designs were produced as shown in Table 1.
As a benchmark we also designed 4 bandpass filters optimized for spectral unmixing of the same 4 selected targets. Because these are fabricated directly adjacent to each hyperpixel, they represent a benchmark comparison against conventional multispectral imaging technologies with a single bandpass filter per pixel. Specifically, for the set of 4 bandpass filters, parameterized by 4 center wavelengths, we multiply the filter spectral transmission profile with the expected spectral reflectance of each of the target areas. The output is the 4 × 4 matrix which, when inverted, produces an 'unmixing' matrix that recovers the correct abundances of the target spectra. The condition number of this matrix represents how 'well' the unmixing can be performed in the presence of noise and so we minimize this quantity as our optimization objective to produce optimal performance of the bandpass filters54. Similarly, the condition number of the hyperpixel filter set can also be computed. The ratio of these condition numbers is then computed to determine whether the hyperpixels should perform better or worse than the optimal bandpass filters for a particular set of spectral targets:
$$ \begin{aligned} r = \text{cond}({\bf{H}}_{bandpass}) / \text{cond}({\bf{H}}_{hyperpixel}) \end{aligned} $$ (1) where $ {\bf{H}}_{bandpass} $ is the 4 × 4 unmixing matrix of the optimized bandpass filters and $ {\bf{H}}_{hyperpixel} $ is the unmixing matrix for the hyperpixel filters. For the set of spectral reflectance targets in the MacBeth color chart, we find that $ r $ can vary from 0.1 (bandpass filters perform better) up to to 1.6 (hyperpixels perform better).
Finally, we create a layout for fabrication of the filter arrays with the 4 hyperpixels adjacent to the bandpass filters (Fig. 6b). By placing these regions together in a repeating array, we ensure that any localized fabrication variations (e.g. proximity effect from e-beam lithography, resist thickness etc) apply equally to all the different designs. The unit cells have dimension 20 μm × 20 μm and are repeated into an array of 1 mm × 2 mm (Fig. 6c). Around the edge of the array are height calibration targets with a linear ramp of 0 to 250 nm so that fabricated heights be validated with AFM or stylus profiler.
Using our previously described calibration method, which combines AFM and with optical microspectrophotometry and simulations (Fig. 5b), we map the target heights to expected spectral profiles for the bandpass filters, as shown in Fig. 6d. Similarly, we can also produce expected spectra for the hyperpixels by including second-order resonances using our previously described characterization approach1.
-
22 mm high precision glass coverslips (ThorLabs) were used as the substrates. Before processing, these were successively cleaned in ethyl lactate, acetone, methanol, and isopropanol (IPA), then dehydrated on a contact hotplate at 150°C for 3 minutes. For the first mirror layer, a thermal evaporator was used to deposit: a 1 nm Ti adhesion layer followed by 22 nm Ag and MgF$ _2 $ capping layer. The Ag was evaporated at a high deposition rate to improve the film quality.
As soon as possible after evaporation, a film of AR-7720 (Allresist GmBh) was spin-coated at 4000 rpm for 60 s. The resist was diluted using PGMEA (1-methoxy-2-propanol acetate), so an initial film thickness of 165 nm was produced. The sample was then placed in an electron beam lithography tool, NanoBeam nB5 (NanoBeam Ltd.). To vary the height of each pixel, the dose was varied using an earlier dose test which gave the contrast as 0.55. Different contrast curves (at varying dilutions) were required to reach the desired initial thickness with minimal contrast — initial data provided in Supplementary Figure S6. The exposed sample then had a post-exposure bake on a hotplate at 110°C for 60 s followed by a bake in an oven at 90°C for 2 hours; this latter step reduces the surface roughness of the film. The resist was developed in a TMAH (Tetramethylammonium hydroxide) based developer for 90 s and then rinsed with DI (deionized) water. This resulted in a resist pattern with varying heights. The second mirror layer was thermally evaporated, consisting of 22 nm of Ag and MgF2 encapsulation layer to prevent silver tarnishing, and is kept to < 30 nm.
In our current implementation, hyperpixels are fabricated on glass coverslips and imaged in a relay system onto the sensor. While this setup allows for rapid prototyping and validation in a laboratory setting, it is less suitable for real-world spectral imaging applications. For deployment, the standard commercial approach involves aligning and gluing a separate multispectral filter array (on glass or another substrate) directly onto the image sensor before curing, or alternatively, fabricating the filters directly on the sensor pixels. The former method is widely used, as demonstrated by companies like SILIOS Technologies20, who UV-cure multispectral filter arrays onto CMOS sensors. Since hyperpixels are structurally similar to these filters, they could thus also be aligned and glued onto image sensors, ensuring mechanical stability. The environmental and temperature stability of the system is primarily governed by the quality of the thin-film materials, substrate (glass), and UV-curing glue. The metallic (silver) mirrors are encapsulated to prevent tarnishing or delamination due to moisture and oxygen exposure. UV-curing glue offers excellent chemical and thermal stability (up to 200°C) with low shrinkage. The photoresist (AR-N 7720) is stable up to 140°C55, mechanically robust, and solvent-resistant due to its encapsulation. Overall, these materials and fabrication techniques introduce no additional environmental, thermal, or mechanical vulnerabilities beyond those present in commercial multispectral or RGB-dye (Bayer) sensors. In contrast, many commercial image sensors e.g. the SpecimIQ, operate only up to $ \sim $40°, which is limited by the sensor itself rather than the pixel filter coating16.
-
For spectral characterization, a modified Olympus BX-51 optical microscope was used to analyze the hyperpixel filter arrays. A UV-visible spectrometer (Ocean Optics HR2000+) was used to collect the spectral transmission data, while a digital camera (Lumenera Infinity-2 2MP CCD) was used to image the surface. The spectra collected were normalized using OceanView (Ocean Optics) software by collecting the bright and dark reference spectra. The bright spectra is obtained by using a non-metal coated area of the filter array i.e. just the light source transmitting through the glass.
The spectra of each sub-pixel was collected using a series 100x objective and centering the collection area over the center of the pixel. 4 spectra (at different spatial positions in the adjacent array areas) were collected and averaged to reduce noise.
In order to examine the variations in fabrication quality across the sample, 14 different regions across the fabricated filter array were sampled and spectra recorded from each bandpass and hyperpixel in the unit cell. The spectra from the bandpass filters were further analyzed by fitting a sum of two Gaussian curves to identify the first- and second-order Fabry-Perot resonance wavelengths and the FWHM. Direct measurement of the hyperpixel spectra is challenging because the circular aperture of the spectrometer collection fiber is mismatched with the square aperture of the pixel. Therefore, the bandpass filter spectra are used as a measure of deviation from designed height in each of the 14 sampled areas.
First, the center wavelength of each of the four bandpass areas is measured and plotted against the target height from the original design. A line is fitted to this. Then the target heights of the each of the subpixel filters in the hyperpixel filters are input into this fitted line and an adjusted actual center wavelength for each of the subpixel filters is found. This adjusted center wavelength, along with other parameters from the BP areas such as the FWHM and position of second-order resonance, are used to reconstruct a spectral transmission for each subpixel area. These are then summed to infer the overall hyperpixel filter response in this area of the filter array. This approach is used instead of directly measuring the hyperpixel because the typically circular aperture of most microscopes makes it difficult to measure a single square hyperpixel filter. We refer to this reconstructed hyperpixel spectral transmission response as the "inferred hyperpixel spectrum."
Based on these measured bandpass and inferred hyperpixel spectra, an unmixing matrix is formed by multiplying these transmission spectra by the ideal reflected spectra expected from the target areas on the color chart. The condition numbers of these matrices for the hyperpixel and bandpass areas are then computed and compared using a paired $ t $-test.
-
Our validation experiment was to image a Macbeth color chart target using the fabricated filter arrays placed on top of a CMOS image sensor. An optical imaging relay system was constructed for spectral imaging, illustrated in Fig. 3a. The target scene is illuminated by a halogen light source coupled to a ring light illuminator (Thorlabs, OSL2IR). The imaging system contains a first imaging lens: fixed-focal length camera lens (Navitar, 35 mm NMV-35M1; experiment working distance $ \geq $400 mm), a set of relay lenses (Thorlabs, AC254-075-A-ML), two 4× planar achromat objectives (Thorlabs, RMS4X) and monochrome camera (Basler, a2A3840-45umPRO) mounted in a rotational cage mount. The hyperpixels are mounted to xyz-translation stage (Thorlabs, MBT616D) located at the conjugate plane between the two objectives. The scene is imaged onto the hyperpixels, which is re-imaged onto the image sensor plane. A total magnification of ~2.2× is calculated in this arrangement. We use this simplified free-space approach to mimic a conventional snapshot multispectral camera whereby MSFAs are integrated directly atop the pixels.
Alignment of the hyperpixel array (relay plane) to the image sensor pixels is achieved through a manual 4-degree-of-freedom procedure using: fine translational control of the hyperpixels using the xyz-translation stage, rotational control of image sensor, while monitoring of the camera’s output image (with zoomed-in corner regions). Once the filter pixels are in focus and aligned (x-y) to the sensor plane, the mounts are locked into position. This approach provides sufficient alignment accuracy for spectral imaging characterization and concept verification.
-
Raw monochrome images from the camera were first straightened and cropped such that only the color chart area was included. Images were then demosaiced to produce multispectral image data cubes by manually identifying the same pixel type in 5-10 separate locations across the image then fitting a grid to these locations to determine the periodicity, location of each pixel type and offset (custom interactive MATLAB code, available from53). Once this grid is determined, the raw pixels within each filter array pixel are summed to form a single point in the hypercube. The demosaicking and interpolation process represents a reduction in resolution from the raw images: the raw images are 3840 × 2160 but each pixel in the pixel filter array covers around 11.05 sensor pixels as the pixel sizes were not matched to the sensors and the relay lenses create a 2.21 times magnification. The raw demosaiced images were therefore 174 × 49 pixels. Because the image height is scaled down twice as much due to the rectangular shape of the unit cell, the images in the hypercube are resampled to 1920 × 1080 to preserve aspect ratio.
A second processing step was then performed on the demosaiced images to identify each of the different spectral reflectance areas within the color chart. First, the flat spectral reflectance areas (white and black) were identified and used in a similar fashion to white and dark references in spectroscopy; pixels within these areas are averaged to create white and dark reference, $ r_{white} $ and $ r_{dark} $ respectively, for each of the channels in the hypercube. The dark reference was subtracted from each of the channels in the hypercube and then the white reference was used as a normalization value to divide values in each channel. Specifically:
$$ \begin{aligned} \hat{p}(x,y) = \frac{p(x,y) - r_{dark}}{r_{white} - r_{dark}} \end{aligned} $$ (2) where $ \hat{p}(x,y) $ is the corrected pixel value at position $ (x,y) $, $ p(x,y) $ is the raw pixel value and $ r_{white} $ and $ r_{dark} $ are the white and dark reference values respectively.
Because of the fixed power constraint of the hyperpixel design, we expect that all pixels in the white reference areas should transmit approximately the same total power and so this normalization is applied independently to each channel in the BP and hyperpixel filter arrays.
Finally, the four target spectral areas are identified. The pixel values within each of these 4 areas are averaged and this is repeated for the 4 channels representing the hyperpixels and bandpass filters. The result is 16 values for each of the bandpass and hyperpixel cases, which are arranged into the 4 × 4 unmixing matrices, similarly to the spectral analysis case. The condition numbers of these matrices represent quality of unmixing. For visual comparison, the 4 target regions in the hypercube images are unmixed, using the computed spectral unmixing matrix, and are plotted in a 2 × 2 array for each of the hyperpixel and bandpass cases. To quantify the effect of fabrication variation across the sample on performance, the unmixing matrices are computed for 10 different areas across the pixel filter array and a $ t $-test is used to establish whether a statistically significant reduction in condition number is achieved. Due to the difficulty in controlling noise levels, directly estimating the same SNR quantities used in simulations (see Eq. 7, 8) is challenging. Therefore, we rely on the condition number of the unmixing matrix, $ {\bf{M}} $ (defined in Eq. 6), which effectively relates the unmixed and raw SNR values.
-
To quantify the unmixed SNR advantage provided by the hyperpixel design, we developed a Monte Carlo simulation method for a 4-element pixel filter array designed to discriminate among a broad range of realistic spectra. To generate spectral profiles representative of real-world samples, particularly biological samples, we employed a Gaussian process regressor with a radial basis function kernel (length scale parameter = 30). This approach generated multiple sets comprising 4 random spectra spanning the 400 – 900 nm range, mimicking the relatively broad spectral features commonly observed in biological spectroscopy applications39. An example of the generated spectra is shown in Fig. 7. The spectra are considered to be reflectance spectra and are normalized such that the values range from 0 to 1 (or, equivalently, 0–100%). This represents a useful and challenging practical case, and we note that using non-normalized spectra, where the maximum and minimum are allowed to fall somewhere in the range 0 to 1, actually leads to a greater performance improvement of hyperpixels over bandpass filters (see Supplementary Figure S10). This process was repeated 500 times, producing 500 unique sets of 4 random spectra to comprehensively evaluate the performance of the hyperpixel design.
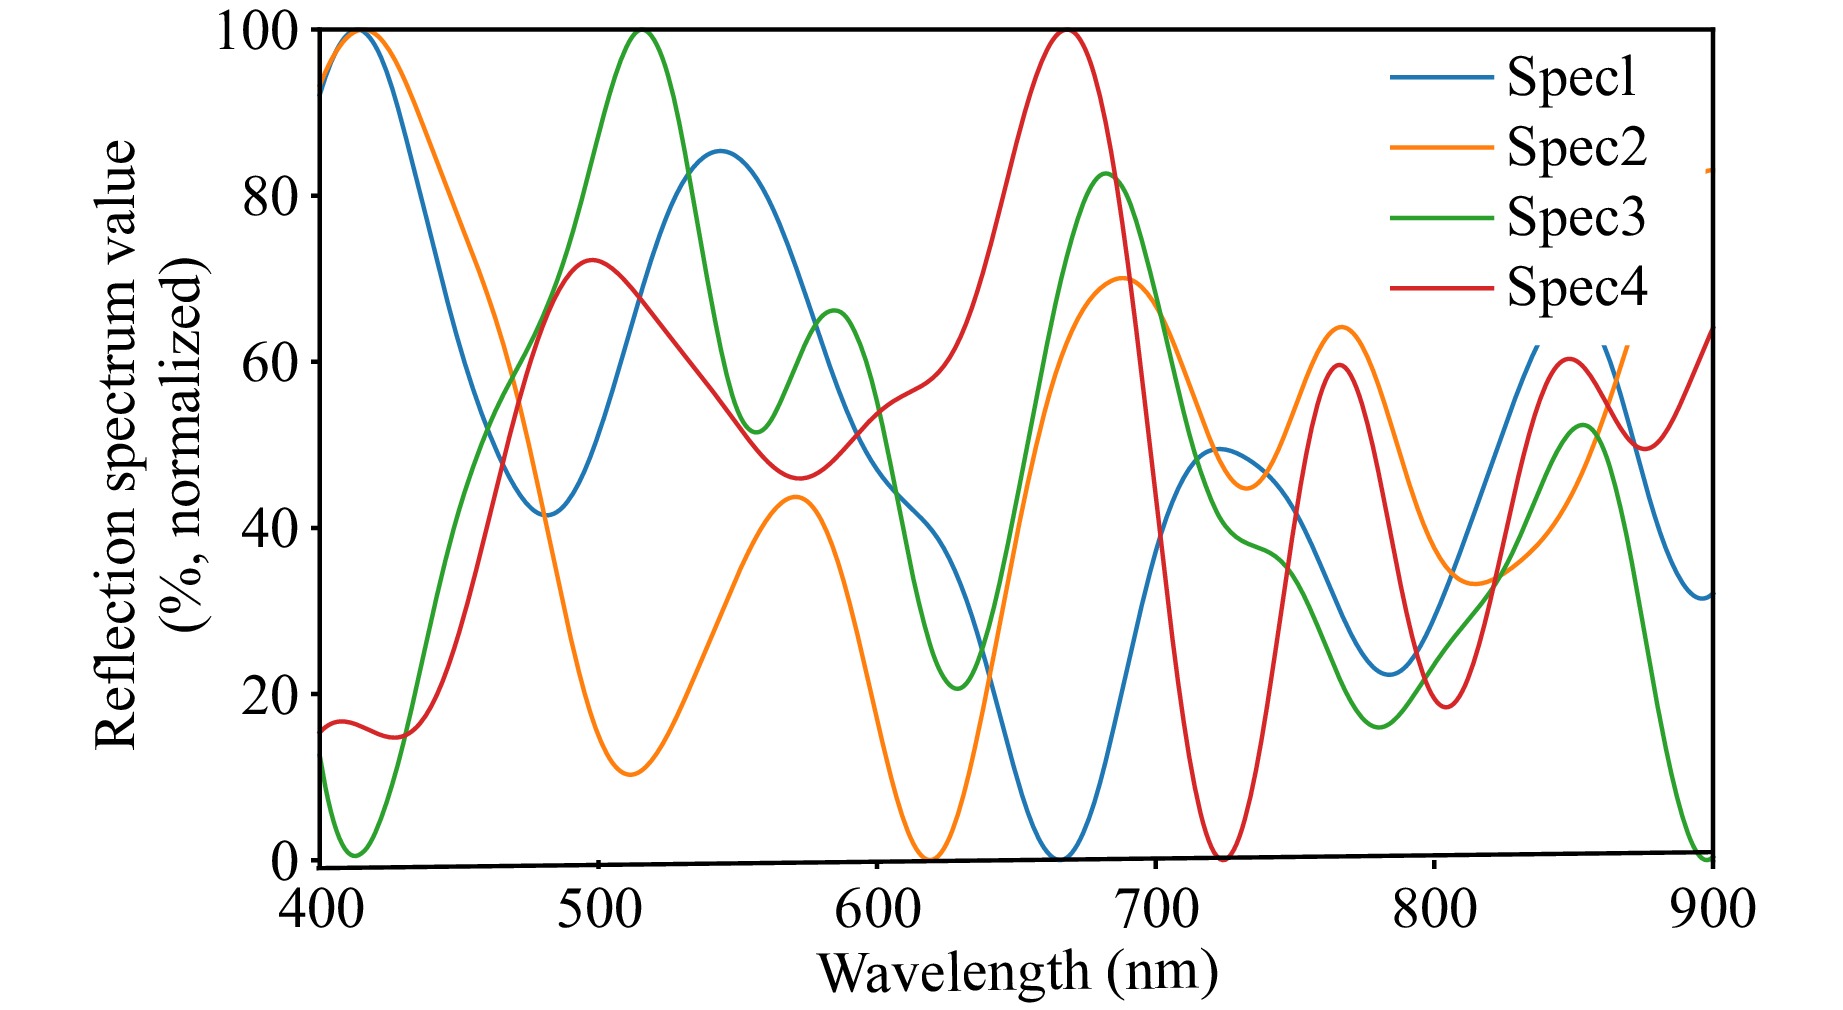
Fig. 7 Example of 4 randomly generated realistic broadband spectra using Gaussian process regression.
To examine the edge case of highly correlated spectra, we introduced a parameter $ \rho $, ranging from 0 to 1. The Gaussian process regressor is first used to generate a random spectrum, $ {\bf{s}}_1 $, and subsequent spectra are generated as follows:
$$ \begin{aligned} {\bf{s}}_{n} = \rho {\bf{s}}_1 + \sqrt{1-\rho^2} \, {\bf{\hat{s}}}_n \end{aligned} $$ (3) where $ {\bf{\hat{s}}}_n $ is sampled from the same Gaussian process regressor as $ {\bf{s}}_1 $. In this formulation, $ \rho = 1 $ results in identical spectra, while $ \rho = 0 $ produces fully independent (save for the correlation inherent in the Gaussian process), randomly generated spectra. Example spectra are shown in Supplementary Figure S8. For this study, we examine the edge case of highly correlated spectra by using $ \rho = 0.95 $.
Two sensor designs were compared in this study. First, in the reference design, each pixel was implemented as a simple Fabry-Perot bandpass filter, with the center wavelength of each filter optimized to maximize the unmixed SNR, as defined in Equation 7. Second, was the hyperpixel design in which each of the four pixels is tailored to match one of the four target spectra, denoted as $ {\bf{s}}_1 $, $ {\bf{s}}_2 $, $ {\bf{s}}_3 $, and $ {\bf{s}}_4 $.
To ensure a fair comparison between the two approaches, the simulated spectral transmission profiles were normalized to account for the power efficiency constraint of the hyperpixel design. For testing the impact of random variation, a random spectral shift was applied to both the hyperpixel and bandpass filter designs. These shifts were drawn from a Gaussian distribution with a full-width at half-maximum (FWHM) of 100 nm (derived from experimental measurements), and the process was repeated for 20 different random shifts. In the case of systematic variation, the hyperpixel spectral response was uniformly shifted by 50 nm toward the blue.
We then generated 1000 random mixtures of the four target substances spectra using the following equation:
$$ \begin{aligned} {\bf{s}}_{\text{test}} = w_1 {\bf{s}}_{1} + w_2 {\bf{s}}_{2} + w_3 {\bf{s}}_{3} + w_4 {\bf{s}}_{4} + {\bf{n}}_{\text{spec}} \end{aligned} $$ (4) where $ {\bf{s}}_{\text{test}} $ is the test spectrum; $ {\bf{s}}_{1} $, $ {\bf{s}}_{2} $, $ {\bf{s}}_{3} $, $ {\bf{s}}_{4} $ are the discretized reflection spectra of the 4 randomly generated target substances as column vectors; $ w_1 $, $ w_2 $, $ w_3 $, $ w_4 $ are randomly selected weights between 0 and 1 such that $ w_1 + w_2 + w_3 + w_4 = 1 $, and $ {\bf{n}}_{\text{spec}} $ is a vector of white Gaussian spectral noise whose noise power is increased from $ 10^{-4} $ to $ 10^{-0.5} $ in logarithmic steps of $ 10^{0.5} $. This range of noise power was chosen to encompass scenarios ranging from negligible noise, where the spectral signal dominates, to cases where the noise becomes degenerate and matches the power of the spectral signal, enabling a comprehensive evaluation across varying noise conditions. If we wish to simulate illumination mismatch, each test spectrum, $ {\bf{s}}_{1} \dots {\bf{s}}_{4} $, can be multiplied by the spectral profile of a given light source. Here, we use a ThorLabs OSL2 halogen light source to simulate a mismatch, assuming the pixel structures were designed for a spectrally flat light source. Notably, such a mismatch is avoided in our experimental results by incorporating the final illumination source into the design process.
We then applied a simple linear detection and spectral unmixing approach to estimate spectral abundances, $ {\bf{y}} $, from the text mixture $ {\bf{s}}_{\text{test}} $:
$$ \begin{aligned} {\bf{y}} = {\bf{M}} \begin{bmatrix} {\bf{h}}_1^T \\ \vdots \\ {\bf{h}}_4^T \end{bmatrix} {\bf{s}}_{\text{test}} + {\bf{n}}_{\text{sensor}} \end{aligned} $$ (5) $$ \begin{aligned} {\bf{M}} = \left( \begin{bmatrix} {\bf{h}}_1^T \\ \vdots \\ {\bf{h}}_4^T \end{bmatrix} \begin{bmatrix} {\bf{h}}_{1} & {\bf{h}}_{2} & {\bf{h}}_{3} & {\bf{h}}_{4} \end{bmatrix} \right)^{-1} \end{aligned} $$ (6) where $ {\bf{h}}_1 $, $ {\bf{h}}_2 $, $ {\bf{h}}_3 $, $ {\bf{h}}_4 $ are the spectral transmission functions of the pixel designs being tested, $ {\bf{n}}_{\text{sensor}} $ is a vector of random Gaussian noise arising on the sensor (assumed to be thermal noise), and $ {\bf{M}} $ is the optimal spectral-unmixing matrix. In the hyperpixel case, $ {\bf{h}}_n = {\bf{s}}_n $, whereas $ {\bf{h}}_n $ represents a bandpass response in the bandpass case.
For any given test input, $ {\bf{s}}_{\text{test}} $, the unmixed SNR is computed by first setting $ {\bf{n}}_{\text{spec}} $ and $ {\bf{n}}_{\text{sensor}} $ to 0 and computing the signal $ {\bf{y}}_{\text{sig}} $. Next, noisy versions are computed by adding in appropriately scaled noise vectors for $ {\bf{n}}_{\text{spec}} $ and $ {\bf{n}}_{\text{sensor}} $ to obtain $ {\bf{y}} $. SNR is then computed as:
$$ \begin{aligned} \text{unmixed SNR} = \frac{\|{\bf{y}}_{\text{sig}}\|_1}{\|{\bf{y}} - {\bf{y}}_{\text{sig}}\|_1} \end{aligned} $$ (7) where the $ \ell_1 $ norm is used because the values in $ {\bf{y}} $ and $ {\bf{y}}_{\text{sig}} $ represent optical powers. This quantity represents the SNR of the spectral abundance estimation following a linear unmixing process. By contrast, the raw SNR is the SNR prior to the unmixing process, given by:
$$ \begin{aligned} \text{raw SNR} = \frac{\|{\bf{s}}_{\text{test}} - {\bf{n}}_{\text{spec}}\|_1}{\|{\bf{n}}_{\text{spec}}+{\bf{n}}_{\text{sensor}}\|_1} \end{aligned} $$ (8) The results of the simulation are plotted as graphs of unmixed SNR vs. $ \dfrac{1}{\text{raw SNR}} $. For experimental results, the noise levels cannot easily be controlled. Therefore, the condition number of the unmixing matrix, $ {\bf{M}} $, which relates unnmixed and raw SNR values, is used instead.
-
The authors thanks the Nottingham Nano- and Micro-scale Research Centre (nmRC) for fabricating all samples. The authors acknowledge support from a UKRI Future Leaders Fellowship (MR/T041951/1, GSDG), Cancer Research UK (A9545/A29580, SEB) and EPSRC (EP/R003599/1, SEB), and a NanoPrime grant from the Nottingham Nano- and Micro-scale Research Centre (EP-/R025282/1). Data in this study available at Ref. 53.
Hyperpixels: pixel filter arrays of multivariate optical elements for optimized spectral imaging
- Light: Advanced Manufacturing , Article number: (2025)
- Received: 19 June 2024
- Revised: 24 July 2025
- Accepted: 14 August 2025 Published online: 25 October 2025
doi: https://doi.org/10.37188/lam.2025.067
Abstract: Spectral imaging systems are critical for revealing new information about the structure and composition of diverse samples, but traditional approaches that use generic ‘bandpass’ spectral filters are sub-optimal in challenging scenarios with low data signal-to-noise ratio (SNR). To address this, we introduce the concept of hyperpixels: a novel, compact, application-specific spectral filter array approach compatible with integration atop CMOS image sensors. Each element of a hyperpixel filter array is engineered to selectively transmit specific spectral components optimized for the target application, analogous to arrays of multivariate optical elements designed for analyte sensing. Hyperpixels achieve spectral tailoring through precise height engineering of multiple sub-pixel Fabry-Perot resonators covering each pixel area. Building on our earlier work exploring the feasibility of this approach
Research Summary
Hyperpixels: tailored ‘smart’ pixels for better spectral imaging
Spectral imaging - which can reveal material composition or chemical concentrations - just got smarter. Williams et al. at the University of Exeter UK, in collaboration with colleagues at the Universities of Cambridge and Nottingham UK, have created “hyperpixels”: bespoke filter mosaics that sit directly on CMOS camera sensors. Conventional camera sensors rely on generic red‑green‑blue band‑pass filter mosaics, but these perform poorly in dim or spectrally complex scenes. Hyperpixels replace simple filters with ‘micro-staircases’ of Fabry–Perot resonators, whose step heights are optimally tuned to transmit the perfect balance of wavelengths for a specific task. The hyperpixel prototype reported delivers a 3.5‑fold boost in signal‑to‑noise ratio over the best possible band‑pass designs and is robust to manufacturing errors. Compact, manufacturable and customizable, hyperpixels could bring fast, application‑specific spectral vision to capsule and micro‑endoscopes and machine‑vision systems.
Rights and permissions
Open Access This article is licensed under a Creative Commons Attribution 4.0 International License, which permits use, sharing, adaptation, distribution and reproduction in any medium or format, as long as you give appropriate credit to the original author(s) and the source, provide a link to the Creative Commons license, and indicate if changes were made. The images or other third party material in this article are included in the article′s Creative Commons license, unless indicated otherwise in a credit line to the material. If material is not included in the article′s Creative Commons license and your intended use is not permitted by statutory regulation or exceeds the permitted use, you will need to obtain permission directly from the copyright holder. To view a copy of this license, visit http://creativecommons.org/licenses/by/4.0/.

 DownLoad: