


-
Image-guided percutaneous needle biopsy (PNB) of neoplasms is regarded as the gold standard for suspected cancer, as it helps define the stage of the disease and the primary location of metastatic tumours. According to modern medicine, objective verification of the presence and nature of tumour pathology can be performed only through histological and cytological studies.
Image-guided PNB includes core biopsy (cutting and trephine biopsies) using needles with an internal diameter of at least 1.0 mm and fine-needle aspiration biopsy using needles with diameters below 1.0 mm1,2. A physician chooses the optimal biopsy technique based on clinical guidelines, the organ to be examined, and the specific clinical case. Fine-needle aspiration biopsy has the advantage of minimised tissue damage, thereby reducing the risk of complications. Trephine biopsy involves a more traumatic procedure, but it has a higher diagnostic potential because of the availability of larger, high-quality histological specimens3. These morphological specimens provide more diagnostic information about the carcinogenic process (tumour invasion, histological type, etc.), which is paramount to determining the treatment strategy for a specific clinical case. Fine-needle aspiration biopsy is widely used to obtain biopsy specimens for cytological examination, and tissue fragments can be obtained for histological analysis even with small-diameter needles using a proper rotational technique4. However, the most optimal approach is using 16–18G needles, which enable adequate morphological evaluation of both focal masses and diffuse changes in parenchymal organs (including the liver). This approach provides both cytological and histological materials, and the 16–18G (large diameter) needles minimise the risk of complications by reducing the number of passes required5.
Although image-guided PNB is a safe and effective tool for tissue sampling, there is a risk of obtaining non-informative samples and false-negative results, which can reach up to 25% according to various data6–9. There are two reasons for the high diagnostic inefficiency of biopsies. First, the complexity of the procedure, wherein a surgeon controls the position of the needle tip using a screen in the projection plane. Minimally invasive surgery requires the utmost care and concentration, as the patient’s breathing and involuntary movements during local anaesthesia, which is preferred for these procedures, have a strong influence on the movement of surgical puncture tools. If the area for biopsy is not properly selected, the biopsy specimens may contain connective or inflammatory tissues and necrotic areas of adipose tissue. Second, the inexperience or lower qualification of a surgeon, which is typically rare, can lead to poor puncture techniques, or that of a histologist/cytologist can lead to pathomorphological examination data misinterpretations.
To overcome the abovementioned problems, new technologies that objectively help surgeons to identify the position of the puncture needle tip, determine the metabolic status of biological tissues, and obtain a preliminary diagnosis of the type of neoplasm must be developed to improve the treatment of malignant neoplasms.
Optical technologies are highly sensitive for the in vivo assessment of perfusion and metabolic parameters in biological tissues10–12. Advancements in the design of fibre optics, light sources, and detectors have stimulated unprecedented development of optical methods that enable instant evaluation of the functional and pathological states of biological tissues to solve clinical problems in surgery13–17. The development of unique optical technologies has enabled the integration of diagnostic tools for image-guided PNB based on various optical techniques.
Optical coherence tomography (OCT) is used to image the architectural morphology of tissues with high spatial resolutions. Needle format OCT is the basis for visualising pathological tissue at the microscopic level and improving the safety of puncturing procedures by identifying damaged vessels18–21. This approach has been described for in vivo clinical applications in brain-22 and lung-tumour biopsies23.
Raman spectroscopy (RS) is also used in minimally invasive puncture surgery to study the molecular signatures of biological tissues24. RS has been developed to guide surgical tools for targeted biopsies of brain neoplasms25.
Laser Doppler flowmetry (LDF) provides a dynamic assessment of perfusion in the microvascular bed by measuring the Doppler shift in the laser signal caused by scattering from the moving red blood cells26. For example, a multimodal fibre-optic system was used for intraoperative navigation during stereotactic brain biopsy, and an LDF channel was used to monitor the vessel location in the target area to reduce the risk of bleeding27.
Among the wide range of optical methods, diffuse reflectance spectroscopy (DRS) and fluorescence spectroscopy (FS), as well as their combined multimodal applications, are the most commonly used diagnostic methods, specifically in minimally invasive surgery. These methods are the most intensively developed and widely implemented for solving real-time surgical diagnostic tasks in vivo; therefore, they are discussed in detail here.
-
The structural and biochemical properties of an area of interest can be determined from the reflectance signal using the DRS method28,29. Alterations in tissue morphology, such as hyperplasia, degradation of collagen in the extra-cellular matrix, and an increased nuclear-cytoplasmic ratio accompanying various diseases, contribute significantly to the scattering properties of biological tissues30,31. Changes in haemoglobin absorption properties can also be used to evaluate tissue saturation, angiogenesis, tissue hypoxia, and ischaemia32–35. DRS is actively used to diagnose neoplasms and the functional state of tissues36–39.
Theodoor J. M. Ruers made a significant contribution to the introduction of DRS in optical PNB in oncology. Reference40 describes an in vivo real-time DRS study of lung tissue characteristics using a specially designed fibre-optic probe for the targeted puncture biopsy of lung tumours. The proposed approach revealed promising diagnostic parameters independent of the blood present at the needle tip, namely, water content and scattering parameters, for differentiating normal lung tissue from tumour tissue. The proposed system has been used for the in vivo detection of breast cancer41. Analysis of diffuse reflectance spectra recorded directly during biopsy and support vector machine (SVM)-based classifiers distinguished malignant tissue from healthy tissue with an accuracy of 0.93. Brown et al. developed a breast cancer diagnostic biopsy system using special fibre-optic probes compatible with 10G and 14G biopsy needles42. In vivo studies have shown that haemoglobin saturation is significantly lower in malignant tissues than in non-malignant tissues and is negatively correlated with tumour size and morphology. Thus, DRS can be integrated into surgical puncture tools to obtain data with high diagnostic significance.
-
The FS method is based on the recording of the autofluorescence of biological tissues after excitation with monochromatic light. Most endogenous fluorophores are related to the structure or metabolic processes that determine the functional state of biological tissues43–46. Based on the respiratory chain activity, it is possible to predict cell death, diagnose tissue ischaemia, or detect malignant activity. Many studies on FS have focused on its application in oncology47–53.
The estimation of NADH content using the FS method is noteworthy, as it is the most widely used method for assessing metabolic states and disorders at both cellular and tissue levels. Chance et al. demonstrated in the 1950s that NADH in its reduced form exhibits autofluorescence54,55, thereby enabling the determination of the redox state of NADH by measuring the NADH fluorescence intensity56. Mayevsky et al. contributed significantly to the implementation of FS in clinical practice10,57. They demonstrated that the fluorescence intensity of tissue NADH could be used as an indicator of hypoxia58. To overcome the problems associated with the influence of tissue scattering properties, Lakowicz et al. proposed measuring the NADH fluorescence lifetime59, which was used as the basis for fluorescence lifetime imaging microscopy (FLIM) and time-resolved FS methods. These methods have the advantage of sensitivity to intermolecular interactions of endogenous fluorophores with overlapping spectra60, including free and protein-bound NADH, both quantitatively independent of the intensity. Free NADH has a relatively short lifetime of ~0.4 ns. Depending on the microenvironment, the average fluorescence lifetime of protein-bound NADH varies between 1.0 and 4.0 ns61–63. Changes in the free-to-bound NADH ratio can be used to assess the metabolic redox status of the cells and tissues64.
The FS method was one of the first optical biopsy methods used in clinical surgical practice for the diagnosis of biological tissues. Endoscopic intraoperative diagnostic systems are actively used to detect dysplastic lesions and tumour tissues in various parts of the gastrointestinal tract65–69.
To implement FS in optical PNB in oncology, a diagnostic system for core breast biopsy with a fibre-optic probe compatible with cutting needles was developed51, and a classifier for differentiating malignant and fatty specimens was proposed70. Based on the FS method, a minimally invasive medical device, the Probea (Nodea Medical, France), was developed using an optical fibre integrated into a 25G puncture needle. The Probea fibre optic system was tested during minimally invasive surgical puncture procedures for the detection of benign and malignant lung and breast neoplasms71,72.
-
One of the most promising and rapidly emerging directions is the multimodal approach to optical diagnostics, where two or more optical technologies are used simultaneously in diagnostic systems39,50,73. This approach helps obtain diagnostic information from almost the same diagnostic volume of biological tissue, providing a comprehensive description of the perfusion and metabolic changes occurring in that tissue. A complementary application of the FS and DRS methods was also used for puncture biopsy.
Under the supervision of Theodoor J. M. Ruers, a multimodal system (DRS&FS) was developed to detect colorectal liver metastases in vivo74. The spectra were recorded using specially designed disposable 15G needles. Overall, the DRS sensitivity and specificity reached 95% and 92%, respectively. The parameter describing the bile volume content was the most discriminatory. The addition of FS channel data to the classification did not improve the diagnostic accuracy of the method.
Multimodal spectroscopy was applied to a system for improving the detection of pancreatic adenocarcinoma during fine-needle aspiration biopsies75. The developed fibre-optic probe was compatible with a 14G angiocatheter and was inserted into the area of interest after the stylet was withdrawn from the needle. Analysis of the spectral ratios in each diagnostic channel revealed statistically significant quantitative differences between adenocarcinoma and normal tissues measured in vivo.
Thus, the reviewed optical technologies, especially multimodal ones, seem to be promising for solving a number of diagnostic tasks in puncture surgical procedures. This multimodal approach has been used as the basis for the development of surgical systems to determine perfusion and metabolic parameters of biological tissues during puncture surgeries.
-
The authors helped design and develop two systems for the determination of perfusion and metabolic parameters of biological tissues during puncture surgeries (Fig. 1a).
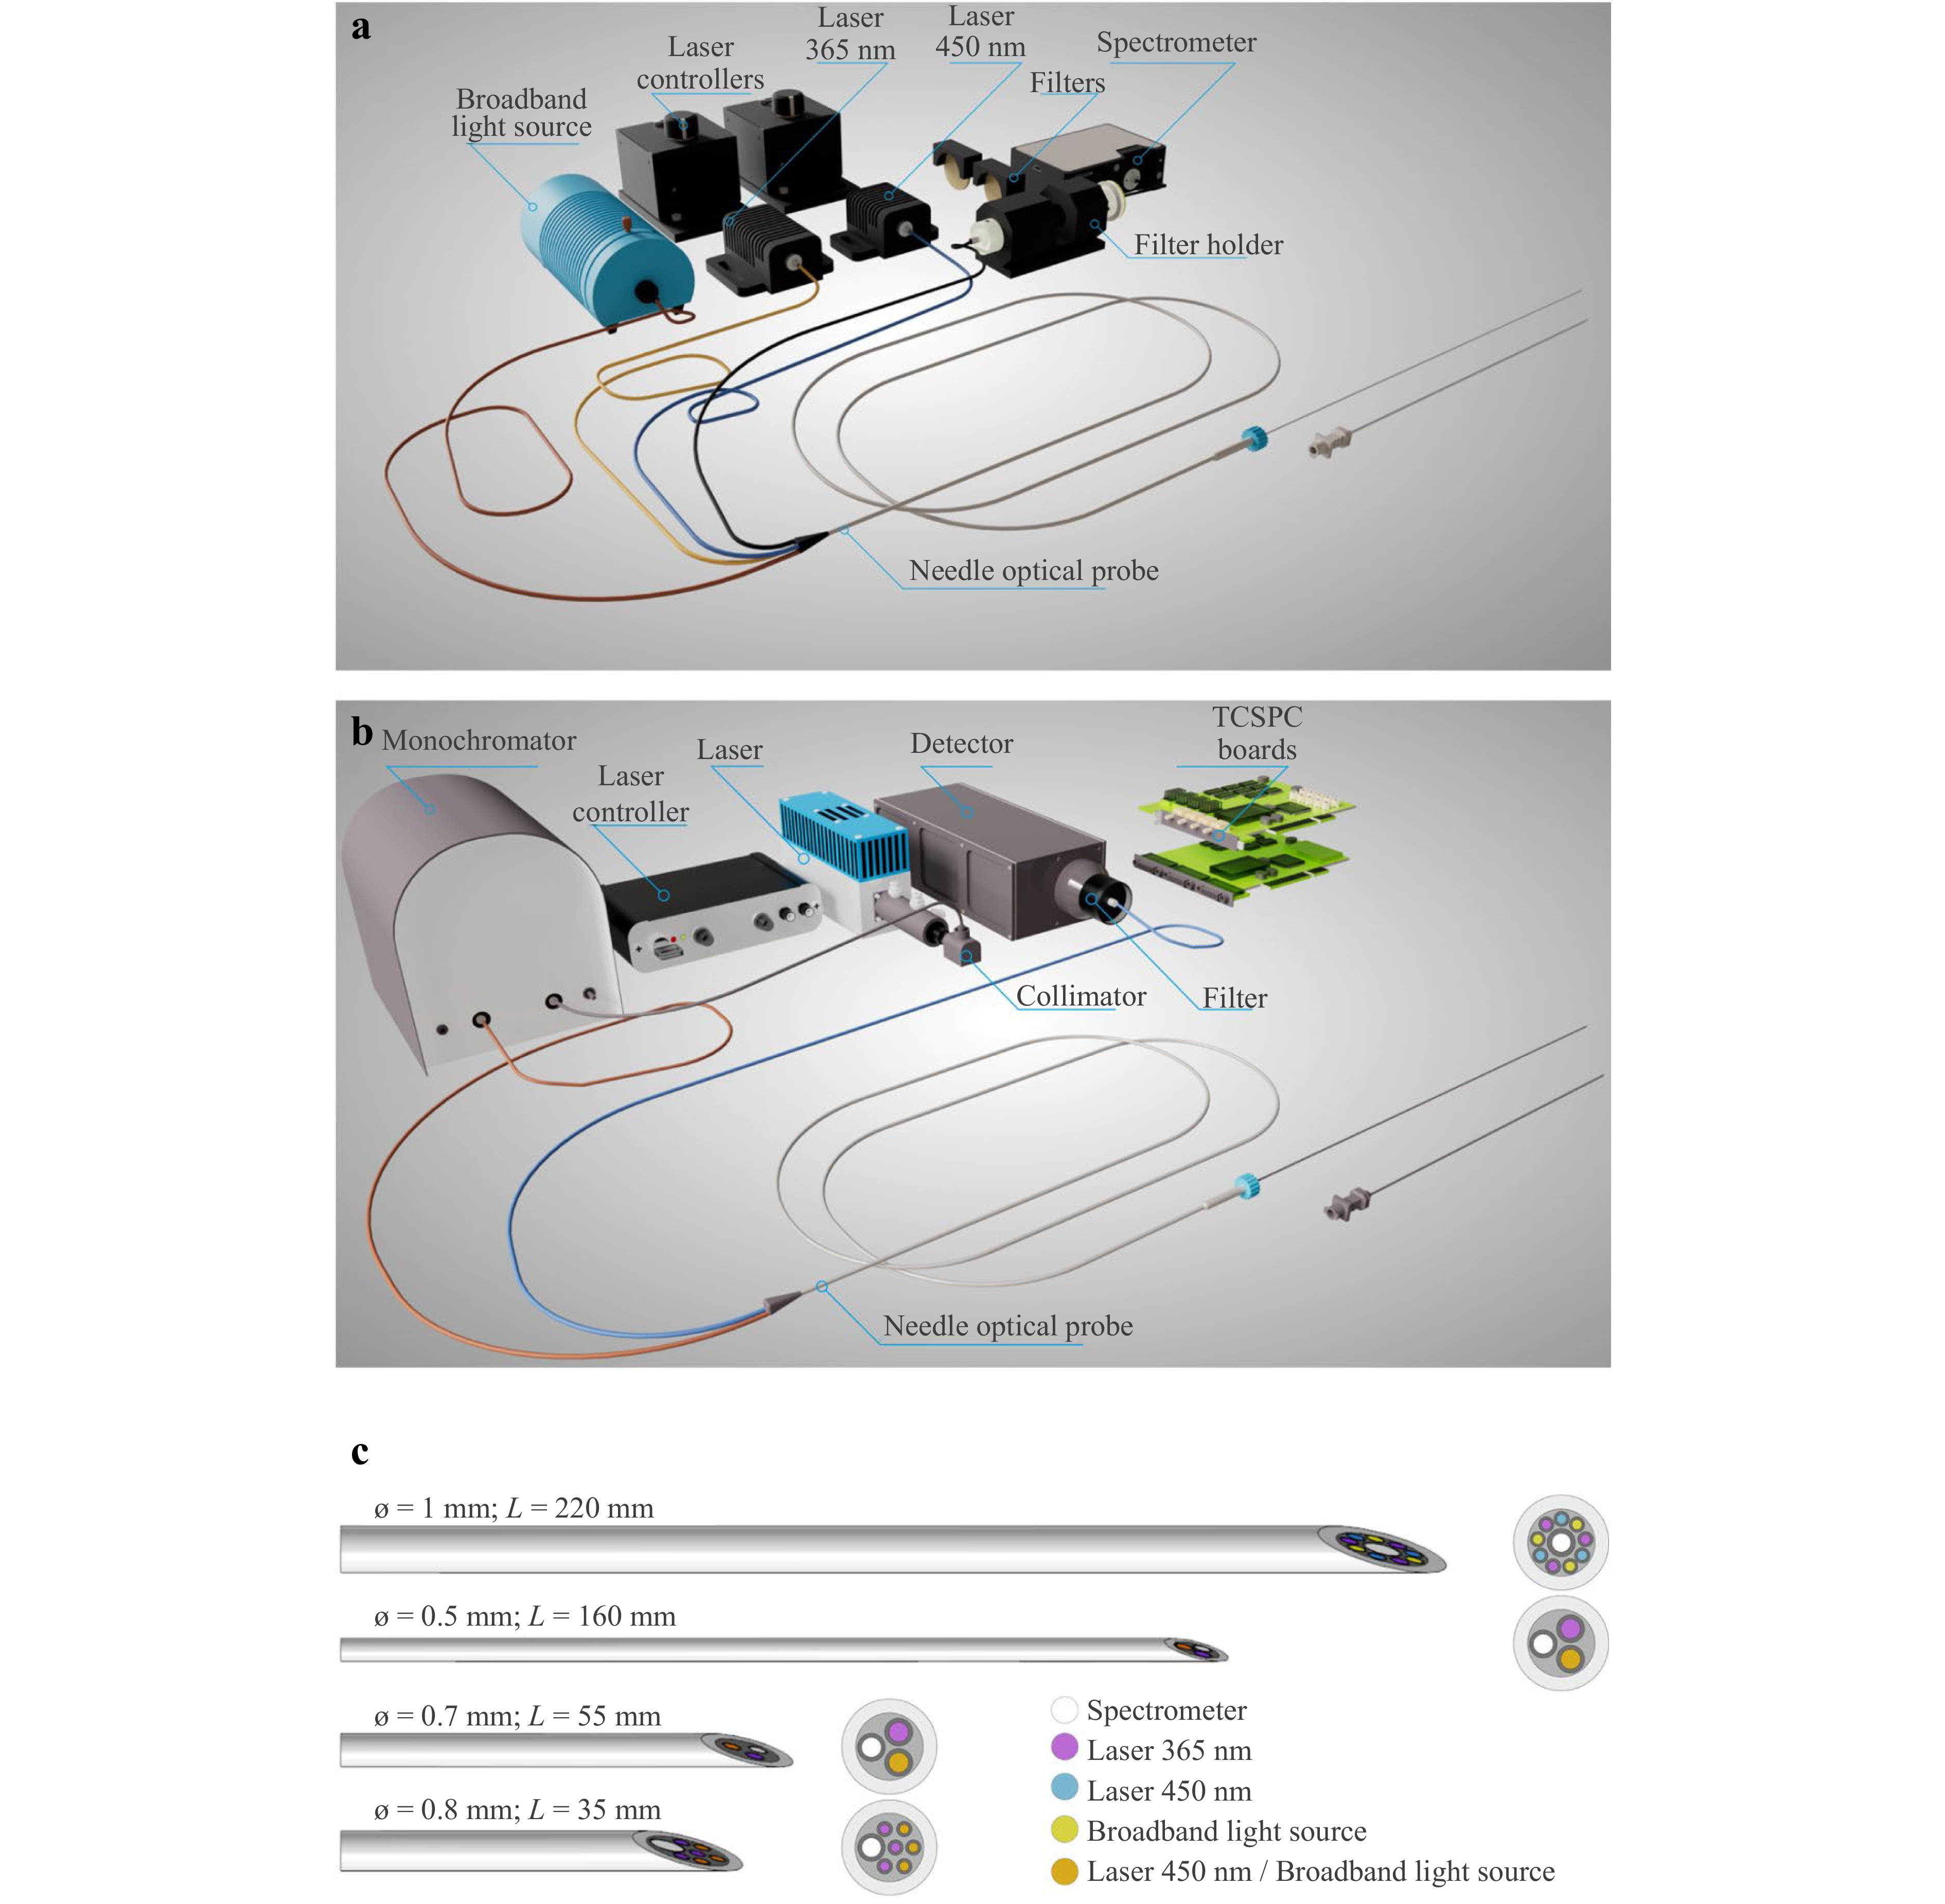
Fig. 1 Intraoperative optical diagnostic systems: a fluorescence and diffuse reflectance spectroscopy system; b time-resolved fluorescence spectroscopy system; c fine-needle fibre optic probes.
The first system for intraoperative optical diagnostics (Fig. 1a) contained two channels: FS and DRS. The FS channel analysed the state of cell metabolism according to the intensity of autofluorescence of endogenous fluorophores when the tissue was illuminated with UV or visible radiation. The DRS channel was used to evaluate the absorption properties of the biological tissues and the contents of various chromophores76. The FS channel contained 365 and 450 nm lasers (SPE Lazma Ltd., Russia) with an output power ≤1.5 and 3.5 mW, respectively. The choice of these wavelengths was based on the NADH and FAD metabolic cofactors and collagen fluorescence excitation. The DRS channel contained a tungsten halogen broadband light source HL-2000-FHSA, 360–2400 nm (Ocean Insight, USA). The channel for measuring the autofluorescence of biological tissues was equipped with FGL400 and FGL495 optical filters to attenuate backscattered radiation (Thorlabs, Inc., USA). Spectra were recorded using a FLAME-T-VIS-NIR-ES CCD spectrometer (Ocean Insight, USA). The device was controlled using a personal computer with a specially designed software.
The time-resolved FS system (Fig. 1b) was designed to record the fluorescence of the NADH coenzyme in the free and protein-bound states77. A BDS-SM-375-FBC-101 laser (Becker & Hickl, Germany) was used to excite the fluorescence at 375 nm. A hybrid detector HPM-100-40 (Becker & Hickl, Germany) with a spectral range of 250–720 nm and a quantum efficiency of 45% (at 500 nm) was used for photon counting. Time-correlated single-photon counting was performed using a TCSPC SPC-130-EMN board (Becker, Hickl, Germany). An MF479-40 bandpass filter (Thorlabs, Inc., USA) was used to extract the spectral region of interest in the fluorescence emission. The appearance of both systems under clinical conditions is shown in Figs. S1 and S2 in the Supplementary Information.
Fine-needle fibre-optic probes are important technical elements of these systems. In cooperation with Optofiber LLC (Moscow, Russia) and SPE Lazma Ltd. (Moscow, Russia), the authors designed and manufactured probes of different lengths, diameters, and fibre configurations. A set of probes compatible with standard puncture needles (Fig. 1c) helped obtain diagnostic information directly from biological tissues during various puncture surgeries without additional incisions during routine surgical procedures because of the optimal choice of technical solutions.
Fine-needle Y-type fibre-optic probes are designed to transmit optical radiation in two directions: (1) from the radiation sources of the exposure unit to the biological tissue and (2) from the biological tissue to the optical radiation detectors of the registration unit. As these probes are intended for use with standard puncture biopsy needles, their design should ensure unobstructed mechanical coupling with existing products. The outer diameter of the developed probes was limited by the inner diameter of standard minimally invasive surgical tools. Multi-fibre probes can provide more optical radiation distributed over a larger area with multiple fibres and collect significantly more signals, resulting in a higher signal-to-noise ratio over shorter time intervals. For multimodal diagnostics in a multi-fibre layout, switching between multiple radiation sources can be performed, thereby enabling multimodal spectroscopy.
Fine-needle fibre optic probes (Fig. 1c) of various lengths and diameters were proposed for PNB for navigation and preliminary diagnosis of the tumour type and its metabolism. Each probe was compatible with the PNB needle and equipped with connectors for proper positioning of the probe in the lumen of the needle cannula. The choice of probe for examination was determined by the characteristics of the target organ, such as tissue type, depth of pathological changes, and intensity of blood supply. All fine-needle fibre optic probes were manufactured with a 20° bevel, similar to the standard needle bevels used for PNB, to ensure the maximum area of direct contact with the tissue under study and to change the position of the probe if necessary (dynamic measurement). This enabled the surgeon to perform a series of consecutive measurements along the trajectory of the tool within the tissue.
A fine-needle fibre optic probe (diameter = 1 mm, length = 220 mm, and numerical aperture = 0.22) was designed for the PNB of parenchymal organs (including the liver) and was compatible with Chiba 18G puncture needles76,77. The number of fibres in the probe was 10:9 (diameter = 100 μm) and were intended for transmission of optical radiation (3 fibres in each diagnostic channel). The central fibre (diameter = 200 μm) was intended for collection of diffuse reflected light and fluorescence. Another probe (diameter = 0.5 mm, length = 160 mm, number of fibres = 3, fibre diameter = 100 μm, and numerical aperture = 0.22) was designed for PNB of the pancreas and was compatible with 21G Chiba-type puncture needles. A third probe (diameter = 0.7 mm, length = 55 mm, number of fibres = 3, fibre diameter = 100 μm, and numerical aperture = 0.22) was designed for PNB of breast neoplasms and was compatible with 19G puncture needles. These probes were inserted into the cannula of a standard puncture needle after the mandrel was removed, enabling fluorescence and diffuse reflectance signals to be recorded as the needle advanced to the region of interest.
Similarly, a fine-needle fibre optic probe (diameter = 0.8 mm, length = 35 mm, and numerical aperture = 0.22) was designed to perform PNB of the breast for evaluating the metabolic status of neoplasms without using a puncture needle. The number of fibres in the probe was 7:6 (diameter = 100 μm) and were designed for light transmission (3 fibres in each diagnostic channel); 1 fibre (diameter = 200 μm) was designed to collect optical radiation. The images of these probes are shown in Figs. S3 and S4 in the Supplementary Information.
When introducing new medical diagnostic systems into clinical facilities, safety aspects should be considered first. The ability to disinfect and sterilise fibre-optic probes is particularly important because they are used in vivo. Materials should be corrosion resistant to ensure multiple uses without loss of functionality. Fibre-optic probes should be handled and sterilised according to the standards and guidelines for endoscopes used in sterile endoscopic procedures. Fibre-optic probes used for sterile endoscopic procedures are subjected to the following processes: pre-cleaning, pre-sterilisation cleaning combined with disinfection, non-damaging sterilisation, and storage under conditions that exclude secondary contamination. Several methods can be used to sterilise fibre-optic probes. As the sterilisation products are thermolabile, only low-temperature methods (less than 60 °C) should be used; for example, chemical sterilisation with liquid agents with confirmed sporicidal activity; low-temperature ethylene oxide gas sterilisation; and low-temperature hydrogen peroxide plasma sterilisation.
-
Experimental measurements of the fluorescence intensities of endogenous fluorophores at different concentrations were performed to assess the sensitivity of the FS channel (Fig. 1a) to varying concentrations of these substances in biological tissues. For fluorescence measurements, the spectra were recorded in a 10-μL drop of a substance with predetermined properties, prepared just before the measurements and applied to a non-autofluorescent film. The concentrations were chosen based on their correspondence with the contents of biological tissues and previous calibrations of other fluorescence recording devices78,79. The tested fluorophores and the protocols for preparing the working solutions and their concentrations are listed in Table 1. The exposure time for all the measurements was 1.5 s.
Fluorophore Preparation Concentrations, mM NADH45,46,62,80–84 Prepared from a dry substance (Sigma-Aldrich, USA). 0.001 Solvent: 10 mM Tris-HCl (pH 8.5). 0.01 Stock solution: 5 mM. 0.05 The stock solution is diluted with the solvent to prepare the working solutions to 99.5% of the required volume. Immediately before measurement, a freshly prepared 1 M solution of sodium dithionite (which acts as a reducing agent) is added to the test solution at 0.5% of the required volume. 0.1 1 FAD45,46,62,81–83 Prepared from a dry substance (Sigma-Aldrich, USA). 0.001 Solvent: phosphate buffered saline (PBS). 0.01 Stock solution: 5 mM. 0.05 The stock solution is diluted with the solvent to prepare the working solutions to the required volume. 0.1 0.5 1 Protoporphyrin IX44,45,81,82 Prepared from a dry substance (Sigma-Aldrich, USA). 0.001 Solvent: dimethyl sulfoxide (DMSO). 0.01 Stock solution: 5 mM. 0.05 The stock solution is diluted with the solvent to prepare the working solutions to the required volume. 0.1 0.3 Bilirubin81,82,85,86 Prepared from a dry substance (Sisco Research Laboratories Pvt. Ltd., India). 0.01 Solvent: DMSO. 0.05 Stock solution: 15 mM. 0.1 The stock solution is diluted with 100 μM bovine serum albumin (BSA) to prepare working solutions at the target bilirubin concentration. 0.5 1 Table 1. Fluorophore solutions for testing the optical systems.
Fluorescence spectra at an excitation wavelength of 365 nm are shown in Fig. 2 (left panel). For NADH fluorescence, a sharp increase was observed with increasing concentrations up to 1 mM (Fig. 2a), whereas for FAD, a more gradual increase in signal intensity and a subsequent plateau were observed for concentrations of 0.5 mM and higher (Fig. 2b). Evidently, the sensitivity ranges are > 0.1 M for NADH and > 0.01 M for FAD. Similar dynamics were observed in the protoporphyrin IX fluorescence spectra (Fig. 2c). An increase in signal was observed for bilirubin fluorescence, but at the highest concentration, a significant decrease was observed to a level lower than that of the 0.01 mM solution (Fig. 2c). This change can be attributed to the fact that at higher concentrations, absorption around 350–500 nm becomes more prevalent, causing the fluorescence signal to attenuate.
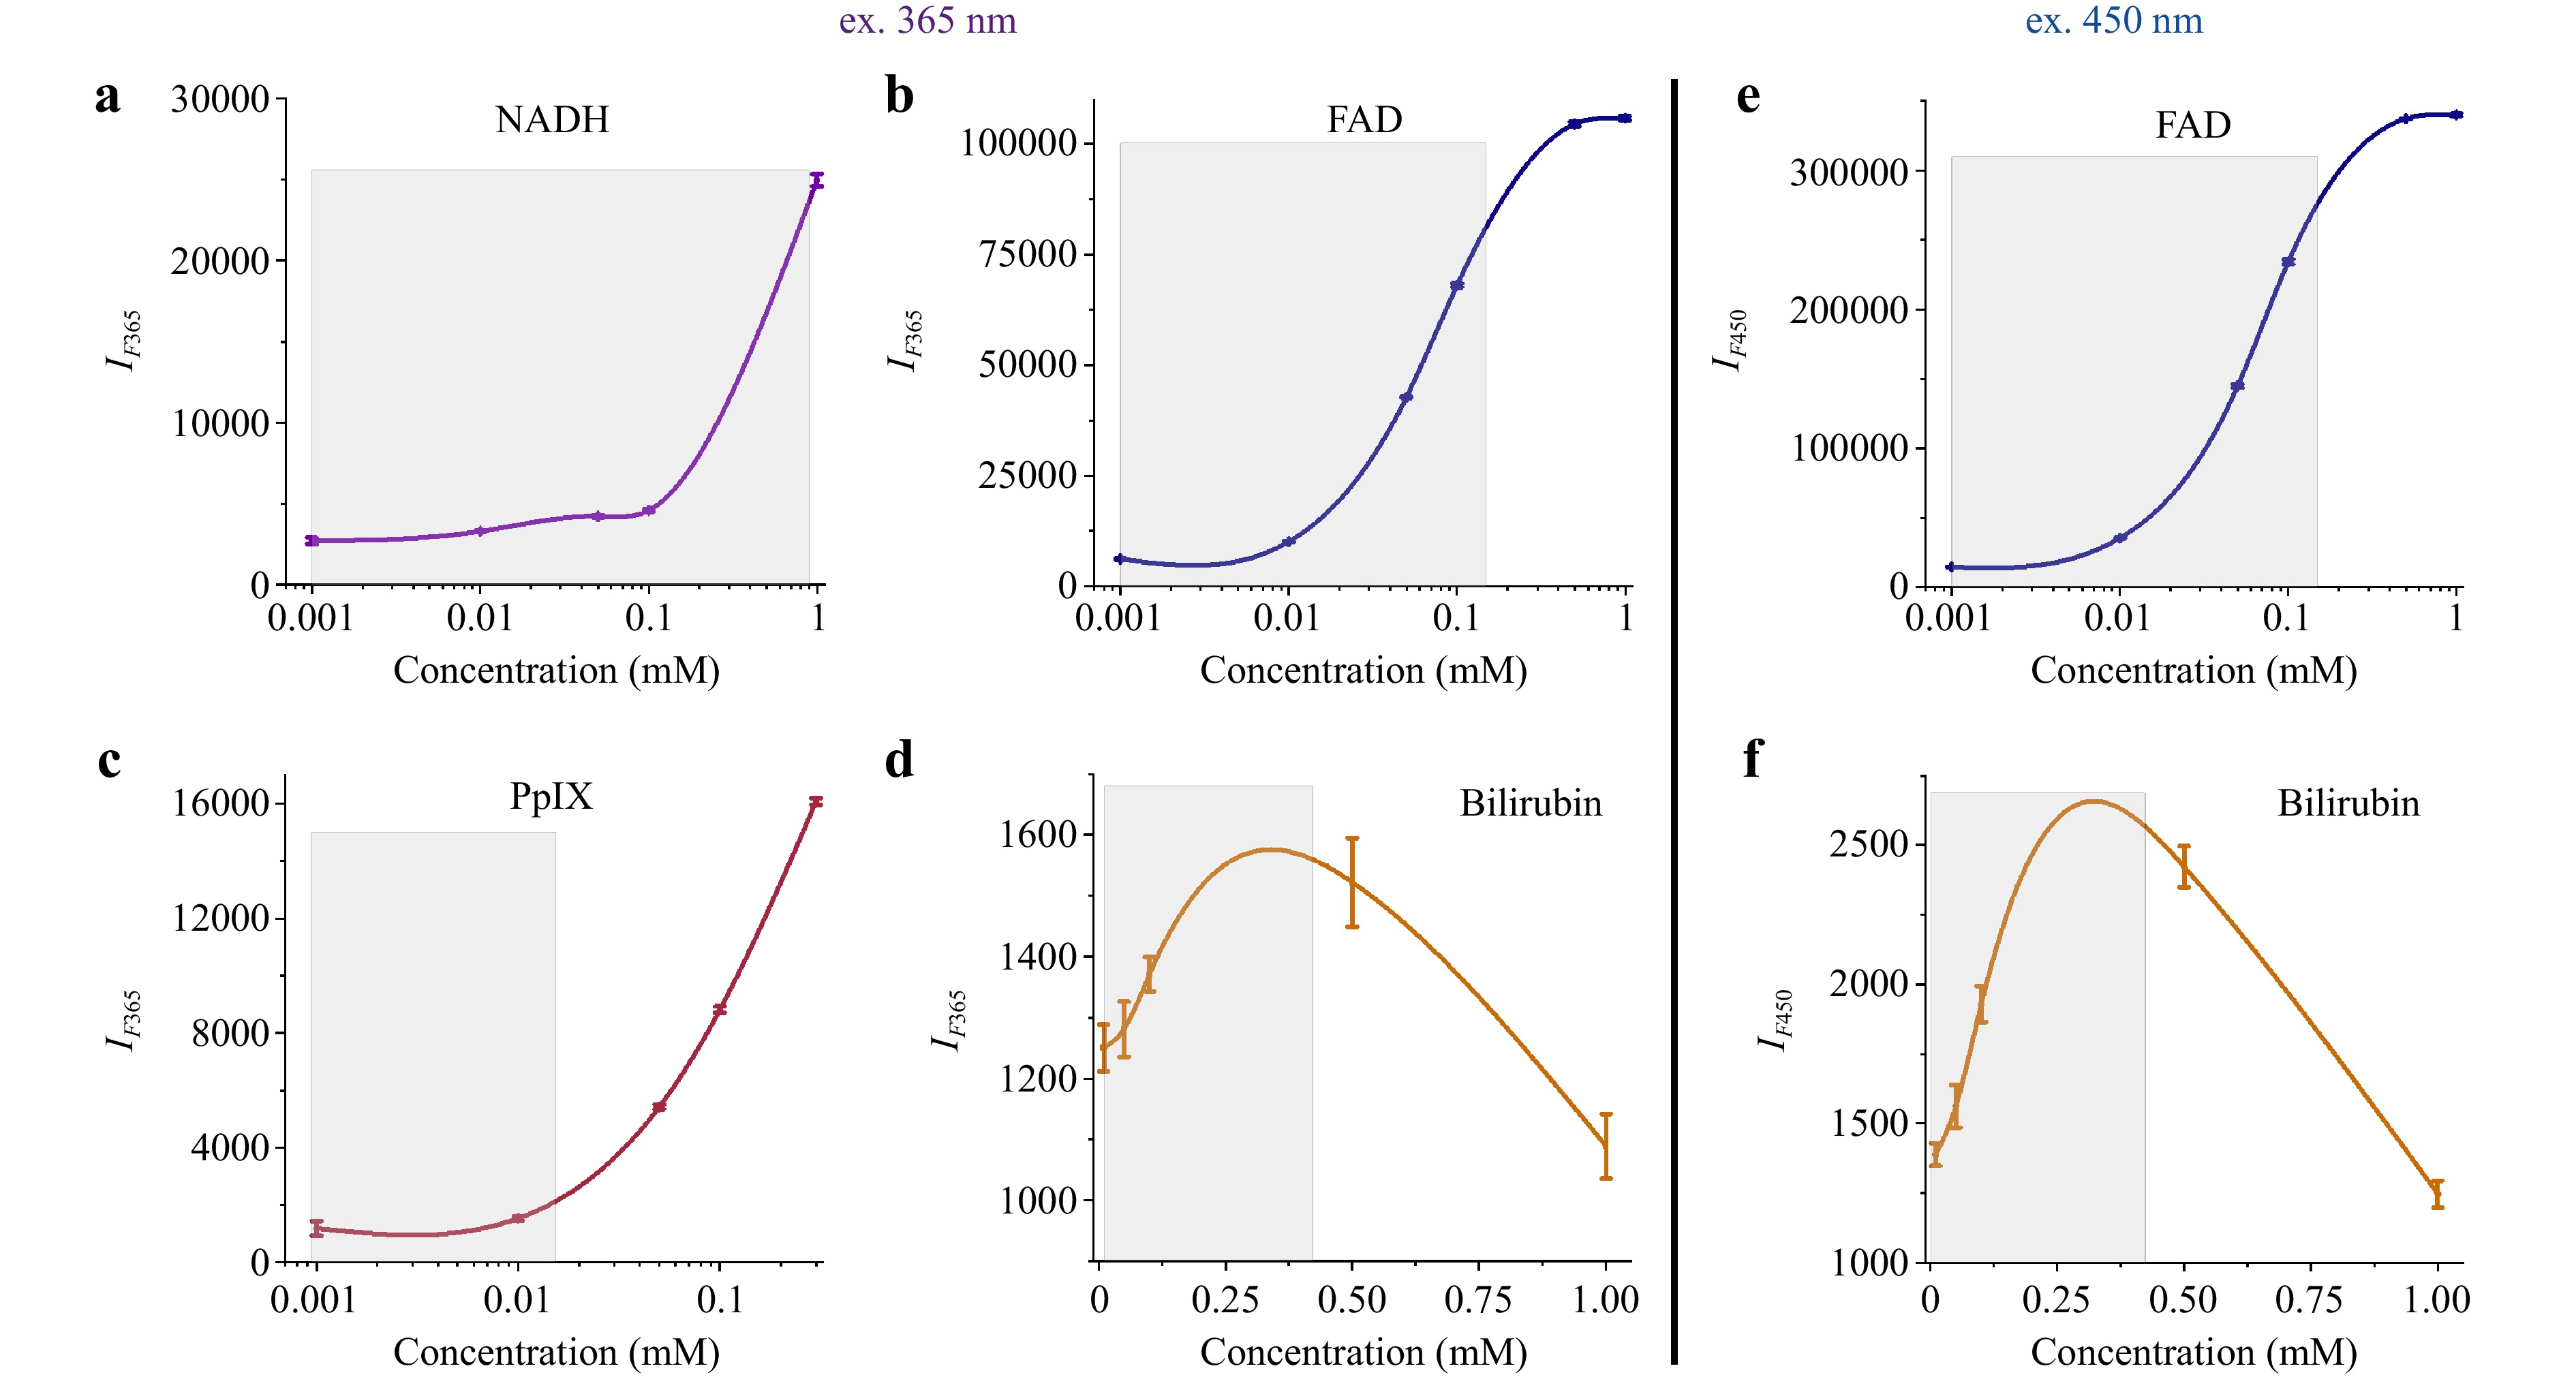
Fig. 2 Dependence of the maximum fluorescence intensity on the concentration of a NADH, b FAD, c protoporphyrin IX, and d bilirubin solutions excited at 365 nm (left panel); e FAD and f bilirubin solutions excited at 450 nm (right panel). The figure shows the mean and standard deviations for three measurements under each fluorophore concentration.
The fluorescence spectra for 450 nm excitation are shown in Fig. 2 (right panel). An increase in the fluorescence intensity of FAD up to a certain threshold was observed, similar to the 365 nm spectra (Fig. 2e). The fluorescence spectra of the bilirubin solutions showed higher fluorescence values, as expected for excitation at 450 nm, and similar dynamics at higher concentrations (Fig. 2f).
The FS and DRS systems were sensitive to the changes in fluorophore concentration. The changes were distinct in the range corresponding to the most likely biological concentrations of NADH 0.001–0.9 mM79,87, FAD 0.001–0.8 mM88,89, protoporphyrin IX 0.001–0.015 mM, and bilirubin 0.01–0.4 mM90 (marked grey in Fig. 2). A concentration-quenching effect was observed at 0.3 mM bilirubin. At sufficiently high concentrations, the fluorescence intensity decreased because of the internal filter effect. This effect was due to the absorption of the excitation light by the sample itself91.
Because the time-resolved FS system (Fig. 1b) used a 375 nm UV laser, it could cause an excitation of the fluorescence of both NADH and FAD. Fluorescence decay curves of fresh solutions of NADH and FAD (Sigma-Aldrich, USA) were recorded to verify that the MF445 filter with a bandwidth of 445 ± 45 nm blocked the emission of FAD. Measurements were made at concentrations close to those that might occur in a living cell (150 μM).
Typical fluorescence decay curves of NADH and FAD control solutions measured with both filters and the UV laser power set to 70 μW at the fine-needle probe tip are shown in Fig. 3a, b, respectively. The signal recorded from the FAD solution using the MF445 filter had poor intensity (approximately 20 times lower than the NADH signal) and high background noise. NADH measurements fitted with a single-exponential model were used to estimate the lifetime value $ {\tau }_{NADH} $ = 420 ps, which is in agreement with the data from the literature92. Preliminary tests and calibration suggest that the metabolic changes in NADH content were primarily recorded when the MF445 filter was used for data acquisition.
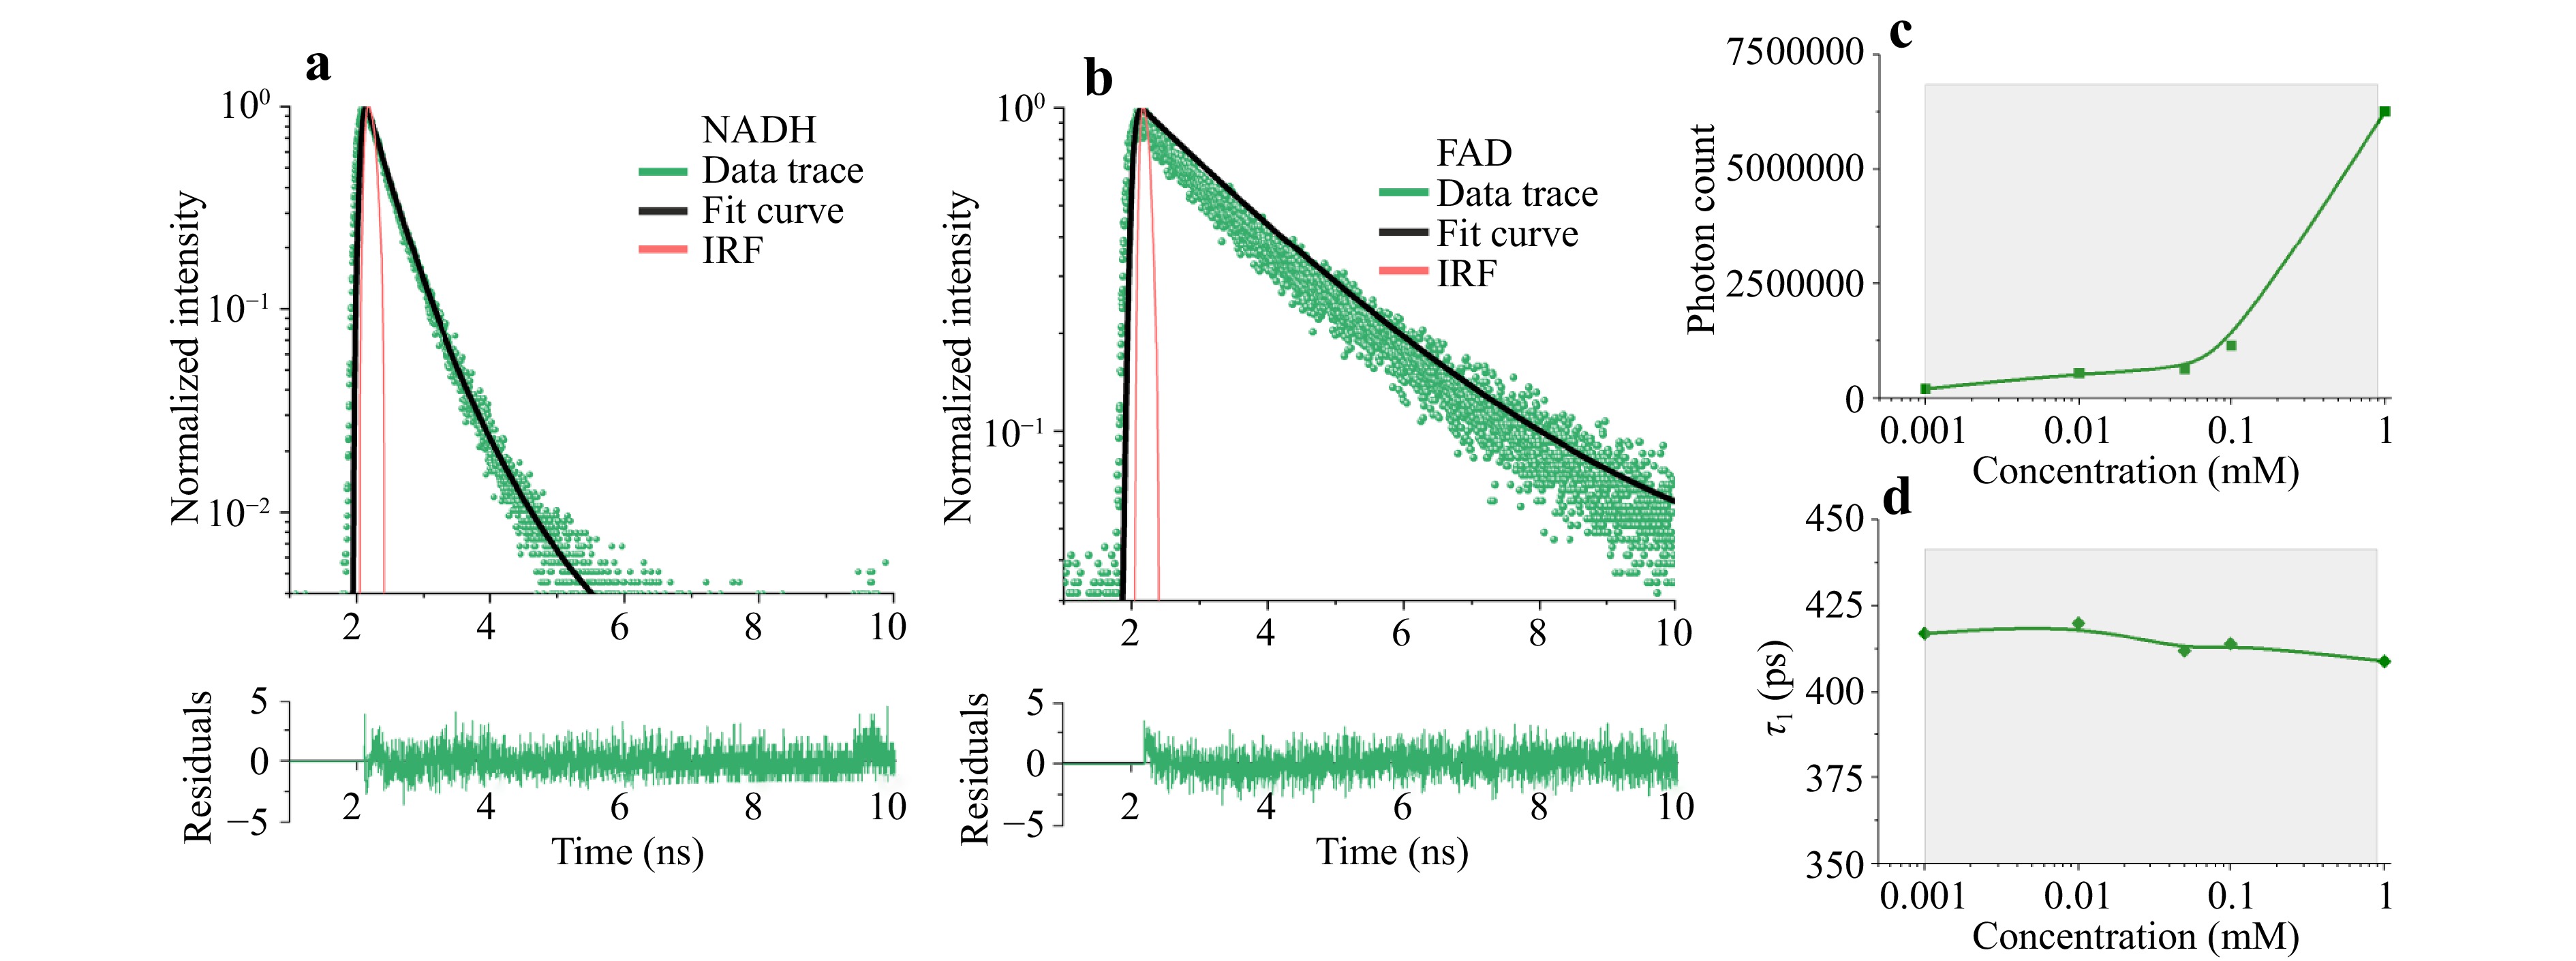
Fig. 3 Results of the calibration measurements showing single-exponential fluorescence decay of freshly prepared a NADH and b FAD solutions; dependence of c fluorescence intensity and d lifetime on NADH coenzyme concentration.
Furthermore, measurements showed that the changes in NADH concentration affected fluorescence intensity (Fig. 3c), but within the range of physiological concentrations, there was little or no effect on the lifetime parameter (Fig. 3d), which depends on protein binding.
-
Systemic drug therapy is an important component of breast cancer treatments. Understanding the metabolic nature of a tumour and its microhemodynamic characteristics can form the basis for the development of prognostic markers to assess the likelihood of response to tumour treatment in each specific clinical case. FS with autofluorescence excitation at a wavelength of 365 nm and DRS were used to monitor the metabolic status of the breast neoplasms.
Clinical trials were carried out in the Smolensk Regional Oncological Clinical Dispensary (Smolensk, Russia) in compliance with the principles of biomedical ethics as outlined in the Declaration of Helsinki of 1964 and subsequent updates and were approved by the independent ethics committee of Clinical Hospital No. 1 in Smolensk (Protocol No. 2-B, dated 19.04.2023). All participants signed an informed consent form indicating their willingness to participate voluntarily in the study.
Twenty-one patients with breast neoplasia participated in the study. The standard examination protocol included breast ultrasonography, mammography, fine-needle aspiration, and trephine biopsy of the tumours, followed by pathomorphological and immunohistochemical examination of the biopsy samples. Patients were divided into two groups: Group 1, breast cancer (13 patients) and Group 2, benign tumours (fibroadenomas (FA)) (8 patients).
The 365 nm excitation fluorescence and diffuse reflectance spectra were recorded using the FS/DRS system for intraoperative optical diagnostics (Fig. 1a). Transmission and acquisition of optical radiation were performed using a fine-needle fibre optic probe (diameter = 0.7 mm; length = 55 mm) compatible with 19G puncture needles (Fig. 1c). The spectra were acquired under ultrasound guidance immediately before PNB in the central part of the neoplasm and intact glandular breast tissue. The FS and DRS signals were recorded five times for each examined area. The exposure time for recording fluorescence and diffuse reflection was 1.5 and 0.05 s, respectively. The measurements at each point were averaged after processing. The total recording time was no more than 1.5 min. The diffuse reflectance spectra were pre-normalised to the halogen lamp spectrum obtained from a diffuse reflectance reference (Spectralon). The tissue saturation (StO2) was determined, and its value was calculated from the normalised backscattered spectra in the 500–600 nm range using the diffusion approximation of radiative transfer theory for an infinite medium93. Optical density (OD) spectra were obtained from the diffuse reflection spectra.
Here, Fig. 4 shows the typical fluorescence and optical density spectra of malignant (Fig. 4a, e) and benign (Fig. 4c, g) neoplasms. The maximum fluorescence amplitude ($ {I}_{F}^{365} $) and StO2 in the central part of the neoplasm and intact glandular breast tissue for patients with breast cancer are shown in Fig. 4b, f, respectively, and those for patients with FA are shown in Fig. 4d, h, respectively.
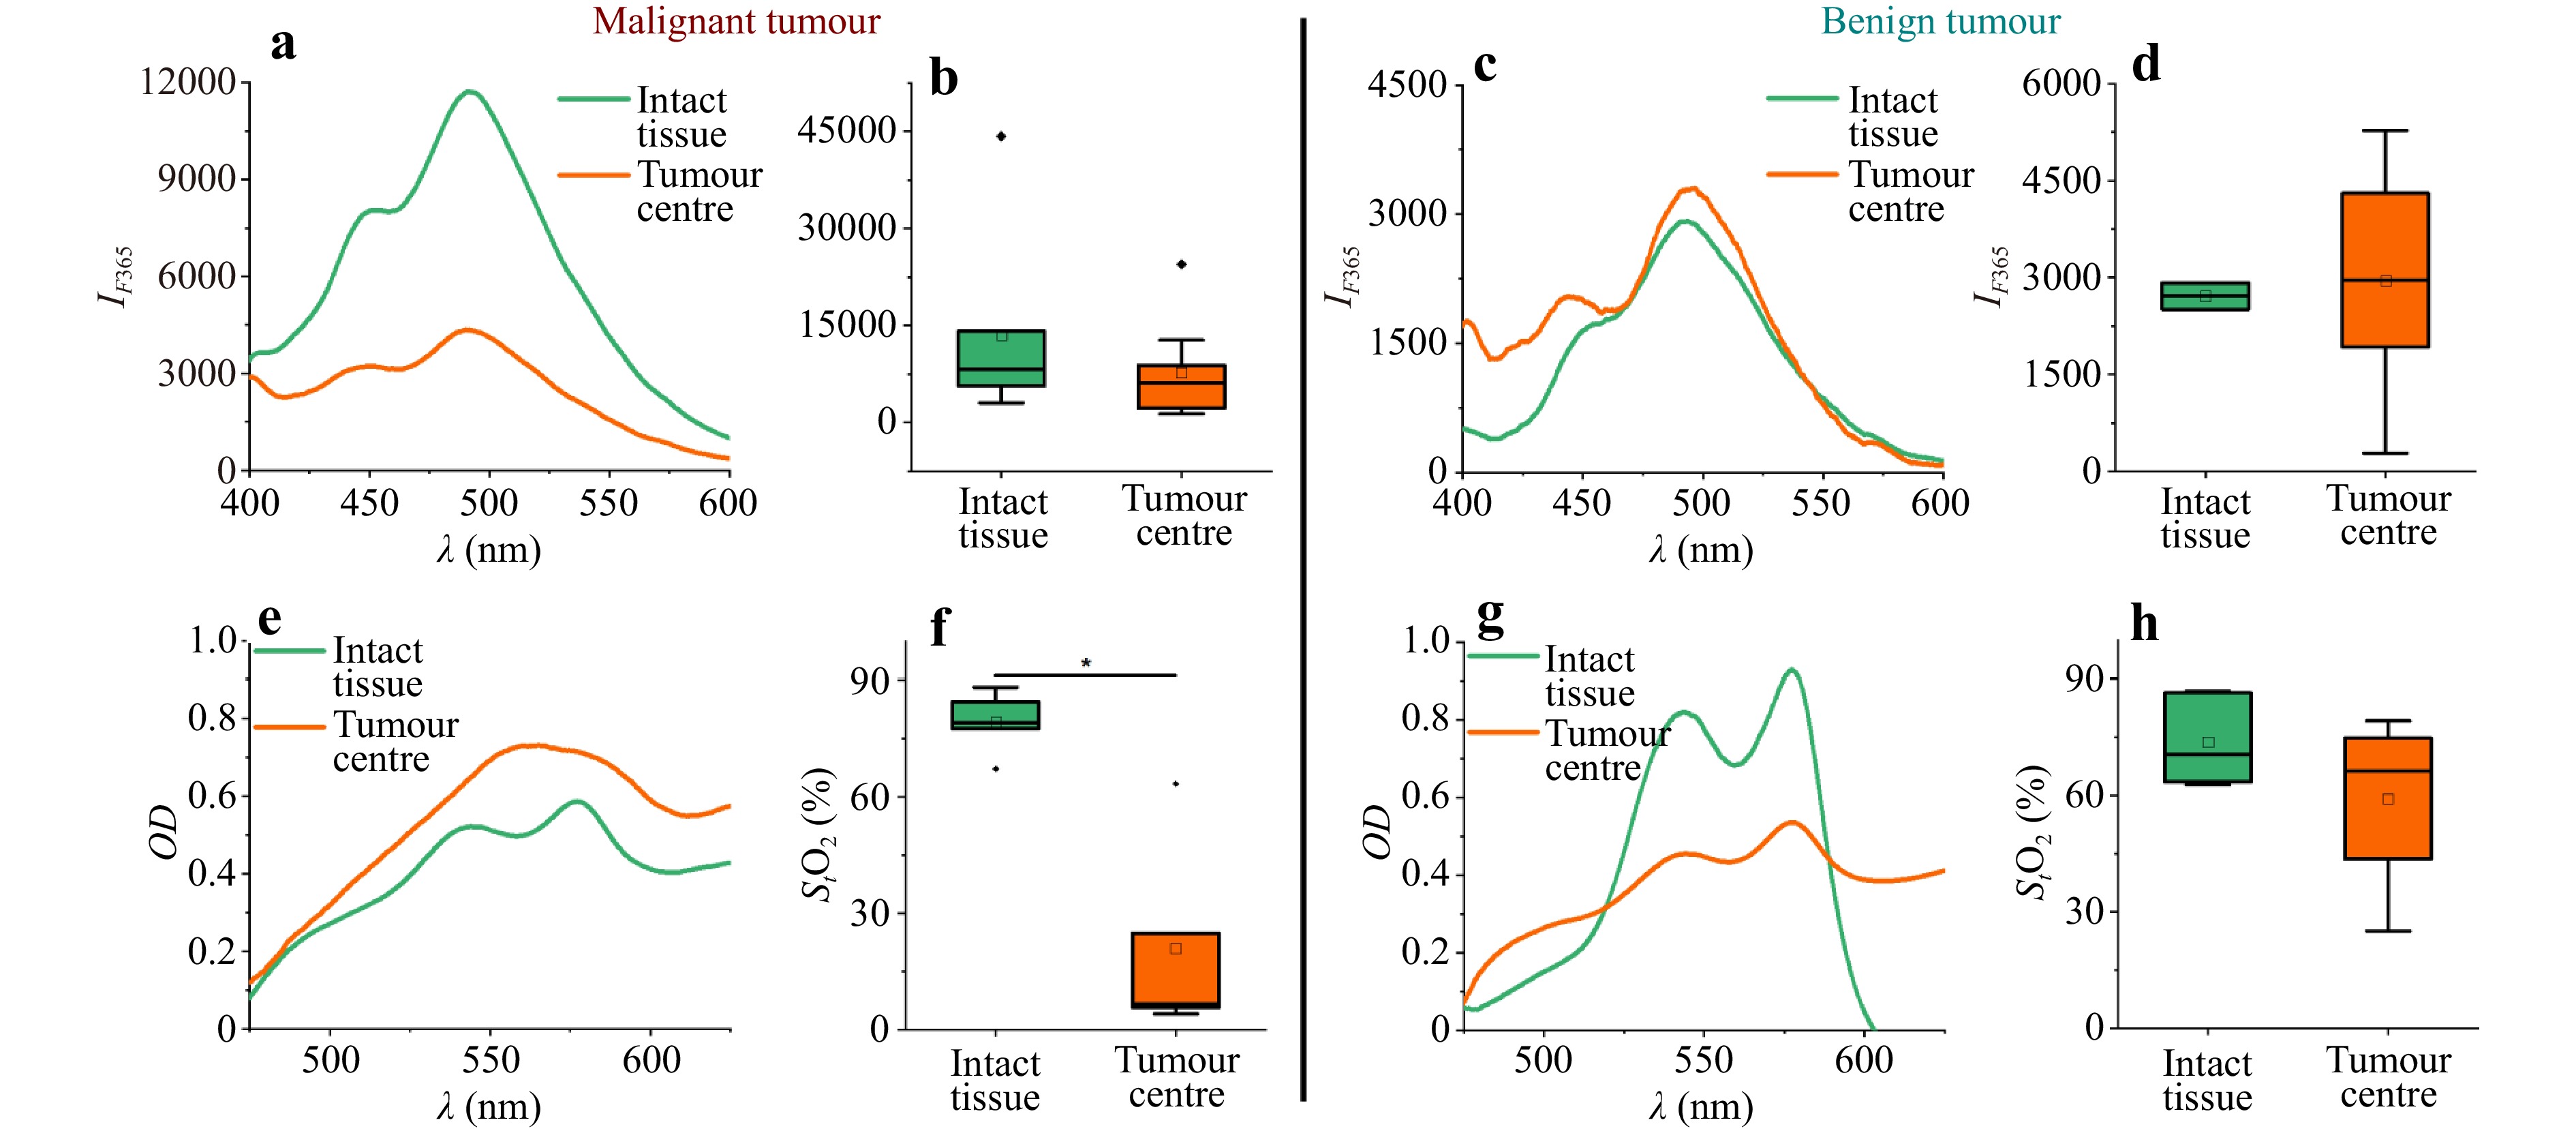
Fig. 4 Examples of fluorescence spectra at 365 nm excitation in intact tissue and breast tumours in patients with a malignant and c benign neoplasms; maximum fluorescence amplitude $ {I}_{F}^{365} $ in the central part of the neoplasm and in intact glandular breast tissue in patients with b malignant and d benign neoplasms. Examples of optical density spectra recorded in intact tissue and in a breast tumour for patients with e malignant and benign g neoplasms. Results of tissue saturation calculation (StO2) in the central part of a neoplasm and in intact glandular breast tissue in patients with f malignant and h benign neoplasms. * Significant differences (p < 0.05) are confirmed statistically (Kruskal–Wallis test).
Malignant tumours were found to have significantly lower tissue saturation values than the intact surrounding tissue. No statistically significant differences in tissue saturation were observed in benign neoplasms. However, the centre of the tumour was characterised by lower saturation values in patients with FA. When comparing the tissue oxygenation index in the central regions of the tumour between the two groups, statistically significant differences were obtained using the Mann–Whitney test (p < 0.05) (6.6 [5.7–24.8] vs 66.3 [43.7–74.8]. Data are presented in a Me [Q1–Q3] format (Me, median; Q1, first quartile; Q3, third quartile).
The oxygen status of tumours is related to their ability to respond to chemotherapeutic treatments94,95. This is probably because in tumours, where the microcirculatory network is well developed and regular and the blood supply is adequate for their size and intensity of metabolic processes, the tissue is efficiently supplied with oxygen and therapeutic agents. The findings of decreased saturation in malignant neoplasms are consistent with those of previous studies96, showing that tissue saturation in the centre of malignant breast tumours is significantly lower than that in benign neoplasms.
The FS data showed that malignant tumours tended to emit a more intense fluorescence signal than benign tumours when excited at 365 nm. Compared to Group 2 patients with FA, the fluorescence intensity was significantly increased in the intact breast tissue of patients with breast cancer (8280 [5650–14100] vs 2710 [2510–2920]; statistically significant differences were confirmed by the Mann–Whitney test, p < 0.05).
The increased fluorescence intensity in the malignant tissue compared to that in the intact breast tissue may be related to higher levels of NADH and collagen70,97. Hypoxia that develops in tumours leads to the accumulation of NADH and enhancement of its autofluorescence, enabling it to be used as a marker of mitochondrial dysfunction caused by oxygen deficiency in cells62. An increase in collagen intensity occurs because the transformation of normal tissue into malignant tissue results in the degradation and alteration of collagen crosslinks caused by an increased amount of collagenase in tumour cells98. However, it is not possible to separate the effects of NADH and collagen using this approach because of the overlapping spectra of these components.
An increase in fluorescence intensity in the intact breast tissue surrounding the tumour in patients with malignant tumours may indicate that metabolic changes occur in the glandular tissue. The detection of such changes during the examination of patients with suspected breast cancer can potentially serve as a diagnostic predictor of malignancy in breast neoplasms. Notably, the changes in fluorescence intensity observed in Fig. 4 can be influenced by individual variations in tissue absorption and scattering as well as photobleaching. All these factors should be considered for an accurate interpretation of the changes in fluorescence in such studies.
-
For the timely diagnosis and treatment of liver cancer, the development of new diagnostic modalities to improve standard PNB remains of paramount importance. The challenge for researchers in the field of intraoperative navigation for puncture procedures is to differentiate between tumours and healthy tissues. This study proposes two methods for differentiating normal liver parenchyma from neoplasia based on the two systems described above.
Twenty patients from the X-ray Surgery Department of the Orel Regional Clinical Hospital (Orel, Russia) participated in testing the first approach to differentiate between liver neoplasms and conditionally healthy parenchyma using the FS/DRS system for intraoperative optical diagnostics (Fig. 1a). All research involving patients was conducted in compliance with the principles of biomedical ethics as outlined in the Declaration of Helsinki of 1964 and subsequent updates and was approved by the local bioethics committee of Orel State University (Protocol No. 14, dated 24.01.2019). This clinical study was conducted in accordance with an approved protocol99.
Measurements were performed during a standard liver PNB procedure in 20 patients with suspected liver malignancy. Spectra in the intact liver parenchyma were recorded using the Chiba 17.5G puncture needle, which was moved to the site where the biopsy material was taken from the tumour. A fine-needle fibre optic probe (diameter = 1 mm; length = 220 mm; Fig. 1c) was used to record the spectra in the area of interest (liver parenchyma or tumour). The exposure time for recording fluorescence and diffuse reflection was 1.5 and 0.05 s, respectively.
Here, Fig. 5 shows the typical data obtained with the FS/DRS device: fluorescence spectra (ex. 365 and 450 nm), as well as the optical density spectra recorded in the conditionally healthy liver parenchyma along the trajectory to the tumour and directly in the tumour neoplasm.
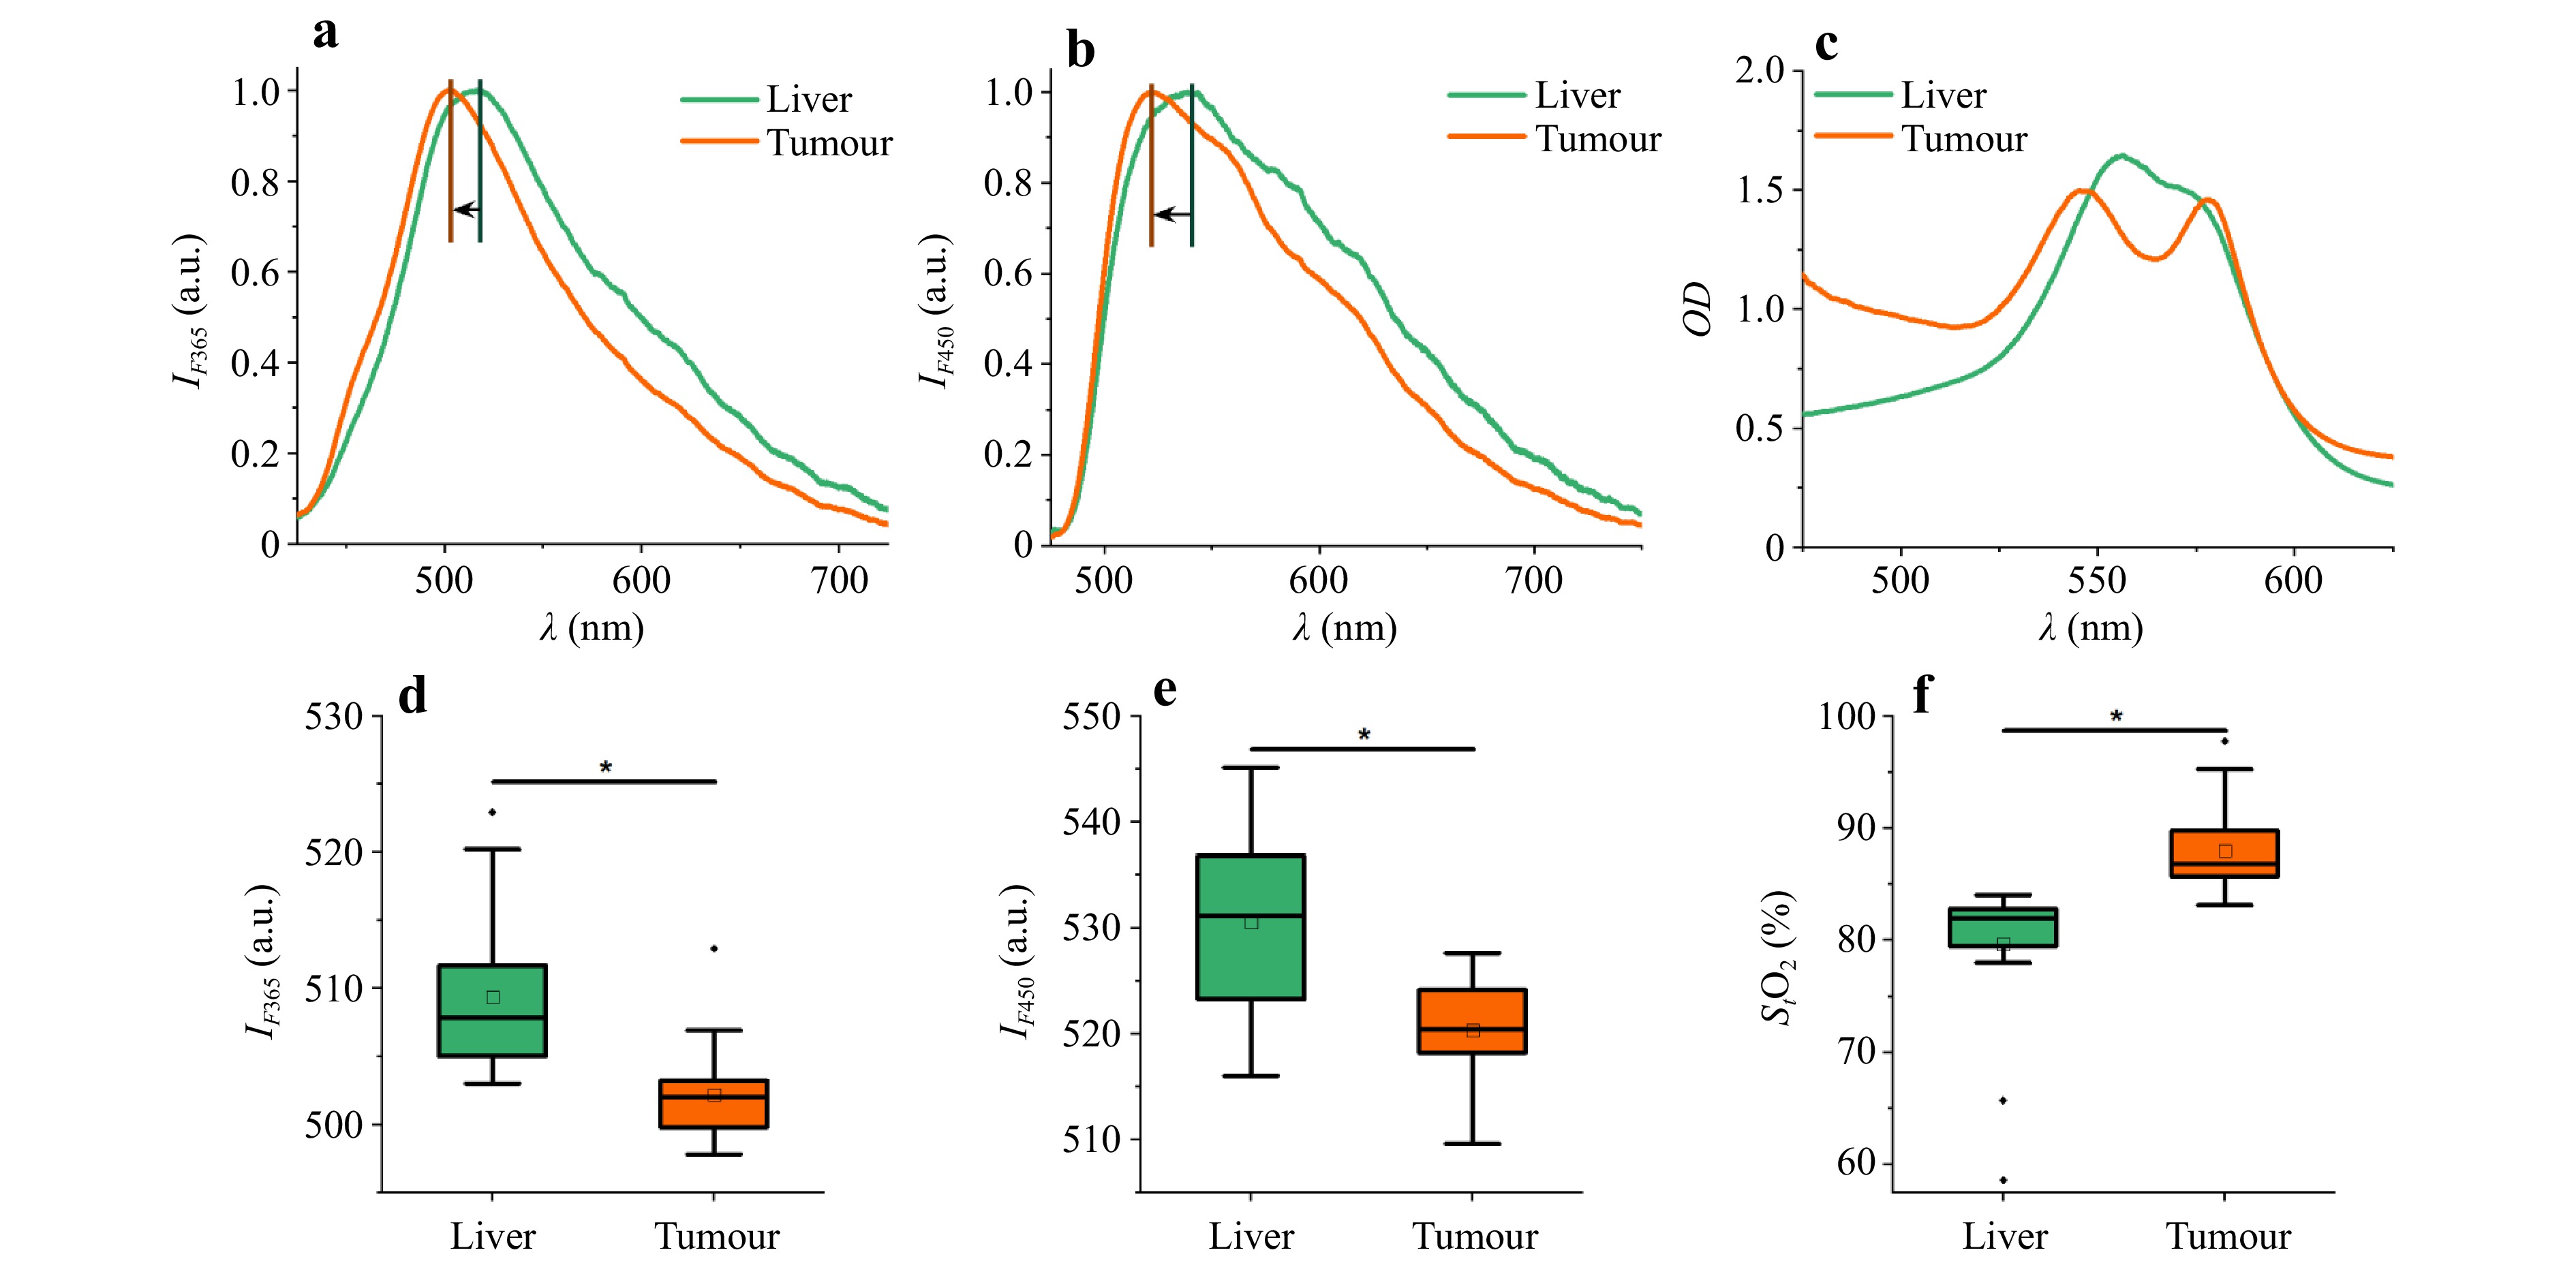
Fig. 5 Examples of fluorescence spectra: a ex. 365 nm, b ex. 450 nm, and c optical density spectra recorded in healthy liver parenchyma and tumour. The wavelengths of the maximum fluorescence: d ex. 365 nm, e ex. 450 nm, and f calculated tissue saturation. * Significant differences (p < 0.05) are confirmed statistically through the Mann–Whitney U-test.
When analysing the amplitudes of the fluorescence spectra, the peak wavelengths had statistically significant differences in the tumour than those in the liver parenchyma, as indicated by a shift in the maximum fluorescence wavelength to longer wavelengths (Fig. 5a, b, d, e). This shift may be because the healthy liver tissue contained significantly more bile than the tumours and acted as an optical filter. The optical density spectra showed the strongest shape differences in the oxy- and deoxyhaemoglobin absorption regions (Fig. 5c). Tissue saturation was calculated using the approach described in Refs. 100,101, involving the neural network fitting of spectral curves. A statistically significant difference in tissue saturation was found between the two tissue types, with the tissue saturation of the tumour tissue being higher than that of the intact liver tissue (Fig. 5f). One possible explanation for the increase in tumour saturation is that hepatocellular carcinoma and metastases from other organs are supplied by the hepatic arteries, whereas the liver parenchyma has a dual blood supply: 75%–80% of the total hepatic blood comes from the portal vein and only 20%–25% from the hepatic artery.
The data obtained using the FS/DRS system for intraoperative optical diagnostics were used to develop a tissue classifier according to two classes: conventional healthy parenchyma and liver tumours. An SVM method was used to synthesise the decision rules76. Table 2 summarises the performance parameters of the classifiers developed for all three diagnostic parameters (peak wavelength at 365 nm excitation ($ {\lambda }_{max}^{365} $); peak wavelength at 450 nm excitation ($ {\lambda }_{max}^{450} $); tissue saturation (StO2)) and their different pairwise combinations.
Classifier of Liver / Tumour (SVM) $ {\lambda }_{max}^{365} $, $ {\lambda }_{max}^{450} $and StO2 $ {\lambda }_{max}^{365} $ and $ {\lambda }_{max}^{450} $ $ {\lambda }_{max}^{365} $and StO2 $ {\lambda }_{max}^{450} $and StO2 Sensitivity 0.90 0.75 0.90 0.90 Specificity 0.95 0.85 0.90 0.95 The highest level of diagnostic performance was achieved using a combination of the peak wavelength at 450 nm excitation and StO2 or when all three parameters were used. Table 2. Parameters of the developed classifiers for distinguishing between two types of biological tissues: tumours and liver parenchyma.
In the same X-ray Surgery Department of the Orel Regional Clinical Hospital, clinical studies were conducted to develop a second approach for differentiating liver neoplasms from conditionally healthy parenchyma. This study included 31 patients who underwent optical needle biopsy using a time-resolved FS system (Fig. 1b). This study was approved by the local bioethics committee of Orel State University (Protocol No. 14, dated 24.01.2019). Spectra were recorded during the standard PNB procedure using 17.5G puncture needles and a fine-needle fibre optic probe (diameter = 1 mm; length = 220 mm; Fig. 1c). The exposure time was set to 2 s.
A sample of unique data on the optical properties of the liver was expanded by recording the signals at multiple points along the trajectory using a fine-needle fibre-optic probe. Histological examination of the biopsy samples showed that seven patients were diagnosed with primary liver cancer or hepatocellular carcinoma (HCC), seven with benign tumour (BT), and 17 with metastasis (MTS). The number of spectra used for training the machine learning algorithm to differentiate the two tissue classes was n = 669 for tumour and n = 492 for liver.
Here, Fig. 6 shows typical fluorescence decay curves recorded in conditionally healthy liver parenchyma (Fig. 6a) along the path to the tumour and directly in liver tumour neoplasms: BT (Fig. 6b), HCC (Fig. 6c), and MTS (Fig. 6d). To quantify fluorescence attenuation, a curve-fitting algorithm was applied to a two-exponential decay model with further determination of the curve parameters: fluorescence intensity (IF); NAD(P)H short lifetime component (τ1); NAD(P)H long lifetime component (τ2); and relative contributions of lifetime components (α1 and α2)77. The results of the calculations of the parameters of the decay curves in the intact liver parenchyma and tumour centre for the different types of neoplasms are presented in Fig. 6. Of the two related parameters, α1 and α2, α2 was chosen for its ability to provide more physiological information for classifiers102.
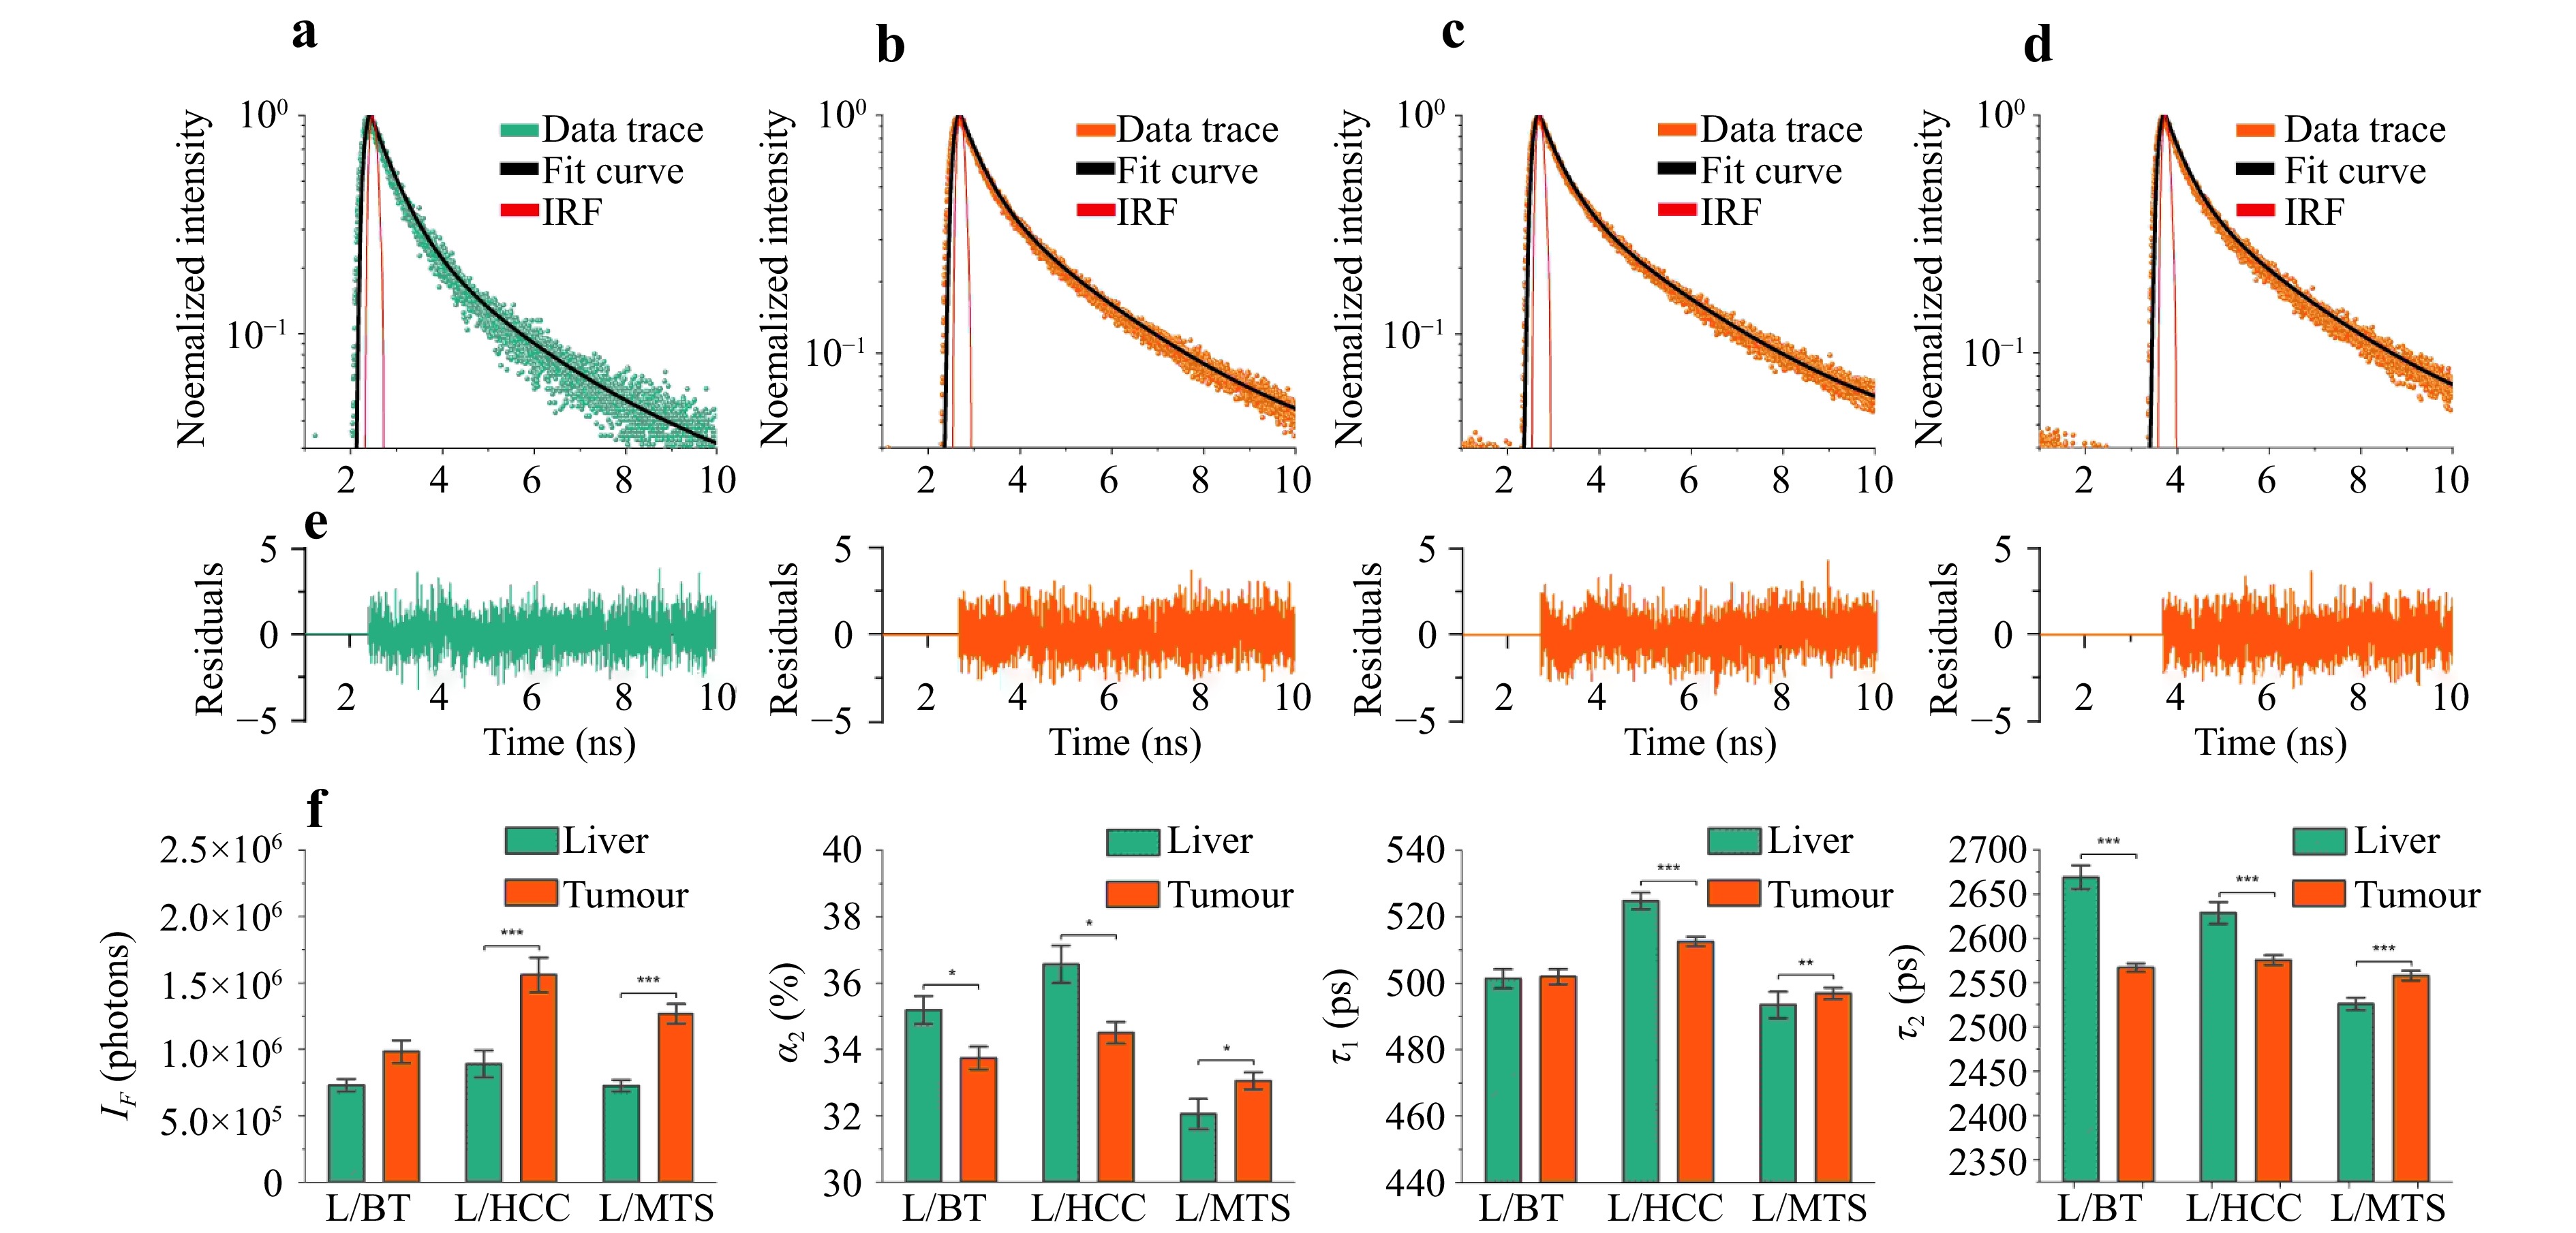
Fig. 6 Examples of fluorescence decay recorded in a a liver parenchyma, b BT, c HCC, d MTS, and e diagnostic parameters obtained by time-resolved fluorescence spectroscopy (fluorescence intensity, IF; contribution of the long lifetime component, α2; short lifetime component, τ1; and long lifetime component, τ2) for liver parenchyma and different types of neoplasms. Significant differences (* – p < 0.05; ** – p < 0.01; *** – p < 0.001) are confirmed statistically using the Mann–Whitney U-test.
Primary liver tumours were characterised by increased fluorescence intensity, decreased τ2 lifetime, and relative contribution of the long component α2 associated with protein-bound NAD(P)H. Such rearrangements are characteristic of the increased contribution of glycolysis to mitochondrial oxidative phosphorylation during tumour metabolism103. Furthermore, an increase in fluorescence intensity was registered in metastases, but no significant changes were observed for τ1. This may be because metabolism in metastases does not have a predominant glycolytic pathway and fluorophores associated with other metabolic rearrangements contribute to fluorescence. In the group of patients with benign tumours, a statistically significant difference was found only for α2 and τ2, which also increased compared to the liver parenchyma. The data obtained may indicate that benign tumours also exhibit specific metabolic changes; however, this requires further research.
The task of classifying tissues into two types (tumour and liver parenchyma) was performed using a Random Forest algorithm. The obtained data were divided into 80% for training and 20% for testing. The efficiency parameters of the proposed classifier were evaluated using 10 randomly selected training and test sets and are summarised in Table 3.
Classifier of Liver / Tumour (Random Forest) Sensitivity Specificity Accuracy F-score 0.92 ± 0.02 0.85 ± 0.02 0.89 ± 0.02 0.91 ± 0.02 The advantage of the FS/DRS-based approach is its lower hardware cost, and this method can be easily scaled up to mass production for routine clinical practice to increase the diagnostic efficiency of PNB. The approach based on time-resolved FS is certainly more expensive in terms of cost characteristics, but the obtained information about the tumour type is valuable and comes closer to the diagnostic efficiency of histopathological diagnostic methods, which can be used as a basis for proceeding to the solution of a more complicated task: the real-time classification of liver tumour types. Table 3. Efficiency of the parameters of the proposed classifier for differentiating between healthy liver parenchyma and tumours based on the time-resolved FS data.
-
Using the data obtained with a time-resolved FS system, a classifier based on a random forest machine-learning algorithm was developed104. Fluorescence data from multiple points of interest in different types of liver tumours were analysed (BT (n = 140); HCC (n = 149); MTS (n = 380)). The evaluation metrics (Table 4) were calculated for each category of neoplasia.
BT HCC MTS Classifier
of BT / HCC / MTS (Random Forest)Sensitivity 0.84 ± 0.09 0.93 ± 0.05 0.92 ± 0.05 Specificity 0.98 ± 0.01 0.96 ± 0.01 0.87 ± 0.04 Accuracy 0.94 ± 0.05 0.95 ± 0.08 0.90 ± 0.01 F-score 0.89 ± 0.02 0.90 ± 0.01 0.90 ± 0.08 The highest diagnostic accuracy was achieved for the detection of HCC (0.95 ± 0.08) and BT (0.94 ± 0.05). The lower diagnostic efficacy was observed for MTS differentiation; this is probably due to the diverse origins of metastatic liver tumours and their different metabolisms. Table 4. Efficiency of the parameters used for the classification of different types of neoplasms.
-
Development of minimally invasive techniques for cancer diagnosis and treatment presents engineers and researchers with ambitious challenges. Diagnostic tools must be designed to provide information about the state of biological tissues inside the body in real time at the operating table with an accuracy similar to that of histological analysis. Optical methods are promising and powerful tools for obtaining diagnostic data on the metabolic states of biological tissues. These data can be used to determine malignancy type and severity.
The use of optical percutaneous needle biopsy combined with existing examination techniques can improve the efficiency of preoperative diagnosis of therapeutic tumour pathomorphosis. Algorithms developed to determine the metabolic status of breast neoplasms enable the detection of hypoxic (low-oxygen) tumours in patients with breast cancer, thereby potentially improving the results of therapy by optimising the treatment strategy in individual patients and preventing the development of side effects of ineffective therapy.
Despite advances in imaging technologies (CT, MRI, angiography, and ultrasound), some patients (e.g. those with structural changes in the liver) cannot be diagnosed without liver biopsy. The proposed optical technologies can complement standard minimally invasive surgical procedures and provide navigation for surgical tools, thereby increasing the effectiveness of percutaneous biopsies. Furthermore, the proposed methods help obtain a preliminary diagnosis of the type of liver tumour in real time. For example, the sensitivity of the proposed method for determining the position of the puncture needle was above 0.90, whereas the percentage of non-informative samples obtained by CT or ultrasound control for histological and cytological studies is 25%6–9. Moreover, data on tumour type obtained via MRI, CT, or ultrasound at the preoperative stage strongly depend on the tumour size and liver condition, and the sensitivity of these methods varies from 48% to 92%105. Conversely, the sensitivity of the developed method was not lower than 84%. To the best of the authors’ knowledge, this is the first study wherein the proposed algorithms for determining the tissue saturation of breast tumours solved the problem of an intraoperative search for hypoxic neoplasms in real time.
The optical systems and data-processing algorithms described in this study can be adapted to address other clinical problems. A combination of artificial intelligence, robotics, and navigation tools based on intraoperative optical diagnostics is a promising future research direction. The proposed technologies require more extensive randomised and multicentre studies to obtain expanded clinical outcome data, which will lead to regulatory approval and clinical implementation of optical PNB in oncology.
Despite the advantages of optical PNB, the technology has several limitations and challenges. First, the applicability of the proposed methods and algorithms is limited owing to the technical specifications of the equipment. The technologies developed with the proposed classifiers will provide correct results when using devices with sensors of a certain sensitivity and fibre-optic probes made of materials that enable the irradiation of detectors with low losses. An important requirement of the fibre-optic probes is that the optical fibres, their coatings, and the adhesive used to assemble the products must not fluoresce. The absence of intrinsic fluorescence in the fibres should be verified when testing the products prior to use; for example, by recording the signal from any non-fluorescent material (e.g. foil).
The probe-tissue interface plays an important role in signal transmission and measurement stability. Currently, the pressure exerted by a probe on biological tissues is controlled by a surgeon’s subjective sensations. To minimise the risk of vascular compression and ensure high reproducibility of measurement results, it is possible to develop fibre-optic probes with pressure monitoring sensors. Another promising option is the development of probes with optical fibres in the wall of a standard puncture needle to ensure the acquisition of optical signals from biological tissues along the path of the probe movement in the organ.
Notably, the limitation of the developed methods and algorithms is related to the inaccuracy of data acquisition under conditions of bleeding or vascular damage, as blood absorbs optical radiation and contributes to the error in the measurement results.
The challenges of introducing new technologies for intraoperative optical diagnostics in clinical practice include the need to train medical personnel, the economic feasibility of the methods, and the availability of consumables. However, widespread implementation requires additional clinical studies and regulatory approval.
-
The authors acknowledge the support of the Russian Science Foundation under Project No. 21-15-00325. The authors thank Drs. A.V. Mamoshin, D.S. Sumin, and M.I. Arabachyan for their help in collecting the clinical data and Dr. M. Yu. Kirillin for his help in processing DRS data from patients with breast cancer.
Optical percutaneous needle biopsy in oncology
- Light: Advanced Manufacturing , Article number: (2025)
- Received: 31 December 2024
- Revised: 27 August 2025
- Accepted: 28 August 2025 Published online: 31 October 2025
doi: https://doi.org/10.37188/lam.2025.072
Abstract: New technologies that combine standard procedures for tissue sample extraction and analysis with optical spectroscopy and imaging represent a new step in the development of tumour tissue diagnostics. Optical percutaneous needle biopsy is a promising method for increasing the diagnostic efficiency of the procedure by selecting the area for sample extraction and obtaining information about vascular changes and the metabolism of biological tissues at the needle tip. This study provides a comprehensive analysis of existing technical solutions to address various diagnostic tasks: studying the metabolic status of tissues for the adjustment of treatment protocols, differentiating healthy and tumour tissues for navigating puncture needles, and obtaining preliminary diagnoses of the nature of neoplasms. Technical systems for assessing the perfusion and metabolic characteristics of biological tissues using fine-needle probes have been described. Fine-needle probe designs for biopsies of various organs are also presented. The results of using optical percutaneous needle biopsy in liver and breast cancers are demonstrated.
Research Summary
Optical percutaneous needle biopsy in oncology
New technologies that combine standard procedures for tissue sample extraction and analysis with optical spectroscopy and imaging represent a new step in the development of tumour tissue diagnostics. Elena V. Potapova from Research and Development Center of Biomedical Photonics at Orel State University (Russia) and colleagues provide a comprehensive review of existing technical solutions in the field of optical percutaneous needle biopsy. This approach increases the diagnostic efficiency of regular tumour verification by obtaining information about vascular and metabolic changes of biological tissues at the needle tip. The authors demonstrated several original applications and results of optical biopsy technologies in the field of liver and breast cancers diagnosis.
Rights and permissions
Open Access This article is licensed under a Creative Commons Attribution 4.0 International License, which permits use, sharing, adaptation, distribution and reproduction in any medium or format, as long as you give appropriate credit to the original author(s) and the source, provide a link to the Creative Commons license, and indicate if changes were made. The images or other third party material in this article are included in the article′s Creative Commons license, unless indicated otherwise in a credit line to the material. If material is not included in the article′s Creative Commons license and your intended use is not permitted by statutory regulation or exceeds the permitted use, you will need to obtain permission directly from the copyright holder. To view a copy of this license, visit http://creativecommons.org/licenses/by/4.0/.

 DownLoad: