


-
Microelectromechanical systems (MEMS) have fueled advances in almost every field of science and technology over the past few decades1. Cantilevers are ultrasensitive MEMS devices that have been widely used as atomic force microscope (AFM) probes and as other detection elements because they do not require labeling in enabling local and specific detection2-8. However, there are still some challenges with microcantilever systems, such as miniaturization, integration, and high-throughput real-time monitoring. Hence, it is extremely urgent to develop a new generation of microcantilever sensor technologies. A microcantilever has two functions: the probe interacts with targets to be detected, and, as an optical lever, optical signal detection is performed by deflecting the reflected light. In current systems, the cantilever is usually formed using a dedicated microfabrication process and then manually mounted and aligned with the entire macroscopic optomechanical system. This results in a bulky system that requires laborious operation. Optical fibers have become all-optical platforms for realizing miniaturized and integrated sensors because of its ultra-compactness, low cost, and low transmission losses9-18. Based on the optical interference readout, a Fabry–Pérot (FP) interferometer formed between a cantilever and an optical-fiber end face can detect the weak vertical deformation of the cantilever with high resolution, which simplifies the complex optical lever readout. The most direct way to assemble a fiber-integrated microcantilever system is to attach a commercial microcantilever probe to the end face of the fiber. In this way, microcantilevers with different shapes, micromachined from various materials, can be utilized. However, repeatability and stability are limited by the fact that each cantilever must still be aligned with the fiber end face via a precision instrument and fixed with adhesive19. Fiber-integrated microcantilever systems using fiber-intrinsic materials have been fabricated via subtractive methods, such as picosecond and femtosecond (fs) laser ablation as well as focused ion beam milling for temperature, vibration, and ultrasonic sensing applications20-22. Cantilevers fabricated via picosecond laser ablation have rough surfaces and are thick because of limited machining accuracy, which significantly hinders stress sensing based on cantilever deformation. Ablation with a fs laser decreases the roughness but increases the fabrication time. On the other hand, a microcantilever milled with a focused ion beam is smooth and thin but requires expensive equipment and long fabrication times.
In contrast to these subtractive techniques, additive manufacturing selectively adds material to three-dimensional (3D) structures with great freedom. The additive technology of fs laser-induced two-photon polymerization (TPP) provides high precision and flexibility, and thus has been widely used to update various MEMS devices23-25. Alsharif et al. reported AFM cantilever probes that were printed via TPP, complementing those produced by silicon micromachining, to enable new imaging techniques26. Dietrich et al. demonstrated a highly compact scanning probe microscope with integrated optical actuation and read-out27. TPP can overcome the material limitations of silicon micromachining by using polymers28, hybrid materials29, and organic-modified ceramics30, to provide new concepts of advanced MEMS based on optical techniques. In our previous work, we realized a rectangular polymer microcantilever probe on the fiber end face for the first time, but the sensitivity, stability, and other properties are limited with this method, and the monotonous structure does not sufficiently meet the requirements of the microcantilever for different special structures in the application exploration31. The K value of the microcantilever is directly related to its sensitivity, and the smaller the K value, the higher is the sensitivity. However, in 3D printing manufacturing, it is extremely difficult to decrease the K value by reducing the microcantilever thickness or increasing its length without limits, especially when using soft polymer materials. When the thickness and length of the microcantilever remain constant, the K value can be adjusted significantly by using a hollow and triangular shape. This method of reducing the weight of the microcantilever for K-value adjustment can be customized to different application scenarios. This method gives 3D printing unrestraint freedom to customize different patterns in innovative ways, which is of great significance in practical production and applications.
Here, microcantilevers with rectangular solid, rectangular hollow, and triangular shapes were fabricated via fs-laser-induced TTP additive manufacturing on the fiber tip, as shown in Fig. 1. The strains in each of the three cantilever shapes, for the same stress per unit area, were simulated based on Young's modulus of the polymer, as measured by AFM. The deflection of the rectangular hollow cantilever (RHC) was the largest. Microcantilever deformation can be accurately monitored based on the optical interference readout. These cantilevers were modified by coating them with a palladium (Pd) film via magnetron sputtering, which enables hydrogen sensitivity. Cantilevers of different shapes and Pd film thicknesses were further characterized. A RHC coated with a 60-nm-thick Pd film exhibited a dip wavelength shift of 15 nm when the hydrogen concentration increased from 0% to 4% (v/v). The response time was as low as 5.3 s at 4% (v/v). The explosion threshold of hydrogen in the environment is 4%32. When the concentration is higher than this threshold, there is a potential danger of explosion. Therefore, the detection of a hydrogen concentration of 4 % is critical in some hydrogen leak detection applications. The proposed sensor has high sensitivity and fast response at this threshold. In hydrogen respiration therapy, 2% concentration of hydrogen is commonly used, such as inhalation of 2% hydrogen to treat lung injuries induced by severe sepsis33, and to ameliorate hepatic reperfusion injury34 and brain injury35. The hydrogen concentrations of 0%–4% is within the detectable range of high sensitivity and fast response of the proposed sensor, pointing to the practical significance of the sensor in hydrogen leak detection and hydrogen respiratory therapy. Furthermore, by modifying the microcantilever surface with various organic or polymer layers, many new detection applications can be developed.
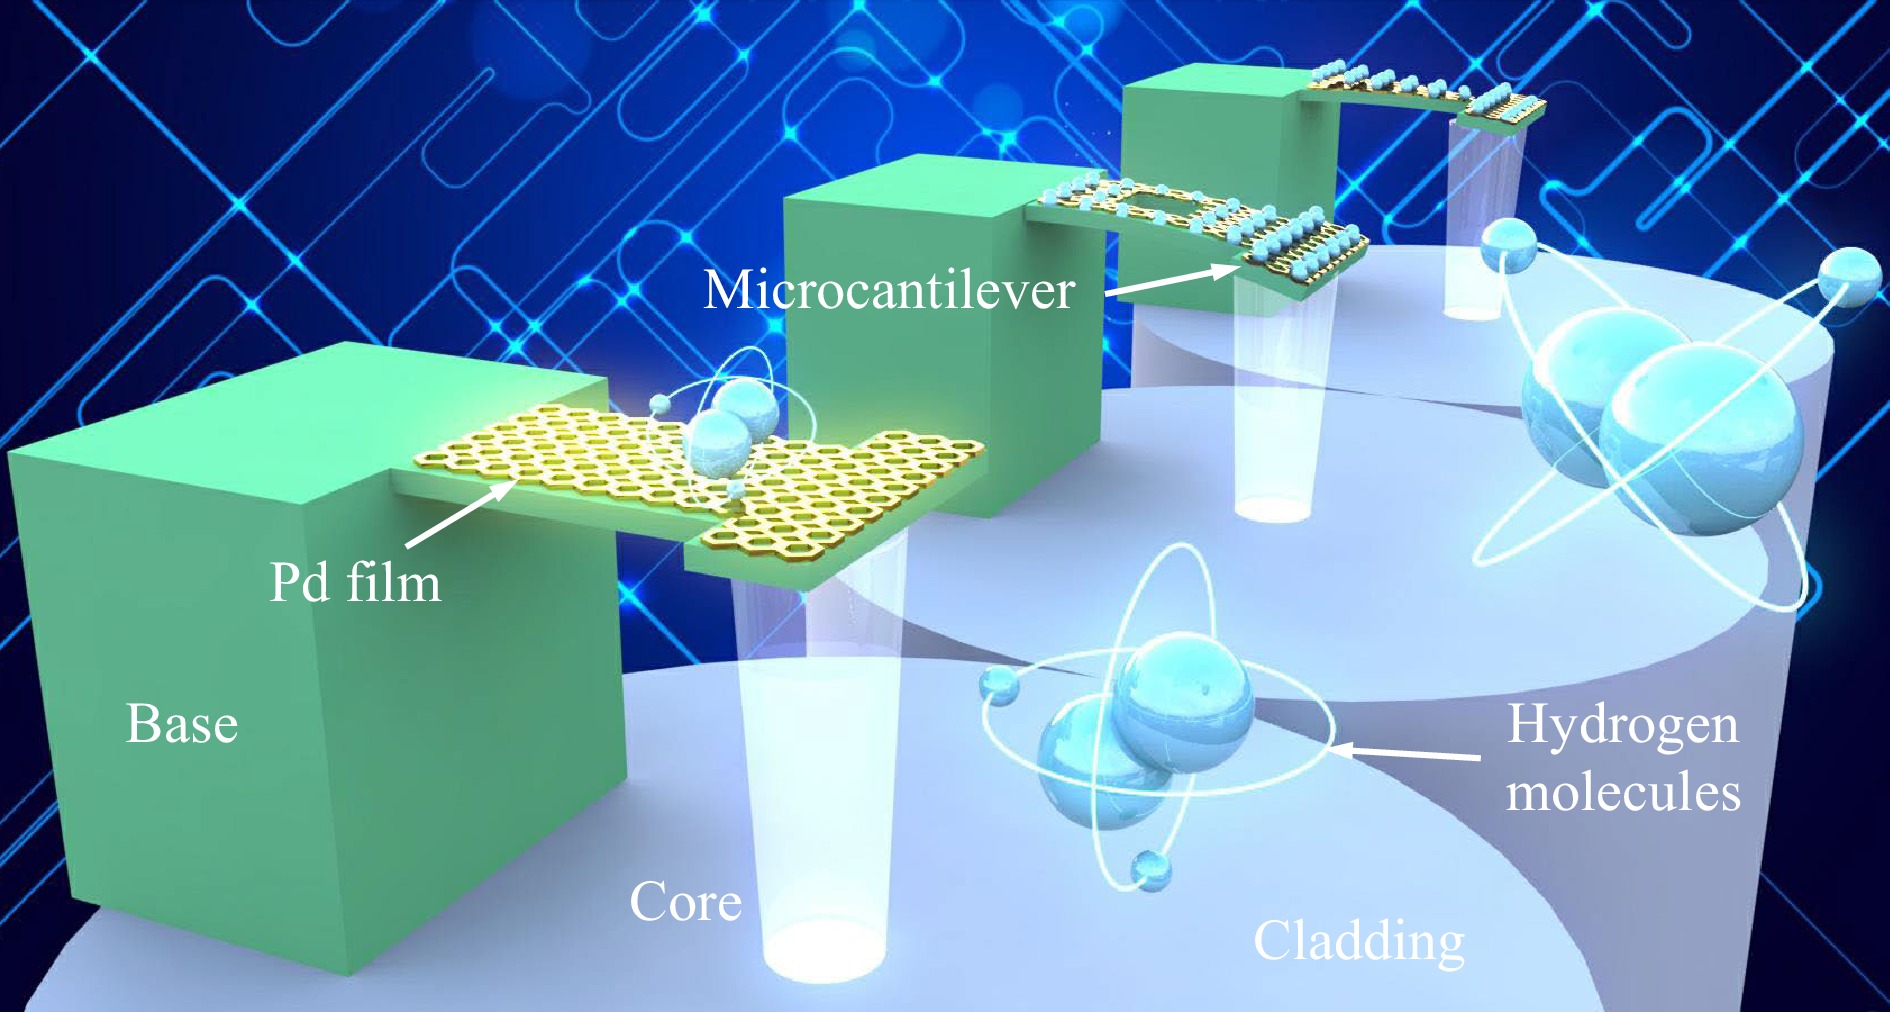
Fig. 1 Schematic of rectangular solid, rectangular hollow, and triangular polymer microcantilever probes for hydrogen sensing on an optical fiber tip.
-
The sensor uses optical fiber transmission instead of the complex optical lever path of an AFM system, and performs signal readout via optical interference. The printed microcantilever and the fiber end face form an FP cavity, where light reflected from the top and bottom cantilever surfaces interferes with the light reflected from the fiber end face. When the microcantilever bends, the optical path difference of the FP cavity changes, and the interference fringes change accordingly. The degree of microcantilever bending can be determined by detecting the resonant wavelength of the peak and / or valley of the interference spectrum. The cantilever is a structural layer with limited sensitivity to the environment. To make it sensitive to a particular chemical, it must be coated with a material that selectively absorbs the analyte and expands. In the static-stress detection mode, the stress difference between the structural layer and the sensitive layer bends the cantilever when the sensitive layer absorbs the analyte and expands. In the mass-detection mode, a change in the resonant frequency of the cantilever caused by the mass of the absorbed analyte can be measured.
Pd changes its lattice size after absorbing hydrogen, which is observed as a volume expansion on the macroscopic scale. When exposed to hydrogen, the hydrogen molecules are adsorbed onto the surface and then diffuse into the film after dissociation until an equilibrium of adsorption and reduction is reached36,37. Thus, bending of the microcantilever occurs in a hydrogen environment when the upper surface of the microcantilever is coated with a Pd film. The hydrogen absorption is fully reversible, and according to Sieverts’ law38, the equilibrium concentration of hydrogen atoms inside Pd is directly proportional to the square root of the partial pressure of molecular hydrogen. Hence, the deflection of the cantilever can accurately indicate the concentration of hydrogen in the environment. Specifically, there is a relationship between the shift in the interference spectrum and hydrogen concentration.
-
As shown in Fig. 1, three different microcantilevers were designed: rectangular solid, rectangular hollow, and triangular. Because the length of the z-axis voxel is limited by the laser focal depth, and the length-width ratio of the cantilever is determined by the hardness of the photoresist, the microcantilevers were designed to have a length of 40 μm, a width of 20 μm, and a thickness of 3 μm. The details are shown on the left in Fig. 2.
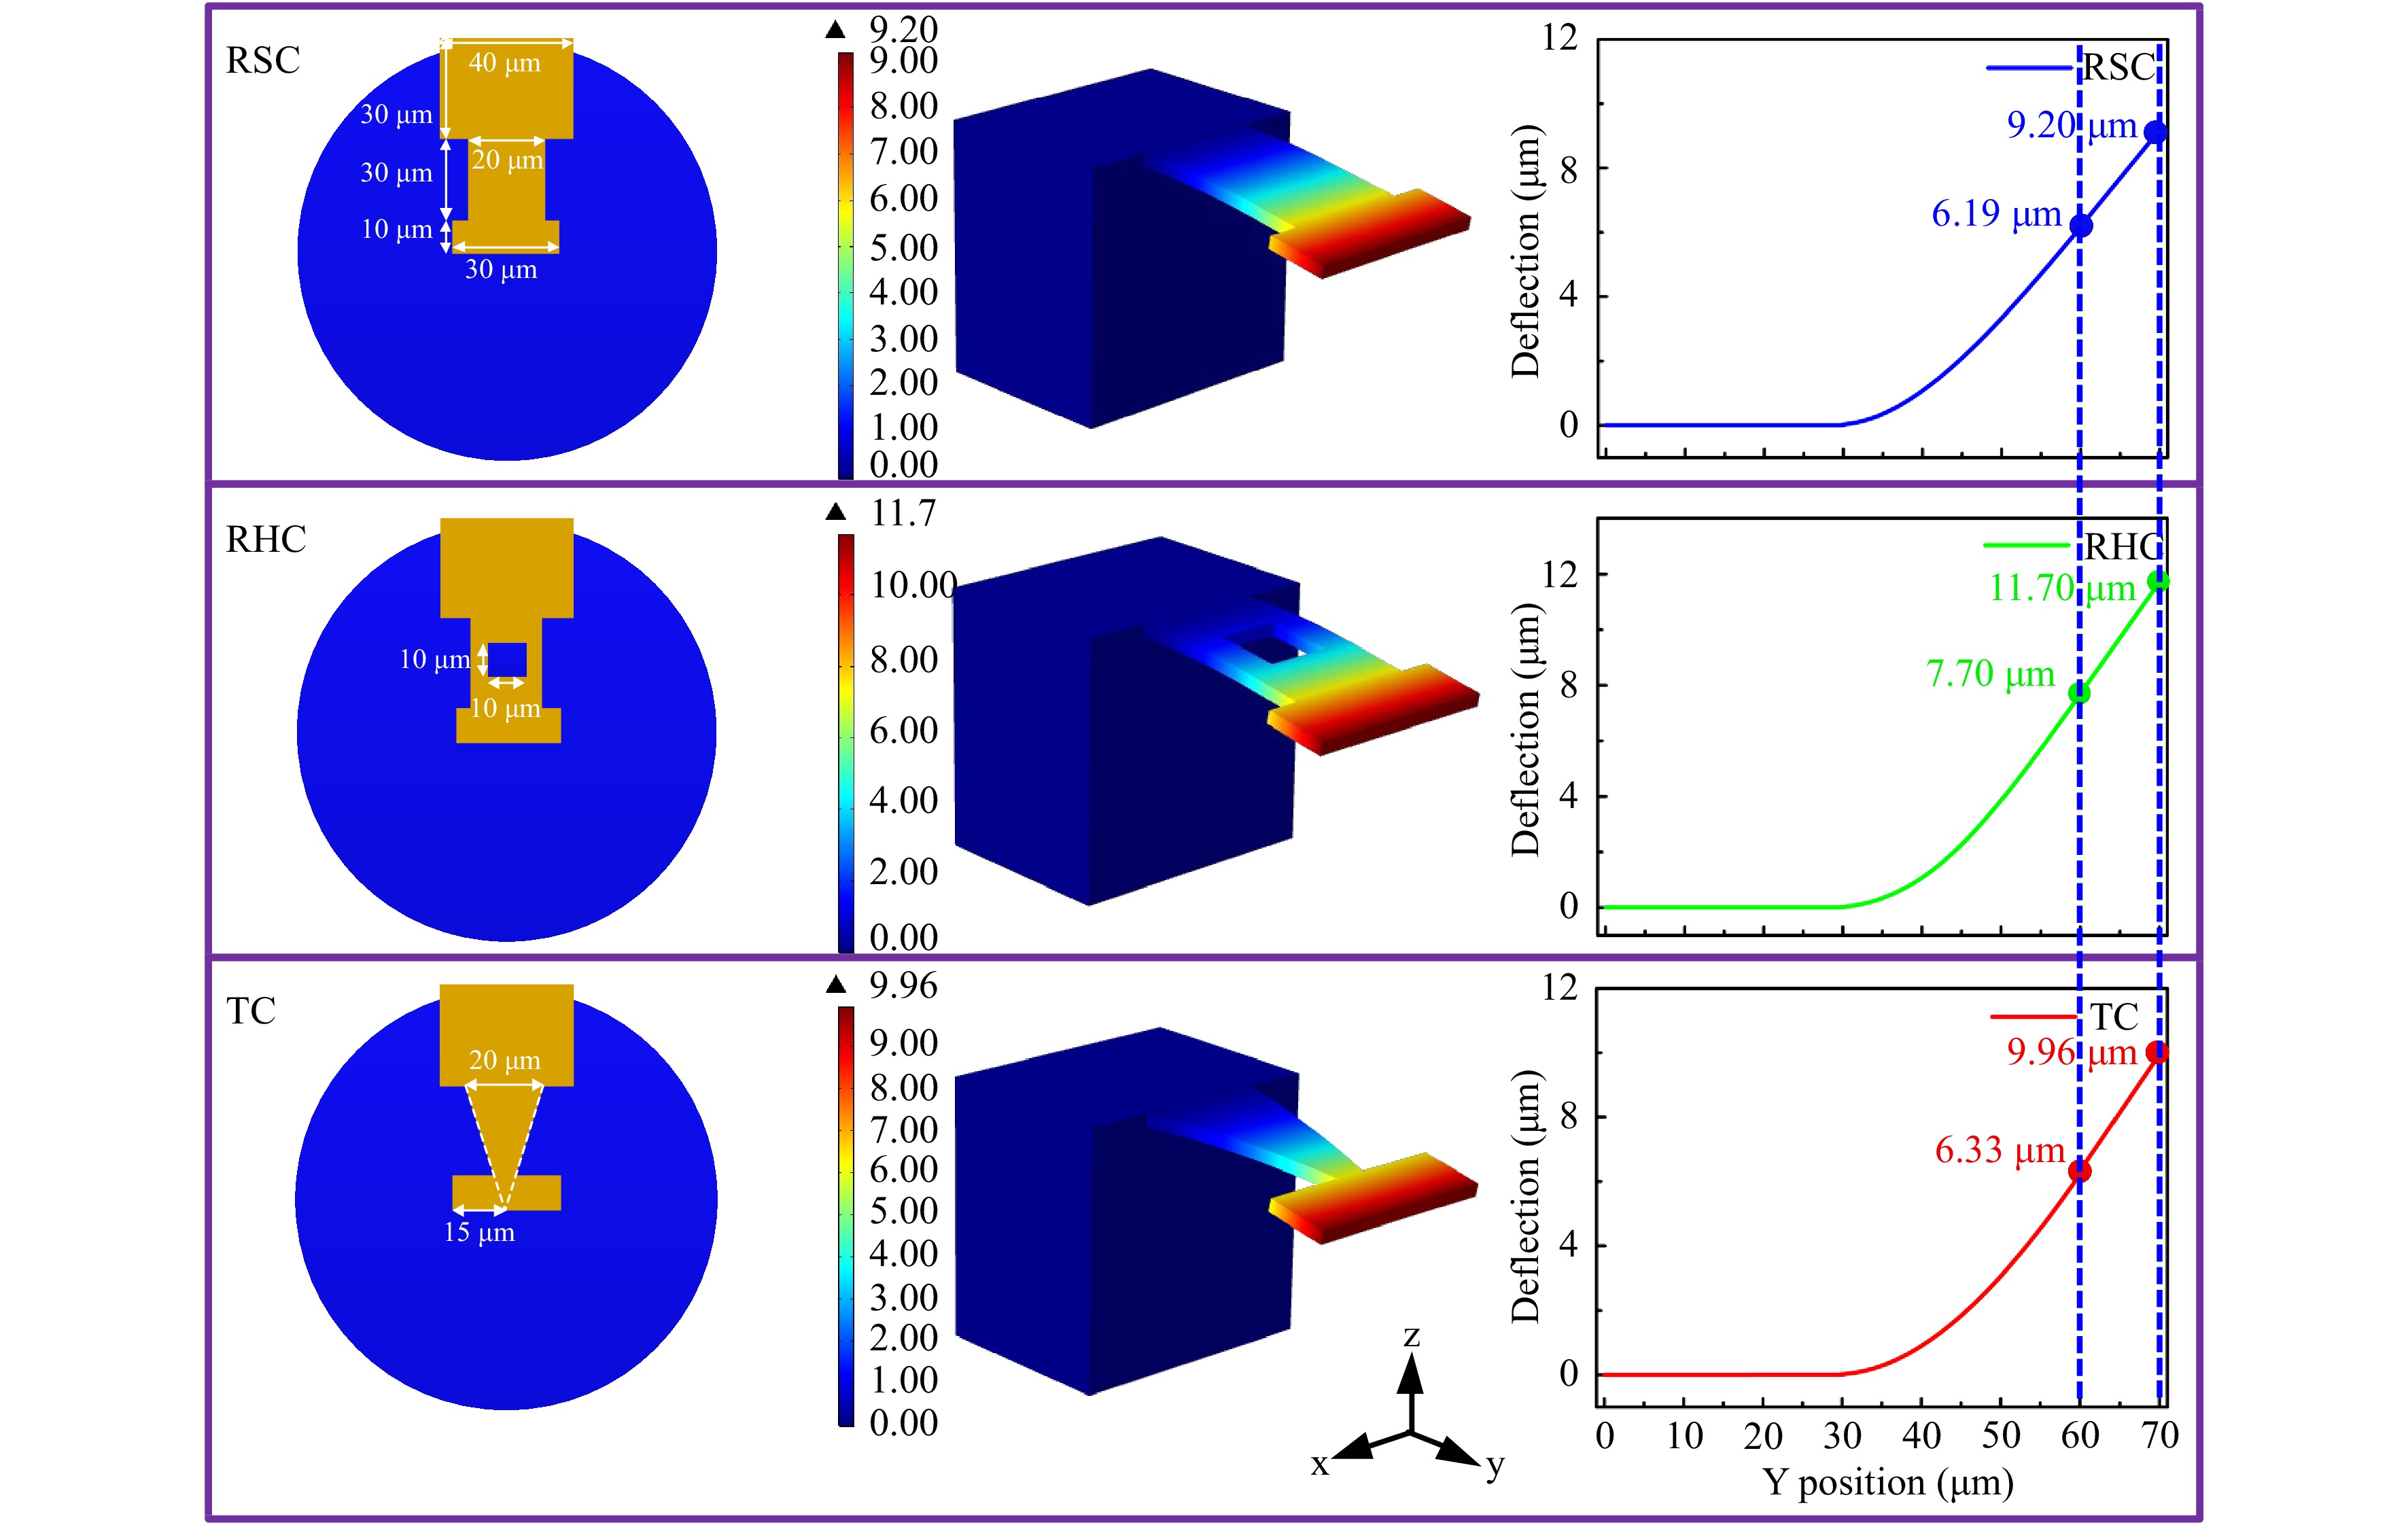
Fig. 2 The details of the shape of three microcantilever probes and finite-element simulations of their deflections under the same stress per unit area.
Given the Young’s modulus of the polymer (see Appendix A for details), finite-element analysis software (COMSOL Multiphysics) was used to simulate the deflections of the three microcantilever shapes under the same stress per unit area. The cantilevers were modeled using a computer-automated design software. In the solid-mechanics simulations, the bottom of the support block was fixed, and the upper surface of the cantilever was subjected to a 5 mN (μm2)-1 downward boundary load stress per unit area. Cantilever deformation was simulated using a steady-state solver with a finite decomposition region divided into a fine mesh. The deformation of each area under stress is shown in the middle of Fig. 2. The deformation increased with distance from the support block. Thus, the deflection of the microcantilever varies with its length, as shown on the right in Fig. 2. The deflections of the various cantilevers with lengths of 30 μm and 40 μm were compared. (The part with a length of 30–40 μm is the main region that reflects light from the optical fiber core). Deflection of the RHC was the largest, approaching 7.7 μm at 30 μm, and 11.7 μm at 40 μm. The deflection of the triangular cantilever (TC) was slightly greater than that of the rectangular solid cantilever (RSC). In addition, the effect of the hole size in RHC on sensor sensitivity was studied (see Supplementary Information). Under the same conditions, the larger the hole in RHC, the greater is the deflection of the microcantilever.
-
The fiber-tip microcantilever probes were fabricated using a vertical printing method via TPP induced by a fs laser (see Appendix A for details). The dimensions and morphologies of the fabricated microcantilevers were characterized using scanning electron microscopy images acquired at different angles, as shown in Fig. 3a. The top view shows that all cantilevers are the same size as designed, with smooth surfaces, and their rectangular ends block the fiber core to excite the interference resonance. The development process was carried out such that there was no residual unpolymerized photoresist in the hollow portion of the RHC, the hypotenuse portion of the TC, and the end face of the fiber. The 45° view shows that the cantilever and the fiber end face are parallel, ensuring high sensitivity and repeatability in the static-stress detection mode. The bottom-up vertical machining method avoids a gap between the base of the microcantilever and the fiber end face, which may be caused by the fiber not being flat when processing from the side. This makes the binding between the base and the fiber end face firmer, and greatly reduces the probability of separation from the fiber end face. The side view of the straight base indicates the high precision and repeatability of the machining platform. Microcantilevers with thicknesses as low as 3 μm were fabricated by adjusting the laser focusing depth to approximately 1 μm.
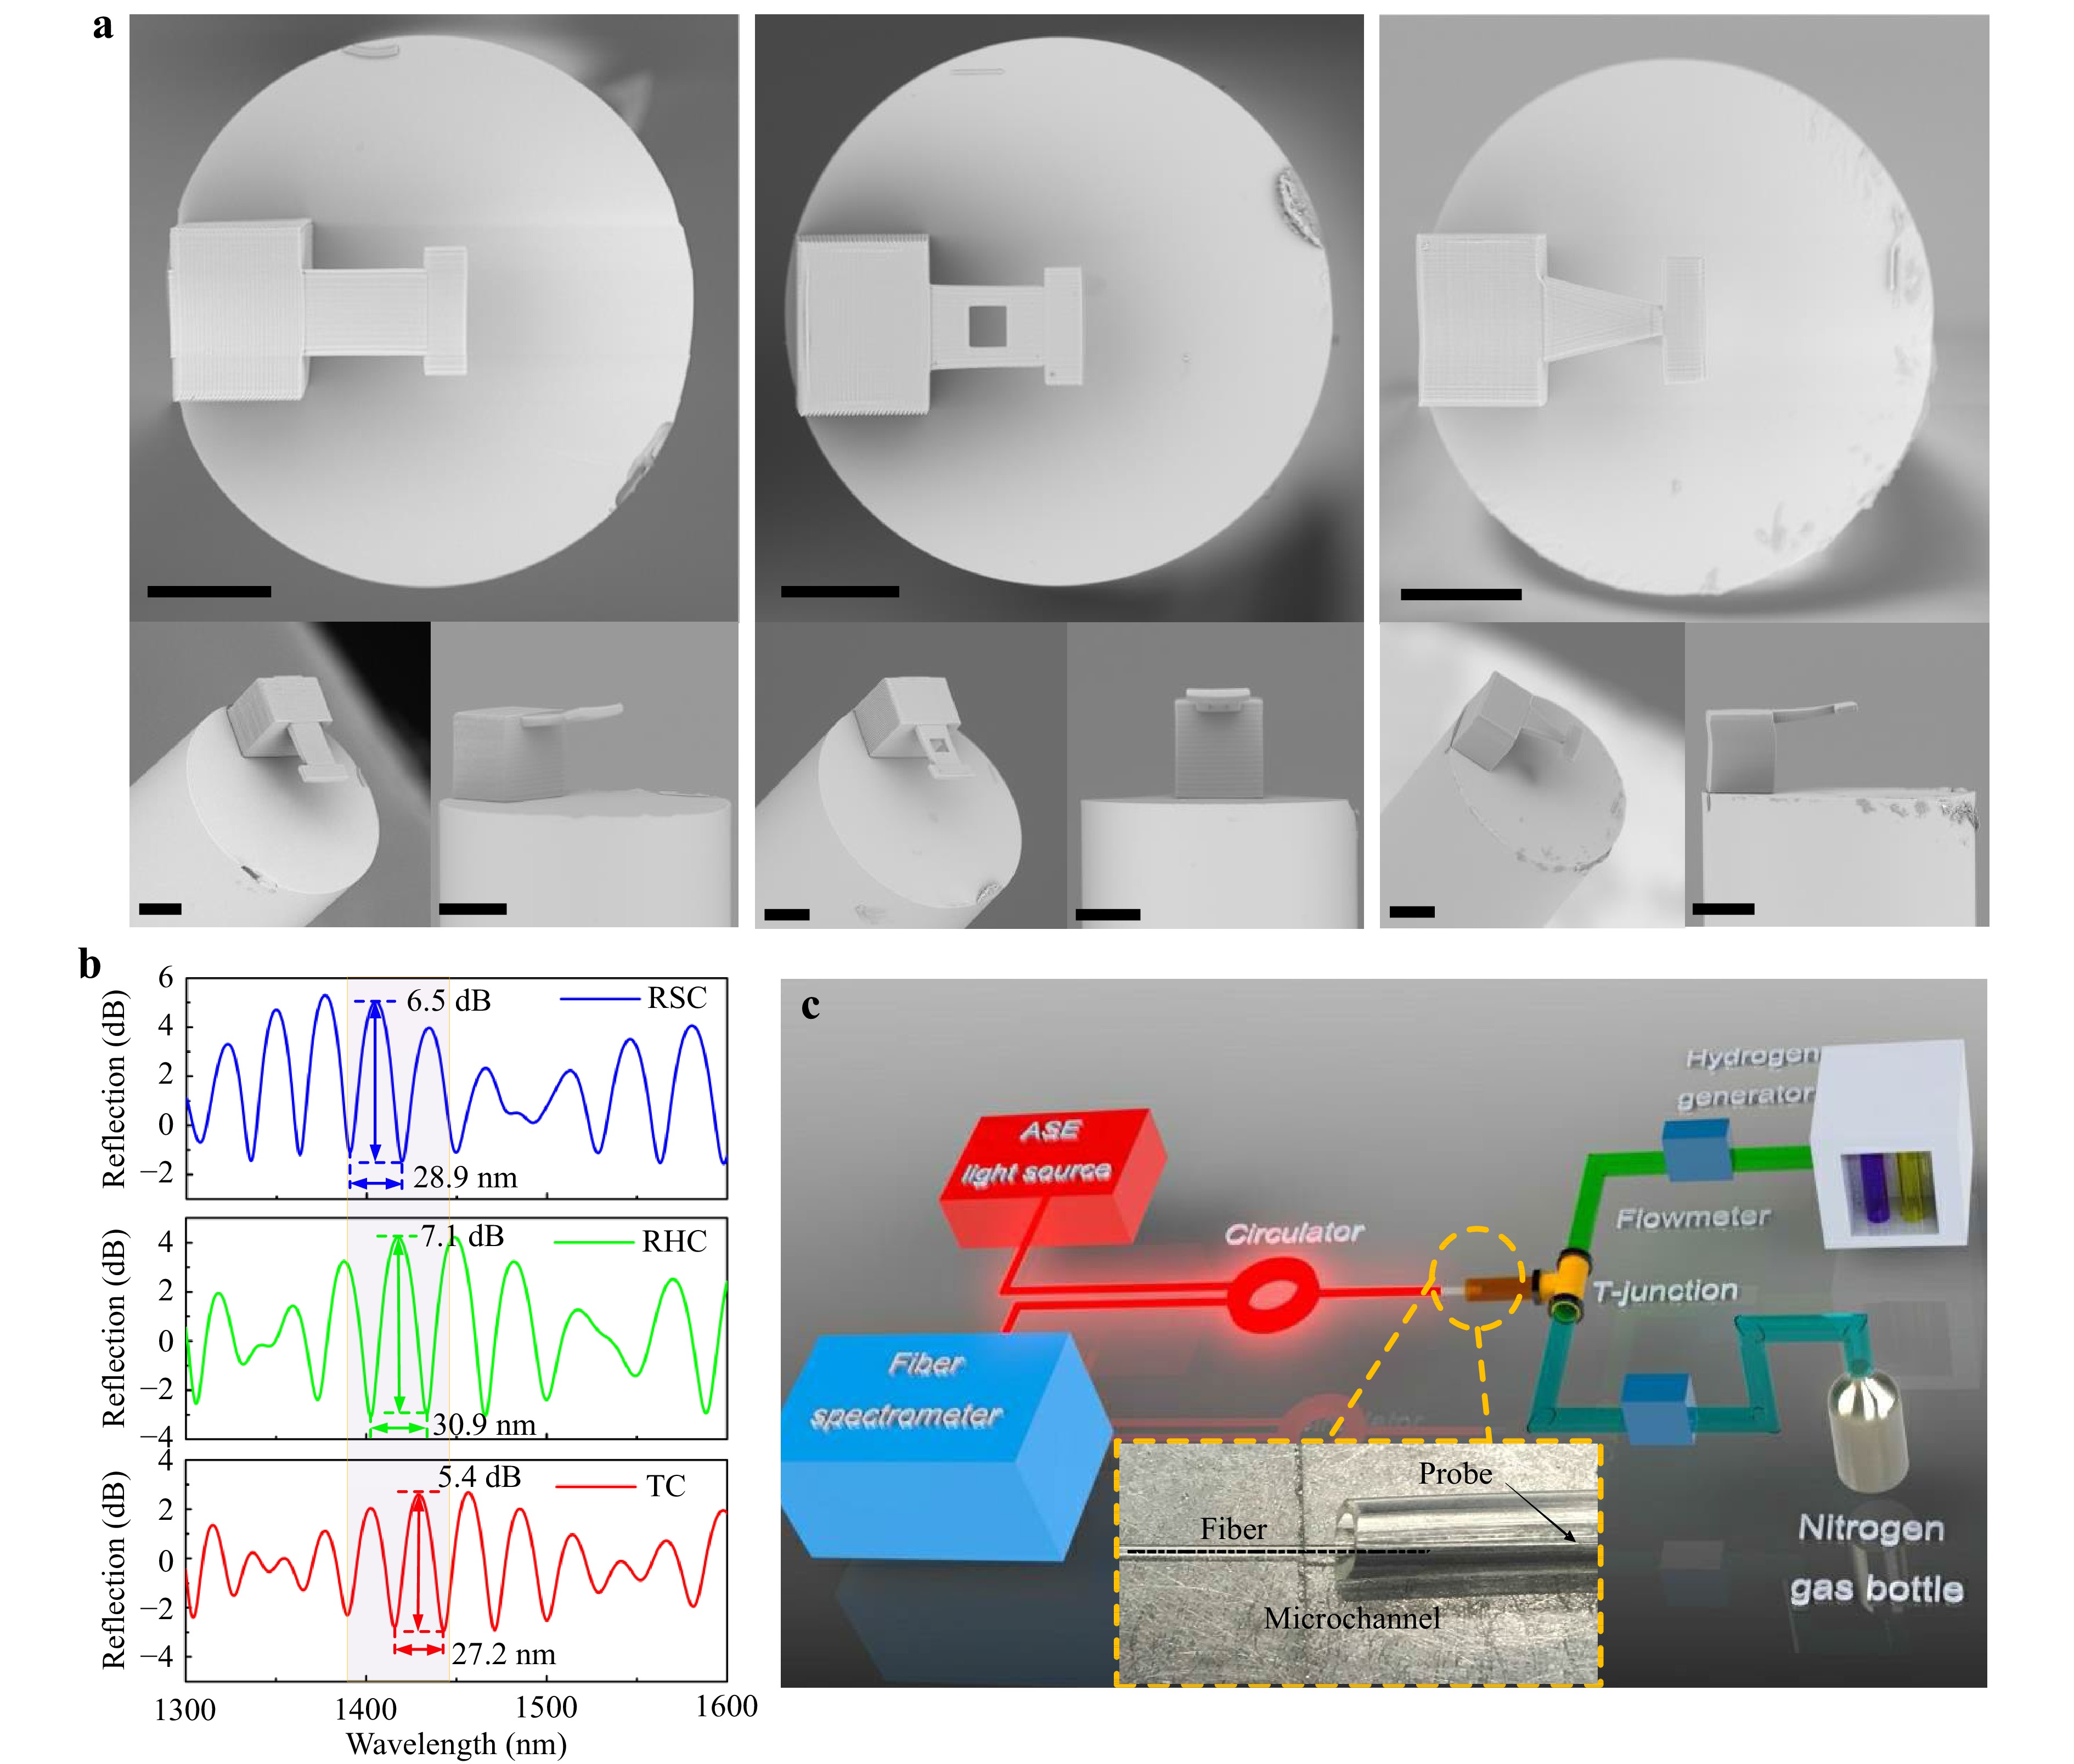
Fig. 3 a Scanning electron microscopy images of three fiber-tip microcantilevers. Scale bar: 30 µm. b Reflection spectra of three fiber-tip microcantilevers. c The experimental setup of hydrogen measurement.
Fig. 3b shows the reflection spectra of the microcantilevers acquired with a fiber circulator connected to an ASE broadband light source and an optical spectrum analyzer. The interference pattern is a three-beam interference resonated by three mirrors of the fiber end face, and the lower and upper surfaces of the microcantilever. The small envelope in the spectrum is excited by the FP cavity of the air medium, which contains information on the cantilever deflection. The free spectral ranges of the three microcantilevers were similar at approximately 1400 nm. Accodrding to the relationship
$FSR = {\lambda ^2}/2nL$ , where λ, n, and L are the wavelength of the interference valley, the refractive index of the medium in the cavity, and the length of the cavity, respectively. The actual fabricated cavity length of 40 μm can be calculated, which is consistent with the design. The slight differences in the cavity length can be attributed to the fact that the first layer of the fabrication is located a few microns below the fiber end face to ensure that there is no gap between the base and the fiber end face. The fringe contrasts in the RSC and RHC reflection spectra are stronger than those of the TC, which is related to the energy of the light reflected by the microcantilever. Because the reflectivity of the fiber end face is constant, and the top part of the RSC and RHC blocking the fiber core is larger than that of TC, light diverging from the fiber core is reflected more and the fringe contrast is higher than that of TC. The hollow section of the RHC improves the sensitivity of the cantilever without losing the fringe contrast of the reflected spectrum. -
The hydrogen response of the Pd-film-coated microcantilevers was tested, as shown in Fig. 3c. A dynamic mixture of hydrogen and nitrogen at a constant flow rate of 500 ml (min)−1 was used to simulate the medical environment. Hydrogen was produced by water electrolysis, and nitrogen was obtained from a gas bottle. They were connected using a T-junction, and two flowmeters (seven stars, D07) were used to control the gas flow and adjust the amount of hydrogen in the mixture. The third port was the output channel for the gas mixture, and had an internal sensor. The shift in the reflection spectrum of a 60-nm-thick Pd-film-coated RHC was measured at 23 °C as the hydrogen concentration increased from 0% to 4% in 0.5% steps, as shown in Fig. 4a. The wavelength shift (Δλ) of the reflection spectrum and the change in cavity length (ΔL) followed the relationship Δλ/λ=ΔL/L, where λ is the traced-dip wavelength and L is the FP cavity length. With increasing hydrogen concentration, the spectrum blue-shifted, indicating that the microcantilever was bent toward the fiber end face, which reduced the cavity length. Fig. 4b shows the sensitivity of the three shapes of the 60-nm-thick Pd-film-coated microcantilevers. The spectral shift of the RHC was the largest at each hydrogen concentration and approached 15 nm at 4% (v/v). The sensitivity of the TC was only slightly improved relative to that of the RSC. This is consistent with the above simulation results that the RHC has maximum deflection under the action of the same stress per unit area. Therefore, in all of the following measurements, only RHC was used although the responses of the other cantilevers were similar.
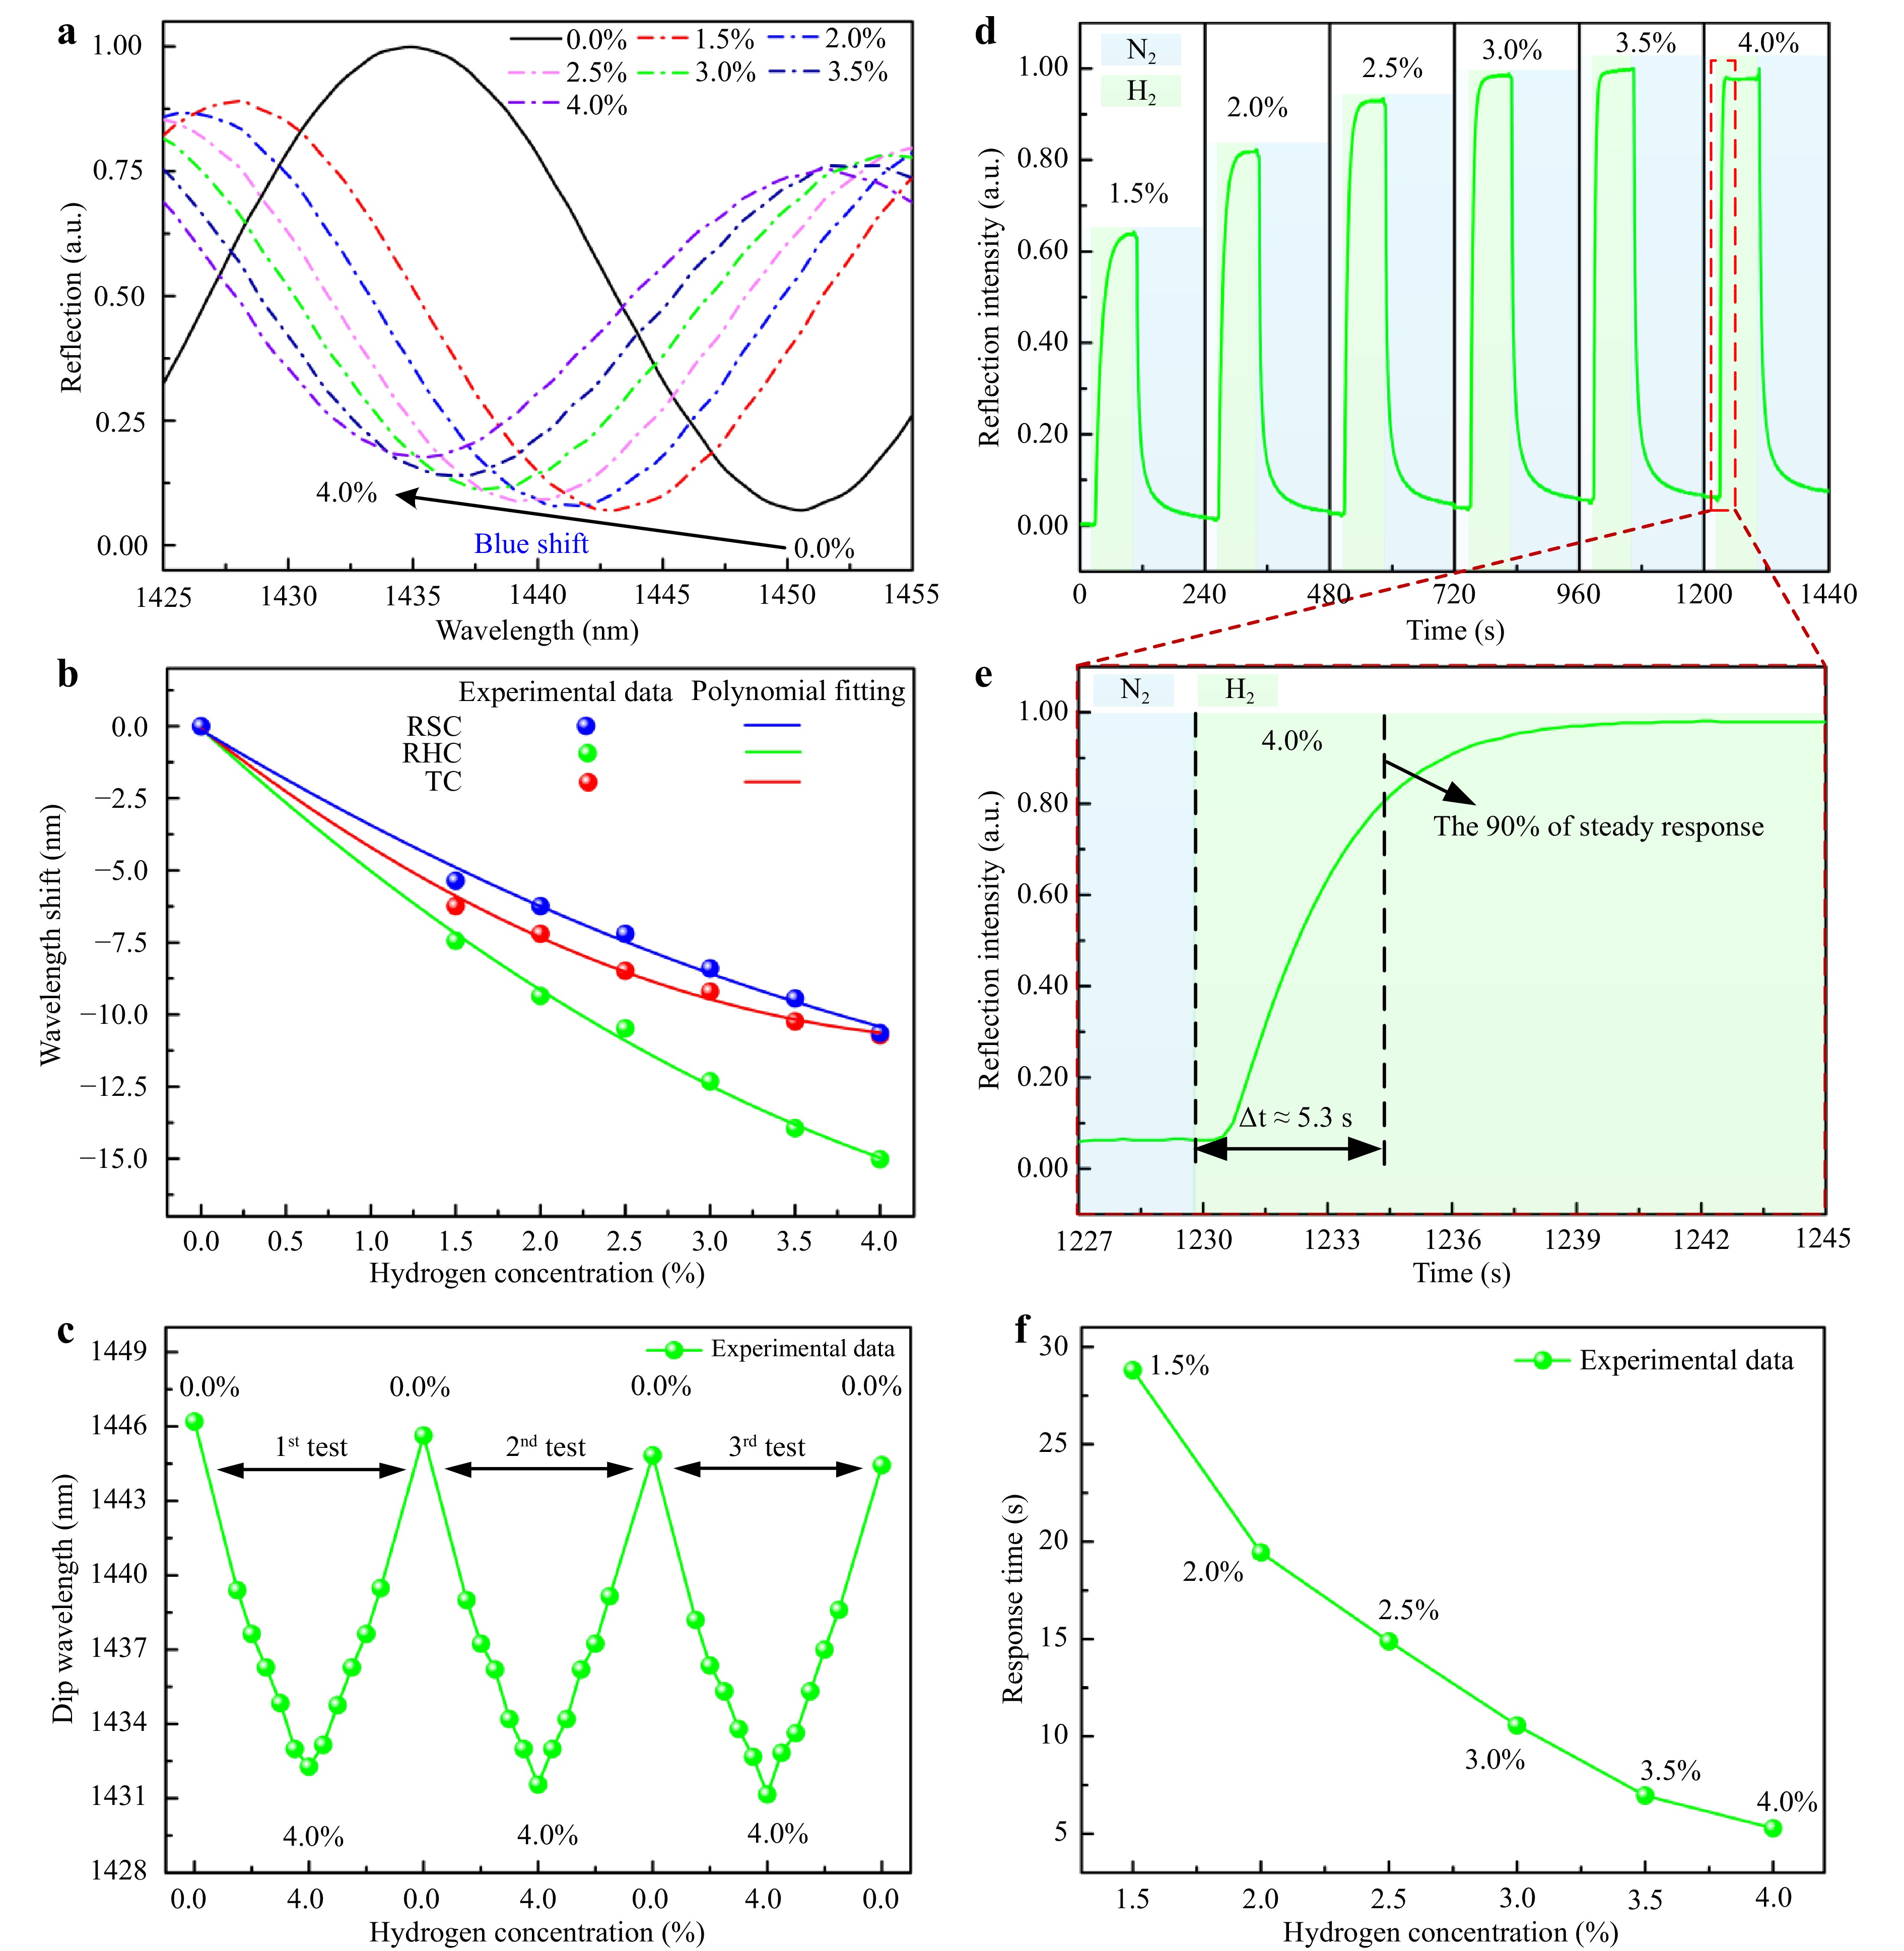
Fig. 4 Hydrogen responses of microcantilevers with 60-nm-thick Pd films. a Reflection spectra of the rectangular hollow microcantilever vs. hydrogen concentration. b Comparison of the sensitivities for the three kinds of microcantilever hydrogen sensors. c Repeatability testing of a sensor. d Intensity changes of the reflected light at an operating wavelength because of alternating hydrogen and nitrogen environments. e Intensity changes of the reflected light from a pure nitrogen environment to a 4% (v/v) hydrogen concentration. f Response time of the sensor vs. hydrogen concentration.
The repeatability was tested with three cycles of hydrogen tests. The shift in the traced-dip wavelength at each hydrogen concentration was relatively stable, regardless of whether the concentration increased or decreased, indicating that the sensor had high repeatability, as shown in Fig. 4c. The mean and standard deviation of the three cycles of hydrogen tests indicated that the hydrogen measurements of the sensor were accurate (see Supplementary Information).
The fast response of the sensor precluded the change of the traced dip wavelength in the process of hydrogen concentration from being recorded in real time. Therefore, the method of measuring the intensity of a single wavelength was used to record the shift of the reflection spectrum during the change in hydrogen concentration in real time. The variation in light intensity at a single wavelength also results from a spectral shift. When the spectrum is shifted, the light intensity at the operating wavelength changes, and this change can be recorded in real time. Because the spectral shift of the sensor was 15 nm at 4% (v/v), approaching half its full width, the operating point was set close to the dip wavelength to avoid experimental errors caused by two identical light intensities in the demodulation. The variation in the light intensity of the sensor over cycles of pure nitrogen and various hydrogen concentrations is shown in Fig. 4d. Once the sensor was exposed to hydrogen, the reflected light intensity changed until the Pd-hydrogen system reached equilibrium, and then returned to its original state when the environment was converted to pure nitrogen. Fig. 4e shows the change in the light intensity of the sensor when the environment changes from pure nitrogen to a 4% (v/v) hydrogen concentration. The time required to reach 90% of the steady-state response at 4% (v/v) hydrogen was calculated to be 5.3 s. As shown in Fig. 4f, the response time decreases with increasing hydrogen concentration. This can be understood in terms of the isothermal Langmuir adsorption of a gas on a solid surface39. At high hydrogen concentrations, the fraction of Pd surface sites occupied by hydrogen atoms increases, which then increases the diffusion rate of hydrogen atoms into the interior of the Pd film. Thus, the time required to reach the Pd-hydrogen equilibrium is reduced.
The Pd film thickness is also a key factor affecting the sensitivity and response time. The performances of the sensors with Pd-film thicknesses of 30 nm and 60 nm are compared in Fig. 5. The sensitivity of the sensor with a 60 nm Pd film is higher, but the response is slower. For a Pd film with constant surface area exposed to a constant hydrogen concentration, the fraction of Pd surface sites occupied by hydrogen atoms is a constant as well as the diffusion rate into the interior of the Pd film. For thicker Pd films, it takes longer for hydrogen in the interior to reach an equilibrium concentration. A thicker Pd film also expands more at equilibrium, resulting in increased stress between the cantilever and the Pd film. This increases the cantilever deflection and sensitivity.
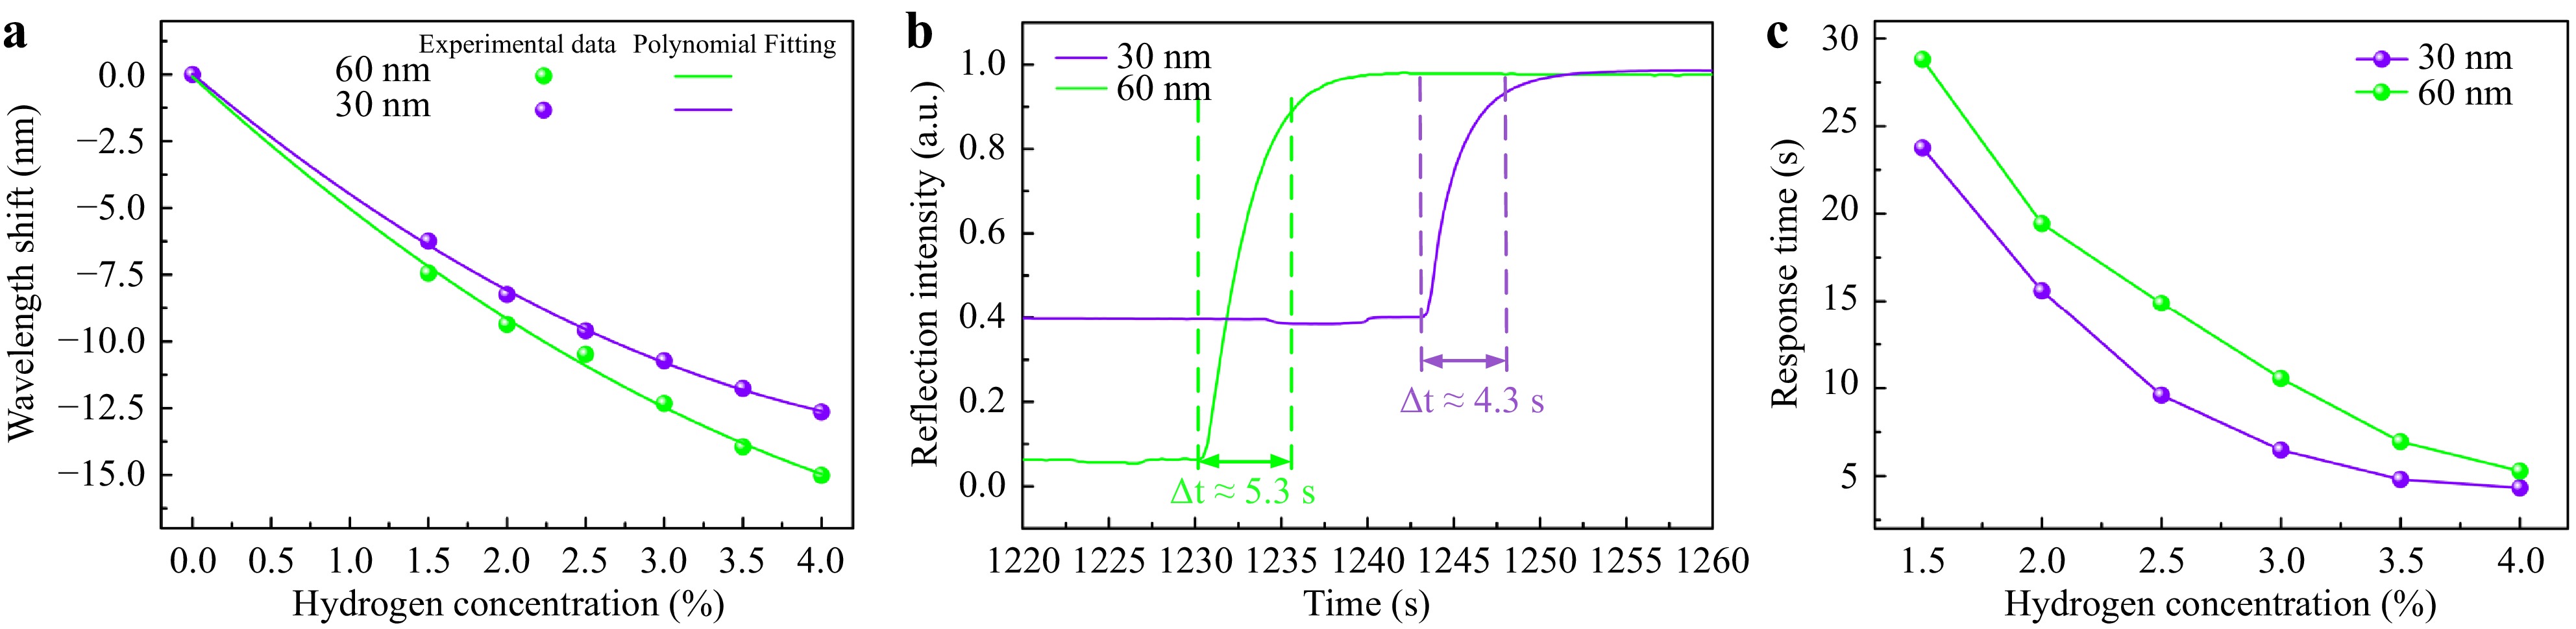
Fig. 5 Hydrogen responses of rectangular hollow microcantilevers with 30-nm-thick and 60-nm-thick Pd films. a Comparison of sensor sensitivity at each hydrogen concentration. b Changes in intensity of the reflected light from pure nitrogen to 4% (v/v) hydrogen concentration. c Comparison of response times of the two sensors for each hydrogen concentration.
In hydrogen respiration therapy, the main gas exhaled by the human body may cause crosstalk with the hydrogen sensor, so the carbon dioxide and oxygen responses of the sensor were also studied to illustrate specificity (see Supplementary Information).
-
In hydrogen respiration therapy, the air exhaled by the human body is rich in water vapor40, which may cause cross interference with hydrogen concentration measurements. The relative humidity (RH) around the sensor, changes locally by approximately 10% with breathing41. The effective operating range of most respiratory monitoring methods, based on humidity sensors, is generally 40%−90% RH42,43. Therefore, to simulate the effect of humidity on the hydrogen sensor used in respiratory therapy, the response of the sensor was examined over the range of 30%−90% RH by using a humidity cabinet with 10% RH steps. Fig. 6a shows the spectral red-shift of the sensor as a function of RH, which can be expressed as:
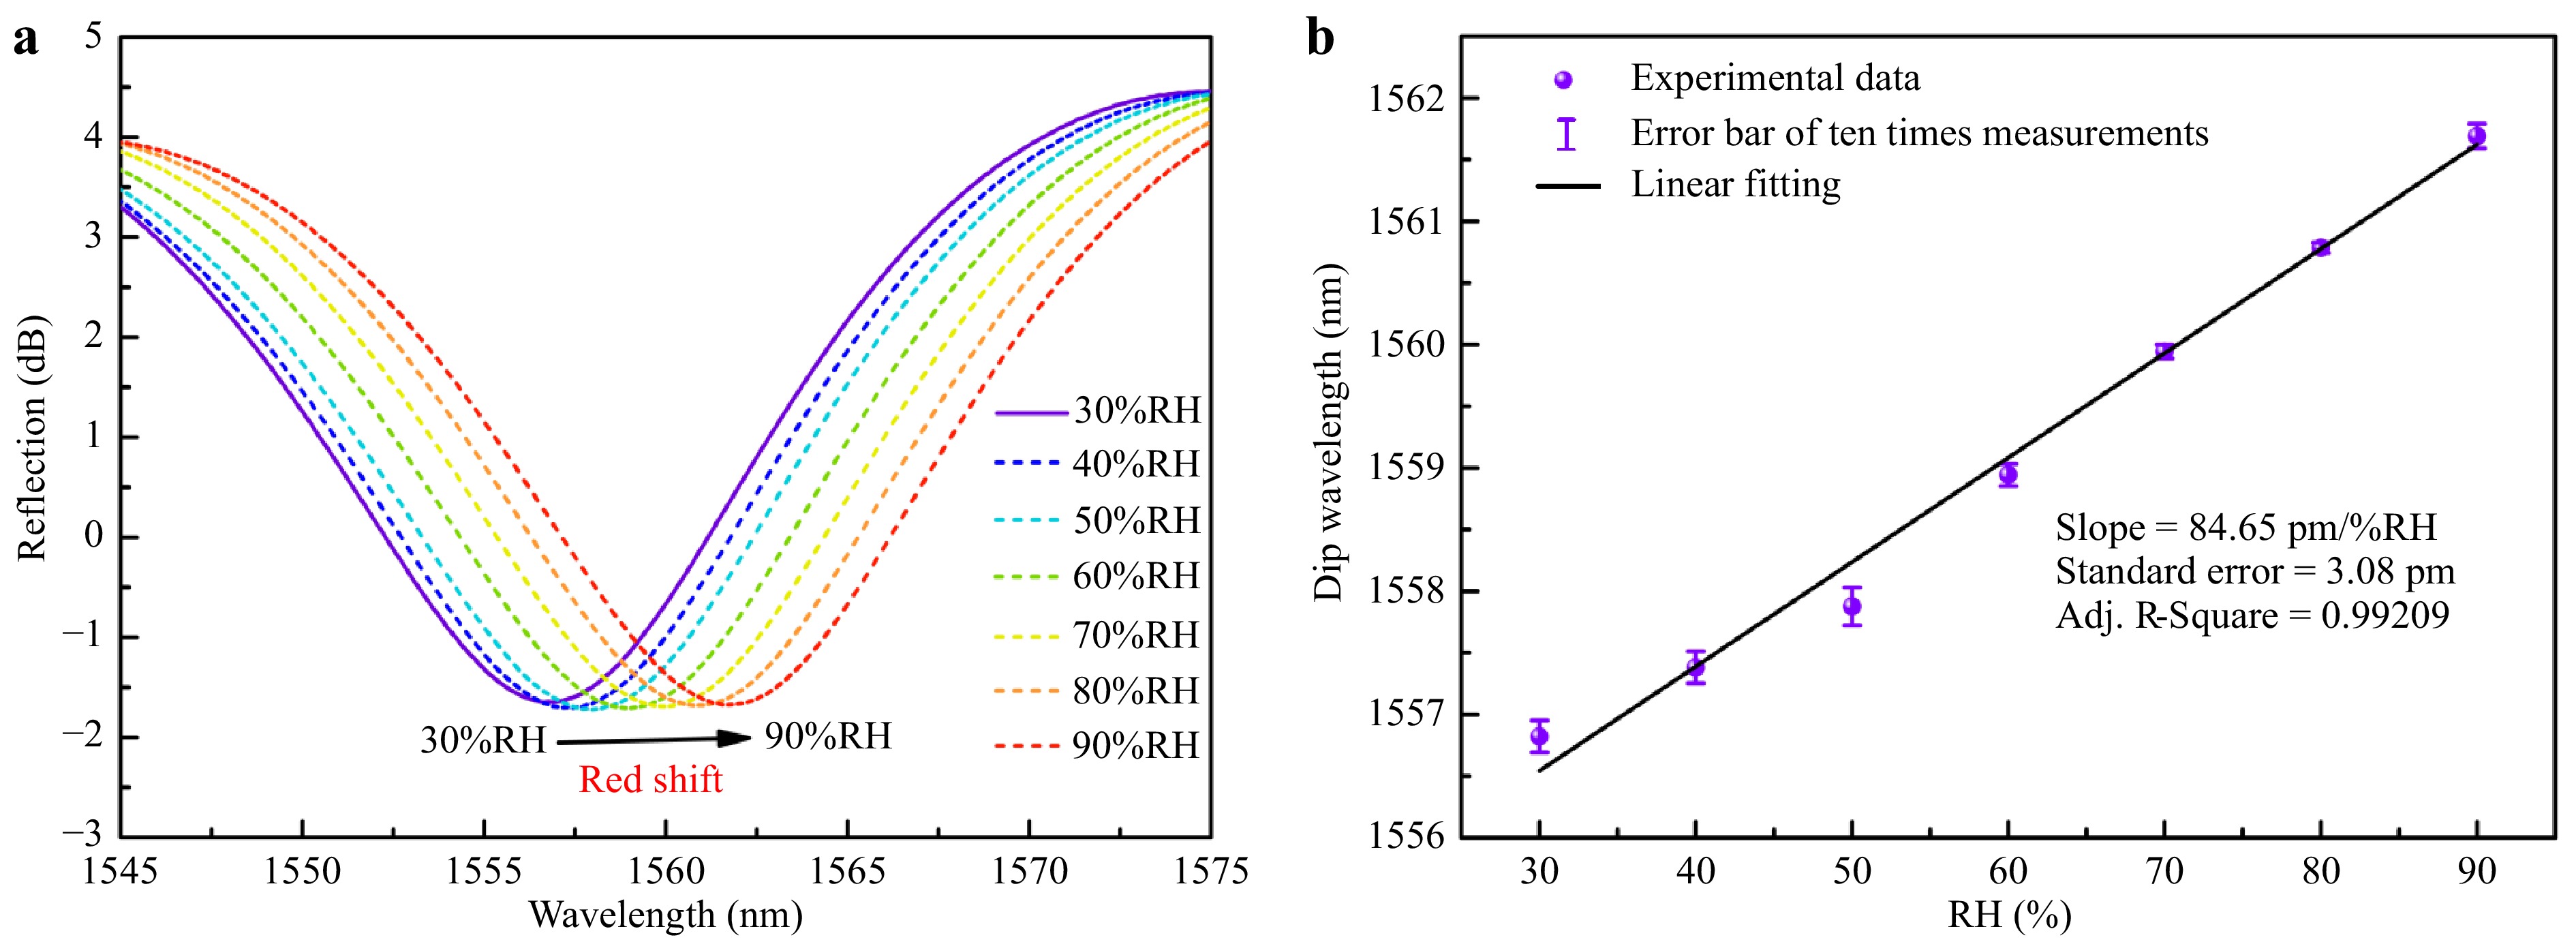
Fig. 6 Humidity response of the sensor. a Reflection spectra of the sensor vs. relative humidity (RH). b Linear fit of the dip wavelength at each RH.
$$ \frac{d\lambda }{d\varphi }=\frac{2}{k}\left(\frac{dn}{d\varphi }L+\frac{dL}{d\varphi }n\right) $$ (1) where λ, k,
${{dn}}/{{d\varphi }}$ ,${{dL}}/{{d\varphi }}$ are the traced-dip wavelength, interference order, and hygroscopic variation of the refractive index of the medium in the cavity, and the hygroscopic expansion coefficient of the polymer, respectively. Because the refractive index variation of air is very low in response to increasing RH, the red-shift of the reflection spectrum can be attributed to the increased cavity length caused by a combination of an expanded polymer support block and cantilever deformation. The linear fit in Fig. 6b of the traced dip wavelength at each RH indicates a low sensitivity of 80 pm (%RH)−1, with a standard error of 3 pm. Ten measurements were conducted at each RH to test the stability of the RH response. The hydrogen sensitivity of the sensor was approximately 3.75 nm (%)−1 in the range of 0%−4% hydrogen concentration, so the humidity cross sensitivity of the hydrogen sensor is calculated to be less than 0.03% for (%RH)−1, which means that a 1% variation of relative humidity corresponds to 0.03% concentration variation of hydrogen. This is important in reducing the effect of moisture in exhaled gas on the performance of the hydrogen sensor during hydrogen inhalation therapy. Similarly, ambient temperature changes can cause crosstalk in the hydrogen measurements. Therefore, the temperature response of this sensor was also studied, and the resolution of the sensor was calculated considering temperature and humidity crosstalk (see Supplementary Information). -
In this study, the coupling of 3D printed microcantilever probes with optical fibers was examined with respect to the performance of hydrogen sensing in static mode. Polymer microcantilevers with rectangular solid, rectangular hollow, and triangular shapes were printed directly on an optical fiber end face via TPP. Each cantilever was coated with a hydrogen-absorbing Pd film to measure the hydrogen concentration in the environment via optical interferometry. A broad spectral shift of 15 nm was observed when the concentration increased to 4% (v/v), with a 5.3 s response time at 4% (v/v). The sensors exhibited low humidity cross sensitivity, which is suitable for the real-time monitoring of hydrogen concentrations in respiratory therapy. In addition, the soft polymer microcantilever probe could be used for any effect that creates a stress difference, such as antigen-antibody binding or cellular drug testing. The microprobe can be rapidly printed on demand to meet specific probe requirements. Finally, the method of using optical fibers, instead of the usual optical or electrical platforms, combined with TPP to print microprobes is suitable not only for AFM systems, but also for updating precision measurements through imaging instruments, such as scanning probes and endoscopes.
-
To analyze the deflection sensitivity of the microcantilevers, the material properties of the polymer were measured using a commercial AFM (Dimension Icon, Bruker). The local elasticity of a thin-film photoresist sample was probed in the force-volume (FV) mechanical imaging mode. In the FV experiment, a force curve is obtained by vertically indenting the AFM tip at every point in a selected area, which yields the local mechanical response at every point. The experiments were performed with a 16 × 16 lateral resolution, and 256 points were acquired for each force curve. All samples were imaged in deionized water at 23°C. A series of two or three FV measurements were performed at different macroscopic positions to improve statistical reliability.
For all measurements, the total vertical ramp length was maintained at L = 5 μm, with a maximum force of F ≈ 1000 nN, and a vertical approach velocity of v = 20 μm (s)−1. The standard sharp indenter (model RTESPA, Bruker) used had an average semi-angle aperture θ = 20° (measured by scanning electron microscopy). The elastic spring constant, k = 33.7 N (m)−1, was calibrated in air using the thermal tune method44. The morphology was reconstructed from the ensemble of the recorded force curves, as shown in Fig. 7a.
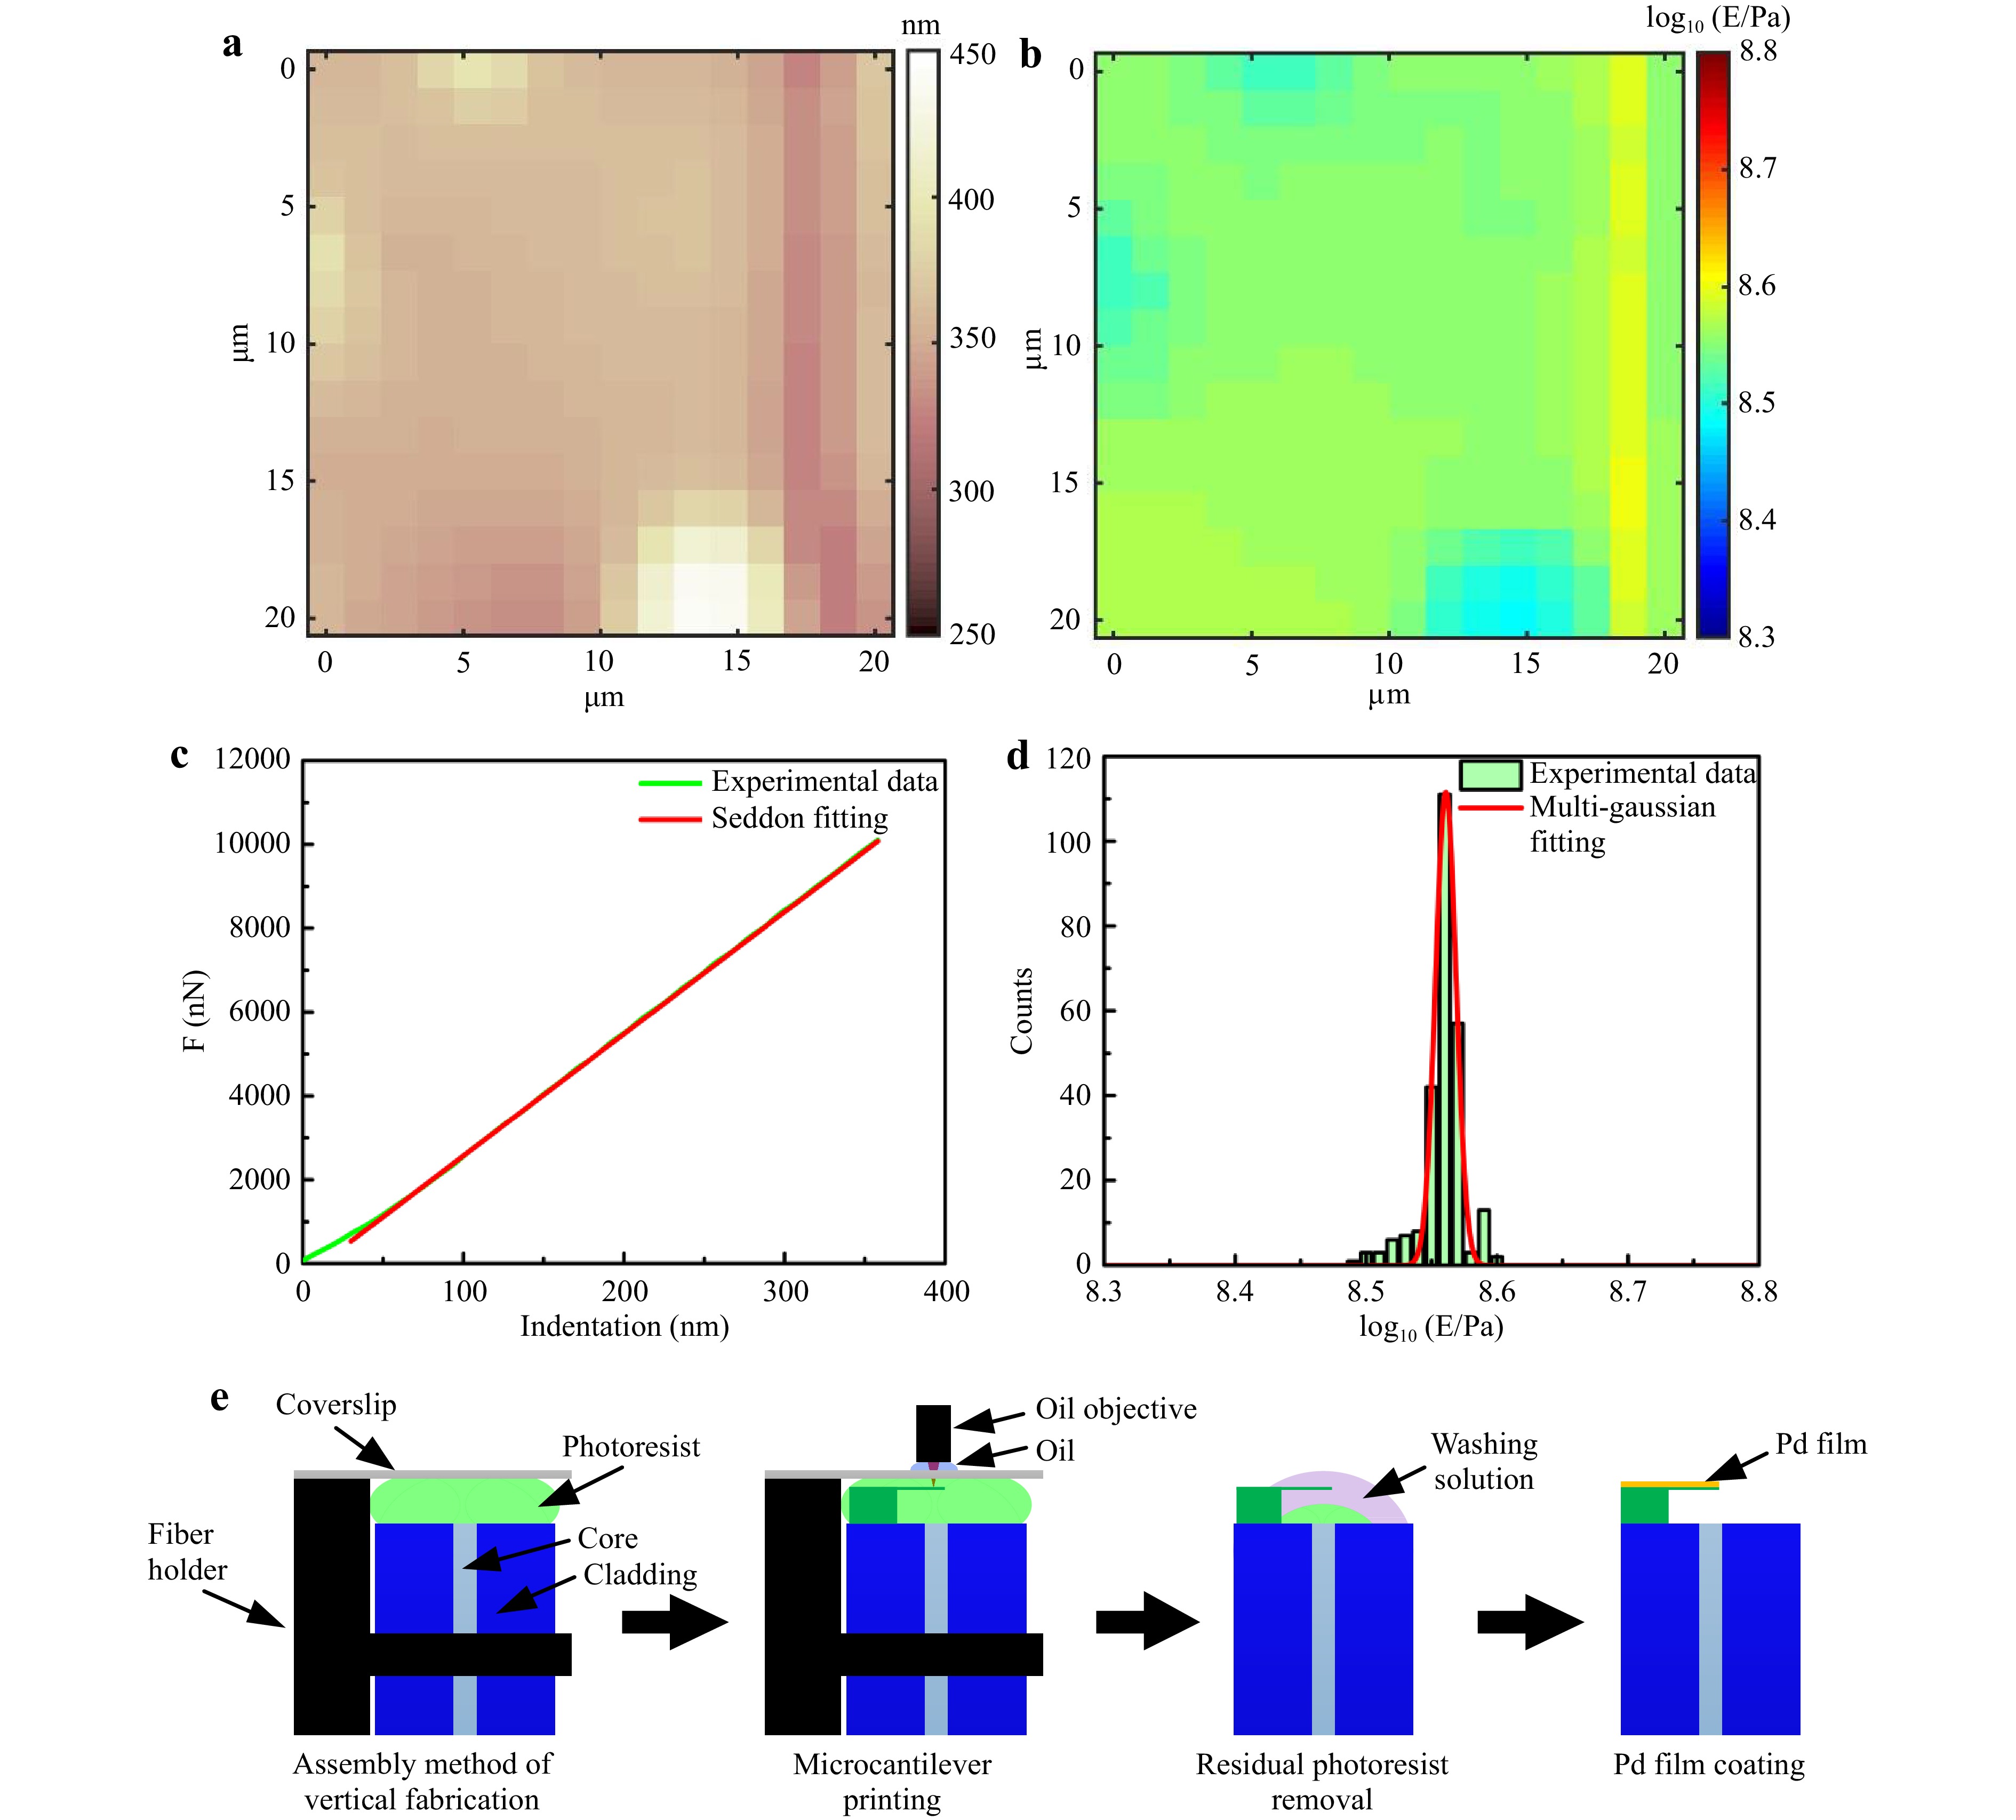
Fig. 7 Young's modulus of a photoresist film measured via atomic force microscopy. a Medium-resolution force volume (FV) (16 × 16) morphology. bYoung’s modulus mechanical map. c Force (nN) vs. indentation (nm) for two samples highlighting raw data and a Sneddon fit. d Quantitative analysis using histograms of Young’s moduli in log-normal scale, fit with a Gaussian distribution. e Flowchart of sensor fabrication.
Young’s moduli were evaluated via data analysis performed in MATLAB (MathWorks) using the routine of Galluzzi et al45. Briefly, for each FV measurement, single force curves were pre-processed to obtain the force (F [nN]) vs. indentation (δ [nm]). After pre-treatment, the indentation curves were fitted using the Sneddon model with the Bilodeau approximation for four-sided pyramids (instead of a conical indenter) for sharp probes46,47:
$$F=0.7453\frac{E \tan \theta }{(1-{v}^{2})}{\delta }^{2} $$ (2) where E, v, and θ are the local Young’s modulus, Poisson ratio (0.5 for uncompressible hydrogels), and the averaged half-opening angle of the four-sided pyramidal indenter, respectively. The logarithmic Young’s moduli values were used to build a mechanical map (Fig. 7b) and a collective histogram for statistical analysis (Fig. 7d). The final measurement results show that Young's modulus of the photoresist film was 363.80 ± 0.29 MPa, and the roughness was 19.90 nm. The error associated with a single FV measurement must consider this calibration error and the variability of Young’s modulus in the FV area (i.e., the width of the normally distributed log values). The final error characteristics depend on the error of a single FV curve, and the error variation is attributed to different macroscopic locations on the same sample.
-
Vertical fabrication was used to fabricate (print) microcantilever probes on an optical fiber end face to avoid deformation of the non-rectangular sample by the laser focal depth when fabricated from the side. The fabrication flowchart is shown in Fig. 7e. A single-mode optical fiber with a 9 μm core diameter and 125 μm diameter cladding was held vertically with a fiber holder. A 170-μm-thick coverslip was inserted between the fiber end face and a 63X oil objective lens (NA = 1.4). Refractive-index-matching oil was applied to the coverslip to soak the objective lens. The gap between the fiber end face and the coverslip was adjusted to several hundred microns and filled with a photoresist. The microcantilever was modeled using a computer-automated design software. The slice direction and scanning path were designed using the control software of the micromachining system. A computer-controlled sample stage (Aerotech) was used to precisely manipulate the position of the laser focus with respect to the processing position. A fs laser (PHAROS, Light Conversion) with a center wavelength of 1026 nm, a pulse width of 250 fs, and a repetition rate of 200 kHz was used to induce TPP of the photoresist (photo-initiator: IGR-369, monomer: SR444 and SR369). The laser focal depth caused the depth of the polymerized voxel in the z-axis to be larger than the widths along the x- and y-axes. Thus, it was necessary to coordinate the processing parameters, such as laser energy, layer spacing, line spacing, and scanning velocity, to achieve balance of efficiency, a good degree of polymerization, and reduced cantilever thickness. After polymerization, the sample was immersed in an acetone and isopropyl alcohol mixture (volume ratio = 1:4) for 20 s to wash away the residual photoresist. The washing time was short because only the fiber with a small amount of photoresist was immersed. In addition, the surface tension between the glass slide and the fiber end face was avoided. This is caused by the evaporation of the photoresist-washing solution, which may damage the sample. Finally, the upper surface of the microcantilever was coated with a Pd film using an optical fiber rotating magnetron sputtering coating instrument (55 mA, 433 V, 23 W). The coating speed of the instrument was calibrated to be 6 nm (min)−1. The coating was applied for 5 min and 10 min to obtain microcantilevers with 30-nm-thick and 60-nm-thick Pd films, respectively. The robustness, repeatability, and reproducibility of the device were tested to verify the reliability of this manufacturing method (see Supplementary Information).
-
This study was supported by the National Natural Science Foundation of China (NSFC) (62122057, 62075136), the Natural Science Foundation of Guangdong Province (2018B030306003, 2020A0505100066), and the Science and Technology Innovation Commission of Shenzhen (JCYJ20200109114001806, RCYX20200714114524139, JCYJ20180507184503128).
Design and realization of 3D printed fiber-tip microcantilever probes applied to hydrogen sensing
-
Changrui Liao1, 2,
 ,
, - Cong Xiong1, 2,
- Jinlai Zhao3,
- Mengqiang Zou1, 2,
- Yuanyuan Zhao1, 2,
- Bozhe Li1, 2,
- Peng Ji1, 2,
- Zhihao Cai1, 2,
- Zongsong Gan4, 5,
- Ying Wang1, 2,
-
Yiping Wang1, 2, *, ,
- Light: Advanced Manufacturing 3, Article number: (2022)
- Received: 14 July 2021
- Revised: 15 January 2022
- Accepted: 18 January 2022 Published online: 24 February 2022
doi: https://doi.org/10.37188/lam.2022.005
Abstract: Cantilevers in microelectromechanical systems have the advantages of non-labeling, real-time detection, positioning, and specificity. Rectangular solid, rectangular hollow, and triangular microcantilevers were fabricated on an optical fiber tip via two-photon polymerization. The mechanical properties were characterized using finite element simulations. Coating the microcantilever with a palladium film enabled high sensitivity and rapid hydrogen detection. The shape of the cantilever determines the sensitivity, whereas the thickness of the palladium film determines the response time. Additional microelectromechanical systems can be realized via polymerization combined with optical fibers.
Research Summary
Optical-MEMS: 3D printed fiber-tip microcantilever probes
Microcantilevers have the advantages of non-labeling, real-time characterization, positioning, and specific detection, which is an excellent method for ultra-trace measurements. In particular, the microcantilever beam probe based on optical fiber can simplify the system of microcantilever sensor, and has the merits of high signal-to-noise ratio, and portability. Yi-Ping Wang from China’s Shenzhen University and colleagues now report a class of polymer microcantilever beam probes that can be freely designed and printed in one-step molding on the end of optical fiber. The microcantilever beam utilizes the low stiffness and supreme resilience of the polymer, which enables it to deform under small stress differences. The exceptional recoverability greatly improves its resolution and range. After modifying the probe with palladium, the team demonstrated the highly sensitive and fast-responding hydrogen sensing applications of this new microcantilever probe.


Rights and permissions
Open Access This article is licensed under a Creative Commons Attribution 4.0 International License, which permits use, sharing, adaptation, distribution and reproduction in any medium or format, as long as you give appropriate credit to the original author(s) and the source, provide a link to the Creative Commons license, and indicate if changes were made. The images or other third party material in this article are included in the article′s Creative Commons license, unless indicated otherwise in a credit line to the material. If material is not included in the article′s Creative Commons license and your intended use is not permitted by statutory regulation or exceeds the permitted use, you will need to obtain permission directly from the copyright holder. To view a copy of this license, visit http://creativecommons.org/licenses/by/4.0/.

 DownLoad: